Godson Gatsha, PhD. Education Specialist, Higher Education HIGHER EDUCATION 2015-2018.

Equality in higher education: statistical report 2014
Part 2: students
10.8% BME graduates unemployed six months after qualifying
5.2% white graduates unemployed six months after qualifying
1

Written and produced by Equality Challenge Unit (ECU). Data provided by the Higher Education Statistics Agency (HESA).
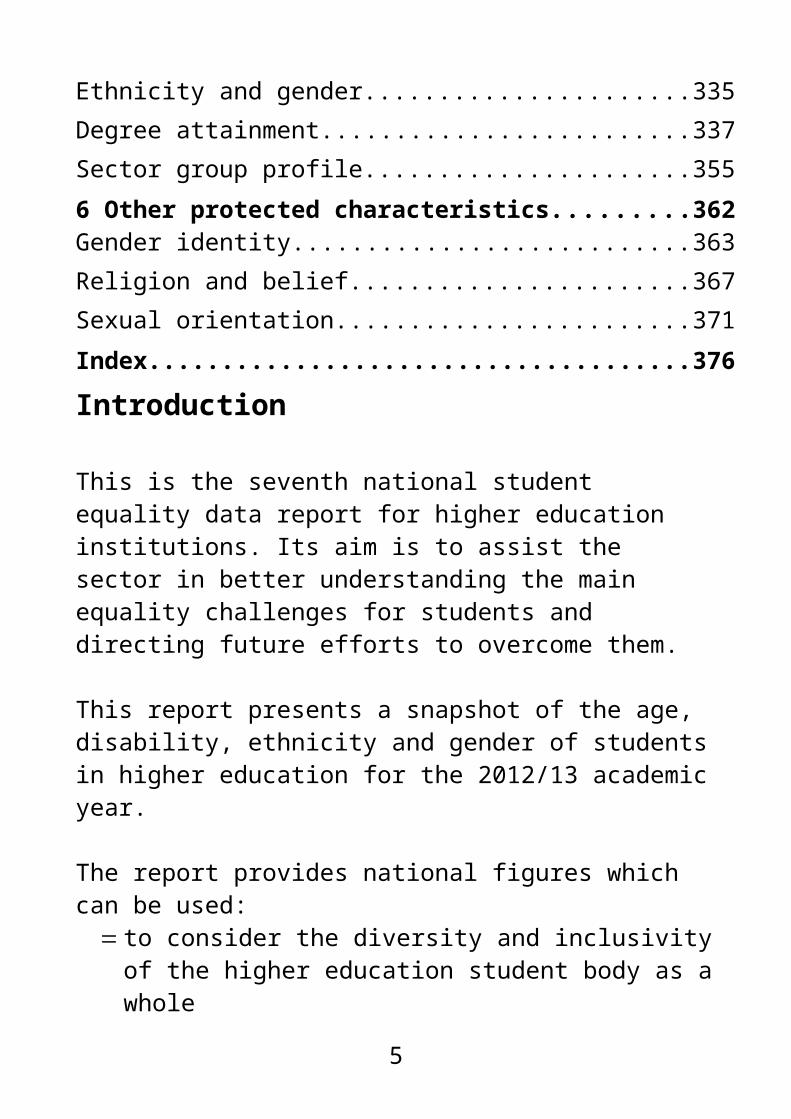
The statistic on the cover shows the percentage of black and minority ethnic (BME) graduates who are unemployed six months after qualifying (10.8%) compared with white graduates (5.2%).
This information is based on data from the Destination of leavers from higher education (DLHE) survey, which collects information on the activities of leavers from higher education programmes (Click here for more information).
Further informationStephanie Neave - [email protected]
2

Equality in higher education: statistical report 2014
Part 2: students
Contents
Introduction............................................................................5About the data........................................................................9Equality areas........................................................................10Mode and level......................................................................16Subjects.................................................................................17Continuation...........................................................................18Degree attainment.................................................................19Destination of leavers............................................................20Overview...............................................................................221 Age.....................................................................................43Age overview.........................................................................44Mode and level......................................................................51Subjects.................................................................................61Continuation...........................................................................96Degree attainment.................................................................97Destination of leavers..........................................................1112 Disability..........................................................................114Disability overview...............................................................115Mode and level....................................................................130Subjects...............................................................................144Continuation.........................................................................171Degree attainment...............................................................172
3

Destination of leavers..........................................................1853 Ethnicity...........................................................................191Ethnicity overview................................................................192Mode and level....................................................................203Subjects...............................................................................216Continuation.........................................................................244Degree attainment...............................................................246Destination of leavers..........................................................2694 Gender.............................................................................275Gender overview..................................................................276Mode and level....................................................................282Subjects...............................................................................285Continuation.........................................................................304Degree attainment...............................................................305Destination of leavers..........................................................3145 Multiple identities...........................................................316Age and disability.................................................................317Age and ethnicity.................................................................321Age and gender...................................................................324Disability and ethnicity.........................................................325Disability and gender...........................................................332Ethnicity and gender............................................................335Degree attainment...............................................................337Sector group profile.............................................................3556 Other protected characteristics....................................362Gender identity....................................................................363Religion and belief...............................................................367Sexual orientation................................................................371Index...................................................................................376
4
Introduction
This is the seventh national student equality data report for higher education institutions. Its aim is to assist the sector in better understanding the main equality challenges for students and directing future efforts to overcome them.
This report presents a snapshot of the age, disability, ethnicity and gender of students in higher education for the 2012/13 academic year.
The report provides national figures which can be used: to consider the diversity and inclusivity of the higher
education student body as a whole to consider change and progress over time, using
previous reports as comparators by individual institutions for benchmarking purposes
How to use this report
Data and analysis is provided on age, disability, ethnicity and gender, as well as on the interplay of these identities (for example, female black students and male disabled students). Each section is colour-coded for easier identification, and highlights key information alongside illustrative tables and charts.
A list of definitions and notes about the data precede the body of this report to clarify some of the terms used and how the data has been presented.
What’s newWhile this report builds upon the coverage of our previous reports, some aspects have been refined. For example, all
5

data tables are now accompanied with explanatory text to assist the user.
In addition, for the first time, our report presents high-level findings on institutional collection and return rates of student gender identity, religion and belief and sexual orientation data.
Year-on-year comparisonsThis report provides selected comparisons between 2011/12 and 2012/13 data to facilitate identification of year-on-year changes. To see complete data from 2011/12, please see ECU’s previous statistical report on students in higher education.www.ecu.ac.uk/publications/equality-in-higher-educationstatistical-report-2013
Online data tablesTo help users access and analyse our data, all data tables presented in this report are also available for download in Excel format. Where appropriate, these tables provide additional detail to those in this report, such as total counts and percentages. www.ecu.ac.uk/publications/equality-in-higher-educationstatistical-report-2014
HeidiExtra higher education data can be accessed via ‘heidi’, a web based management information service for higher education institutions and approved stakeholder organisations run by the Higher Education Statistics Agency (HESA). The database provides easy access to a wide range of national quantitative data about higher education, and functionality for analysis, presentation and comparison of the data with other institutions.
6
The heidi system further allows users to manipulate the data to compare their performance with that of particular groups of institutions, for example within sector groups, national or regional areas. For further information on heidi, including training materials, see www.heidi.ac.uk.
Additional resourcesIt is important to note that the monitoring information that institutions supply to HESA is not the only source of equality information within an institution. For example, institutions will also collect information via student surveys, involvement activities and academic feedback exercises.
Using the national figures within this report alongside institutional figures and information gathered from these other sources will give institutions a fuller picture of equality in their institution, allowing them to set evidence-based equality outcomes and objectives.
A number of ECU’s publications explore the collection of additional information in further detail:
ECU (2011) Effective equality surveys.www.ecu.ac.uk/publications/effective-equality-surveys
ECU (2011) Religion and belief in higher education: researching the experiences of staff and students. www.ecu.ac.uk/publications/ religion-and-belief-staff- and-students-in-he
ECU (2010) Advancing LGB equality: improving the experience of lesbian, gay and bisexual staff and students in higher education.www.ecu.ac.uk/publications/advancing-lgb-equality
ECU (2010) Student pregnancy and maternity: implications for higher education institutions. www.ecu.ac.uk/publications/student-pregnancy-and-maternity
7
ECU (2010) Trans staff and students in higher education: revised 2010. www.ecu.ac.uk/publications/trans-staff-and-students-inhe-revised
For guidance on using data and evidence visit www.ecu.ac.uk/guidance-resources/using-data-and-evidence.
8

About the data
The analysis in this report is based upon data drawn from the HESA student record 2003/04 to 2012/13.
Due to changes HESA implemented in 2012/13, some information is not comparable to previous reports.
This record covers all students across the whole of the UK higher education sector, including part-time and full-time students. The analysis presented here is based on a small selection of the large amount of data available from HESA.
All counts of students have been rounded to the nearest five in accordance with HESA policy in order to protect the confidentiality of individuals. As totals have also been rounded based on unrounded values, some may be greater or less than the individual count numbers presented in the report.
Percentages are based on those students for whom the data in question are known. Throughout the data, .. represents a percentage calculated on a population of between 0 and 52 inclusive. These percentages have been suppressed to protect against over interpretation of small numbers.
Location of institutionThe allocation of an institution to a geographical region relates only to the administrative centre of that institution. There may be students registered at institutions who are studying in regions other than that of the administrative centre of the institution.
9

Although the Open University teaches throughout the UK, its administrative centre is located in South-East England, and is counted as a wholly English institution.
DomicileProvides the location of the student’s permanent or home address prior to entry into higher education. UK-domiciled includes students whose residence was the UK, including the Channel Islands and the Isle of Man. EU-domiciled includes students whose residence was in the countries which were European Union members at 1 December 2011, excluding the UK. Non-EU-domiciled includes students whose residence was outside of the EU.
First year studentData on first year students includes those students who commenced their programme within the reporting period and is based on the HESA standard registration population. In some cases the student’s first year of study may be the second or subsequent year of a programme.
Where possible, data on first year students is presented to provide an equality profile of the cohort entering higher education, and allow for comparison between this group and the wider student population.
Equality areas
AgeStudent age is calculated at the commencement date of their studies. Qualifiers’ age is calculated at 31 July 2013. In 2012/13, the proportion of students whose age on entry was unknown was relatively small (less than 0.1%). These students have been excluded from the analysis.
10

This report uses the following age groups: 21 and under 22 to 25 26 to 35 36 and over
BMEBlack and minority ethnic.
This definition is widely recognised and used to identify patterns of marginalisation and segregation caused by an individual’s ethnicity. ECU recognises the limitations of this definition, particularly the assumption that minority ethnic students are a homogenous group. Where possible, this report presents data disaggregated by more detailed ethnic groups in addition to data consolidating BME students as a group.
DisabilityThe disability categories indicate the type of impairment that a student has on the basis of their own self-assessment. They can choose not to disclose this information.
It should be noted that from 2010/11, new entrants can no longer be returned to HESA coded as information refused, information not sought or not known. These codes may only be used for continuing students.
As a result, this report uses the term ‘disabled students’ to refer to students who are indicated as disabled on their HESA student record. ‘Non-disabled students’ is used to refer to students who are not indicated as disabled, or whose disability status is unknown by their institution.
11

Prior to our 2012 report, ‘non-disabled students’ did not include students whose disability status was unknown by their institution. This group therefore constituted a smaller proportion of the student population and, conversely, ‘disabled students’ a larger proportion. The percentage of disabled students may therefore represent a slight undercount compared with how they were reported prior to our 2012 report.
Further, HESA adopted a version of the coding frame introduced by the Disability Rights Commission for 2011/12 entrants and onwards.
When providing data on students of all years, HESA has created a derived grouping of the old and new coding frames. For example, the group ‘long-standing illness or health condition’ includes ‘an unseen disability, eg diabetes, epilepsy, asthma’ from the old frame and ‘long-standing illness or health condition such as cancer, HIV, diabetes, chronic heart disease, or epilepsy’ in the new frame.
Please note that the field ‘personal care support’ does not have a comparable code in the new coding frame, and numbers in this group will gradually decrease over time as students in this group leave their institution.
For more information about the student disability coding frames, please visit www.hesa.ac.uk/C12051/a/DISABLE.
Disabled students’ allowance This identifies whether a student is in receipt of disabled students’ allowance (DSA) or not.
12

Ethnicity Ethnicity within the HESA student record is based upon the 2001 census classification system. For the purposes of this report, the census categories have been aggregated into six groups:
white – all white ethnic groups including white British black – black or black British: Caribbean, black or black
British: African and other black background Asian – Asian or Asian British: Indian, Asian or Asian
British: Pakistani, Asian or Asian British: Bangladeshi and other Asian background
Chinese mixed other ethnic background
From 2012/13 Arab was added to the coding frame for ethnicity. Where ethnicity is grouped as above this has been grouped into other ethnic backgrounds.
Where the numbers are large enough, some analyses are reported in more detailed groupings.
It is only compulsory to collect ethnicity data for UK-domiciled students (although students can choose not to disclose) and therefore analysis of
Gender
2012/13 onwardsData on students’ sex is returned to HESA with the possible options of male, female and other. For the purposes of this report, data from the sex field will be referred to as gender.
Prior to 2012/1313

The student record collected data on gender, of which male, female or indeterminate were options. HESA used the category ‘indeterminate’ – which is consistent with the managing information across partnerships (MIAP) common data definitions coding frame – to refer to intersex people. Intersex people are individuals born with anatomy and physiology that differs from contemporary ideals of what constitutes ‘normal’ male and female. It is recognised that some intersex people may find the indeterminate category used by HESA for the previous field offensive. For data return purposes, institutions were able to ask students about their gender using the intersex terminology and return any positive responses to HESA using the MIAP coding and terminology in 2011/12.
Students who identified as intersex were excluded in any analysis of 2002/03 to 2011/12 data. This is because any statistics drawn from these small numbers would not give accurate information about the proportion of intersex people in the sector.
ECU recommends when monitoring gender to include categories of ‘other’ and ‘prefer not to say’ alongside male and female. This will allow anyone who associates with terms including intersex, androgyne, intergender, ambigender, gender fluid, polygender and genderqueer to complete the question.
Further information on monitoring sex and gender identity is published on ECU’s website. www.ecu.ac.uk/guidanceresources/ using-data-and evidence/monitoring-questions
Gender identity
14

Gender identity is a person’s internal perception and experience of their gender. Someone’s gender identity does not necessarily have to be the same as the gender they were assigned at birth.
Beginning with the 2012/13 staff record, institutions have the option of returning information to HESA on whether a person’s gender identity is the same as originally assigned at birth. The possible field options are yes, no, and information refused. This information is recorded on the basis of the staff member’s own self-assessment.
Religion and beliefReligion or belief refers to the full diversity of religious and belief affiliations within the UK, including non-religious and philosophical beliefs such as atheism, agnosticism and humanism.
Beginning with the 2012/13 staff data, institutions now have the option of returning religion and belief data to HESA. This information is recorded on the basis of the staff member’s own self-assessment.
The possible field options are: no religion; Buddhist; Christian (with further denominational options provided in Scotland and Northern Ireland); Hindu; Jewish; Muslim; Sikh; Spiritual; any other religion and belief; and prefer not to say/information refused. For the purposes of this report, all Christian denominational options have been aggregated into a single Christian category.
15

Sexual orientationSexual orientation is a person’s sexual orientation towards people of the same sex as him or her, people of the opposite sex from him or her, and people of both sexes. This relates to a person’s feelings rather than their actions.
Beginning with the 2012/13 staff record, institutions have the option of returning sexual orientation data to HESA. The HESA sexual orientation field has the following possible options: bisexual, gay man, gay woman/lesbian, heterosexual, other, information refused. This information is recorded on the basis of the staff member’s own self-assessment.
Mode and level
Full-time studentFull-time students are those normally required to attend an institution for periods amounting to at least 24 weeks within the year of study, on sandwich courses, and those on a study related year out of their institution. During that time, students are normally expected to undertake periods of study, tuition or work experience that amount to an average of at least 21 hours per week.
Part-time studentPart-time students are those recorded as studying part-time, or studying full-time on courses lasting less than 24 weeks, on block release, or studying during the evenings only.
Undergraduate studentsUndergraduates are students participating in undergraduate programmes of study aiming for qualifications at level of study of first degree, foundation degree or a range of higher
16

education diplomas and certificates (levels 4–6 of the national qualifications framework). In the majority of the analysis, undergraduates have been disaggregated into first degree undergraduates and other undergraduate students.
Postgraduate studentsThroughout this report, postgraduate students are defined as those on courses leading to higher degrees, diplomas and certificates. In the majority of the analysis this group has been further disaggregated into research and taught postgraduates.
Subjects
Please note that subject data prior to 2010 is not comparable with subject data from 2010 onwards.
SETIn this report, science, engineering and technology (SET) includes the following subject groups:
agriculture and related subjects architecture, building and planning biological sciences computer science engineering and technology mathematical sciences medicine and dentistry physical sciences subjects allied to medicine veterinary science
17

Non-SETSubjects included as non-SET in this report are:
business and administrative studies combined creative arts and design education historical and philosophical studies languages law mass communications and documentation social studies
Continuation
Continuation category is derived using the performance indicators method of continuation tracking of full-time first degree entrants in one academic year into the next. Students are then categorised into one of three possible states in the year following entry:
continue or qualify Gained a first degree or other undergraduate qualification or continued their studies at the same institution.
transfer to another higher education institution No qualification received at their original institution in 2011/12, but have an active record at a different institution in 2012/13.
no longer in HE No qualification received in 2011/12 and no active record found in 2012/13.
18

Degree attainment
QualifiersQualifiers refer to first degree undergraduates.
ClassificationThe classification of an undergraduate degree indicates the qualification class that the student received. Certain qualifications received at first degree undergraduate level are not subject to classification of the award, notably medical and general degrees. Ordinary degrees and qualifications considered as passed by a student too ill to finish the appropriate material have also been included within the unclassified category. Third class honours, fourth class honours and the pass category have been aggregated.
Degree attainment gapThe degree attainment gap refers to the difference in the proportion of one group receiving a first/2:1 compared with another group.
disability degree attainment gap(percentage of non-disabled first degree undergraduate qualifiers receiving a first/2:1) – (percentage of disabled first degree undergraduate qualifiers receiving a first/2:1)
ethnicity degree attainment gap (percentage of UK-domiciled white first degree undergraduate qualifiers receiving a first/2:1) – (percentage of UK-domiciled BME first degree undergraduate qualifiers receiving a first/2:1)
gender degree attainment gap
19

(percentage of male first degree undergraduate qualifiers receiving a first/2:1) – (percentage of female first degree undergraduate qualifiers receiving a first/2:1)
Destination of leavers
DLHEThe Destination of leavers from higher education (DLHE) survey, conducted by HESA, collects information on the activities of leavers from higher education programmes six months after qualifying from their higher education course (employed, engaged in further study and so on). DLHE data are based on responses from a sample of qualifiers who were surveyed approximately six months after they left their institution.
For 2011/12 the DLHE survey coverage was expanded to include additional higher education qualifications. The questionnaire was also redesigned to collect richer information from leavers particularly regarding their activities on the survey date. Leavers now report all the activities that they are undertaking on the census date and then indicate which one they consider to be most important to them.
Consequently, the DLHE survey has different definitions for the destination categories. Direct comparisons should therefore not be made with figures presented in previous years.
Throughout the analysis on leavers, the term full-time paid work has been used to mean full-time paid work only (including self-employed).
20

LeaversThe term ‘leavers’ is used in this report to refer to the students surveyed in the DLHE survey (see above) – ie students who have left their higher education programme.
21
Overview
In 2012/13, 2,340,275 students studied in UK higher education. This represents a decrease of 6.3% from the previous academic year.
971,410 students entered their first year of study in 2012/13, a markedly lower number than in previous years. Overall, 41.5% of all students were first year students, down from a peak of 47.7% in 2008/09.
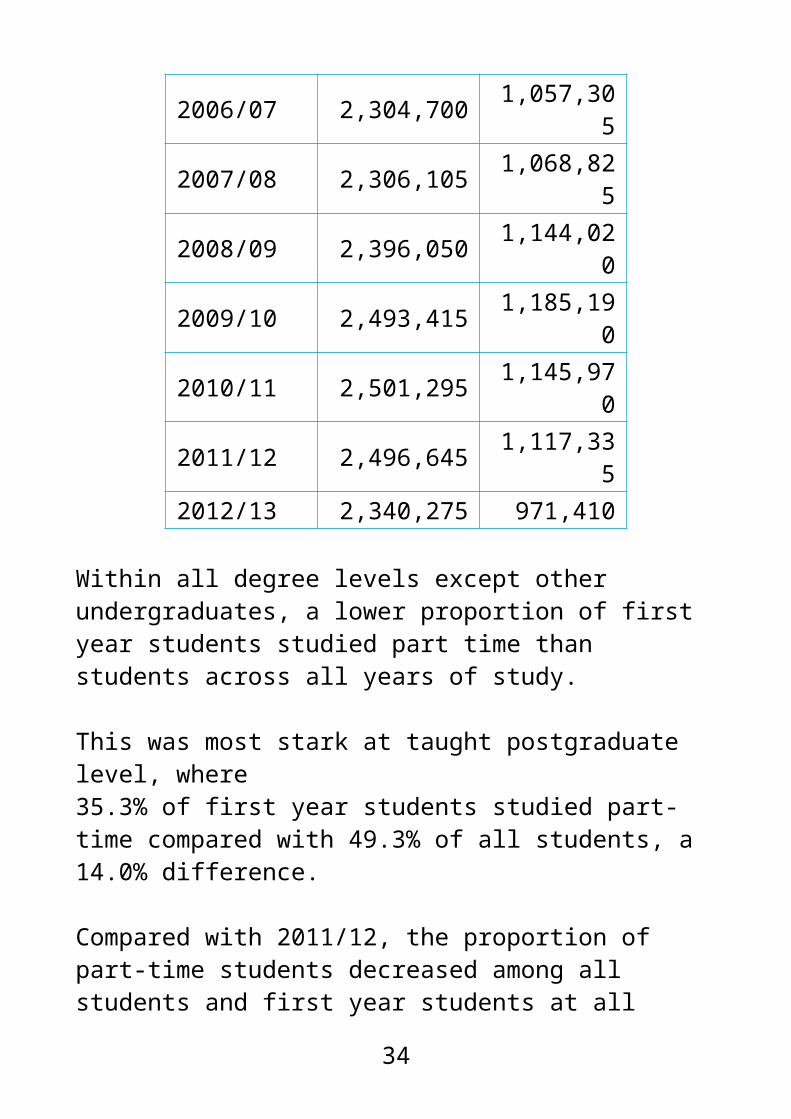
Within all degree levels except other undergraduates, a lower proportion of first year students studied part-time than students across all years of study.
With the exception of research postgraduates, at every degree level the majority of students studied non-SET subjects.
Compared with 2011/12, the proportion of first year students who studied non-SET subjects decreased from 61.1% to 59.6% at all levels.
91.4% of UK-domiciled full-time first degree entrants continued or qualified. The proportion of UK-domiciled full-time first degree entrants who were no longer in higher education in 2012/13 (6.7%) was lower than in the previous academic year (7.4%).
Compared with 2011/12, the proportion of first degree qualifiers who obtained a first/2:1 increased in all countries, by between 0.7% (in Scotland) and 3.7% (in Northern Ireland).
The proportion of first degree qualifiers who obtained a first/2:1 was highest in medicine and dentistry (91.0%) and lowest in business and administrative studies (60.2%).
Compared with 2011/12, the proportion of first degree qualifiers who received a first/2:1 increased in all subjects except agriculture and related subjects and
22

veterinary science. In SET subject areas this was a 2.2% increase from 65.1% to 67.3%, compared with a 1.7% increase in non-SET subject areas.
23

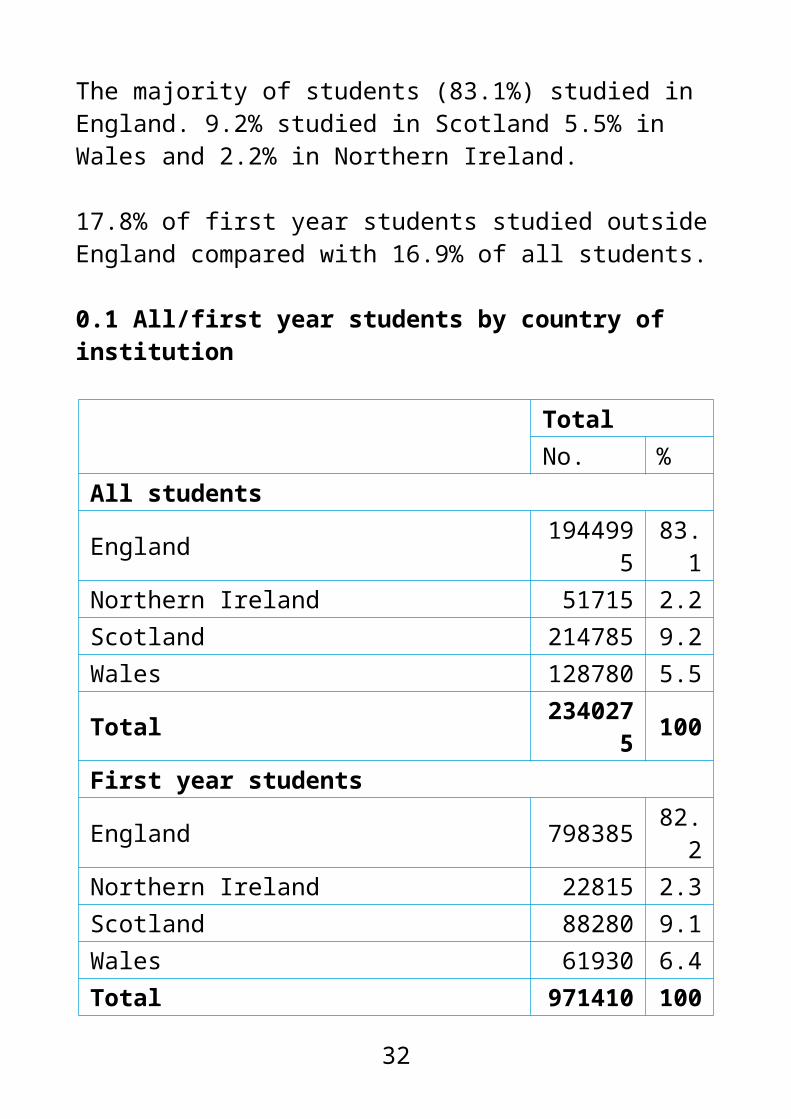
The majority of students (83.1%) studied in England. 9.2% studied in Scotland 5.5% in Wales and 2.2% in Northern Ireland.
17.8% of first year students studied outside England compared with 16.9% of all students.
0.1 All/first year students by country of institution
TotalNo. %
All students
England 1944995
83.1
Northern Ireland 51715 2.2Scotland 214785 9.2Wales 128780 5.5
Total 2340275 100
First year students
England 798385 82.2
Northern Ireland 22815 2.3Scotland 88280 9.1Wales 61930 6.4Total 971410 100
Percentages based on total number of students minus those whose country of institution is unknown.
24

In 2012/13, 2,340,275 students studied in UK higher education. This represents a decrease of 6.3% from the previous academic year.
971,410 students entered their first year of study in 2012/13, a markedly lower number than in previous years. Overall, 41.5% of all students were first year students, down from a peak of 47.7% in 2008/09.
0.2 Profile of all/first year students over time
All students First yearsNo. No.
2003/04 2,200,175 1,011,9002004/05 2,236,265 1,010,8452005/06 2,281,235 1,057,5152006/07 2,304,700 1,057,3052007/08 2,306,105 1,068,8252008/09 2,396,050 1,144,0202009/10 2,493,415 1,185,1902010/11 2,501,295 1,145,9702011/12 2,496,645 1,117,3352012/13 2,340,275 971,410
Within all degree levels except other undergraduates, a lower proportion of first year students studied part time than students across all years of study.
This was most stark at taught postgraduate level, where35.3% of first year students studied part-time compared with 49.3% of all students, a 14.0% difference.
25

Compared with 2011/12, the proportion of part-time students decreased among all students and first year students at all levels, by 3.0% and 3.6% respectively [see fig. 0.3, ECU (2013)].0.3 All/first year students by degree level and mode
All students First yearsNo % % %
All Full-time 1682145 71.9 66932
0 68.9
All Part-time 658130 28.1 302095 31.1
Total 2340275 100 97141
0 100
First degree undergraduate
Full-time 1312335 85.9 43314
0 87.5
Part-time 216145 14.1 62135 12.5
Total 1528480
100 495275
100
Other undergraduateFull-time 73340 26.6 33120 19.4
Part-time 202020 73.4 137770
80.6
Total 275360 100 170890
100
Research Postgraduate Full-time 79680 73.0 27985 80.9Part-time 29445 27.0 6595 19.1Total 109125 100 34575 100Taught Postgraduate Full-time 216790 50.7 17507 64.7
26

5Part-time 210520 49.3 95595 35.3
Total 427310 100 270670
100
Percentages based on total number of students minus those whose degree level or mode is unknown.
With the exception of research postgraduates, at every degree level the majority of students studied non-SET subjects.
The difference was largest among taught postgraduates where 66.1% of students studied non-SET subjects.
In contrast, 59.3% of research postgraduates studied SET subjects.
Compared with 2011/12, the proportion of students who studied SET subjects increased from 42.0% to 43.1%, a 1.1% difference [see fig. 0.4, ECU (2013)].
0.4 All students by subject area and degree level
All levels First degree undergraduate
No. % No. %SETAgriculture and related subjects 19020 0.8 9230 0.6
Architecture, building, planning 52968 2.3 33545 2.2
27
Biological sciences 201520 8.6 158135 10.3
Computer science 89500 3.8 67000 4.4Engineering and technology 158115 6.8 103980 6.8
Mathematical sciences 42235 1.8 3550 2.3Medicine and dentistry 66745 2.9 46050 3.0Physical sciences 93050 4.0 70035 4.6Subjects allied to medicine 279940 12.
0 148385 9.7
Veterinary science 5760 0.2 4840 0.3
SET total 1008585
43.1 676710 44.
3Non-SETBusiness, administrative studies 337245 14.
4 202270 13.2
Combined 71680 3.1 34650 2.3Creative arts and design 172860 7.4 140420 9.2Education 179910 7.7 61320 4.0Historical, philosophical studies 92740 4.0 68910 4.5
Languages 124280 5.3 91370 6.0Law 89190 3.8 65960 4.3Mass communications, documentation 50425 2.2 38795 2.5
Social studies 213360 9.1 148075 9.7
Non-SET total 1331690
56.9 851770 55.
7
Total 2340275 100 152847
5 100
28

Other undergraduate
Research postgraduate
No. % No. %SETAgriculture and related subjects 6630 2.4 920 0.8
Architecture, building, planning 4735 1.7 1975 1.8
Biological sciences 10865 3.9 13100 12.0
Computer science 5995 2.2 4470 4.1Engineering and technology 15270 5.5 13530 12.
4Mathematical sciences 960 0.3 2685 2.5Medicine and dentistry 570 0.2 8705 8.0
Physical sciences 3785 1.4 11700 10.7
Subjects allied to medicine 73320 26.6 7320 6.7
Veterinary science 55 0.0 335 0.3
SET total 122190 44.4 64745 59.
3Non-SETBusiness, administrative studies 29205 10.6 6740 6.2
Combined 35420 12.9 25 0.0Creative arts and design 10475 3.8 3930 3.6Education 32435 11.8 6875 6.3Historical, philosophical 6790 2.5 7435 6.8
29

studiesLanguages 17080 6.2 6100 5.6Law 2580 0.9 2295 2.1Mass communications, documentation 1690 0.6 1150 1.1
Social studies 17495 6.4 9830 9.0
Non-SET total 153175 55.6 44380 40.
7
Total 275365 100 10912
5 100
Taught postgraduate No. %
SETAgriculture and related subjects 2235 0.5Architecture, building, planning 12445 2.9Biological sciences 19415 4.5Computer science 12040 2.8Engineering and technology 25335 5.9Mathematical sciences 3075 0.7Medicine and dentistry 11425 2.7Physical sciences 7530 1.8Subjects allied to medicine 50910 11.9Veterinary science 535 0.1SET total 144945 33.9Non-SETBusiness, administrative studies 99030 23.2Combined 1585 0.4Creative arts and design 18035 4.2Education 79280 18.6
30
Historical, philosophical studies 9605 2.2Languages 9730 2.3Law 18360 4.3Mass communications, documentation 8790 2.1
Social studies 37955 8.9Non-SET total 282365 66.1Total 427310 100
Percentages based on total number of students minus those whose subject area or degree level is unknown.
A higher proportion of first year students (59.6%) studied non SET subjects at all levels than all students (56.9%, see fig. 0.4). This difference was largest among other undergraduates, where 58.8% of first year students studied non-SET subjects, compared with 55.6% of students in all years, a 3.2% difference (see fig. 0.4).
Compared with 2011/12, the proportion of first year students who studied non-SET subjects decreased from 61.1% to 59.6% at all levels.
At other undergraduate level there was a decrease in the proportion of first year students who studied Business and administrative studies, from 12.3% to 9.0%, a decrease of 3.3% [see fig. 0.5, ECU (2013)].
0.5 First year students by subject area and degree level
All levels First degree undergraduate
31
No. % No. %SETAgriculture and related subjects 8285 0.9 2900 0.6
Architecture, building, planning 19845 2.0 9925 2.0
Biological sciences 75130 7.7 52355 10.6Computer science 34265 3.5 22330 4.5Engineering and technology 61935 6.4 32370 6.5
Mathematical sciences 14345 1.5 10770 2.2Medicine and dentistry 19275 2.0 9565 1.9Physical sciences 32520 3.3 21145 4.3Subjects allied to medicine 125850 13.
0 52135 10.5
Veterinary science 1435 0.1 1055 0.2
SET total 392875 40.4 214560 43.3
Non-SETBusiness, administrative studies 153790 15.
8 73330 14.8
Combined 40105 4.1 9900 2.0Creative arts and design 64365 6.6 46545 9.4Education 93385 9.6 21595 4.4Historical, philosophical studies 32230 3.3 20030 4.0
Languages 49330 5.1 25930 5.2Law 37835 3.9 22315 4.5Mass communications, documentation 20470 2.1 13010 2.6
Social studies 87035 9.0 48070 9.7
32

Non-SET total 578540 59.6 280720 56.7
Total 971415 100 495280 100
Other undergraduate
Research postgraduate
No. % No. %SETAgriculture and related subjects 3760 2.2 285 0.8
Architecture, building, planning 2020 1.2 640 1.9
Biological sciences 6750 3.9 4255 12.3
Computer science 3135 1.8 1440 4.2Engineering and technology 8840 5.2 4365 12.
6Mathematical sciences 380 0.2 910 2.6Medicine and dentistry 285 0.2 2695 7.8
Physical sciences 2160 1.3 3830 11.1
Subjects allied to medicine 43000 25.2 2370 6.9
Veterinary science 25 0.0 115 0.3
SET total 70345 41.2 20900 60.5
Non-SETBusiness, administrative studies 15430 9.0 2025 5.9
Combined 28835 16.9 10 0.0
33
Creative arts and design 5270 3.1 1140 3.3Education 19010 11.1 1855 5.4Historical, philosophical studies 3865 2.3 2350 6.8
Languages 14555 8.5 2090 6.0Law 1790 1.0 700 2.0Mass communications, documentation 810 0.5 370 1.1
Social studies 10980 6.4 3135 9.1
Non-SET total 100545 58.8 13675 39.
5
Total 170890 100 34575 100
Taught postgraduate No. %
SETAgriculture and related subjects 1340 0.5Architecture, building, planning 7255 2.7Biological sciences 11770 4.3Computer science 7360 2.7Engineering and technology 16355 6.0Mathematical sciences 2285 0.8Medicine and dentistry 6725 2.5Physical sciences 5385 2.0Subjects allied to medicine 28345 10.5Veterinary science 240 0.1SET total 87065 32.2Non-SETBusiness, administrative studies 63010 23.3
34

Combined 1355 0.5Creative arts and design 11415 4.2Education 50920 18.8Historical, philosophical studies 5985 2.2Languages 6755 2.5Law 13030 4.8Mass communications, documentation 6285 2.3
Social studies 24855 9.2Non-SET total 183605 67.8Total 270670 100
Percentages based on total number of students minus those whose subject area or degree level is unknown.
Entrants refers to full-time first degree UK-domiciled 2011/12 entrants. Continuation data indicates the progress of these entrants to 2012/13.
91.4% of entrants continued or qualified.
The proportion of entrants who were no longer in higher education in 2012/13 (6.7%) was lower than in the previous academic year (7.4%) [see fig. 0.6, ECU (2013)].
0.6 UK-domiciled full-time first degree entrants by continuation category
All studentsNo. %
Continue or qualify 355480
91.4
Transfer 7350 1.935

No longer in higher education 26085 6.7
Total 388915 100
Percentages based on total number of students minus those whose continuation category is unknown.
UK-domiciled full-time first degree entrants by continuation category
Continue or qualify
Transfer No longer in HE
91.4 1.9 6.7
Qualifiers refers to first degree undergraduate qualifiers. The proportion of qualifiers who obtained a first/2:1 varied by country, from 63.0% in Wales to 72.4% in Scotland.
Compared with 2011/12, the proportion of qualifiers who obtained a first/2:1 increased in all countries, by between 0.7% (in Scotland) and 3.7% (in Northern Ireland) [see fig. 0.7, ECU (2013)].
0.7 First degree undergraduate qualifiers by country of institution and degree class
First 2:1 2:2 Third/pass
No. % No. % No. % No. %England
60110
18.6
159310
49.2
83340
25.8
20725
6.4
Londo 1115 19. 2733 46. 1577 27. 4010 6.
36

n 0 1 0 9 0 1 9England exc. London
48960
18.5
131980
49.8
67575
25.5
16715
6.3
Northern Ireland
1445 16.8 4475 52.
1 2305 26.8 370 4.
3
Scotland 4640 18.
71335
553.
7 5885 23.7 975 3.
9
Wales 3430 15.8
10225
47.2 6615 30.
5 1400 6.5
Total 69625
18.4
187365
49.5
98145
25.9
23465
6.2
Percentages based on total number of students minus those whose country of institution or degree class is unknown.
First degree undergraduate qualifiers in countries of institution by degree class
First%
2:1%
2:2%
Third/pass%
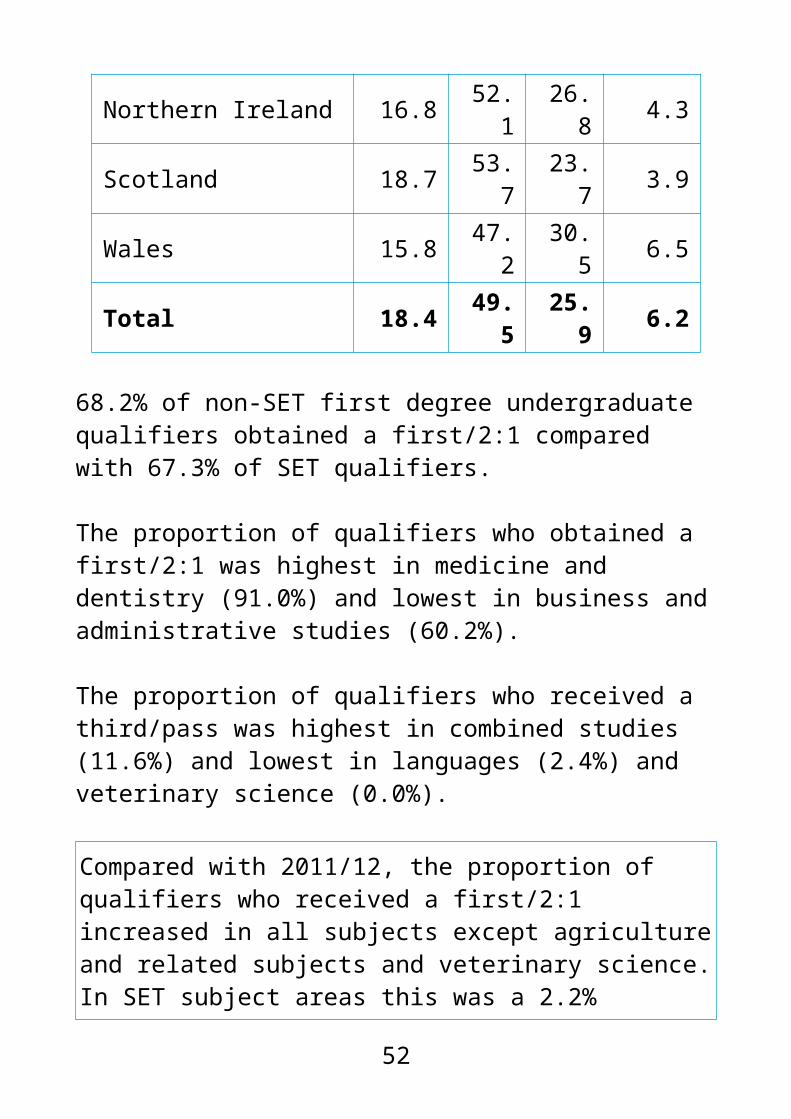
England 18.6 49.2 25.8 6.4London 19.1 46.9 27.1 6.9England exc. London 18.5 49.8 25.5 6.3Northern Ireland 16.8 52.1 26.8 4.3Scotland 18.7 53.7 23.7 3.9Wales 15.8 47.2 30.5 6.5Total 18.4 49.5 25.9 6.2
37

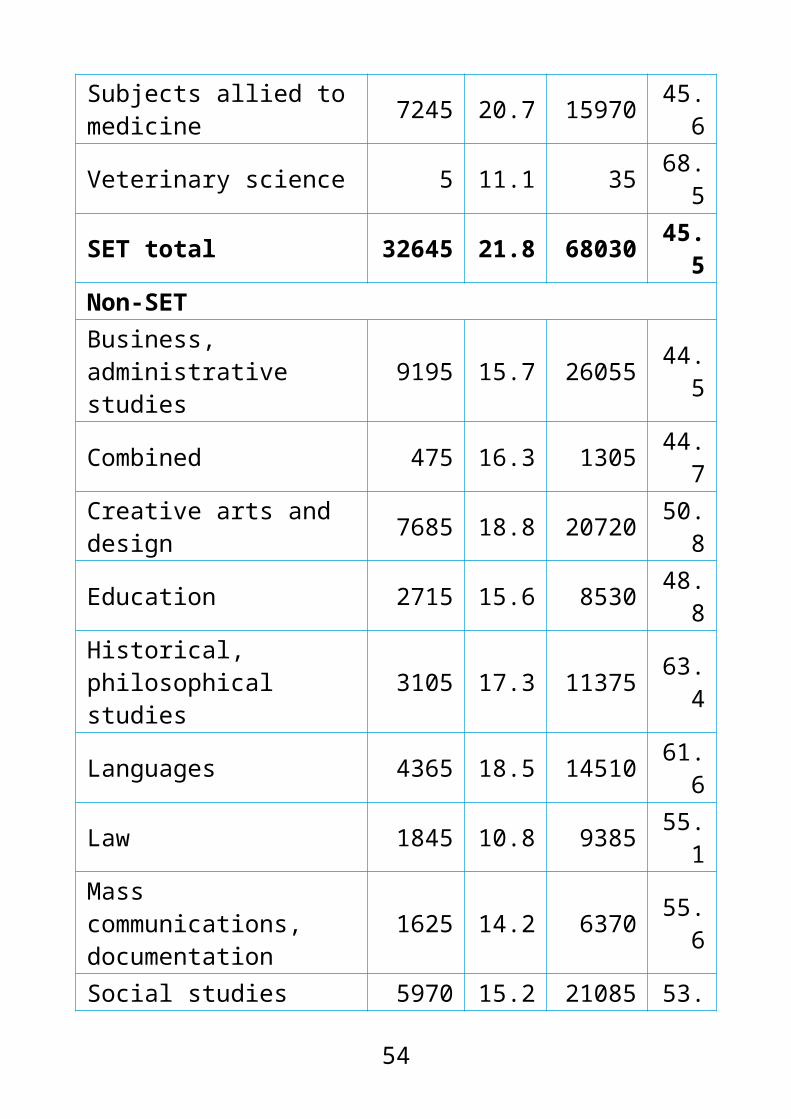
68.2% of non-SET first degree undergraduate qualifiers obtained a first/2:1 compared with 67.3% of SET qualifiers.
The proportion of qualifiers who obtained a first/2:1 was highest in medicine and dentistry (91.0%) and lowest in business and administrative studies (60.2%).
The proportion of qualifiers who received a third/pass was highest in combined studies (11.6%) and lowest in languages (2.4%) and veterinary science (0.0%).
Compared with 2011/12, the proportion of qualifiers who received a first/2:1 increased in all subjects except agriculture and related subjects and veterinary science. In SET subject areas this was a 2.2% increase from 65.1% to 67.3%, compared with a 1.7% increase in non SET subject areas [see fig. 0.8, ECU (2013)].
0.8 First degree undergraduate qualifiers by subject area and degree class
First 2:1No. % No. %
SETAgriculture and related subjects 450 16.9 1230 46.
2Architecture, building, and planning 1705 17.7 4705 48.
9
Biological sciences 6210 16.3 19575 51.3
Computer science 3575 24.1 5685 38.3
Engineering and 6295 27.1 9665 41.
38

technology 6
Mathematical sciences 2790 34.0 2930 35.7
Medicine and dentistry 610 38.2 845 52.8
Physical sciences 3760 23.4 7385 46.0
Subjects allied to medicine 7245 20.7 15970 45.
6
Veterinary science 5 11.1 35 68.5
SET total 32645 21.8 68030 45.5
Non-SETBusiness, administrative studies 9195 15.7 26055 44.
5
Combined 475 16.3 1305 44.7
Creative arts and design 7685 18.8 20720 50.8
Education 2715 15.6 8530 48.8
Historical, philosophical studies 3105 17.3 11375 63.
4
Languages 4365 18.5 14510 61.6
Law 1845 10.8 9385 55.1
Mass communications, documentation 1625 14.2 6370 55.
6
Social studies 5970 15.2 21085 53.5
39

Non-SET total 26980 16.1 119335
52.1
Total 69630 18.4 187365
49.5
2:2 Third/passNo. % No. %
SETAgriculture and related subjects 805 30.2 180 6.7
Architecture, building, and planning 2510 26.1 695 7.2
Biological sciences 10275 26.9 2070 5.4
Computer science 4045 27.2 1545 10.4
Engineering and technology 5675 24.4 1590 6.8
Mathematical sciences 1855 22.6 630 7.7Medicine and dentistry 105 6.5 40 2.5Physical sciences 4010 25.0 900 5.6Subjects allied to medicine 9175 26.2 2670 7.6
Veterinary science 10 20.4 0 0.0SET total 38460 25.7 10320 6.9Non-SETBusiness, administrative studies 18510 31.6 4815 8.2
Combined 800 27.4 340 11.6
Creative arts and design 10065 24.7 2315 5.7Education 5115 29.3 1105 6.3
40

Historical, philosophical studies 3035 16.9 440 2.5
Languages 4115 17.5 555 2.4Law 4890 28.7 925 5.4Mass communications, documentation 2970 25.9 495 4.3
Social studies 10190 25.9 2160 5.5Non-SET total 59685 26.0 13145 5.7Total 98145 25.9 23465 6.2
Percentages based on total number of students minus those whose subject area or degree class is unknown.
First degree undergraduate qualifiers in subject areas by degree class
First %
2:1 %
2:2 %
Third/pass %
SETAgriculture and related subjects 16.9 46.
230.
2 6.7
Architecture, building, and planning 17.7 48.
926.
1 7.2
Biological sciences 16.3 51.3
26.9 5.4
Computer science 24.1 38.3
27.2 10.4
Engineering and technology 27.1 41.6
24.4 6.8
Mathematical sciences 34.0 35. 22. 7.7
41

7 6
Medicine and dentistry 38.2 52.8 6.5 2.5
Physical sciences 23.4 46.0
25.0 5.6
Subjects allied to medicine 20.7 45.6
26.2 7.6
Veterinary science 11.1 68.5
20.4 0.0
SET Total 21.8 45.5
25.7 6.9
Non-SETBusiness, administrative studies
15.7 44.5 31.
6 8.2
Combined 16.3 44.7 27.
4 11.6
Creative arts and design 18.8 50.8 24.
7 5.7
Education 15.6 48.8 29.
3 6.3
Historical, philosophical studies
17.3 63.4 16.
9 2.5
Languages 18.5 61.6 17.
5 2.4
Law 10.8 55.1 28.
7 5.4
Mass communications, documentation
14.2 55.6 25.
9 4.3
Social studies 15.2 53.5 25.
9 5.5
Non-SET total 16.1 52.1 26.
0 5.7
42

* values less than 5.0 are not displayed
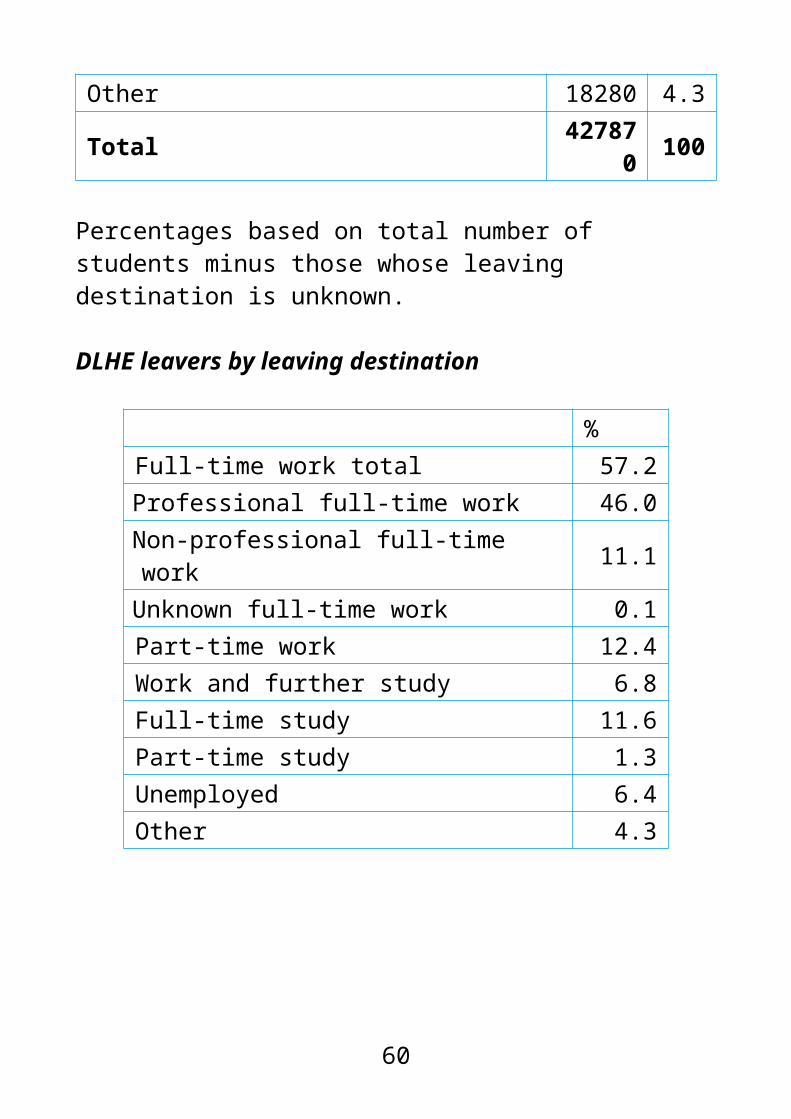
Leavers refers to students who responded to the DLHE survey six months after qualifying.
57.2% of leavers were in fulltime work and 12.4% were in part time work. 11.6% were in full-time study and 6.4% were unemployed.
0.9 DLHE leavers by leaving destination
All leaversNo. %
Full-time work total 244775
57.2
Professional full-time work 196770
46.0
Non-professional full-time work 47455 11.1
Unknown full-time work 550 0.1
Part-time work 53265 12.4
Work and further study 29145 6.8
Full-time study 49515 11.6
Part-time study 5420 1.3Unemployed 27470 6.4Other 18280 4.3
Total 427870 100
43

Percentages based on total number of students minus those whose leaving destination is unknown.
DLHE leavers by leaving destination
%Full-time work total 57.2Professional full-time work 46.0Non-professional full-time work 11.1Unknown full-time work 0.1Part-time work 12.4Work and further study 6.8Full-time study 11.6Part-time study 1.3Unemployed 6.4Other 4.3
44

1 Age
The age profile of first year students is markedly older than for all students. 56.1% of first year students were aged 22 and over, compared with 46.3% of all students (a 9.8% difference).
Between 2003/04 and 2012/13 the proportion of students aged 21 and under increased by 8.3%, from 45.4% to 53.7%. During this same time period, the proportions of students aged 26–35 and 36 and over decreased (by 3.1% and 6.6%, respectively).
Within every degree level, the proportion of students studying on a part-time basis increases with age. This is most stark at taught postgraduate level, where 85.5% of those aged 36 and over studied part-time compared with 13.2% of those aged 21 and under.
There is greater variation between the age profiles of first year students and all students among other undergraduates. For example, among other undergraduates studying SET subjects, the proportion of students aged 21 and under was lower among first year students (16.2%) than all other undergraduates (23.1%).
UK-domiciled full-time first degree entrants aged 21 and under had both the highest rates of qualifying or continuing in their studies (92.0%) and rates of transfer (2.0%) among the age groups.
Continuation or qualification rates were lowest among UK domiciled full-time first degree entrants aged 22–25 (87.5%). This age group also had the highest proportion of UK-domiciled fulltime first degree entrants no longer in higher education (11.0%).
45

A higher proportion of full-time first degree qualifiers aged 21 and under achieved a first/2:1 than first degree qualifiers in older age groups.
Within SET subject areas, 70.2% of first degree qualifiers aged 21 and under received a first/2:1 compared with 59.9% of those aged 36 and over.
73.7% of non-SET first degree qualifiers aged 21 and under received a first/2:1 compared with 60.2% of non-SET first degree qualifiers aged 26–35.
Age overview
With the exception of data on qualifiers and leavers, this section refers to students’ age on entry, as calculated at the start date of their studies. The age of qualifiers and leavers is calculated at 31 July 2013.
53.7% of students were aged 21 and under. The country with the highest proportion of students in this age range was Northern Ireland (57.5%), while England had the lowest (53.3%).
The age profile of first year students is markedly older than for all students. 56.1% of first year students were aged 22 and over, compared with 46.3% of all students (a 9.8% difference).
46

1.1 All/first year students by country of institution and age group
21 and under 22-25 26-35
No. % No. % No. %All students
England 1037270
53.3
303540
15.6
315710
16.2
Northern Ireland 29725 57.
5 7020 13.6 7330 14.
2
Scotland 120800 56.2 33955 15.
8 31885 14.8
Wales 69240 53.8 20020 15.
6 19295 15.0
Total 1257030
53.7
364540
15.6
374220
16.0
First years
England 351655 44.1
167920
21.0
147305
18.5
Northern Ireland 10090 44.
2 3625 15.9 3825 16.
8
Scotland 38700 43.8 19580 22.
2 15415 17.5
Wales 26200 42.3 12465 20.
1 10990 17.8
Total 426650 43.9
203595
21.0
177535
18.3
36 and over Unknown ageNo. % No. %
All students
47

England 287930
14.8 550 0.0
Northern Ireland 7645 14.8 0 0.0
Scotland 28125 13.1 20 0.0
Wales 20175 15.7 50 0.0
UK total 343875
14.7 615 0.0
First years
England 131085
16.4 415 0.1
Northern Ireland 5275 23.1 0 0.0
Scotland 14580 16.5 5 0.0
Wales 12225 19.8 45 0.1
UK first years total 163170
16.8 465 0.0
Percentages based on total number of students minus those whose country of institution or age group is unknown.
All/first year students in countries of institution by age group
21 and under
22-25 26-35
36 and over
All students England 53.3 15.6 16.2 14.8
48

All students Northern Ireland 57.5 13.6 14.2 14.8
All students Scotland 56.2 15.8 14.8 13.1All students Wales 53.8 15.6 15.0 15.7All students UK 53.7 15.6 16.0 14.7First years England 44.1 21.0 18.5 16.4First years Northern Ireland 44.2 15.9 16.8 23.1
First years Scotland 43.8 22.2 17.5 16.5First years Wales 42.3 20.1 17.5 19.8First years UK 43.9 21.0 18.3 16.8
Between 2003/04 and 2012/13 the proportion of students aged 21 and under increased by 8.3%, from 45.4% to 53.7%.
During this same time period, the proportions of students aged 26–35 and 36 and over decreased (by 3.1% and 6.6%, respectively).
1.2 Profile of all students over time by age group
21 and under 22-25 26-35No. % No. % No. %
2003/04 992005 45.4
311955
14.3
416875
19.1
2004/05 1013955 45.6
325175
14.6
418010
18.8
2005/06 1045890 46.0
333395
14.7
417115
18.4
2006/07 1071630 46.6
337040
14.7
417280
18.2
49

2007/08 1097235 47.7
338855
14.7
413195
17.9
2008/09 1138875 47.6
358115
15.0
430740
18.0
2009/10 1199770 48.2
385145
15.5
446285
17.9
2010/11 1232240 49.3
394365
15.8
440390
17.6
2011/12 1279925 51.3
389180
15.6
420100
16.8
2012/13 1257030 53.7
364540
15.6
374220
16.0
36 and over Unknown ageNo. % No. %
2003/04 466020 21.3
13320
0.6
2004/05 467645 21.0
11485
0.5
2005/06 475905 20.9
8935 0.4
2006/07 472070 20.5
6675 0.3
2007/08 453000 19.7
3825 0.2
2008/09 465430 19.4
2890 0.1
2009/10 459535 18.4
2685 0.1
2010/11 433065 17.3
1235 0.0
2011/12 406565 16. 870 0.0
50

3
2012/13 343875 14.7
615 0.0
Percentages based on total number of students minus those whose age group is unknown.
All students over time by age group
21 & under % 22-25 % 26-35 % 36 and
over%2003/04 45.4 14.3 19.1 21.32004/05 45.6 14.6 18.8 21.02005/06 46.0 14.7 18.4 20.92006/07 46.6 14.7 18.2 20.52007/08 47.7 14.7 17.9 19.72008/09 47.6 15.0 18.0 19.42009/10 48.2 15.5 17.9 18.42010/11 49.3 15.8 17.6 17.32011/12 51.3 15.6 16.8 16.32012/13 53.7 15.6 16.0 14.7
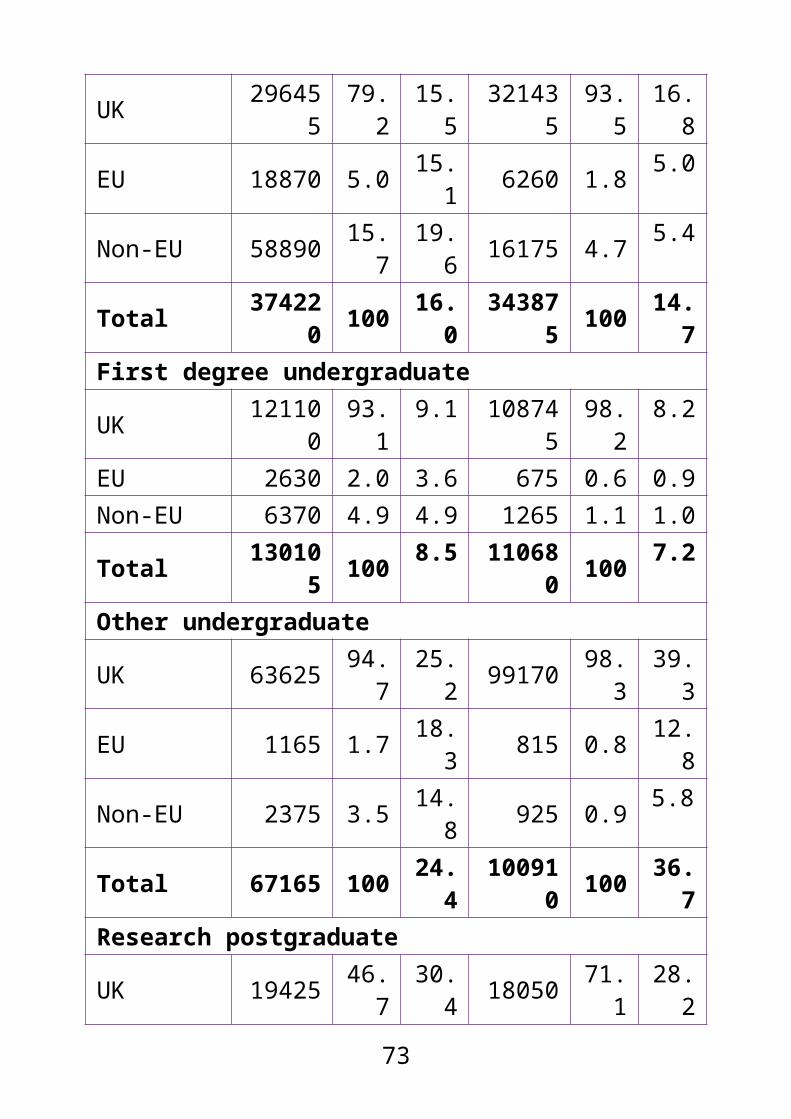
The age profile of students within each degree level varied by domicile. For example, 85.3% of EU-domiciled first degree undergraduates were aged 21 and under compared with 74.9% of UK-domiciled first degree undergraduates.
The most notable differences between domicile groups were found within the other undergraduate degree level. 22.3% of UK-domiciled other undergraduates were aged 21 and under compared with 51.1% of non-EU-domiciled other undergraduates.
51
39.3% of UK-domiciled other undergraduates were aged 36 and over compared with 5.8% of non-EU-domiciled other undergraduates.
1.3 All students by degree level, domicile category and age group
21 and under 22-25No. %* %^ No. %* %^
All levels
UK 1068095
85.0
55.8
228480
62.7
11.9
EU 67890 5.4 54.2 32245 8.8 25.
7
Non-EU 121045 9.6 40.4
103815
28.5
34.6
Total 1257030 100 53.
736454
0 100 15.6
First degree undergraduate
UK 992335 85.8
74.9
102330
78.4
7.7
EU 62315 5.4 85.3 7425 5.7 10.
2
Non-EU 102480 8.9 78.3 20760 15.
915.
9
Total 1157130 100 75.
713051
0 100 8.5
Other undergraduate
UK 56190 83.8
22.3 33495 84.
213.
3
EU 2675 4.0 41.9 1730 4.4 27.
1
52

Non-EU 8200 12.2
51.1 4540 11.
428.3
Total 67065 100 24.4 39765 100 14.
5Research postgraduate
UK 2405 77.4
3.8 24070 61.7
37.6
EU 250 8.1 1.8 5950 15.2
42.6
Non-EU 450 14.4
1.4 8995 23.1
28.9
Total 3110 100 2.8 39015 100 35.8
Taught postgraduate
UK 17165 57.7
6.3 68590 44.2
25.1
EU 2650 8.9 8.3 17135 11.0
53.8
Non-EU 9915 33.4
8.1 69525 44.8
57.1
Total 29725 100 7.0 155250 100 36.
3
26-35 36 and overNo. %* %^ No. %* %^
All levels
UK 296455
79.2
15.5
321435
93.5
16.8
EU 18870 5.0 15.1 6260 1.8 5.0
Non-EU 58890 15.7
19.6 16175 4.7 5.4
53
Total 374220 100 16.
034387
5 100 14.7
First degree undergraduate
UK 121100
93.1
9.1 108745
98.2
8.2
EU 2630 2.0 3.6 675 0.6 0.9Non-EU 6370 4.9 4.9 1265 1.1 1.0
Total 130105 100 8.5 11068
0 100 7.2
Other undergraduate
UK 63625 94.7
25.2 99170 98.
339.
3
EU 1165 1.7 18.3 815 0.8 12.
8
Non-EU 2375 3.5 14.8 925 0.9 5.8
Total 67165 100 24.4
100910 100 36.
7Research postgraduate
UK 19425 46.7
30.4 18050 71.
128.
2
EU 6110 14.7
43.7 1665 6.6 11.
9
Non-EU 16055 38.6
51.5 5680 22.
418.
2
Total 41590 100 38.1 25395 100 23.
3Taught postgraduate
UK 92305 68.2
33.7 95470 89.
334.
9
EU 8960 6.6 28.1 3105 2.9 9.8
54

Non-EU 34090 25.2
28.0 8310 7.8 6.8
Total 135355 100 31.
710689
0 100 25.0
* within an age group, the percentage of students in a domicile category (compare vertically within a degree level)^ within a degree level and domicile category, the percentage of students in an age group (compare horizontally) Percentages based on total number of students minus those whose degree level, domicile category or age group is unknown.
Mode and level
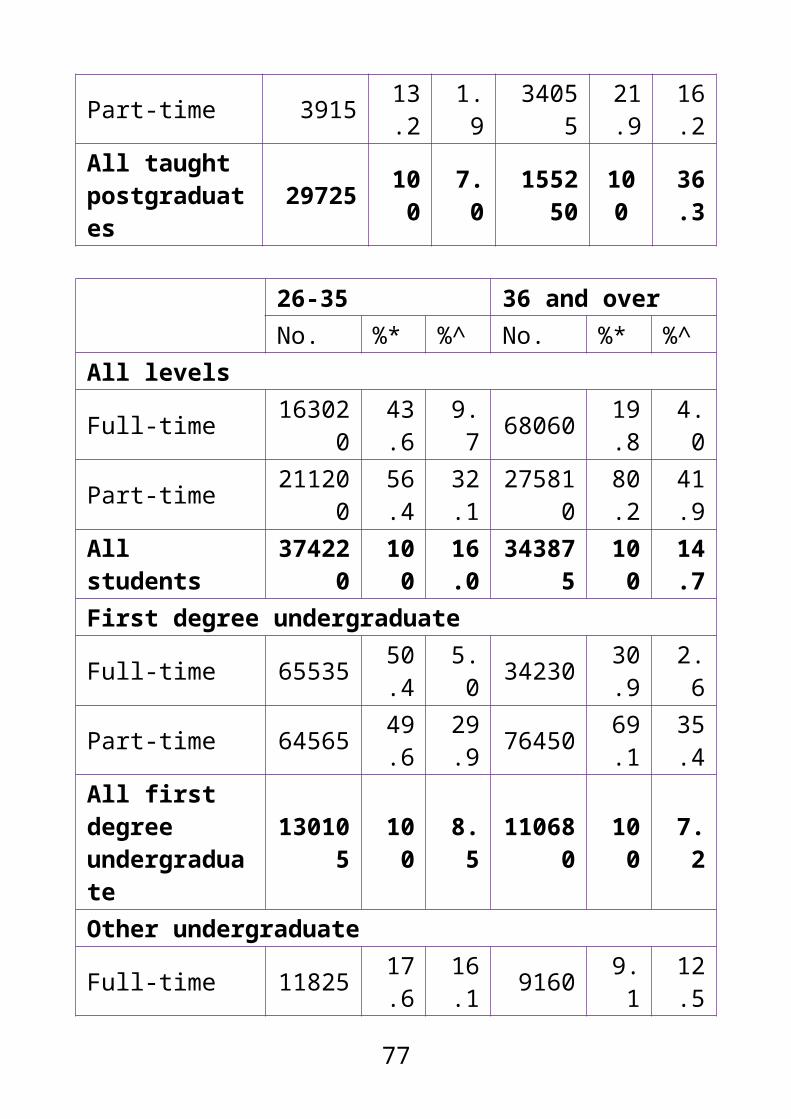
Within every degree level, the proportion of students studying on a part-time basis increases with age. This is most stark at taught postgraduate level, where 85.5% of those aged 36 and over studied part time compared with 13.2% of those aged 21 and under.
Within every age group, a higher proportion of other undergraduates studied part time than students at any other degree level.
1.4 All students by degree level, mode, and age group
21 and under 22-25No. %* %^ No. %* %^
All levels
Full-time 1184825
94.3
70.4
266210
73.0
15.8
55

Part-time 72205 5.7 11.0 98330 27.
015.
0
All students 1257030 100 53.
736454
0 100 15.6
First degree undergraduate
Full-time 1116220
96.5
85.1 96335 73.
8 7.3
Part-time 40910 3.5 18.9 34180 26.
215.
8All first degree undergraduate
1157130 100 75.
713051
0 100 8.5
Other undergraduate
Full-time 39850 59.4
54.3 12505 31.
417.
0
Part-time 27215 40.6
13.5 27260 68.
613.
5All other undergraduates
67065 100 24.4 39765 100 14.
5
Postgraduate research
Full-time 2945 94.8 3.7 36180 92.
745.
4Part-time 165 5.2 0.6 2835 7.3 9.6All research postgraduates
3110 100 2.8 39015 100 35.8
Postgraduate taught
Full-time 25810 86.8
11.9
121195
78.1
55.9
Part-time 3915 13. 1.9 34055 21. 16.
56

2 9 2All taught postgraduates
29725 100 7.0 155250 100 36.
3
26-35 36 and overNo. %* %^ No. %* %^
All levels
Full-time 163020
43.6
9.7 68060 19.8
4.0
Part-time 211200
56.4
32.1
275810
80.2
41.9
All students 374220 100 16.
034387
5 100 14.7
First degree undergraduate
Full-time 65535 50.4 5.0 34230 30.
9 2.6
Part-time 64565 49.6
29.9 76450 69.
135.
4All first degree undergraduate
130105 100 8.5 11068
0 100 7.2
Other undergraduate
Full-time 11825 17.6
16.1 9160 9.1 12.
5
Part-time 55340 82.4
27.5 91750 90.
945.
5All other undergraduates
67165 100 24.4
100910 100 36.
7
Postgraduate research
57

Full-time 31350 75.4
39.4 9195 36.
211.
5
Part-time 10240 24.6
34.8 16200 63.
855.
0All research postgraduates 41590 100 38.
1 25395 100 23.3
Postgraduate taught
Full-time 54305 40.1
25.1 15475 14.
5 7.1
Part-time 81050 59.9
38.5 91410 85.
543.
4All taught postgraduates
135355 100 31.
710689
0 100 25.0
Unknown ageNo. %* %^
All levels
Full-time 25 4.4 0.0
Part-time 590 95.6
0.1
All students 615 100 0.0
First degree undergraduate
Full-time 10 .. 0.0
Part-time 40 .. 0.0
All first degree undergraduate 50 .. 0.0
Other undergraduateFull-time 0 0.2 0.
58

0
Part-time 455 99.8
0.2
All other undergraduates 455 100 0.2
Postgraduate research
Full-time 10 .. 0.0
Part-time 10 .. 0.0
All research postgraduates 20 .. 0.0
Postgraduate taught
Full-time 5 6.8 0.0
Part-time 80 93.2
0.0
All taught postgraduates 90 100 0.0
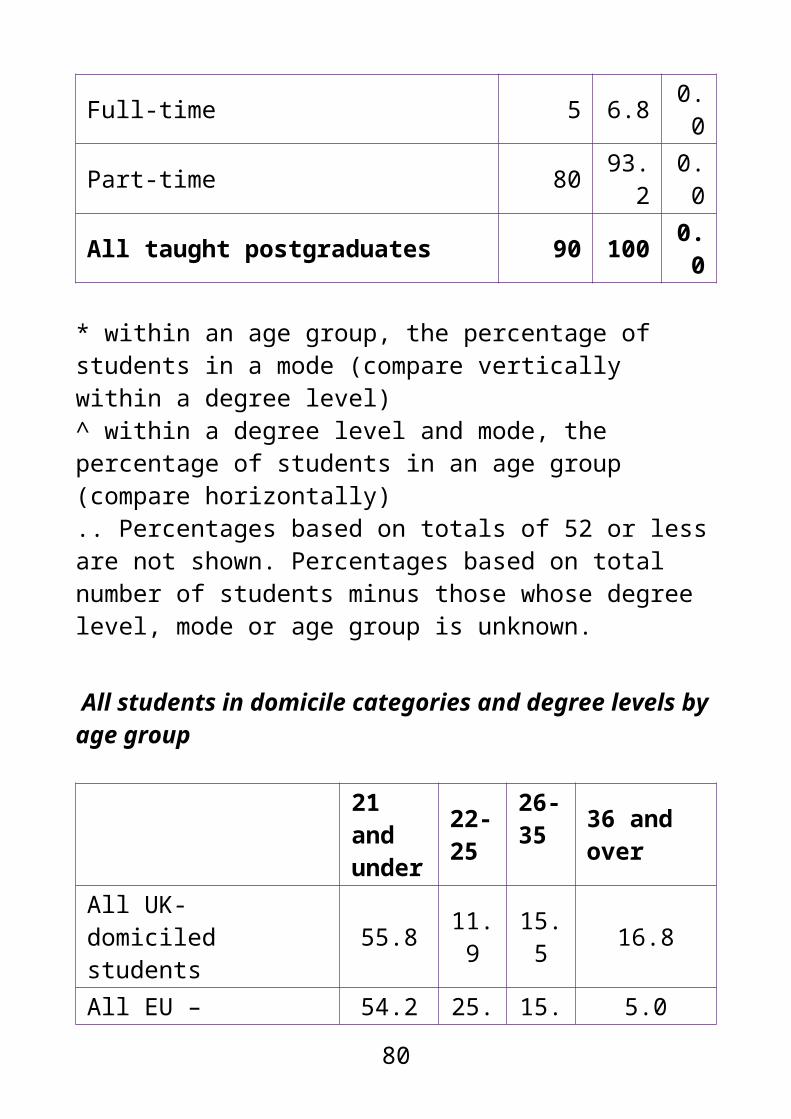
* within an age group, the percentage of students in a mode (compare vertically within a degree level)^ within a degree level and mode, the percentage of students in an age group (compare horizontally).. Percentages based on totals of 52 or less are not shown. Percentages based on total number of students minus those whose degree level, mode or age group is unknown.
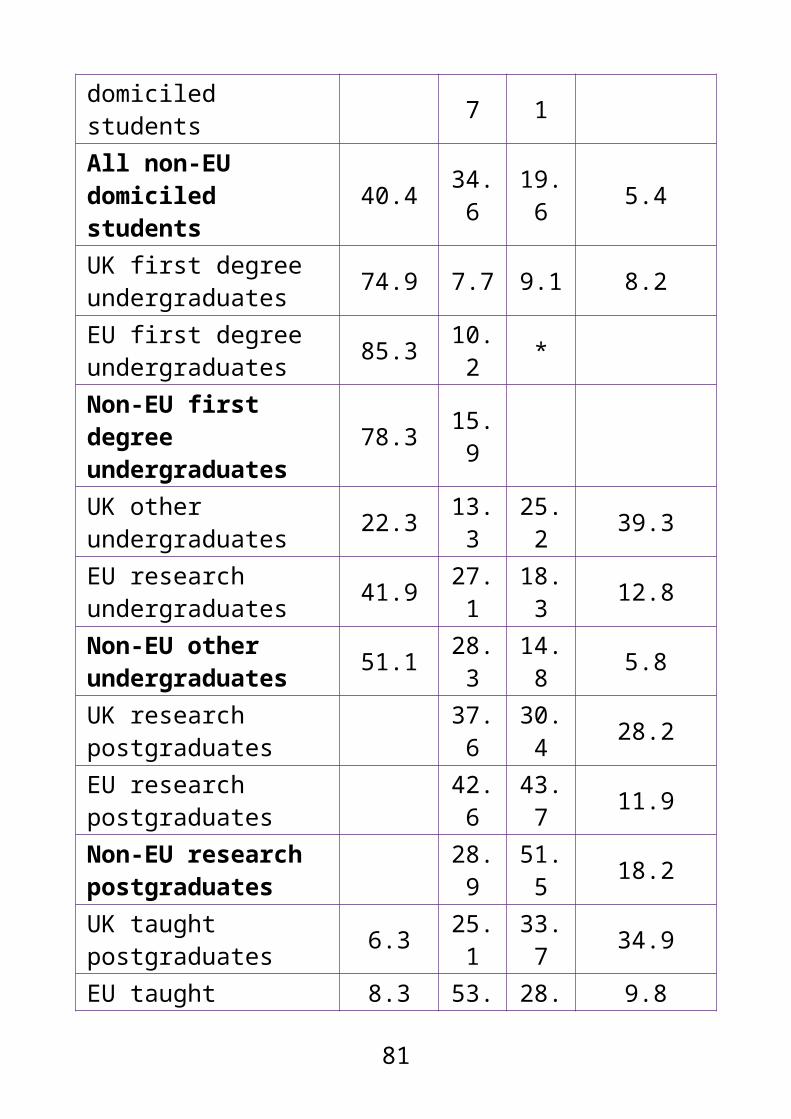
All students in domicile categories and degree levels by age group
21 22- 26- 36 and
59
and under 25 35 over
All UK- domiciled students 55.8 11.
915.5 16.8
All EU –domiciled students 54.2 25.
715.1 5.0
All non-EU domiciled students 40.4 34.
619.6 5.4
UK first degree undergraduates 74.9 7.7 9.1 8.2
EU first degree undergraduates 85.3 10.
2 *
Non-EU first degree undergraduates 78.3 15.
9UK other undergraduates 22.3 13.
325.2 39.3
EU research undergraduates 41.9 27.
118.3 12.8
Non-EU other undergraduates 51.1 28.
314.8 5.8
UK research postgraduates
37.6
30.4 28.2
EU research postgraduates
42.6
43.7 11.9
Non-EU research postgraduates
28.9
51.5 18.2
UK taught postgraduates 6.3 25.
133.7 34.9
EU taught postgraduates 8.3 53.
828.1 9.8
Non-EU taught postgraduates 8.1 57.
128.0 6.8
60

* values less than 5.0 are not displayed See g. 1.3 for accompanying data.All full-time/part-time students in degree levels by age group
21 and under
22-25
26-35
36 and over
All full-time 70.4 15.8 9.7 *All part-time 11.0 15.0 32.1 41.9All students 53.7 15.6 16.0 14.7Full-time first degree undergraduates 85.1 7.3 5.0
Part-time first degree undergraduates 18.9 15.8 29.9 35.4
All first degree undergraduates 75.7 8.5 8.5 7.2
Full-time other undergraduates 54.3 17.0 16.1 12.5
Part-time other undergraduates 13.5 13.5 27.5 45.5
All other undergraduates 24.4 14.5 24.4 36.7
Full-time research postgraduates 45.4 39.4 11.5
Part-time research postgraduates 9.6 34.8 55.0
All research postgraduates 35.8 38.1 23.3
Full-time taught postgraduates 11.9 55.9 25.1 7.1
61

Part-time taught postgraduates 16.2 38.5 43.4
All taught postgraduates 7.0 36.3 31.7 25.0
* values less than 5.0 are not displayed
Across all degree levels except other undergraduate, the proportion of students in every age group studying on a full time basis was higher among first year students than all students (see fig. 1.4). This difference was most notable among taught postgraduates aged 26–35, where 53.6% of first year students studied part time compared with 40.1% of all students.
1.5 First year students by degree level, mode and age group
21 and under 22-25No. %* %^ No. %* %^
All levels
Full-time 397945
93.5
59.5
157555
77.4
23.5
Part-time 28705 6.7 9.5 46035 22.6
15.3
Total 426650 100 43.
920359
5 100 21.0
First degree undergraduate
Full-time 356925
97.8
82.4 38435 76.
5 8.9
Part-time 8090 2.2 13.0 11785 23.
519.
0Total 36502 100 73. 50220 100 10.
62

0 7 1Other undergraduate
Full-time 18235 49.2
55.1 6525 25.
719.
7
Part-time 18790 50.8
13.7 18860 74.
313.
7
Total 37025 100 21.7 25385 100 14.
9Postgraduate research
Full-time 1160 97.1 4.1 12665 95.
145.
3Part-time 35 2.9 0.5 645 4.9 9.8
Total 1195 100 3.5 13310 100 38.5
Postgraduate taught
Full-time 21625 92.4
12.4 99935 87.
157.
1
Part-time 1785 7.6 1.9 14745 12.9
15.4
Total 23410 100 8.7 114680 100 42.
4
26-35 36 and overNo. %* %^ No. %* %^
All levels
Full-time 81800 46.1
12.2 32000 19.
64.8
Part-time 95735 53.9
31.7
131170
80.4
43.5
Total 177535 100 18.
316317
0 100 16.8
63

First degree undergraduate
Full-time 24290 54.8 5.6 13485 37.
8 3.1
Part-time 20045 45.2
32.3 22195 62.
235.
7Total 44335 100 9.0 35680 100 7.2Other undergraduate
Full-time 4865 11.5
14.7 3490 5.3 10.
5
Part-time 37360 88.5
27.2 62385 94.
745.
4
Total 42230 100 24.8 65880 100 38.
6Postgraduate research
Full-time 11010 82.8
39.4 3145 46.
511.
2
Part-time 2290 17.2
34.8 3615 53.
554.
9
Total 13305 100 38.5 6760 100 19.
6Postgraduate taught
Full-time 41630 53.6
23.8 11880 21.
7 6.8
Part-time 36040 46.4
37.7 42970 78.
345.
0
Total 77670 100 28.7 54850 100 20.
3
64

Unknown ageNo. %* %^
All levelsFull-time 15 3.2 0.0
Part-time 450 96.8
0.1
Total 465 100 0.0First degree undergraduateFull-time 5 .. 0.0Part-time 20 .. 0.0Total 25 .. 0.0Other undergraduateFull-time 0 0.3 0.0
Part-time 370 99.7 0.3
Total 370 100 0.2Postgraduate researchFull-time 5 .. 0.0Part-time 5 .. 0.1Total 10 .. 0.0Postgraduate taughtFull-time 5 8.2 0.0
Part-time 55 91.8 0.1
Total 60 100 0.0
* within an age group, the percentage of students in a mode (compare vertically within a degree level)^ within a degree level and mode, the percentage of students in an age group (compare horizontally)
65

.. Percentages based on totals of 52 or less are not shown. Percentages based on total number of students minus those whose degree level, mode or age group is unknown.
First year full-time/part-time students
21 and under
22-25
26-35
36 and over
All full-time 59.5 23.5 12.2 *All part-time 9.5 15.3 31.7 43.5All students 43.9 21.0 18.3 16.8Full-time first degree undergraduates
82.4 8.9 5.6 *
Part-time first degree undergraduates
13.0 19.0 32.3 35.7
All first degree undergraduates
73.7 10.1 9.0 7.2
Full-time other undergraduates
55.1 19.7 14.7 10.5
Part-time other undergraduates
13.7 13.7 27.2 45.4
All other undergraduates 21.7 14.9 24.8 38.6
Full-time research postgraduates 45.3 39.4 11.2
Part-time research postgraduates 9.8 34.8 54.9
All research postgraduates 38.5 38.5 19.6
Full-time taught postgraduates 12.4 57.1 23.8 6.8
66

Part-time postgraduates 15.4 37.7 45.0
All taught postgraduates 8.7 42.4 28.7 20.3
* values less than 5.0 are not displayed
Subjects
39.7% of students aged 36 and over studied SET subjects compared with 43.2% of those aged 21 and under.
However, there was considerable variation in age profiles by subject. For example, 46.3% of students studying combined studies and 29.0% in education were aged 36 and over, compared with 3.1% of students studying veterinary science and 4.2% of those in mass communications and documentation.
There was also considerable subject variation between age groups. For example, 7.1% of students aged 21 and under study subjects allied to medicine compared with 22.8% aged 36 and over. 4.1% of students aged 21 and under study education compared with 15.2% aged 36 and over.
1.6 All students by subject area and age group
21 and under 22-25No. %* %^ No. %* %^
SETAgriculture and related subjects
10745 0.9 56.6 2665 0.7 14.
0
67

Architecture, building, and planning
28075 2.2 53.3 11650 3.2 22.
1
Biological sciences 133480 10.
666.
2 24335 6.7 12.1
Computer science 54150 4.3 60.
5 14650 4.0 16.4
Engineering and technology 92275 7.3 58.
4 30605 8.4 19.4
Mathematical sciences 30205 2.4 71.
5 4695 1.3 11.1
Medicine and dentistry 38715 3.1 58.
0 10535 2.9 15.8
Physical sciences 62580 5.0 67.
3 14290 3.9 15.4
Subjects allied to medicine 89335 7.1 31.
9 41750 11.5
14.9
Veterinary science 3825 0.3 66.
4 1000 0.3 17.3
SET total 543380 43.2
53.9
156170
42.8
15.5
Non-SETBusiness, administrative studies
179220 14.3
53.1 71085 19.
521.
1
Combined 11610 0.9 16.2 8035 2.2 11.
2Creative arts and design 128150 10.
274.
1 20570 5.6 11.9
Education 51465 4.1 28.6 32910 9.0 18.
3Historical, 53480 4.3 57. 9380 2.6 10.
68

philosophical studies 7 1
Languages 82425 6.6 66.4 15265 4.2 12.
3
Law 54500 4.3 61.1 13975 3.8 15.
7Mass communications, documentation
36850 2.9 73.1 7555 2.1 15.
0
Social studies 115955 9.2 54.4 29590 8.1 13.
9
Non-SET total 713655 56.8
53.6
208370
57.2
15.7
Total 1257030 100 53.
736454
0 100 15.6
26-35 36 and overNo. %* %^ No. %* %^
SETAgriculture and related subjects 3095 0.8 16.
3 2485 0.7 13.1
Architecture, building, and planning
8735 2.3 16.6 4235 1.2 8.0
Biological sciences 2510 6.7 12.
5 18485 5.4 9.2
Computer science 13880 3.7 15.
5 6810 2.0 7.6
Engineering and technology 23870 6.4 15.
1 11365 3.3 7.2
Mathematical 3710 1.0 8.8 3625 1.1 8.6
69

sciencesMedicine and dentistry 12630 3.4 18.
9 4870 1.4 7.3
Physical sciences 9990 2.7 10.
7 6185 1.8 6.6
Subjects allied to medicine 70465 18.
825.
2 78355 22.8
28.0
Veterinary science 760 0.2 13.
2 180 0.1 3.1
SET total 172340
46.1
17.1
136590
39.7
13.5
Non-SETBusiness, administrative studies
52100 13.9
15.4 34820 10.
110.
3
Combined 18730 5.0 26.2 33100 9.6 46.
3Creative arts and design 13435 3.6 7.8 10685 3.1 6.2
Education 43350 11.6
24.1 52145 15.
229.
0Historical, philosophical studies
10355 2.8 11.2 19515 5.7 21.
0
Languages 12705 3.4 10.2 13710 4.0 11.
0
Law 12360 3.3 13.9 8355 2.4 9.4
Mass communications, documentation
3905 1.0 7.7 2110 0.6 4.2
Social studies 34940 9.3 16. 32850 9.6 15.
70

4 4
Non-SET total 201880
53.9
15.2
207285
60.3
15.6
Total 374220 100 16.
034387
5 100 14.7
* within an age group, the percentage of students in a subject area (compare vertically)^ within a subject area, the percentage of students in an age group (compare horizontally) Percentages based on total number of students minus those whose subject area or age group is unknown
With the exception of those aged 36 and over, the proportion of students studying non-SET subjects was higher among first year students than all students in all age groups. For example, 63.5% of first year students aged 22–25 studied non-SET subjects compared with 57.2% of all students, a difference of 6.3% (see fig. 1.6).
71

1.7 First year students by subject area and age group
72
73
21 and under 22-25No. %* %^ No. %* %^
SET
Agriculture and related subjects
3750 0.9 45.5 1495 0.7 18.1
Architecture, building, and planning
8595 2.0 43.3 5825 2.9 29.4
Biological sciences 45835 10.
7 61.0 11395 5.6 15.2
Computer science 18365 4.3 53.6 7400 3.6 21.6
Engineering and technology
30200 7.1 48.8 16135 7.9 26.1
Mathematical sciences 9750 2.3 68.0 2450 1.2 17.1
Medicine and dentistry 8180 1.9 42.4 3650 1.8 18.9
Physical sciences 19920 4.7 61.3 6335 3.1 19.5
Subjects allied to medicine 28140 6.6 22.4 1928
0 9.5 15.3
Veterinary science 860 0.2 59.8 265 0.1 18.6
SET total 173600
40.7 44.2 7422
5 36.5 18.9
Non-SETBusiness, administrative studies
65350 15.3 42.5 47100 23.
1 30.6
Combined 7145 1.7 17.9 4875 2.4 12.2Creative arts and design 43275 10.
1 67.2 10545 5.2 16.4
Education 20890 4.9 22.4 22575 11.1 24.2

74

75
26-35 36 and overNo. %* %^ No. %* %^
SET
Agriculture and related subjects
1600 0.9 19.4 1400 0.9 16.9
Architecture, building, and planning
3830 2.2 19.3 1595 1.0 8.0
Biological sciences 10315 5.8 13.7 7575 4.6 10.1
Computer science 5790 3.3 16.9 2710 1.7 7.9
Engineering and technology
10630 6.0 17.2 4960 3.0 8.0
Mathematical sciences 1270 0.7 8.8 875 0.5 6.1
Medicine and dentistry 5100 2.9 26.5 2340 1.4 12.1
Physical sciences 4045 2.3 12.4 2215 1.4 6.8
Subjects allied to medicine 34275 19.
3 27.2 44125 27.0 35.1
Veterinary science 245 0.1 17.1 65 0.0 4.5
SET total 77100 43.4 19.6 6786
0 41.6 17.3
Non-SETBusiness, administrative studies
26030 14.7 16.9 15295 9.4 9.9
Combined 10485 5.9 26.2 17470 10.7 43.7
Creative arts and design 6280 3.5 9.8 4255 2.6 6.6
Education 23480 13. 25.2 26400 16. 28.3

* within an age group, the percentage of students in a subject area (compare vertically)^ within a subject area, the percentage of students in an age group (compare horizontally) Percentages based on total number of students minus those whose subject area or age group is unknown.
All students in subject areas by age group
21 and under
22-25 26-35
36 and over
Agriculture and related subjects 56.6 14.0 16.
3 13.1
Architecture, building, and planning 53.3 22.1 16.
6 8.0
Biological sciences 66.2 12.1 12.5 9.2
Computer science 60.5 16.4 15.5 7.6
Engineering and technology 58.4 19.4 15.1 7.2
Mathematical sciences 71.5 11.1 8.8 8.6
Medicine and dentistry 58.0 15.8 18.9 7.3
Physical sciences 67.3 15.4 10.7 6.6
Subjects allied to medicine 31.9 14.9 25.2 28.0
Veterinary science 66.4 17.3 13.2 *
SET total 53.9 15.5 17. 13.576
1Business, administrative studies 53.1 21.1 15.
4 10.3
Combined 16.2 11.2 26.2 46.3
Creative arts and design 74.1 11.9 7.8 6.2
Education 28.6 18.3 24.1 29.0
Historical, philosophical studies 57.7 10.1 11.
2 21.0
Languages 66.4 12.3 10.2 11.0
Law 61.1 15.7 13.9 9.4
Mass communications, documentation 73.1 15.0 7.7
Social studies 54.4 13.9 16.4 15.4
Non-SET total 53.6 15.7 15.2 15.6
* values less than 5.0 are not displayed
First year students in subject areas by age group
21 and under
22-25
26-35
36 and over
Agriculture and related subjects 45.5 18.1 19.4 16.9
Architecture, building, and 43.3 29.4 19.3 8.0
77

planningBiological sciences 61.0 15.2 13.7 10.1Computer science 53.6 21.6 16.9 7.9Engineering and technology 48.8 26.1 17.2 8.0Mathematical sciences 68.0 17.1 8.8 6.1Medicine and dentistry 42.4 18.9 26.5 12.1Physical sciences 61.3 19.5 12.4 6.8Subjects allied to medicine 22.4 15.3 27.2 35.1Veterinary science 59.8 18.6 17.1 *SET total 44.2 18.9 19.6 17.3Business, administrative studies 42.5 30.6 16.9 9.9
Combined 17.9 12.2 26.2 43.7Creative arts and design 67.2 16.4 9.8 6.6Education 22.4 24.2 25.2 28.3Historical, philosophical studies 53.2 14.2 11.8 20.8
Languages 56.3 19.2 12.2 12.3Law 50.7 22.9 16.7 9.7Mass communications, documentation 62.0 24.0 9.7
Social studies 45.6 19.2 18.5 16.8Non-SET total 43.8 22.4 17.4 16.5
* values less than 5.0 are not displayed
Overall, the age profile of first degree undergraduates was relatively young, with three quarters (74.5% of SET students and 76.7% of non-SET students) aged 21 and under.
78

Other undergraduates had a considerably older age profile than first degree undergraduates. Over a third (35.5% of SET students and 37.7% of non-SET students) of other undergraduates were aged 36 and over, while around a quarter (23.1% of SET students and 25.4% of non-SET students) were aged 21 and under.
At other undergraduate level, the subjects with the highest proportion of students aged 36 and over were historical and philosophical studies (67.9%), combined studies (48.6%), education (44.7%) and subjects allied to medicine (44.6%).
1.8 All undergraduates by subject area, degree level and age group
First degree undergraduate21 and under 22-25No. % No. %
SETAgriculture and related subjects 7690 83.3 620 6.7
Architecture, building, and planning 25755 76.8 4090 12.2
Biological sciences 126540 80.0 10750 6.8Computer science 50025 74.7 7225 10.8Engineering and technology 83570 80.4 9835 9.5
Mathematical sciences 29575 83.3 1370 3.9
Medicine and dentistry 37910 82.3 5705 12.4
Physical sciences 60085 85.8 3225 4.6Subjects allied to 79335 53.5 19570 13.2
79
medicineVeterinary science 3785 78.3 790 16.3SET total 504275 74.5 63175 9.3Non-SETBusiness, administrative studies 162045 80.1 20790 10.3
Combined 5865 16.9 4050 11.7Creative arts and design 120470 85.8 10405 7.4
Education 42040 68.6 5600 9.1Historical, philosophical studies 51435 74.6 3350 4.9
Languages 75765 82.9 4790 5.2Law 51635 78.3 5335 8.1Mass communications, documentation
34865 89.9 2495 6.4
Social studies 108735 73.4 10525 7.1Non-SET total 652855 76.7 67340 7.9Total 1157130 75.7 130510 8.5
First degree undergraduate26-35 36 and overNo. % No. %
SETAgriculture and related subjects 535 5.8 385 4.2
Architecture, building, and planning 2530 7.5 1170 3.5
Biological sciences 12120 7.7 8720 5.5Computer science 6585 9.8 3165 4.7
80
Engineering and technology 7455 7.2 3120 3.0
Mathematical sciences 2000 5.6 2560 7.2Medicine and dentistry 2155 4.7 285 0.6Physical sciences 3760 5.4 2960 4.2Subjects allied to medicine 27345 18.4 22135 14.9
Veterinary science 230 4.7 35 0.7SET total 64715 9.6 44530 6.6Non-SETBusiness, administrative studies 12595 6.2 6835 3.4
Combined 9580 27.7 15140 43.7Creative arts and design 5395 3.8 4145 3.0
Education 6710 10.9 6970 11.4Historical, philosophical studies 4940 7.2 9180 13.3
Languages 5200 5.7 5610 6.1Law 5130 7.8 3855 5.8Mass communications, documentation
995 2.6 435 1.1
Social studies 14840 10.0 13980 9.4Non-SET total 65390 7.7 66150 7.8Total 130105 8.5 110680 7.2
Other undergraduate21 and under 22-25No. % No. %
SET
81

Agriculture and related subjects 2855 43.3 940 14.2
Architecture, building, and planning 1620 34.2 1235 26.1
Biological sciences 4040 37.2 1290 11.9Computer science 2975 49.6 770 12.8Engineering and technology 6470 42.4 2760 18.1
Mathematical sciences 145 14.9 140 14.3Medicine and dentistry 145 25.4 155 27.1Physical sciences 1185 31.3 445 11.8Subjects allied to medicine 8775 12.0 9955 13.6
Veterinary science 5 13.0 5 13.0SET total 28215 23.1 17690 14.5Non-SETBusiness, administrative studies 9610 32.9 4675 16.0
Combined 5735 16.3 3740 10.6Creative arts and design 6280 60.0 1280 12.2
Education 4915 15.2 5015 15.5Historical, philosophical studies 750 11.1 450 6.7
Languages 5525 32.7 3810 22.5Law 630 24.5 620 24.0Mass communications, documentation 1055 62.5 230 13.5
Social studies 4350 24.9 2250 12.9Non-SET total 38850 25.4 22070 14.4Total 67065 24.4 39765 14.5
82

Other undergraduate26-35 36 and overNo. % No. %
SETAgriculture and related subjects 1355 20.5 1445 21.9
Architecture, building, and planning 1130 23.9 745 15.8
Biological sciences 2355 21.7 3180 29.3Computer science 1215 20.2 1035 17.3Engineering and technology 3460 22.7 2580 16.9
Mathematical sciences 305 31.5 375 39.2Medicine and dentistry 175 30.6 95 16.9Physical sciences 945 24.9 1210 32.0Subjects allied to medicine 21885 29.9 32695 44.6
Veterinary science 25 42.6 15 31.5SET total 32845 26.9 43385 35.5Non-SETBusiness, administrative studies 7015 24.0 7905 27.1
Combined 8635 24.5 17125 48.6Creative arts and design 1235 11.8 1680 16.0Education 8000 24.7 14490 44.7Historical, philosophical studies 975 14.3 4605 67.9
Languages 2830 16.7 4745 28.1Law 750 29.1 580 22.5Mass communications, 240 14.3 165 9.6
83

documentationSocial studies 4640 26.6 6235 35.7Non-SET total 34320 22.5 57525 37.7Total 67165 24.4 100910 36.7
Percentages based on total number of students minus those whose subject area, degree level or age group is unknown.
Overall, research postgraduates studying SET subjects had a younger age profile than those studying non-SET subjects. The opposite was true of taught postgraduates.
At research postgraduate level, particularly high proportions of students studying mathematical sciences (63.7%) and physical sciences (67.3%) were aged 25 and under. In contrast, only 17.6% of research postgraduates in architecture, building and planning and in business and administrative studies were aged 25 and under.
Age profiles also varied by subject at taught postgraduate level. High proportions of taught postgraduates studying mathematical sciences (63.8%), mass communications and documentation (62.6%) and languages (57.1%) were aged 25 and under. In contrast, only 15.5% of taught postgraduates in combined studies and 19.6% in medicine and dentistry were in this age group.
1.9 All postgraduates by subject area, degree level and age group
Research postgraduate21 and under 22-25No. % No. %
SET84

Agriculture and related subjects 35 3.7 285 30.
7Architecture, building, and planning 10 0.5 340 17.
1
Biological sciences 910 6.9 5730 43.7
Computer science 150 3.3 1550 34.6
Engineering and technology 390 2.9 6505 48.
1
Mathematical sciences 95 3.5 1615 60.2
Medicine and dentistry 325 3.7 2780 31.9
Physical sciences 415 3.5 7465 63.8
Subjects allied to medicine 335 4.6 2380 32.
5
Veterinary science 15 4.9 85 25.2
SET total 2675 4.1 28730 44.4
Non-SETBusiness, administrative studies 25 0.4 1160 17.
2Combined 0 .. 5 ..Creative arts and design 45 1.1 690 17.
6Education 20 0.3 545 7.9Historical, philosophical studies 110 1.5 2275 30.
6Languages 80 1.4 2160 35.
85

4
Law 35 1.5 575 25.0
Mass communications, documentation 5 0.3 250 21.
7
Social studies 105 1.1 2625 26.7
Non-SET total 430 1.0 10285 23.2
Total 3110 2.8 39015 35.8
Research Postgraduate26-35 36 and overNo. % No. %
SETAgriculture and related subjects 450 48.6 155 17.
0Architecture, building, and planning 985 49.9 640 32.
5
Biological sciences 4655 35.5 1805 13.8
Computer science 2035 45.6 735 16.5
Engineering and technology 5000 37.0 1630 12.
0Mathematical sciences 775 28.8 205 7.5
Medicine and dentistry 4585 52.7 1020 11.7
Physical sciences 2970 25.4 845 7.2Subjects allied to medicine 2430 33.2 2175 29.
786

Veterinary science 190 56.1 45 13.7
SET total 24070 37.2 9260 14.3
Non-SETBusiness, administrative studies 2855 42.4 2690 40.
0Combined 15 .. 5 ..Creative arts and design 1600 40.8 1590 40.
5
Education 2015 29.3 4290 62.4
Historical, philosophical studies 2535 34.1 2515 33.
8
Languages 2455 40.3 1400 23.0
Law 1065 46.3 620 27.1
Mass communications, documentation 495 43.1 400 35.
0
Social studies 4485 45.7 2610 26.6
Non-SET total 17520 39.5 16135 36.4
Total 41590 38.1 25395 23.3
87

Taught postgraduate21 and under 22-25No. % No. %
SETAgriculture and related subjects 165 7.3 825 36.
8Architecture, building, and planning 690 5.6 5990 48.
1
Biological sciences 1985 10.2 6565 33.8
Computer science 1005 8.3 5110 42.4
Engineering and technology 1840 7.3 11505 45.
4
Mathematical sciences 395 12.8 1570 51.0
Medicine and dentistry 340 3.0 1900 16.6
Physical sciences 895 11.9 3150 41.9
Subjects allied to medicine 890 1.7 9850 19.
4
Veterinary science 15 2.4 120 22.3
SET total 8210 5.7 46575 32.1
Non-SETBusiness, administrative studies 7540 7.6 44460 44.
9
Combined 10 0.6 235 14.9
Creative arts and 1355 7.5 8195 45.88

design 5
Education 4485 5.7 21750 27.4
Historical, philosophical studies 1185 12.3 3305 34.
4
Languages 1050 10.8 4505 46.3
Law 2195 12.0 7450 40.6
Mass communications, documentation 925 10.5 4585 52.
1
Social studies 2765 7.3 14190 37.4
Non-SET total 21515 7.6 108675 38.5
Total 29725 7.0 155250 36.3
Postgraduate taught26-35 36 and overNo. % No. %
SETAgriculture and related subjects 755 33.7 495 22.
2Architecture, building, and planning 4085 32.8 1675 13.
5
Biological sciences 6085 31.3 4775 24.6
Computer science 4050 33.6 1875 15.6
Engineering and technology 7955 31.4 4035 15.
9
89

Mathematical sciences 630 20.5 485 15.7
Medicine and dentistry 5715 50.0 3470 30.4
Physical sciences 2315 30.8 1165 15.5
Subjects allied to medicine 18805 36.9 21350 42.
0
Veterinary science 320 60.3 80 15.0
SET total 50710 35.0 39415 27.2
Non-SETBusiness, administrative studies 29630 29.9 17390 17.
6
Combined 505 32.0 830 52.5
Creative arts and design 5200 28.9 3265 18.
1
Education 26625 33.6 26395 33.3
Historical, philosophical studies 1905 19.8 3210 33.
4
Languages 2220 22.8 1950 20.1
Law 5420 29.5 3295 17.9
Mass communications, documentation 2170 24.7 1110 12.
6
Social studies 10970 28.9 10025 26.4
Non-SET total 84645 30.0 67475 23.
90

9
Total 135355 31.7 106890 25.
0
Percentages based on totals of 52 or less are not shown.Percentages based on total number of students minus those whose subject area, degree level or age group is unknown.
All students in SET subject areas and degree levels by age group
21 and under
22-25
26-35
36 and under
Agriculture and related subjectsFirst degree UG 83.3 6.7 5.8 *Other UG 43.3 14.2 20.5 21.9Research PG 30.7 48.6 17.0Taught PG 7.6 36.8 33.7 22.2Architecture, building, and planningFirst degree UG 76.8 12.2 7.5Other UG 34.2 26.1 23.9 15.8Research PG 17.1 49.9 32.5Taught PG 5.6 48.1 32.8 13.5Biological sciencesFirst degree UG 80.0 6.8 7.7 5.5Other UG 37.2 11.9 21.7 29.3Research PG 6.9 43.7 35.5 13.8Taught PG 10.2 33.8 31.3 24.6Computer science
91

First degree UG 74.7 10.8 9.8Other UG 49.6 12.8 20.2 17.3Research PG 34.6 45.6 16.5Taught PG 8.3 42.4 33.6 15.6Engineering and technologyFirst degree UG 80.4 9.5 7.2Other UG 42.4 18.1 22.7 16.9Research PG 48.1 37.0 12.0Taught PG 7.3 45.4 31.4 15.9Mathematical sciencesFirst degree UG 83.3 5.6 7.2Other UG 14.9 14.3 31.5 39.2Research PG 60.2 28.8 7.5Taught PG 12.8 51.0 20.5 15.7Medicine and dentistryFirst degree UG 82.3 12.4Other UG 25.4 27.1 30.6 16.9Research PG 31.9 52.7 11.7Taught PG 16.6 50.0 30.4Physical sciencesFirst degree UG 85.8 5.4Other UG 31.3 11.8 24.9 32.0Research PG 63.8 25.4 7.2Taught PG 11.9 41.9 30.8 15.5Subjects allied to medicineFirst degree UG 53.5 13.2 18.4 14.9Other UG 12.0 13.6 29.9 44.6Research PG 32.5 33.2 29.7Taught PG 19.4 36.9 42.0Veterinary science
92

First degree UG 78.3 16.3Other UG 13.0 13.0 42.6 31.5Research PG 25.2 56.1 13.7Taught PG 22.3 60.3 15.0SET totalFirst degree UG 74.5 9.3 9.6 6.6Other UG 23.1 14.5 26.9 35.5Research PG 44.4 37.2 14.3Taught PG 5.7 32.1 35.0 27.2
* values less than 5.0 are not displayed
All students in non-SET subject areas and degree levels by age group
21 and under
22-25
26-35
36 and over
Business, administrative studiesFirst degree UG 80.1 10.3 6.2 *Other UG 32.9 16.0 24.0 27.1Research PG 17.2 42.4 40.0Taught PG 7.6 44.9 29.9 17.6CombinedFirst degree UG 16.9 11.7 27.7 43.7Other UG 16.3 10.6 24.5 48.6Research PG ..Taught PG 14.9 32.0 52.5Creative arts and designFirst degree UG 85.8 7.4Other UG 60.0 12.2 11.8 16.0
93

Research PG 17.6 40.8 40.5Taught PG 7.5 45.5 28.9 18.1EducationFirst degree UG 68.6 9.1 10.9 11.4Other UG 15.2 15.5 24.7 44.7Research PG 7.9 29.3 62.4Taught PG 5.7 27.4 33.6 33.3Historical, philosophical studiesFirst degree UG 74.6 7.2 13.3Other UG 11.1 6.7 14.3 67.9Research PG 30.6 34.1 33.8Taught PG 12.3 34.4 19.8 33.4LanguagesFirst degree UG 82.9 5.2 5.7 6.1Other UG 32.7 22.5 16.7 28.1Research PG 35.4 40.3 23.0Taught PG 10.8 46.3 22.8 20.1LawFirst degree UG 78.3 8.1 7.5 5.8Other UG 24.5 24.0 29.1 22.5Research PG 25.0 46.3 27.1Taught PG 12.0 40.6 29.5 17.9Mass communications, documentationFirst degree UG 89.9 6.4Other UG 62.5 13.5 14.3 9.6Research PG 21.7 43.1 35.0Taught PG 10.5 52.1 24.7 12.6Social studiesFirst degree UG 73.4 7.1 10.0 9.4Other UG 24.9 12.9 26.6 35.7
94

Research PG 26.7 45.7 26.6Taught PG 7.6 37.4 28.9 26.4Non-SET totalFirst degree UG 76.7 7.9 7.7 7.5Other UG 25.4 14.4 22.5 37.7Research PG 23.2 39.5 36.4Taught PG 7.6 38.5 30.0 23.9
* values less than 5.0 are not displayed.. percentages based on totals of 52 or less are not shown
First year first degree undergraduates have a very similar age profile to the overall first degree undergraduate population (see fig. 1.8). Business and administrative studies was the notable exception, where 74.7% of first year students were aged 21 and under compared with 80.1% of all students.
There is greater variation between the age profiles of first year students and all students among other undergraduates. For example, among other undergraduates studying SET subjects, the proportion of students aged 21 and under was lower among first year students (16.2%) than all other undergraduates (23.1%) (see fig. 1.8).
33.4% of first year other undergraduates in agriculture and related subjects were aged 21 and under compared with 43.3% of all other undergraduates studying this subject. 27.8% of first year other undergraduates in mathematical sciences were aged 21 and under compared with 14.9% of all other undergraduates (see fig. 1.8).
95

1.10 First year undergraduates by subject area, degree level and age group
First degree undergraduate21 and under 22-25No. % No. %
SETAgriculture and related subjects 2390 82.4 235 8.1
Architecture, building, and planning 7455 75.1 1370 13.8
Biological sciences 41770 79.8 4035 7.7Computer science 16145 72.3 2875 12.9Engineering and technology 25125 77.6 3780 11.7
Mathematical sciences 9270 86.1 455 4.2Medicine and dentistry 7700 80.5 1325 13.8Physical sciences 18355 86.8 1100 5.2Subjects allied to medicine 26010 49.9 7270 13.9
Veterinary science 835 79.1 165 15.6SET total 155060 72.3 22615 10.5Non-SETBusiness, administrative studies 54745 74.7 10630 14.5
Combined 1750 17.7 1350 13.7Creative arts and design 3930 84.5 4020 8.6
Education 13835 64.1 2145 9.9Historical, philosophical studies 15660 78.2 960 4.8
96

Languages 21690 83.6 1555 6.0Law 16920 75.8 2145 9.6Mass communications, documentation 11485 88.3 1055 8.1
Social studies 34565 71.9 3740 7.8Non-SET total 209955 74.8 27605 9.8Total 365020 73.7 50220 10.1
First degree undergraduate26-35 36 and overNo. % No. %
SETAgriculture and related subjects 170 5.9 105 3.6
Architecture, building, and planning 745 7.5 355 3.6
Biological sciences 3905 7.5 2645 5.1Computer science 2280 10.2 1030 4.6Engineering and technology 2530 7.8 935 2.9
Mathematical sciences 515 4.8 530 4.9Medicine and dentistry 470 4.9 70 0.7Physical sciences 1020 4.8 665 3.1Subjects allied to medicine 10155 19.5 8695 16.7
Veterinary science 45 4.4 10 0.9SET total 21830 10.2 15040 7.0Non-SETBusiness, administrative studies 5245 7.2 2705 3.7
Combined 2700 27.3 4090 41.3
97

Creative arts and design 1960 4.2 1255 2.7
Education 2625 12.2 2990 13.8Historical, philosophical studies 1305 6.5 2105 10.5
Languages 1375 5.3 1305 5.0Law 1885 8.4 1365 6.1Mass communications, documentation 355 2.7 110 0.9
Social studies 5055 10.5 4705 9.8Non-SET total 22505 8.0 20635 7.4Total 44335 9.0 35680 7.2
Other undergraduate21 and under 22-25No. % No. %
SETAgriculture and related subjects 1240 33.4 600 16.2
Architecture, building, and planning 685 34.0 605 29.9
Biological sciences 2230 33.0 860 12.7Computer science 1480 47.2 415 13.2Engineering and technology 3500 39.6 1525 17.3
Mathematical sciences 105 27.8 65 17.5Medicine and dentistry 80 27.7 65 23.5Physical sciences 695 32.3 270 12.6Subjects allied to medicine 1370 3.2 5220 12.1
Veterinary science 5 .. 5 ..
98

SET total 11395 16.2 9635 13.7Non-SETBusiness, administrative studies 4870 31.6 2745 17.8
Combined 5385 18.7 3305 11.5Creative arts and design 2975 56.4 695 13.2
Education 2890 15.2 3080 16.2Historical, philosophical studies 495 12.8 300 7.8
Languages 5135 35.7 3530 24.5Law 485 27.0 490 27.3Mass communications, documentation 455 56.6 135 16.9
Social studies 2940 26.8 1465 13.4Non-SET total 25630 25.6 15750 15.7Total 37025 21.7 25385 14.9
Other undergraduate26-35 36 and overNo. % No. %
SETAgriculture and related subjects 875 23.5 1005 27.0
Architecture, building, and planning 445 22.2 280 14.0
Biological sciences 1545 22.9 2115 31.3Computer science 610 19.4 630 20.1Engineering and technology 2040 23.1 1775 20.1
Mathematical sciences 110 28.9 100 25.8
99

Medicine and dentistry 90 31.2 50 17.5Physical sciences 515 23.8 680 31.4Subjects allied to medicine 13305 31.0 23090 53.7
Veterinary science 5 .. 5 ..SET total 19540 27.8 29730 42.3Non-SETBusiness, administrative studies 3835 24.9 3980 25.8
Combined 7340 25.6 12685 44.2Creative arts and design 680 12.9 915 17.4
Education 4430 23.3 8605 45.3Historical, philosophical studies 560 14.5 2500 64.8
Languages 2375 16.5 3340 23.2Law 455 25.4 360 20.2Mass communications, documentation 125 15.4 90 11.1
Social studies 2890 26.3 3670 33.5Non-SET total 22690 22.6 36150 36.1Total 42230 24.8 65880 38.6
.. Percentages based on totals of 52 or less are not shown.Percentages based on total number of students minus those whose subject area, degree level or age group is unknown.
Overall, the age profile of first year research postgraduates was younger than for all students at this degree level, with 42.0% aged 25 and under compared with 38.6% of all research postgraduates (see fig. 1.9).
100

However, there were some exceptions at subject level. For example, among research postgraduates studying veterinary science, a lower proportion of first year students (24.3%) were aged 25 and under than all research postgraduates (30.1%).
The age profile of first year taught postgraduates was also younger than for taught postgraduates overall (51.1% and 43.3% respectively aged 25 and under). This was particularly the case for mathematical sciences, veterinary science and historical and philosophical studies.
1.11 First year postgraduates by subject area, degree level and age group
Research postgraduate21 and under 22-25No. % No. %
SETAgriculture and related subjects 15 5.6 90 31.
8Architecture, building, and planning 0 0.3 120 18.
5
Biological sciences 325 7.7 1895 44.6
Computer science 45 3.0 530 36.9
Engineering and technology 120 2.7 2145 49.
1
Mathematical sciences 30 3.1 565 62.0
Medicine and dentistry 110 4.1 900 33.4
101

Physical sciences 145 3.8 2505 65.4
Subjects allied to medicine 165 7.0 890 37.
5
Veterinary science 5 4.6 25 19.7
SET total 960 4.6 9660 46.2
Non-SETBusiness, administrative studies 10 0.4 405 19.
9Combined 0 .. 5 ..Creative arts and design 25 2.1 225 19.
7
Education 10 0.5 265 14.4
Historical, philosophical studies 65 2.7 785 33.
4
Languages 50 2.5 805 38.5
Law 20 2.9 185 26.2
Mass communications, documentation 0 0.5 85 23.
0
Social studies 55 1.7 890 28.4
Non-SET total 235 1.7 3645 26.7
Total 1195 3.5 13310 38.5
Research postgraduate
102

26-35 36 and overNo. % No. %
SETAgriculture and related subjects 130 45.9 50 16.7
Architecture, building, and planning 330 51.5 190 29.8
Biological sciences 1550 36.5 480 11.2Computer science 660 46.1 200 14.0Engineering and technology 1670 38.2 435 9.9
Mathematical sciences 260 28.3 60 6.6Medicine and dentistry 1390 51.5 295 10.9Physical sciences 945 24.6 235 6.2Subjects allied to medicine 785 33.2 530 22.3
Veterinary science 70 60.0 20 15.7SET total 7790 37.3 2490 11.9Non-SETBusiness, administrative studies 870 42.9 745 36.8
Combined 5 .. 5 ..Creative arts and design 470 41.3 420 37.0
Education 605 32.6 975 52.5Historical, philosophical studies 820 34.8 685 29.1
Languages 820 39.3 410 19.7Law 325 46.3 170 24.6Mass communications, documentation 155 42.2 125 34.3
103

Social studies 1450 46.4 735 23.5Non-SET total 5515 40.3 4275 31.3Total 13305 38.5 6760 19.6
Taught postgraduate21 and under 22-25No. % No. %
SETAgriculture and related subjects 105 7.7 570 42.5
Architecture, building, and planning 450 6.2 3735 51.4
Biological sciences 1515 12.9 4600 39.1Computer science 695 9.4 3580 48.6Engineering and technology 1455 8.9 8680 53.1
Mathematical sciences 350 15.3 1365 59.7Medicine and dentistry 290 4.3 1360 20.2Physical sciences 720 13.4 2460 45.6Subjects allied to medicine 595 2.1 5895 20.8
Veterinary science 10 4.6 75 31.1SET total 6180 7.1 32315 37.1Non-SETBusiness, administrative studies 5730 9.1 33325 52.9
Combined 5 0.4 215 15.8Creative arts and design 970 8.5 5600 49.1
Education 4155 8.2 17085 33.6Historical, philosophical 920 15.4 2530 42.3
104

studiesLanguages 810 12.0 3560 52.7Law 1755 13.5 5855 44.9Mass communications, documentation 755 12.0 3630 57.7
Social studies 2125 8.5 10570 42.5Non-SET total 17230 9.4 82365 44.9Total 23410 8.7 114680 42.4
Taught postgraduate26-35 36 and overNo. % No. %
SET
Agriculture and related subjects 430 32.0 240 17.9
Architecture, building, and planning 2310 31.8 765 10.6
Biological sciences 3315 28.2 2340 19.9Computer science 2240 30.4 850 11.6Engineering and technology 4395 26.9 1820 11.1
Mathematical sciences 385 16.8 185 8.2Medicine and dentistry 3155 46.9 1925 28.6Physical sciences 1570 29.2 635 11.8Subjects allied to medicine 10030 35.4 11810 41.7
Veterinary science 125 51.9 30 12.4SET total 27945 32.1 20600 23.7Non-SETBusiness, 16085 25.5 7865 12.5
105

administrative studiesCombined 445 32.7 695 51.1Creative arts and design 3175 27.8 1660 14.6
Education 15825 31.1 13835 27.2Historical, philosophical studies 1110 18.5 1420 23.7
Languages 1400 20.8 980 14.5Law 3655 28.0 1765 13.6Mass communications, documentation 1360 21.6 545 8.7
Social studies 6680 26.9 5480 22.1Non-SET total 49725 27.1 34250 18.7Total 77670 28.7 54850 20.3
.. Percentages based on totals of 52 or less are not shown.Percentages based on total number of students minus those whose subject area, degree level or age group is unknown.
Continuation
Entrants refers to full-time first degree UK-domiciled 2011/12 entrants. Continuation data indicates the progress of these entrants to 2012/13.
Entrants aged 21 and under had both the highest rates of qualifying or continuing in their studies (92.0%) and rates of transfer (2.0%) among the age groups.
Continuation or qualification rates were lowest among entrants aged 22–25 (87.5%). This age group also had the
106

highest proportion of entrants no longer in higher education (11.0%).
Compared with 2011/12, the proportion of entrants who continued or qualified increased across all age groups [see fig. 4.12, ECU (2013)].
1.12 UK-domiciled full-time first degree entrants by continuation category and age group
Continue or qualify
Transfer No longer in HE
No. % No. % No. %21 and under 300460 92.0 6470 2.0 19660 6.0
22-25 23690 87.5 415 1.5 2970 11.026-35 19475 88.8 300 1.4 2160 9.836 and over 11845 89.0 165 1.2 1290 9.7
Total 355470 91.4 7350 1.9 26085 6.7
Percentages based on total number of students minus those whose continuation category or age group is unknown.
UK-domiciled full-time first degree entrants in age groups by continuation category
Continue or qualify
Transfer No longer in HE
21 and under 92.0 2.0 6.0
22-25 87.5 1.5 11.0
107

26-35 88.8 1.4 9.836 and over 89.0 1.2 9.7
Degree attainment
Qualifiers refers to first degree undergraduate qualifiers. Their ages are calculated at 31 July 2013, unlike other age data which refers to students’ ages on entry.
A higher proportion of fulltime qualifiers aged 21 and under achieved a first/2:1 than qualifiers in older age groups. The opposite was true of those studying part-time. 43.6% of part time qualifiers aged 21 and under received a first/2:1, compared with 59.8% of those aged 36 and over.
1.13 First degree undergraduate qualifiers by degree class, mode and age group
First 2:1 2:2 Third/pass
No. % No. % No. % No. %All first degree undergraduate qualifiers 21 and under
20150
16.5
68590
56.0
29680
24.2 4040 3.3
22-25
35920
18.9
91205
48.1
49990
26.3
12625 6.7
26-35 7870 20.
31606
541.
51091
028.
2 3830 9.9
36 and over
5685 20.5
11505
41.5 7565 27.
3 2970 10.7
108

Full-time21 and under
20120
16.5
68480
56.1
29555
24.2 3980 3.3
22-25
35055
19.4
88280
48.8
46600
25.8
10820 6.0
26-35 6110 21.
41225
042.
9 7840 27.5 2335 8.2
36 and over
2760 21.4 5775 43.
2 3630 28.1 950 7.4
Part-time21 and under
35 10.1 110 33.
5 125 38.4 60 18.
0
22-25 865 9.6 2925 32.
6 3390 37.7 1805 20.
126-35 1760 17.
3 3815 37.6 3075 30.
3 1500 14.8
36 and over
2925 19.8 5930 40.
0 3935 26.6 2020 13.
6
Percentages based on total number of students minus those whose degree class, mode or age group is unknown.
Full-time/part-time first degree undergraduate qualifiers in age groups by degree class
First 2:1 2:2 Third/passAll qualifiers 21 and under 16.5 56.0 24.2 *
109

All qualifiers 22-25 18.9 48.1 26.3 6.7All qualifiers 26-35 20.3 41.5 28.2 9.9All qualifiers 36 and over 20.5 41.5 27.3 10.7
Full-time 21 and under 16.5 56.1 24.2Full-time 22-25 19.4 48.8 25.8 6.0Full-time 26-35 21.4 42.9 27.5 8.2Full-time 36 and over 21.4 43.2 28.1 7.4Part-time 21 and under 10.1 33.5 38.4 18.0
Part-time 22-25 9.6 32.6 37.7 20.1Part-time 26-35 17.3 37.6 30.3 14.8Part-time 36 and over 19.8 40.0 26.6 13.6
* values less than 5.0 are not displayed
The degree attainment gap between age groups was widest in Wales, where 68.3% of qualifiers aged 21 and under received a first/2:1 compared with 56.2% of those aged 26–35 (a 12.1% gap).
With the exception of England, in all nations a higher proportion of qualifiers aged 36 and over achieved a first than any other age group.
1.14 First degree undergraduate qualifiers by country of institution, degree class and age group
First 2:1 2:2 Third/pass
No. % No. % No. % No. %England
110

21 and under
17985
16.8 60185 56.
12558
523.
8 3540 3.3
22-25
30275
19.2 75195 47.
64158
026.
31097
5 6.9
26-35 6755 20.
4 13580 41.1 9305 28.
1 3420 10.3
36 and over
5090 20.3 10355 41.
2 6875 27.4 2785 11.
1
Total
60110
18.6
159310
49.2
83340
25.8
20725 6.4
Northern Ireland21 and under
230 11.1 1220 58.
7 590 28.3 40 1.9
22-25 885 17.
6 2505 49.7 1390 27.
6 255 5.0
26-35 205 20.
9 495 50.9 220 22.
8 50 5.4
36 and over
125 24.5 260 50.
6 100 19.8 25 5.1
Total 1445 16.
8 4475 52.1 2305 26.
8 370 4.3
Scotland21 and under
825 16.2 2845 55.
7 24.8 24.8 165 3.3
111

22-25 3130 18.
7 9115 54.6 23.1 23.
1 610 3.7
26-35 495 22.
3 1045 46.9 24.9 24.
9 130 5.9
36 and over
190 23.2 350 42.
7 26.0 26.0 65 8.1
Total 4640 18.
7 13355 53.7 23.7 23.
7 975 3.9
Wales21 and under
1110 13.9 4340 54.
4 28.1 28.1 295 3.7
22-25 1630 16.
3 4390 44.0 31.8 31.
8 785 7.9
26-35 410 17.
0 950 39.2 34.4 34.
4 230 9.4
36 and over
280 21.6 545 42.
3 29.1 29.1 90 7.0
Total 3430 15.
8 10225 47.2 30.5 30.
5 1400 6.5
Percentages based on total number of students minus those whose country of institution, degree class or age group is unknown.
First degree undergraduate qualifiers in countries of institution and age groups by degree class
First
2:1 2:2 Third/pass
112

England 21 and under 16.8 56.1
23.8 *
England 22-25 19.2 47.6
26.3 6.9
England 26-35 20.4 41.1
28.1 10.3
England 36 and over 20.3 41.2
27.4 11.1
Northern Ireland 21 and under 11.1 58.
728.
3
Northern Ireland 22-25 17.6 49.7
27.6 5.0
Northern Ireland 26-35 20.9 50.9
22.8 5.4
Northern Ireland 36 and over 24.5 50.
619.
8 5.1
Scotland 21 and under 16.2 55.7
24.8
Scotland 22-25 18.7 54.6
23.1
Scotland 26-35 22.3 46.9
24.9 5.9
Scotland 36 and over 23.2 42.7
26.0 8.1
Wales 21 and under 13.9 54.4
28.1
Wales 22-25 16.3 44.0
31.8 7.9
Wales 26-35 17.0 39.2
34.4 9.4
Wales 36 and over 21.6 42.3
29.1 7.0
113

* values less than 5.0 are not displayed
Within SET subject areas, 70.2% of qualifiers aged 21 and under received a first/2:1 compared with 59.9% of those aged 36 and over. 73.7% of non-SET qualifiers aged 21 and under received a first/2:1 compared with 60.2% of non-SET qualifiers aged 26 35.
There were particularly large age degree attainment gaps in certain subjects. For example, 72.5% of qualifiers aged 21 and under studying law received a first/2:1, compared with 47.8% of those aged 36 and over (a 24.7% difference).
74.8% of qualifiers aged 21 and under studying subjects allied to medicine received a first/2:1, compared with 57.9% of those aged 36 and over (a 16.9% difference).
114
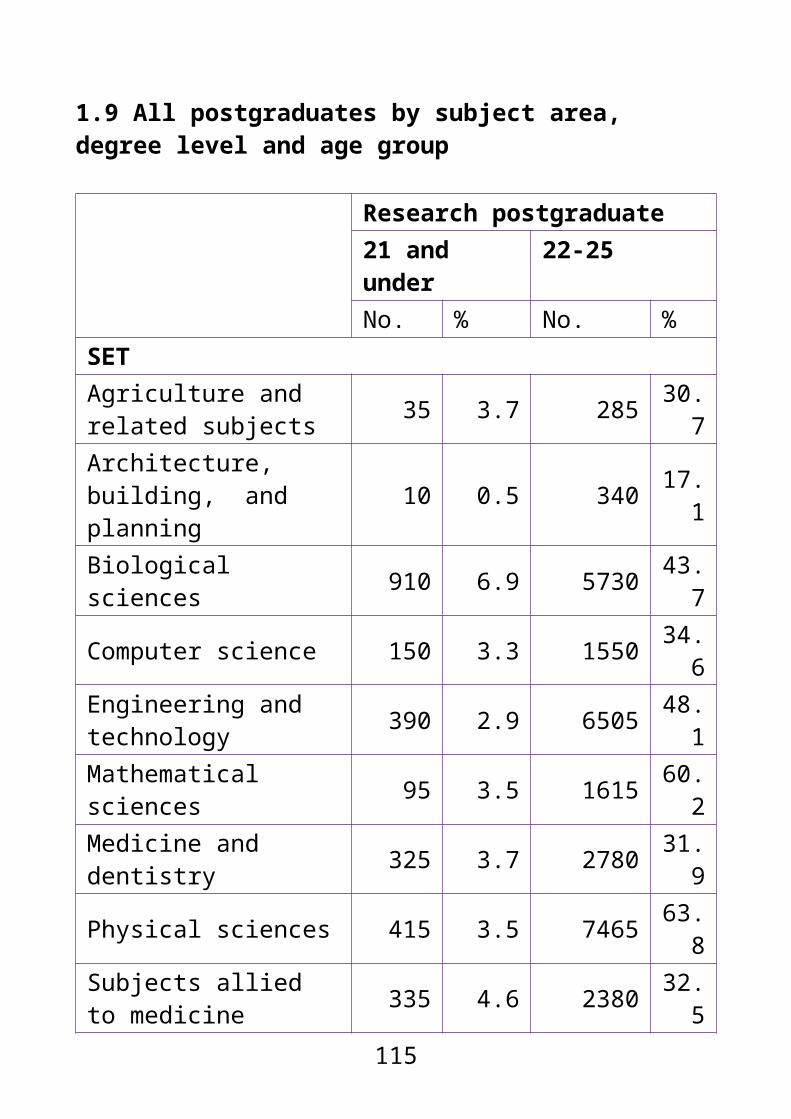
1.15 First degree undergraduate qualifiers by subject area, degree class and age group
First/2:121 and under 22-25
No. % No. %SETAgriculture and related subjects 485 61.3 920 63.7
Architecture, building, and planning 1430 67.8 3575 66.0
Biological sciences 12710 74.6 10415 64.8Computer science 2280 65.6 5380 62.0Engineering and technology 2595 65.2 11035 70.7
Mathematical sciences 2415 70.3 2940 69.5Medicine and dentistry 425 91.4 965 92.6Physical sciences 4060 67.9 6195 71.6Subjects allied to medicine 4470 74.8 9260 68.0
Veterinary science 15 .. 20 ..SET total 30885 70.2 50715 67.8Non-SETBusiness, administrative studies 10705 66.5 20685 58.4
Combined 285 76.6 480 66.9Creative arts and design 9380 73.0 15780 67.5Education 3140 64.2 4570 65.0Historical, philosophical studies 7025 84.1 5520 80.6
115

Languages 7075 82.4 10090 80.3Law 5345 72.5 4720 63.7Mass communications, documentation 3770 73.9 3575 65.7
Social studies 11130 74.8 11000 68.4Non-SET total 57855 73.7 76415 66.5Total 88740 72.5 127125 67.0
First/2:126-35 36 and overNo. % No. %
SETAgriculture and related subjects 170 64.7 105 64.
7Architecture, building, and planning 1060 68.2 340 64.
7
Biological sciences 1755 62.8 905 59.6
Computer science 1155 58.1 445 63.0
Engineering and technology 1755 64.2 575 64.
3
Mathematical sciences 150 63.3 215 71.1
Medicine and dentistry 55 78.1 10 ..
Physical sciences 500 61.3 385 63.8
Subjects allied to medicine 5270 64.4 4215 57.9
Veterinary science 5 .. 0 ..SET total 11880 63.7 7195 59.
116

9Non-SETBusiness, administrative studies 2580 51.8 1280 62.
1
Combined 310 53.4 705 56.5
Creative arts and design 2165 68.8 1080 77.1
Education 1550 60.3 1985 66.7
Historical, philosophical studies 700 70.1 1230 70.
4
Languages 910 69.0 795 74.1
Law 785 53.2 380 47.8
Mass communications, documentation 505 69.7 145 77.
1
Social studies 2540 60.3 2385 56.6
Non-SET total 12055 60.2 9990 63.6
Total 23935 61.9 17185 62.0
2:2/third/pass21 and under 22-25
No. % No. %SETAgriculture and related subjects 305 38.
7 525 36.3
117

Architecture, building, and planning 680 32.
2 1845 34.0
Biological sciences 5035 28.4 5655 35.
2
Computer science 1200 34.4 3300 38.
0
Engineering and technology 1385 34.8 4580 29.
3
Mathematical sciences 1020 29.7 1295 30.
5Medicine and dentistry 40 8.6 75 7.4
Physical sciences 1920 32.1 2460 28.
4
Subjects allied to medicine 1505 25.2 4365 32.
0Veterinary science 5 .. 5 .
SET total 13090
29.8
24100
32.2
Non-SETBusiness, administrative studies 5380 33.
51475
541.
6
Combined 90 23.4 235 33.
1
Creative arts and design 3465 27.0 7615 32.5
Education 1745 35.8 2460 35.
0Historical, philosophical studies 1330 15.
9 1330 19.4
Languages 1505 17.6 2475 19.
7Law 2025 27. 2685 36.
118

5 3Mass communications, documentation 1335 26.
1 1870 34.3
Social studies 3755 25.2 5095 31.
6
Non-SET total 20630
26.3
38515
33.5
Total 33720
27.5
62615
33.0
2:2/third/pass26-35 36 and overNo. % No. %
SETAgriculture and related subjects 95 35.3 55 35.3
Architecture, building, and planning 495 31.8 185 35.3
Biological sciences 1040 37.2 615 40.4Computer science 830 41.9 260 37.0Engineering and technology 980 35.8 320 35.7
Mathematical sciences 85 36.7 85 28.9Medicine and dentistry 15 21.9 10 ..Physical sciences 315 38.7 220 36.2Subjects allied to medicine 2915 35.6 3060 42.1
Veterinary science 5 .. 0 ..SET total 6775 36.3 4815 40.1Non-SETBusiness, administrative 2400 48.2 785 37.9
119
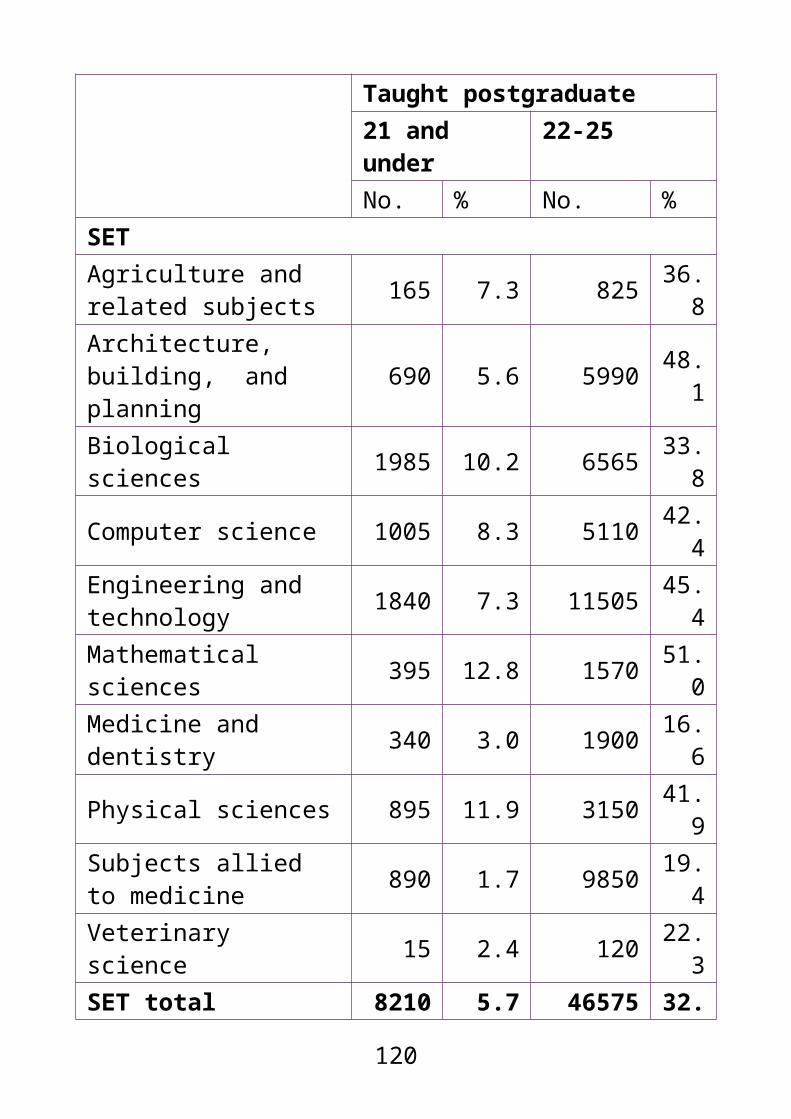
studiesCombined 270 46.6 545 43.5Creative arts and design 980 31.2 320 22.9Education 1020 39.7 990 33.3Historical, philosophical studies 300 29.9 515 29.6
Languages 410 31.0 280 25.9Law 690 46.8 415 52.2Mass communications, documentation 220 30.3 45 22.9
Social studies 1670 39.7 1830 43.4Non-SET total 7970 39.8 5715 36.4Total 14745 38.1 10530 38.0
.. Percentages based on totals of 52 or less are not shown.Percentages based on total number of students minus those whose subject area, degree class or age group is unknown.
First degree undergraduate qualifiers in SET subject areas and age groups by degree class
First/2:1
2:2/Third/pass
Agriculture and related subjects21 and under 61.3 38.722-25 63.7 36.326-35 64.7 35.336 and over 64.7 35.3Architecture, building, and planning21 and under 67.8 32.222-25 66.0 34.0
120
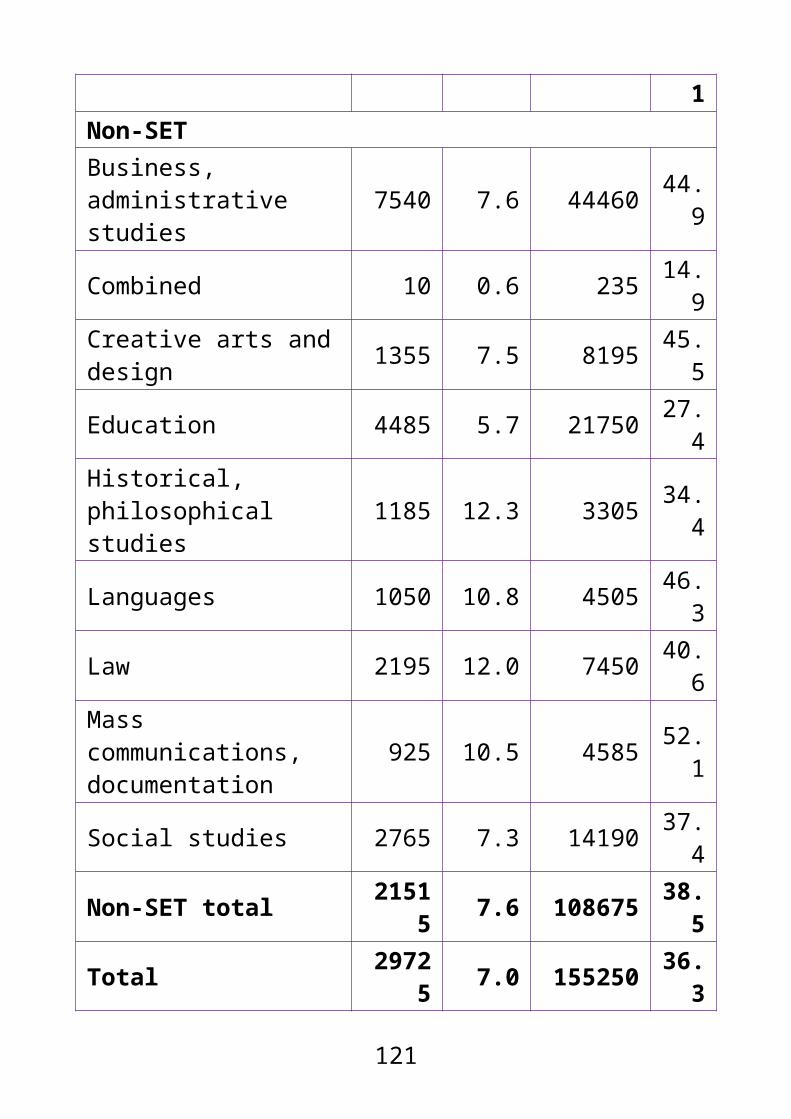
26-35 68.2 31.836 and over 64.7 35.3Biological sciences21 and under 71.6 28.422-25 64.8 35.226-35 62.8 37.236 and over 59.6 40.4Computer science21 and under 65.6 34.422-25 62.0 38.026-35 58.1 41.936 and over 63.0 37.0Engineering and technology21 and under 65.2 34.822-25 70.7 29.326-35 64.2 35.836 and over 64.3 35.7Mathematical sciences21 and under 70.3 29.722-25 69.5 30.526-35 63.3 36.736 and over 71.1 28.9Medicine and dentistry21 and under 91.4 8.622-25 92.6 7.426-35 78.1 21.936 and over ..Physical sciences21 and under 67.9 32.122-25 71.6 28.4
121

26-35 61.3 38.736 and over 63.8 36.2Subjects allied to medicine21 and under 74.8 25.222-25 68.0 32.026-35 64.4 35.636 and over 57.9 42.1Veterinary science21 and under ..22-25 ..26-35 ..36 and over ..SET total21 and under 70.2 29.822-25 67.8 32.226-35 63.7 36.336 and over 59.9 40.1
.. percentages based on totals of 52 or less are not shown
First degree undergraduate qualifiers in non-SET subject areas and age groups by degree class
First/2:1
2:2/Third/pass
Business and administrative studies21 and under 66.5 33.522-25 58.4 41.626-35 51.8 48.236 and over 62.1 37.9
122

Combined21 and under 76.6 23.422-25 66.9 33.126-35 53.4 46.636 and over 56.5 43.5Creative arts and design21 and under 73.0 27.022-25 67.5 32.526-35 68.8 31.236 and over 77.1 22.9Education21 and under 64.2 35.822-25 65.0 35.026-35 60.3 39.736 and over 66.7 33.3Historical and philosophical studies21 and under 84.1 15.922-25 80.6 19.426-35 70.1 29.936 and over 70.4 29.6Languages21 and under 82.4 17.622-25 80.3 19.726-35 69.0 31.036 and over 74.1 25.9Law21 and under 72.5 27.522-25 63.7 36.326-35 53.2 46.836 and over 47.8 52.2
123

Mass comms and documentation21 and under 73.9 26.122-25 65.7 34.326-35 69.7 30.336 and over 77.1 22.9Social studies21 and under 74.8 25.222-25 68.4 31.626-35 60.3 39.736 and over 56.6 43.4Non-SET total21 and under 73.7 26.322-25 66.5 33.526-35 60.2 39.836 and over 63.6 36.4
Destination of leavers
Leavers refers to students who responded to the DLHE survey six months after qualifying.
Leavers’ ages are calculated at 31 July 2013. Data on leavers will not be directly comparable to other age data, which refers to students’ age on entry.
Full-time employment rates were lower among leavers aged 21 and under (46.5%) than in older age groups.
The proportion of leavers who were unemployed fell with age. 7.1% of leavers aged 21 and under were unemployed, compared with 4.7% of those aged 36 and over.
124

The proportion of leavers who went on to full-time study also decreased with age. 19.4% of those aged 21 and under went on to full-time study, compared with 4.4% of leavers aged 36 and over.
1.16 DLHE leavers by leaving destination and age group
21 and under
22-25
No. % No. %
Full-time work total 49215 46.5
106235
59.8
Professional full-time work 31760 30.
0 84790 47.8
Non-professional full-time work 17320 16.
4 21185 11.9
Unknown full-time work 130 0.1 260 0.1
Part-time work 15220 14.4 20030 11.
3Work and further study 7715 7.3 9430 5.3
Full-time study 20515 19.4 20920 11.
8Part-time study 1095 1.0 1585 0.9Unemployed 7460 7.1 12390 7.0Other 4560 4.3 6920 3.9
Total 105780 100 17751
0 100
26-35 36 and over
No. % No. %Full-time work total 5164 65. 3767 56.
125

0 9 5 9
Professional full-time work 46250
59.0
33960
51.3
Non-professional full-time work 5275 6.7 3670 5.5
Unknown full-time work 115 0.1 45 0.1
Part-time work 7615 9.7 10395
15.7
Work and further study 5490 7.0 6505 9.8Full-time study 5180 6.6 2900 4.4Part-time study 1100 1.4 1640 2.5Unemployed 4480 5.7 3140 4.7Other 2840 3.6 3960 6.0
Total 78340 100 6621
5 100
Percentages based on total number of leavers minus those whose leaving destination or age group is unknown.
DLHE leavers in age groups by leaving destination
21 and under
22-25
26-35
36 and over
Full-time work total 46.5 59.8
65.9 56.9
Professional full-time work 30.0 47.
859.
0 51.3
Non-professional full-time work 16.4 11.
9 6.7 5.5
Unknown full-time work 0.1 0.1 0.1 0.1Part-time work 14.4 11. 9.7 15.7
126

3Work and further study 7.3 5.3 7.0 9.8
Full-time study 19.4 11.8 6.6 4.4
Part-time study 1.0 0.9 1.4 2.5Unemployed 7.1 7.0 5.7 4.7Other 4.3 3.9 3.6 6.0
127

2 Disability
The proportion of students who disclosed as disabled was higher at undergraduate level than at postgraduate level. 10.8% of first degree undergraduates and 8.6% of other undergraduates disclosed as disabled, compared with 6.6% of research postgraduates and 6.0% of taught postgraduates.
50.8% of disabled first degree undergraduates received disabled students’ allowance (DSA). At all other degree levels, the majority of disabled students did not receive DSA.
Across all degree levels, a lower proportion of part-time disabled first year students received DSA than those studying full-time. This gap was largest among first degree undergraduates (a 28.3% difference) and smallest among research postgraduates (a 2.6% difference).
The proportion of students who disclosed as disabled within a subject area ranged from 5.3% of those studying business and administrative studies to 16.7% of those studying creative arts and design.
59.0% of disabled students who studied creative arts and design and 52.7% who studied architecture, building and planning received DSA, compared with 17.1% who studied combined subjects and 39.2% who studied languages.
A lower proportion of disabled UK-domiciled full-time first degree entrants continued or qualified (90.3%) than nondisabled UK-domiciled full-time first degree entrants (91.5%).
With the exception of medicine and dentistry and business and administrative studies, in every subject
128

area a higher proportion of non-disabled qualifiers received a first/2:1 than disabled qualifiers.
61.6% of disabled first degree qualifiers with two or more impairments obtained a first/2:1 compared with 68.9% of disabled first degree qualifiers with a mental health condition.
A higher proportion of disabled first degree qualifiers who received DSA obtained a first/2:1 (66.9%) than those who did not receive DSA (65.3%).
Compared with 2011/12, the proportion of disabled first degree qualifiers who received a first/2:1 increased from 63.9% to 66.0%, an increase of 2.1%.
Disability overview
Disabled refers to those who disclosed as disabled on their HESA student record. Nondisabled refers to those who did not disclose as disabled, or whose disability status is unknown by their institution.
The proportion of all students who disclosed as disabled varied by nation, from 6.5% in Northern Ireland to 9.6% in England.
Compared with 2011/12, the proportion of all students who disclosed as disabled increased from 8.6% to 9.5%, a 0.9% increase [see fig. 3.1, ECU (2013)].
Overall, 54.1% of disabled students did not receive disabled students’ allowance (DSA). However, this varied by nation from 65.9% in Scotland to 47.2% in Northern Ireland. A lower proportion of first year disabled students received DSA (38.4%) than disabled students across all years (45.9%).
129

2.1 All/first year students by country of institution and disability status
Non-disabled Disabled
No. % No. %All students
England 1757380
90.4
187620 9.6
Northern Ireland 48350 93.5 3370 6.5
Scotland 196845 91.6 17935 8.4
Wales 116515 90.5 12265 9.5
Total 2119090
90.5
221190 9.5
First year students
England 732895 91.8 65495 8.2
Northern Ireland 21560 94.5 1255 5.5
Scotland 82120 93.0 6160 7.0
Wales 56835 91.8 5095 8.2
Total 893410 92.0 78000 8.0
Percentages based on total number of students minus those whose country of institution is unknown.
130

2.2 All/first year disabled students by country of institution and DSA take-up
Disabled: Receives DSA
does not receive DSA
No. % No. %All students
England 83370 46.5 95810 53.
5
Northern Ireland 1735 52.8 1550 47.
2
Scotland 5855 34.1 11290 65.
9
Wales 5850 50.9 5650 49.
1
Total 96805 45.9
114305
54.1
First year students
England 24150 39.3 37270 60.
7
Northern Ireland 510 43.1 675 56.
9
Scotland 1570 27.6 4115 72.
4
Wales 1805 39.0 2815 61.
0
Total 28030 38.4 44880 61.
6
Percentages based on total number of students minus those whose country of institution or DSA take-up is unknown.
131
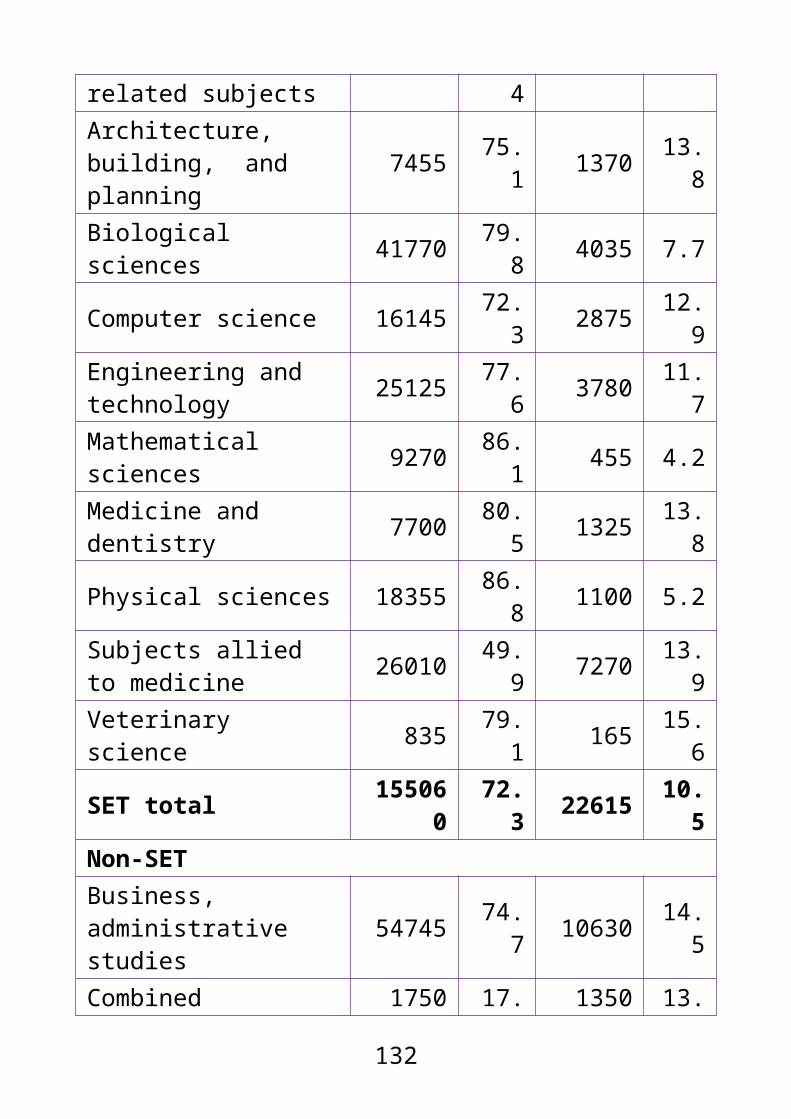
All/first year students in countries of institution by disability status
Non-disabled %
Disabled %
All students England 90.4 9.6All students Northern Ireland 93.5 6.5All students Scotland 91.6 8.4All students Wales 90.5 9.5All students UK 90.5 9.5First year students England 91.8 8.2First year students Northern Ireland 94.5 5.5
First year students Scotland 93.0 7.0First year students Wales 91.8 8.2First year students UK 92.0 8.0
All/first year disabled students in countries of institution by DSA take-up
Received DSA %
Does not receive DSA %
All students England 46.5 53.5All students Northern Ireland 52.8 47.2All students Scotland 34.1 65.9All students Wales 50.9 49.1All students UK 45.9 54.1First year students England 39.3 60.7
132

First year students Northern Ireland 43.1 56.9
First year students Scotland 27.6 72.4First year students Wales 39.0 61.0First year students UK 38.4 61.6
Since 2003/04 the proportion of all students who disclosed as disabled increased from 5.4% to 9.5% in 2012/13, a growth of 4.1%, of which 0.9% occurred in the last year.
The proportion of first year students who disclosed as disabled increased from 4.7% in 2003/04 to 8.0% in 2012/13, a growth of 3.3%, of which 0.5% occurred in the last year.
The gap in disability disclosure between all students and first year students widened from 0.7% in 2003/04 to 1.5% in 2012/13.
2.3 Profile of all/first year students over time by disability status
Non-disabled DisabledNo. % No. %
All students
2003/04 2080635
94.6 119545 5.4
2004/05 2103820
94.1 132445 5.9
2005/06 2138635
93.7 142605 6.3
2006/07 2148880
93.2 155820 6.8
133
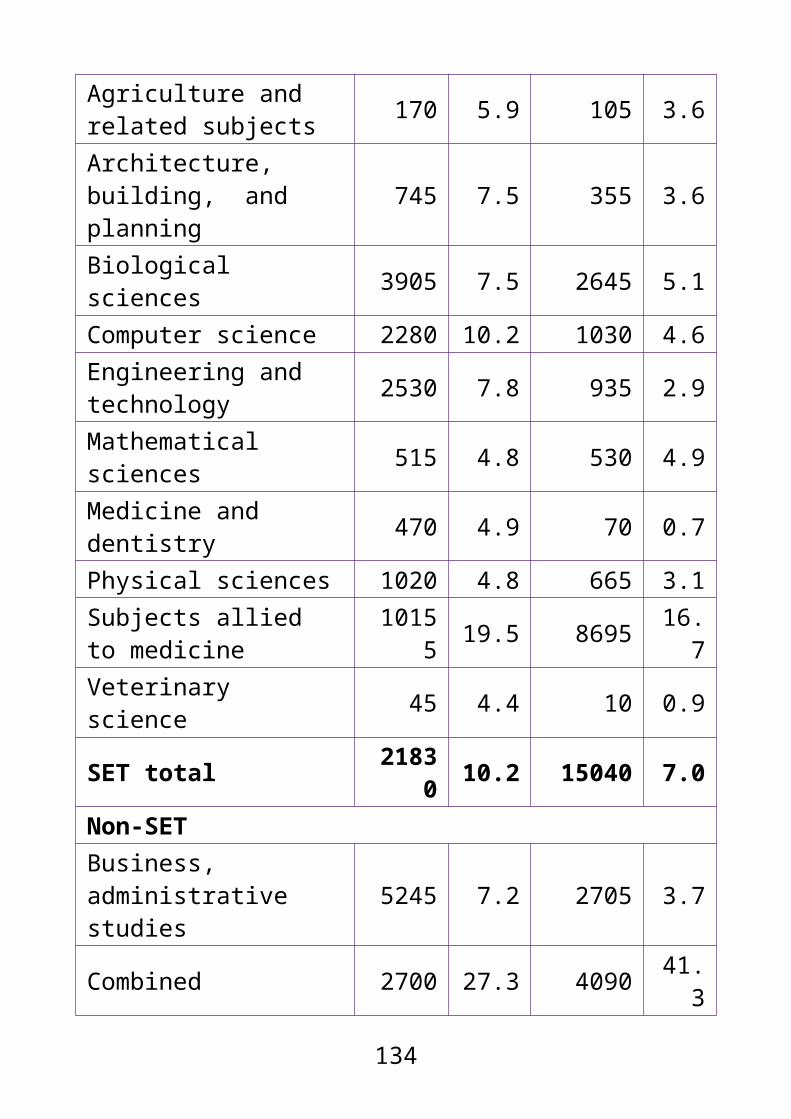
2007/08 2141075
92.8 165030 7.2
2008/09 2219985
92.7 176070 7.3
2009/10 2308865
92.6 184550 7.4
2010/11 2301375
92.0 199925 8.0
2011/12 2281275
91.4 215370 8.6
2012/13 2119090
90.5 2211990
9.5
First years
2003/04 963940 95.3 47965 4.7
2004/05 959005 94.9 51845 5.1
2005/06 999770 94.5 57745 5.5
2006/07 996000 94.2 61305 5.8
2007/08 1002570
93.8 66255 6.2
2008/09 1072160
93.7 71860 6.3
2009/10 1111210
93.8 73980 6.2
2010/11 1067110
93.1 78860 6.9
2011/12 1033615
92.5 83725 7.5
2012/13 893410 92.0 7800 8.
134

0
135

All/first year students over time by disability status
Non-disabled Disabled% %
All students2003/04 94.6 5.42004/05 94.1 5.92005/06 93.7 6.32006/07 93.2 6.82007/08 92.8 7.22008/09 92.7 7.32009/10 92.6 7.42010/11 92.0 8.02011/12 91.4 8.62012/13 90.5 9.5First years2003/04 95.3 4.72004/05 94.9 5.12005/06 94.5 5.52006/07 94.2 5.82007/08 93.8 6.22008/09 93.7 6.32009/10 93.8 6.22010/11 93.1 6.92011/12 92.5 7.52012/13 92.0 8.0
The proportion of all disabled students who received DSA increased from 42.5% in 2003/04 to 45.9% in 2012/13.
136

While the proportion of first year disabled students receiving DSA has similarly increased during this time period, the rate has been slower (a 1.7% increase from 2003/04 to 2012/13 compared with a 3.4% increase among all students). As a consequence, the gap between disabled students and first year students receiving DSA has widened from 5.8% in 2003/04 to 7.5% in 2012/13.
The proportion of first year disabled students who received DSA dropped by 1.5% in the last academic year, from 39.9% in 2011/12 to 38.4% in 2012/13.
2.4 Profile of all/first year disabled students over time by DSA take-up
Disabled:Receives DSA Does not receive
DSANo. % No. %
All students2003/04 38680 42.5 52230 57.52004/05 47800 43.9 61140 56.12005/06 55340 45.7 65860 54.32006/07 60215 45.1 73200 54.92007/08 63180 44.9 77485 55.12008/09 69220 45.8 81805 54.22009/10 74660 46.1 87320 53.92010/11 81725 45.1 99290 54.92011/12 92490 46.0 108515 54.02012/13 96805 45.9 114305 54.1First years2003/04 12655 36.7 21865 63.3
15080 37.4 25200 62.6
137

2005/06 18265 38.8 28790 61.22006/07 18455 36.8 31765 63.22007/08 19865 37.1 33720 62.92008/09 22415 38.0 36545 62.02009/10 23480 37.9 38545 62.12010/11 26300 37.9 43075 62.12011/12 30410 39.9 45825 60.12012/13 28030 38.4 44880 61.6
Percentages based on total number of students minus those whose DSA take-up is unknown.
All/first year disabled students over time by DSA take-up
Disabled:Receives DSA Does not receive
DSA% %
All students2003/04 42.5 57.52004/05 43.9 56.12005/06 45.7 54.32006/07 45.1 54.92007/08 44.9 55.12008/09 45.8 54.22009/10 46.1 53.92010/11 45.1 54.92011/12 46.0 54.02012/13 45.9 54.1First years2003/04 36.7 63.3
138

2004/05 37.4 62.62005/06 38.8 61.22006/07 36.8 63.22007/08 37.1 62.92008/09 38.0 62.02009/10 37.9 62.12010/11 37.9 62.12011/12 39.9 60.12012/13 38.4 61.6
A new disability coding framework was introduced for entrants in 2010/11. For full details, please see About the data.
Since 2007/08 the proportion of disabled students disclosing a mental health condition has increased from 5.9% to 11.1% in 2012/13 (from 0.4% to 1.1% of the entire student population).
The proportion of disabled students disclosing a specific learning difficulty increased from 46.3% in 2007/08 to 48.5% in 2012/13. In the same period of time, the proportion of disabled students disclosing a social communication or autistic spectrum disorder increased from 0.9% to 2.3%. In contrast, the proportion of disabled students disclosing a long-standing illness or health condition fell from 15.7% in 2007/08 to 10.5% in 2012/13.
139

2.5 Profile over time of disabled students by impairment type
2007/08 2008/09No. %a %b No. %a %b
Blind or serious visual impairment
3685 0.2 2.2 3875 0.2 2.2
Deaf or serious hearing impairment
6940 0.3 4.2 7500 0.3 4.3
Long-standing illness or health condition
25920 1.1 15.7 27325 1.1 15.
5
Mental health condition 9675 0.4 5.9 11200 0.5 6.4
Personal care support 360 0.0 0.2 265 0.0 0.2
Physical impairment/mobility issues
6265 0.3 3.8 5850 0.2 3.3
Social communication or autistic spectrum disorder
1455 0.1 0.9 1925 0.1 1.1
Specific learning difficulty
76385 3.3 46.3 82860 3.5 47.
1Two or more impairments
14460 0.6 8.8 15580 0.7 8.8
Other impairment
19885 0.9 12.0 19690 0.8 11.
2All disabled 1650 7.2 100 17607 7.3 100
140

students 30 0
2009/10 2010/11No. %a %b No. %a %b
Blind or serious visual impairment
3925 0.2 2.1 3615 0.1 1.8
Deaf or serious hearing impairment
7380 0.3 4.0 6695 0.3 3.3
Long-standing illness or health condition
27165 1.1 14.
7 23765 1.0 11.9
Mental health condition
13055 0.5 7.1 16510 0.7 8.3
Personal care support 240 0.0 0.1 40 0.0 0.0
Physical impairment/mobility issues
5965 0.2 3.2 6755 0.3 3.4
Social communication or autistic spectrum disorder
2595 0.1 1.4 3410 0.1 1.7
Specific learning difficulty
88975 3.6 48.
2 95330 3.8 47.7
Two or more impairments
16455 0.7 8.9 17205 0.7 8.6
Other impairment
18790 0.8 10.
2 26605 1.1 13.3
All disabled 1845 7.4 100 19992 8.0 100
141
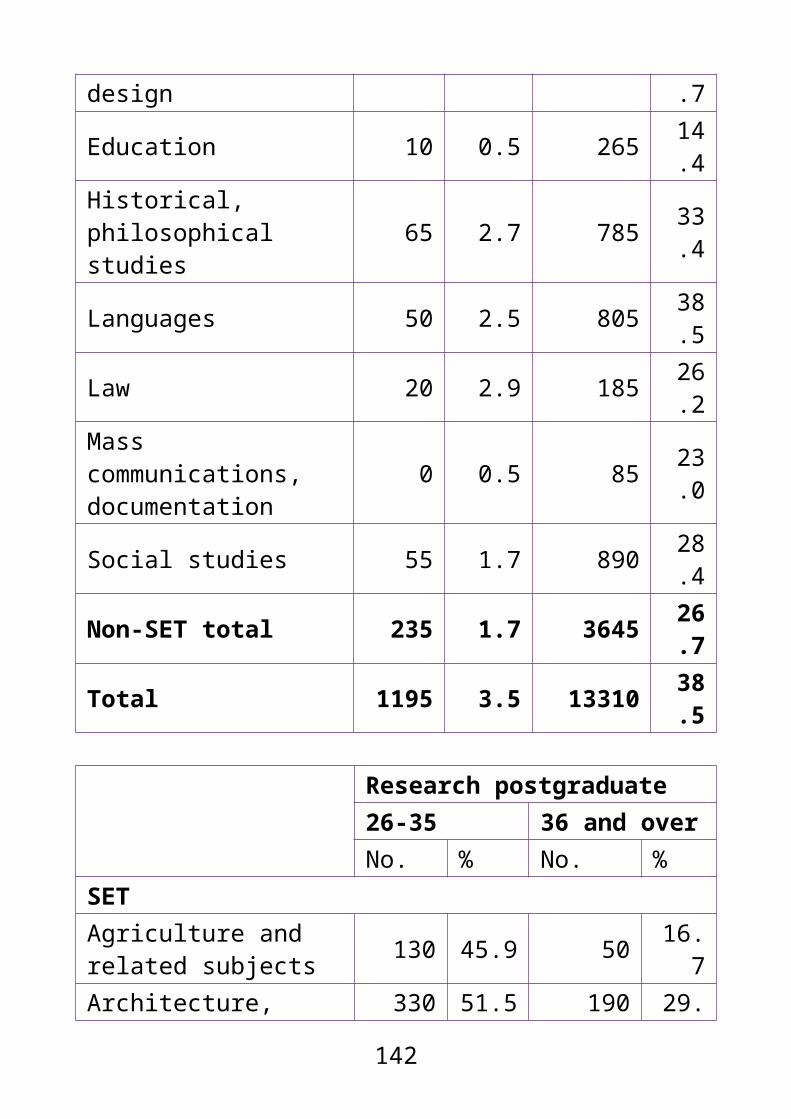
students 50 5
2011/12 2012/13
No. %a %b No. %a %b
Blind or serious visual impairment
3520 0.1 1.6 3335 0.1 1.5
Deaf or serious hearing impairment
6215 0.2 2.9 5695 0.2 2.6
Long-standing illness or health condition
23480 0.9 10.9 23200 1.0 10.5
Mental health condition 20730 0.8 9.6 24630 1.1 11.
1Personal care support 15 0.0 0.0 5 0.0 0.0
Physical impairment/mobility issues
7345 0.3 3.4 7705 0.3 3.5
Social communication or autistic spectrum disorder
4450 0.2 2.1 5105 0.2 2.3
Specific learning difficulty
104220 4.2 48.4 10724
5 4.6 48.5
Two or more impairments 18780 0.8 8.7 19050 0.8 8.6
Other impairment 26620 1.1 12.4 25215 1.1 11.
4
142
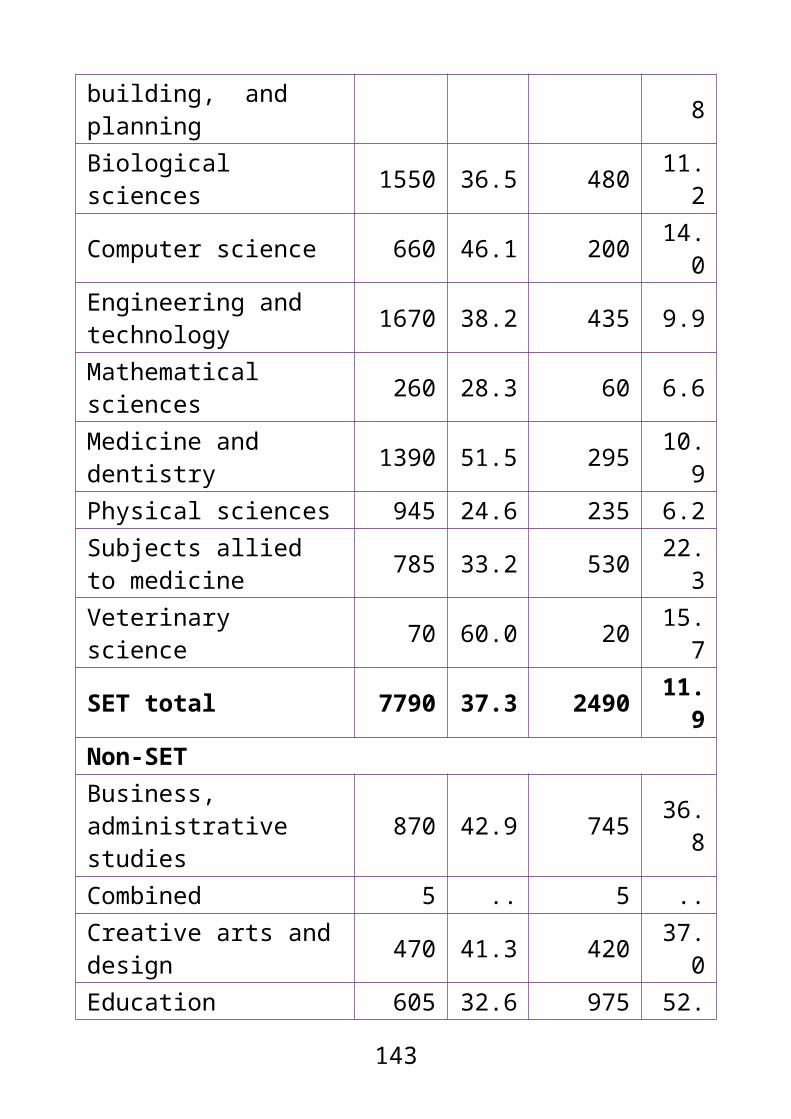
All disabled students
215370 8.6 100 22119
0 9.5 100
a. within an academic year, the percentage of students in an impairment type (compare vertically)
b. within all disabled students in an academic year, the percentage of students in an impairment type (compare vertically)
Percentages based on total number of students minus those whose impairment type is unknown. See fig. 2.3 for all student totals.
Profile over time of disabled students by impairment type
2009/ 10%
2010/ 11 %
2011/ 12 %
2012/ 13 %
Blind or serious visual impairment 2.1 1.8 1.6 1.5
Deaf or serious hearing impairment
4.0 3.3 2.9 2.6
Long-standing illness or health condition
14.7 11.9 10.9 10.5
Mental health condition 7.1 8.3 9.6 11.1
Personal care support 0.1 0.0 0.0 0.0
Physical impairment/mobility issues
3.2 3.4 3.4 3.5
143

Social communication or autistic spectrum disorder
1.4 1.7 2.1 2.3
Specific learning difficulty 48.2 47.7 48.4 48.5
Two or more impairments 8.9 8.6 8.7 8.6
Other impairment 10.2 13.3 12.4 11.4
At all degree levels, a lower proportion of EU and non EU domiciled students disclosed as disabled than UK-domiciled students.
This difference was largest among first degree undergraduates, where 11.9% of UK-domiciled students were disabled compared with 4.8% of EU and 2.7% of non-EU domiciled students, a difference of 7.1% and 9.2% respectively.
The proportion of students who disclosed as disabled ranged from 1.6% of non- EU-domiciled taught postgraduates to 11.9% of UK-domiciled first degree undergraduates, a difference of 10.3%.
Compared with 2011/12, overall the proportion of students who disclosed as disabled increased by 1.0% for UK-domiciled students, 0.4% for EU students and 0.2% for non-EU students [see fig. 3.6, ECU (2013)].
2.6 All students by degree level, domicile category and disability status
144

Non-disabled DisabledNo. %* %^ No. %* %^
All levels
UK 1705625
80.5
89.1
209390
94.7
10.9
EU 120080 5.7 95.8 5210 2.4 4.2
Non-EU 293380 13.8
97.8 6590 3.0 2.2
Total 2119090 100 90.
522119
0 100 9.5
First degree undergraduate157540
UK 1167015
85.6
88.1
157540
95.7
11.9
EU 69520 5.1 95.2 3530 2.1 4.8
Non-EU 127300 9.3 97.3 3575 2.2 2.7
Total 1363835 100 89.
216464
5 100 10.8
Other undergraduate
UK 229565 91.3
90.8 23320 98.
09.2
EU 6200 2.5 96.8 205 0.9 3.2
Non-EU 15800 6.3 98.3 270 1.1 1.7
Total 251565 100 91.4 23795 100 8.6
Research postgraduate
UK 58050 90.7
90.7 5920 82.
69.3
145

EU 13550 96.9
96.9 430 6.0 3.1
Non-EU 30365 97.4
97.4 815 11.
42.6
Total 101965 93.4
93.4 7165 100 6.6
Taught postgraduate
UK 250995 91.7
91.7 22610 88.
48.3
EU 30810 96.7
96.7 1045 4.1 3.3
Non-EU 119915 98.4
98.4 1930 7.5 1.6
Total 401725 94.0
94.0 25585 100 6.0
* within a disability status, the percentage of students in a domicile category (compare vertically within degree level)^ within a degree level and domicile category, the percentage of students who are disabled/nondisabled (compare horizontally)Percentages based on total number of students minus those whose degree level, or domicile category is unknown
All students in domicile categories and degree levels by disability status
Non-disabled
Disabled
All UK domiciled students 89.1 10.9All EU domiciled students 95.8 *All non-EU domiciled students 97.8UK first degree undergraduates 88.1 11.9
146

EU first degree undergraduates 95.2Non-EU first degree undergraduates
97.3
UK other undergraduates 90.8 9.2EU other undergraduates 96.8Non-EU other undergraduates 98.3UK research postgraduates 90.7 9.3EU research postgraduates 96.9Non-EU research postgraduates
97.4
UK taught postgraduates 91.7 8.3EU taught postgraduates 96.7Non-EU taught postgraduates 98.4
* values less than 5.0 are not displayed
Mode and level
The proportion of students who disclosed as disabled was higher at undergraduate level than at postgraduate level. 10.8% of first degree undergraduates and 8.6% of other undergraduates disclosed as disabled, compared with 6.6% of research postgraduates and 6.0% of taught postgraduates.
Overall, a slightly higher proportion of disabled students studied full-time (9.5%) than part-time (9.2%) but there were disparities between degree levels.
147

2.7 All students by degree level, mode and disability status
Non-disabled DisabledNo. %* %^ No. %* %^
All levels
Full-time 1521775
71.8
90.5
160370
72.5
9.5
Part-time 597315 28.2
90.8 60815 27.
59.2
Total 2119090 100 90.
522119
0 100 9.5
First degree undergraduate
Full-time 1177235
86.3
89.7
135100
82.1
10.3
Part-time 186600 13.7
86.3 29545 17.
913.
7
Total 1363835 100 89.
216464
5 100 10.8
Other undergraduate
Full-time 64480 25.6
87.9 8860 37.
212.
1
Part-time 187090 74.4
92.6 14935 62.
8 7.4
Total 251565 100 91.4 23795 100 8.6
Research postgraduate
Full-time 74680 73.2
93.7 5000 69.
8 6.3
Part-time 27285 26.8
92.7 2165 30.
2 7.3
Total 101965 100 93. 7165 100 6.6148
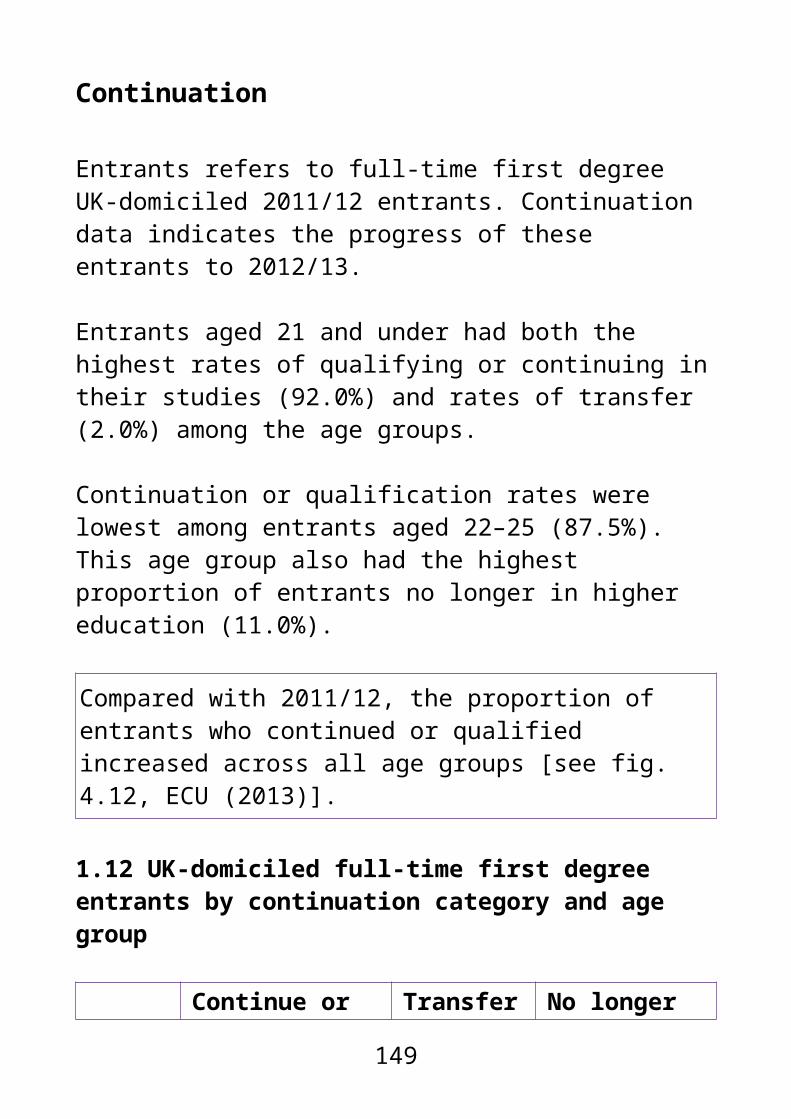
4Taught postgraduate
Full-time 205380 51.1
94.7 11410 44.
6 5.3
Part-time 196345 48.9
93.3 14175 55.
4 6.7
Total 401725 100 94.0 25585 100 6.0
* within a disability status, the percentage of students in a mode (compare vertically within a degree level)^ within a degree level and mode, the percentage of students who are disabled/non-disabled (compare horizontally)Percentages based on total number of students minus those whose degree level or mode is unknown.
50.8% of disabled first degree undergraduates received DSA. At all other degree levels, the majority of disabled students did not receive DSA.
With the exception of research postgraduates a lower proportion of part-time disabled students received DSA than those studying full-time.
This gap was largest among other undergraduates, where 17.2% of part-time disabled students received DSA compared with 49.4% of full-time disabled students (a gap of 32.2%).
2.8 Disabled students by degree level, mode and DSA take-up
Disabled: receives DSA does not receive DSA
149

No. %* %^ No. %* %^All levels
Full-time 81935
84.6
53.3 71825 62.
846.
7
Part-time 14870
15.4
25.9 42480 37.
274.
1
Total 96805 100 45.
911430
5 100 54.1
First degree undergraduate
Full-time 72220
89.4
55.6 57730 74.
044.
4
Part-time 8525 10.6
29.5 20335 26.
070.
5
Total 80740 100 50.
8 78060 100 49.2
Other undergraduate
Full-time 4100 64.0
49.4 4205 27.
650.
6
Part-time 2305 36.0
17.2 11060 72.
482.
8
Total 6405 100 29.6 15265 100 70.
4Research postgraduate
Full-time 1345 69.9
28.1 3450 70.
371.
9
Part-time 580 30.1
28.4 1460 29.
771.
6
Total 1925 100 28.2 4910 100 71.
8Taught postgraduate
Full-time 4270 55.2
39.9 6440 40.
160.
1150

Part-time 3465 44.8
26.5 9625 59.
993.
5
Total 7735 100 32.5 16065 100 67.
5* within DSA take-up, the percentage of students in a mode (compare vertically within a degree level)^ within a degree level and mode, the percentage of students who receive/do not receive DSA (compare horizontally)Percentages based on total number of students minus those whose degree level, mode or DSA take-up is unknown.
All full-time/part-time students in degree levels by disability status
Non-disabled
Disabled
All full-time 90.5 9.5All part-time 90.8 9.2All students 90.5 9.5Full-time first degree undergraduates 87.7 10.3
Part-time first degree undergraduates 86.3 13.7
All first degree undergraduates 89.2 10.8Full-time other undergraduates 87.9 12.1Part-time other undergraduates 92.6 7.4All other undergraduates 91.4 8.6Full-time research postgraduates 93.7 6.3Part-time research postgraduates 92.7 7.3All research postgraduates 93.4 6.6
151

Full-time taught postgraduates 94.7 5.3Part-time taught postgraduates 93.3 6.7All taught postgraduates 94.0 6.0
All full-time/part-time disabled students in degree levels by DSA take-up
Receives DSA
Does not receive DSA
All full-time 53.3 46.7All part-time 25.9 74.1All students 45.9 54.1Full-time first degree undergraduates 55.6 44.4
Part-time first degree undergraduates 29.5 70.5
All first degree undergraduates 50.8 49.2Full-time other undergraduates 49.4 50.6Part-time other undergraduates 17.2 82.8All other undergraduates 29.6 70.4Full-time research postgraduates 28.1 71.9Part-time research postgraduates 28.4 71.6All research postgraduates 28.2 71.8Full-time taught postgraduates 39.9 60.1Part-time taught postgraduates 26.5 73.5All taught postgraduates 32.5 67.5
16.6% of disabled research postgraduates disclosed a long standing illness or health condition, compared with 9.6% of disabled first degree undergraduates.
152

50.0% of disabled first degree undergraduates disclosed a specific learning difficulty, compared with 35.3% of disabled research postgraduates.
2.9 All/disabled students by degree level and impairment type
First degree undergraduate
Other undergraduate
No. %a %b No. %a
%b
Blind or serious visual impairment 2215 0.1 1.3 380 0.
1 1.6
Deaf or serious hearing impairment
3410 0.2 2.1 980 0.4 4.1
Long-standing illness or health condition
15750 1.0 9.6 2645 1.0
11.1
Mental health condition 19155 1.3 11.
6 2280 0.8 9.6
Personal care support 0 0.0 0.0 0 0.
0 0.0
Physical impairment/mobility issues
5065 0.3 3.1 1020 0.4 4.3
Social communication or autistic spectrum disorder
4160 0.3 2.5 445 0.2 1.9
Specific learning difficulty 82335 5.4 50.
01064
53.9
44.7
153

Two or more impairments 14590 1.0 8.9 2265 0.
8 9.5
Other impairment 17960 1.2 10.9 3135 1.
113.
2All disabled students
164645
10.8 100 2379
58.6 100
Research postgraduate
Taught Postgraduate
No. %a
%b No. %a
%b
Blind or serious visual impairment 205 0.2 2.8 535 0.1 2.1
Deaf or serious hearing impairment 300 0.3 4.2 1010 0.2 3.9
Long-standing illness or health condition
1190 1.1 16.
6 3615 0.8 14.1
Mental health condition 760 0.7 10.
6 2440 0.6 9.5
Personal care support 0 0.0 0.0 0 0.0 0.0
Physical impairment/mobility issues
405 0.4 5.6 1215 0.3 4.8
Social communication or autistic spectrum disorder
155 0.1 2.1 350 0.1 1.4
Specific learning difficulty
2530 2.3 35.
31173
5 2.7 45.9
154

Two or more impairments 615 0.6 8.6 1575 0.4 6.2
Other impairment 1010 0.9 14.
1 3110 0.7 12.2
Total 7165 6.6 100 2558
5 6.0 100
a. within a degree level, the percentage of students in an impairment type (compare vertically) see fig. 2.7 for disabled and non-disabled totals
b. within all disabled students, the percentage of students in an impairment type (compare vertically
Percentages based on total number of students minus those whose degree level or impairment type is unknown.
All disabled students in degree levels by impairment type
First degree undergraduate
Other undergraduate
Blind or serious visual impairment 1.3 1.6
Deaf or serious hearing impairment 2.1 4.1
Long-standing illness or health condition 9.6 11.1
Mental health condition 11.6 9.6
Personal care support 0.0 0.0Physical impairment/mobility
3.1 4.3
155

issuesSocial communication or autistic spectrum disorder
2.5 1.9
Specific learning difficulty 50.0 44.7
Two or more impairments 8.9 9.5
Other impairment 10.9 13.2
Research postgraduate
Taught postgraduate
Blind or serious visual impairment 2.8 2.1
Deaf or serious hearing impairment 4.2 3.9
Long-standing illness or health condition 16.6 14.1
Mental health condition 10.6 9.5
Personal care support 0.0 0.0Physical impairment/mobility issues
5.6 4.8
Social communication or autistic spectrum disorder
2.1 1.4
Specific learning difficulty 35.3 45.9
Two or more impairments 8.6 6.2
Other impairment 14.1 12.2156

Overall, 8.0% of first year fulltime and part-time students were disabled, though there were differences by degree level.
With the exception of other undergraduates, at every degree level a higher proportion of part-time first year students disclosed as disabled than those studying full-time.
This gap was largest among first degree undergraduates, where 12.7% of part-time first year students disclosed as disabled compared with 9.2% of those studying full-time (a 3.5% gap).
2.10 First year students by degree level, mode and disability status
Non-disabled Disabled
No. %* %^ No. %* %^
All levels
Full-time 615575
68.9
92.0
53745
68.9
8.0
Part-time 277840
31.1
92.0
24255
31.1
8.0
Total 893410 100 92.
07800
0 100 8.0
First degree undergraduate
Full-time 393180
87.9
90.8
39960
83.5 9.2
Part-time 54255 12.1
87.3 7885 16.
512.
7Total 44743 100 90. 4784 100 9.7
157

5 3 5Other undergraduate
Full-time 29765 18.8
89.9 3355 26.
210.
1
Part-time 128330
81.2
93.1 9440 73.
8 6.9
Total 158095 100 92.
51279
5 100 7.5
Postgraduate research
Full-time 26335 81.1
94.1 1645 77.
8 5.9
Part-time 6125 18.9
92.9 470 22.
2 7.1
Total 32460 100 93.9 2115 100 6.1
Postgraduate taught
Full-time 166290
65.1
95.0 8785 57.
6 5.0
Part-time 89130 34.9
93.2 6465 42.
4 6.8
Total 255420 100 94.
41525
0 100 5.6
* within a disability status, the percentage of students in a mode (compare vertically within a degree level)^ within a degree level and mode, the percentage of students who are disabled/non-disabled (compare horizontally) Percentages based on total number of students minus those whose degree level or mode is unknown.
Across all degree levels, a lower proportion of part-time disabled first year students received DSA than those
158

studying full-time. This gap was largest among first degree undergraduates (a 28.3% difference) and smallest among research postgraduates (a 2.6% difference).
Compared with 2011/12, the proportion of disabled first year students who received DSA decreased by 2.2% for full-time students and 2.1% for part-time students overall.
Among first year first degree undergraduates the proportion of disabled students who received DSA decreased by 2.3% for fulltime students and 5.0% for part-time students [see fig. 3.11, ECU (2013)].
2.11 Disabled first year students by degree level, mode and DSA take-up
Disabled: receives DSA does not receive DSA
No. %* %^ No. %* %^All levels
Full-time 23685 84.5 46.7 26990 60.1 53.3
Part-time 4345 15.5 19.5 17890 39.9 80.5
Total 28030 100 38.4 44880 100 61.6
First degree undergraduate
Full-time 18810 91.9 49.7 19035 75.8 50.3
Part-time 1655 8.1 21.4 6065 24.2 78.6
Total 20465 100 44.9 25100 100 55.1
159

Other undergraduateFull-time 1220 52.0 40.0 1830 20.6 60.0Part-time 1125 48.0 13.7 7060 79.4 86.3Total 2345 100 20.9 8890 100 79.1Research postgraduateFull-time 425 80.0 27.1 1145 77.8 72.9Part-time 105 20.0 24.5 325 22.2 75.5Total 530 100 26.5 1470 100 73.5Taught postgraduateFull-time 3230 68.9 39.3 4980 52.9 60.7Part-time 1460 31.1 24.7 4440 47.1 75.3Total 4690 100 33.2 9415 100 66.8
* within DSA take-up, the percentage of students in a mode (compare vertically within a degree level)^ within a degree level and mode, the percentage of students who receive/do not receive DSA (compare horizontally) Percentages based on total number of students minus those whose degree level, mode or DSA take-up is unknown.
First year full-time/part-time students in degree levels by disability status
Non-disabled
Disabled
All full-time 92.0 8.0All part-time 92.0 8.0All students 92.0 8.0Full-time first degree undergraduates 90.8 9.2
160
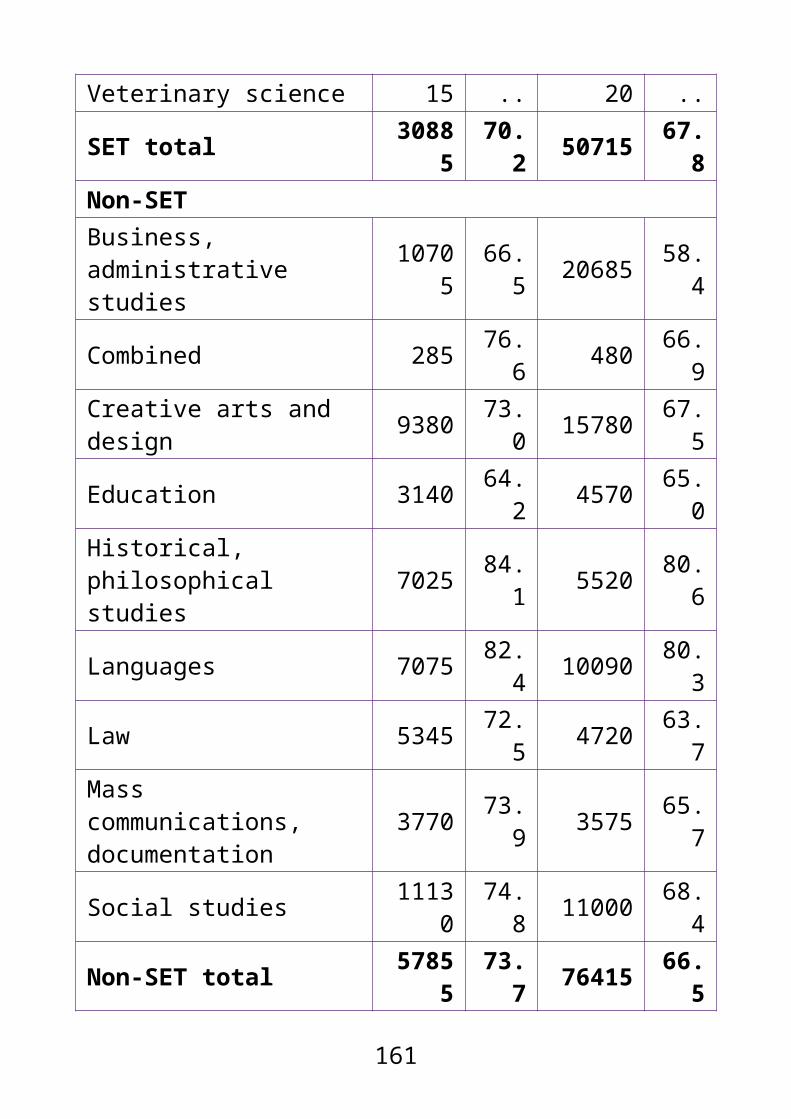
Part-time first degree undergraduates 87.3 12.7
All first degree undergraduate 90.3 9.7Full-time other undergraduates 89.9 10.1Part-time other undergraduates 93.1 6.9All other undergraduates 92.5 7.5Full-time research postgraduates 94.1 5.9Part-time research postgraduates 92.9 7.1All research postgraduates 93.9 6.1Full-time taught postgraduates 95.0 5.0Part-time taught postgraduates 93.2 6.8All taught postgraduates 94.4 5.6
First year full-time/part-time disabled students in degree levels by DSA take-up
Receives DSA
Does not receive DSA
All full-time 46.7 53.3All part-time 19.5 80.5All students 38.4 61.6Full-time first degree undergraduates 49.7 50.3
Part-time first degree undergraduates 21.4 78.6
All first degree undergraduate 44.9 55.1
Full-time other undergraduates 40.0 60.0
Part-time other undergraduates 13.7 86.3
161
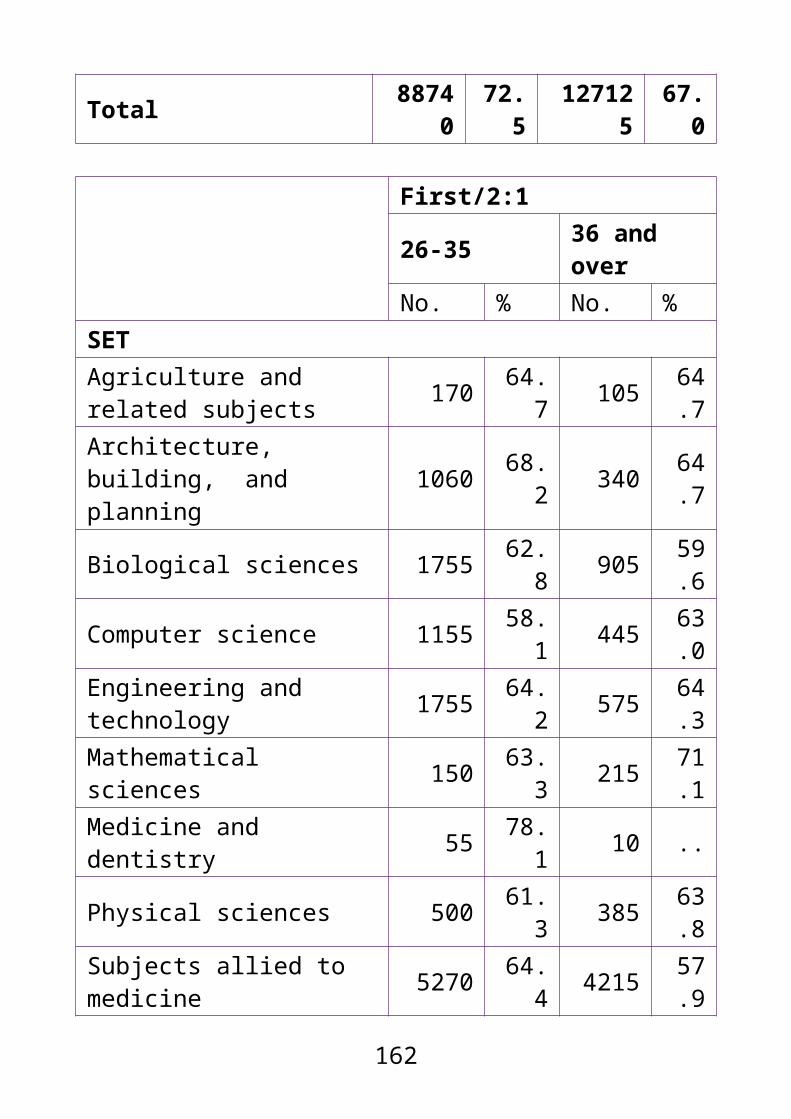
All other undergraduates 20.9 79.1Full-time research postgraduates 27.1 72.9
Part-time research postgraduates 24.5 75.5
All research postgraduates 26.5 73.5Full-time taught postgraduates 39.3 60.7
Part-time taught postgraduates 24.7 75.3
All taught postgraduates 33.2 66.8
162
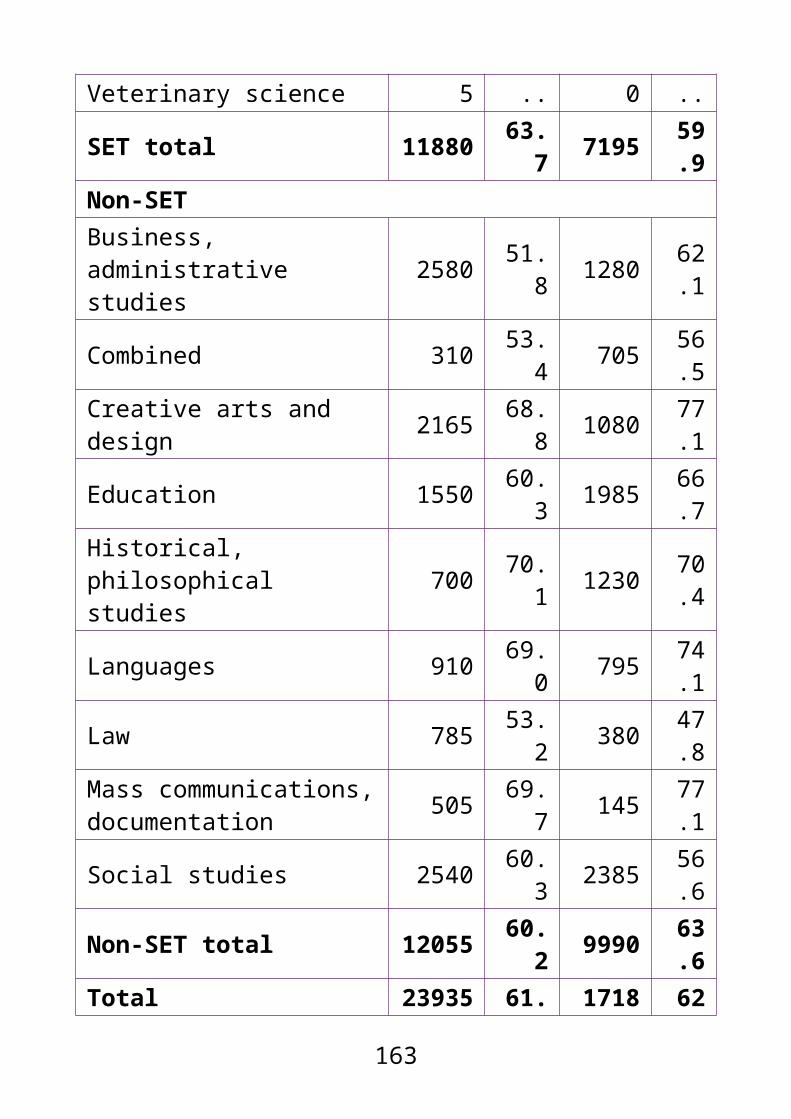
Subjects
9.7% of non-SET students disclosed as disabled compared with 9.1% of SET students. Among first year students, 8.2% of non-SET and 7.8% of SET students disclosed as disabled.
The proportion of students who disclosed as disabled within a subject area ranged from 5.3% of those studying business and administrative studies to 16.7% of those studying creative arts and design.
59.0% of disabled students who studied creative arts and design and 52.7% who studied architecture, building and planning received DSA, compared with 17.1% who studied combined subjects and 39.2% who studied languages.
2.12 All/first year students by subject area, disability status and DSA take-up
All studentsNon-disabled DisabledNo. %* %^ No. %* %^
SETAgriculture and related subjects
16660 0.8 87.6 2360 1.1 12.
4
Architecture, building, and planning
47810 2.3 90.7 4890 2.2 9.3
Biological sciences 179570 8.5 89.
1 21950 9.9 10.9
Computer 80815 3.8 90. 8685 3.9 9.7
163

science 3Engineering and technology 147500 7.0 93.
3 10615 4.8 6.7
Mathematical sciences 39070 1.8 92.
5 3165 1.4 7.5
Medicine and dentistry 62025 2.9 92.
9 4720 2.1 7.1
Physical sciences 83350 3.9 89.
6 9705 4.4 10.4
Subjects allied to medicine 254915 12.
091.
1 25025 11.3 8.9
Veterinary science 5020 0.2 87.
1 740 0.3 12.9
SET total 916730 43.3
90.9 91855 41.
5 9.1
Non-SETBusiness, administrative studies
319480 15.1
94.7 17765 8.0 5.3
Combined 62205 2.9 86.8 9475 4.3 13.
2Creative arts and design 143925 6.8 83.
3 28935 13.1
16.7
Education 165225 7.8 91.8 14685 6.6 8.2
Historical, philosophical studies
80705 3.8 87.0 12035 5.4 13.
0
Languages 113305 5.3 91.2 10975 5.0 8.8
Law 82010 3.9 92.0 7180 3.2 8.0
164

Mass communications, documentation
45495 2.1 90.2 4930 2.2 9.8
Social studies 190005 9.0 89.1 23355 10.
610.
9
Non-SET total 1202360
56.7
90.3
129330
58.5 9.7
Total 2119090 100 90.
522119
0 100 9.5
All studentsreceives DSA does not receive
DSANo. %* %^ No. %* %^
SETAgriculture and related subjects 1185 1.2 51.
8 1105 1.0 48.2
Architecture, building, and planning
2460 2.5 52.7 2210 1.9 47.
3
Biological sciences 9890 10.
247.
1 11120 9.7 52.9
Computer science 3870 4.0 46.5 4445 3.9 53.
5Engineering and technology 4855 5.0 47.
9 5270 4.6 52.1
Mathematical sciences 1240 1.3 40.
6 1815 1.6 59.4
Medicine and dentistry 2305 2.4 50.
6 2250 2.0 49.4
Physical sciences 4430 4.6 47. 4995 4.4 53.
165
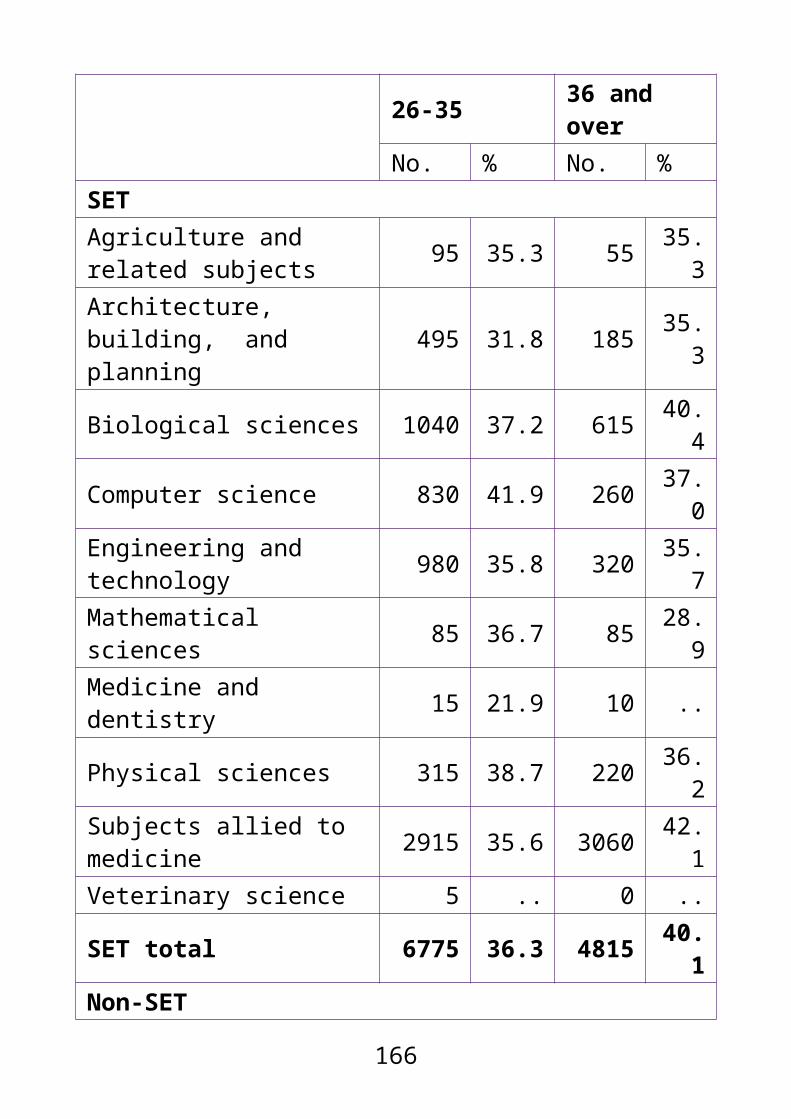
0 0Subjects allied to medicine
10625
11.0
45.1 12940 11.
354.
9Veterinary science 385 0.4 52.
4 350 0.3 47.6
SET total 41245
42.6
47.0 46500 40.
753.
0Non-SETBusiness, administrative studies
9150 7.4 42.5 9660 8.5 57.
5
Combined 1605 1.7 17.1 7770 6.8 82.
9Creative arts and design
16435
17.0
59.0 11425 10.
041.
0
Education 6080 6.3 44.9 7455 6.5 55.
1Historical, philosophical studies
4665 4.8 40.8 6775 5.9 59.
2
Languages 4070 4.2 39.2 6305 5.5 60.
8
Law 2850 2.9 41.7 3985 3.5 58.
3Mass communications, documentation
2380 2.5 50.4 2340 2.0 49.
6
Social studies 10330
10.7
46.1 12090 10.
653.
9
Non-SET total 55565
57.4
45.0 67805 59.
355.
0Total 9680 10 45. 11430 10 54.
166

5 0 9 5 0 1
First yearsNon-disabled DisabledNo. %* %^ No. %* %^
SETAgriculture and related subjects 7410 0.8 89.
5 875 1.1 10.5
Architecture, building, and planning
18310 2.0 92.3 1535 2.0 7.7
Biological sciences 67775 7.6 90.
2 7355 9.4 9.8
Computer science 31240 3.5 91.2 3025 3.9 8.8
Engineering and technology 58660 6.6 94.
7 3270 4.2 5.3
Mathematical sciences 13410 1.5 93.
5 935 1.2 6.5
Medicine and dentistry 18195 2.0 94.
4 1080 1.4 5.6
Physical sciences 29515 3.3 90.8 3005 3.9 9.2
Subjects allied to medicine
116460
13.0
92.5 9385 12.
0 7.5
Veterinary science 1330 0.1 92.
7 105 0.1 7.3
SET total 362300
40.6
92.2
30570
39.2 7.8
Non-SETBusiness, 14730 16. 95. 6485 8.3 4.2
167

administrative studies 5 5 8
Combined 35765 4.0 89.2 4340 5.6 10.
8Creative arts and design 55090 6.2 85.
6 9275 11.9
14.4
Education 86165 9.6 92.3 7220 9.3 7.7
Historical, philosophical studies
28375 3.2 88.0 3855 4.9 12.
0
Languages 45750 5.1 92.8 3575 4.6 7.2
Law 35195 3.9 93.0 2635 3.4 7.0
Mass communications, documentation
18735 2.1 91.5 1735 2.2 8.5
Social studies 78725 8.8 90.4 8315 10.
7 9.6
Non-SET total 531110
59.4
91.8
47430
60.8 8.2
Total 893410
100
92.0
78000
100 8.0
* within all students/first year students, disability status and DSA take-up, the percentage of students in a subject area (compare vertically)
^ within a subject area, the percentage of all/first year students who are disabled/non-disabled and receive/do not receive DSA (compare horizontally)
168
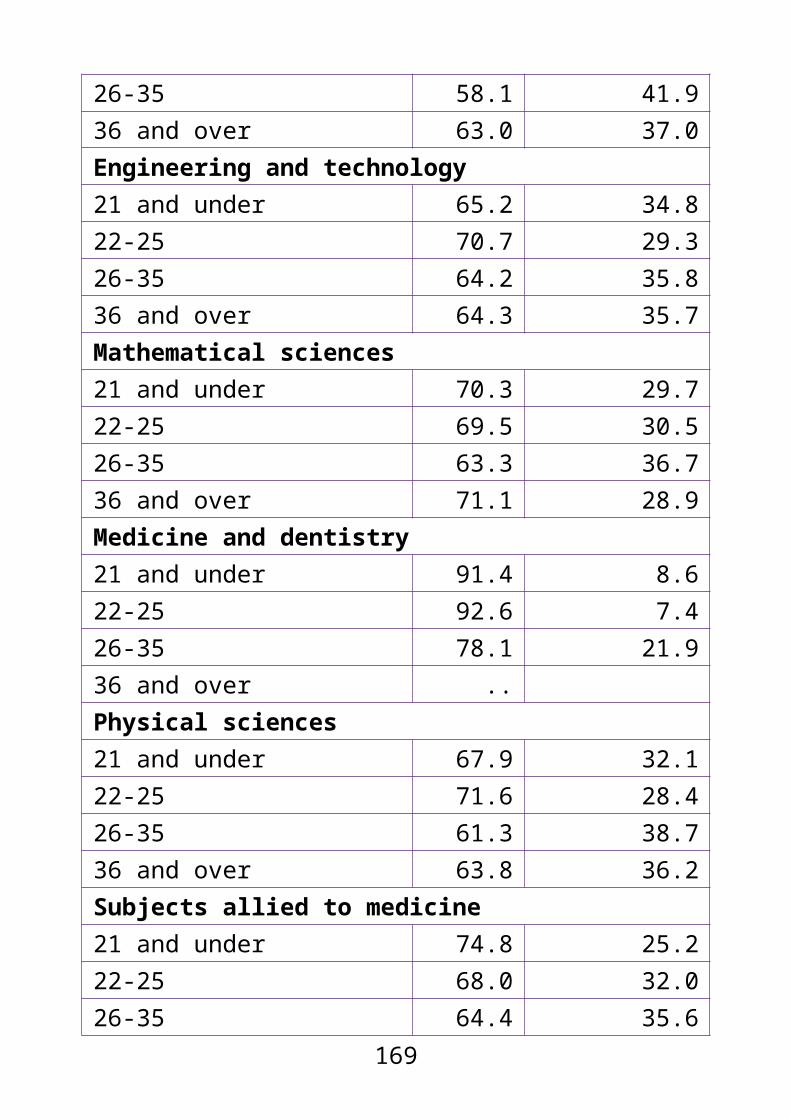
Percentages based on total number of students minus those whose subject area or DSA take-up is unknown.
All students in subject areas by disability status
Non-disabled
Disabled
Agriculture and related subjects 87.6 12.4Architecture, building, and planning 90.7 9.3
Biological sciences 89.1 10.9Computer science 90.3 9.7Engineering and technology 93.3 6.7Mathematical sciences 92.5 7.5Medicine and dentistry 92.9 7.1Physical sciences 89.6 10.4Subjects allied to medicine 91.1 8.9Veterinary science 87.1 12.9SET total 90.9 9.1Business, administrative studies 94.7 5.3Combined 86.8 13.2Creative arts and design 83.3 16.7Education 91.8 8.2Historical, philosophical studies 87.0 13.0Languages 91.2 8.8Law 92.0 8.0Mass communications, documentation 90.2 9.8
Social studies 89.1 10.9Non-SET total 90.3 9.7
169
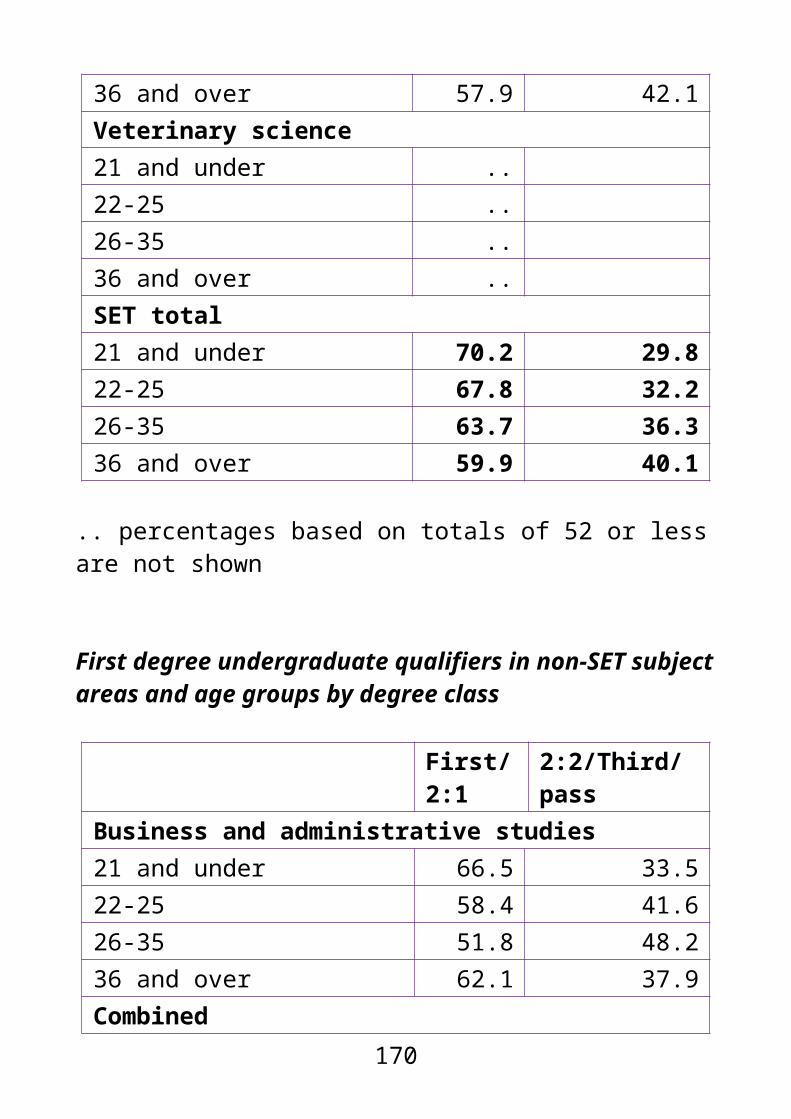
All disabled students in subject areas by DSA take-up
Receives DSA
Does not receive DSA
Agriculture and related subjects 51.8 48.2Architecture, building, and planning 52.7 47.3
Biological sciences 47.1 52.9Computer science 46.5 53.5Engineering and technology 47.9 52.1Mathematical sciences 40.6 59.4Medicine and dentistry 50.6 49.4Physical sciences 47.0 53.0Subjects allied to medicine 45.1 54.9Veterinary science 52.4 47.6SET total 47.0 53.0Business, administrative studies 42.5 57.5Combined 17.1 82.9Creative arts and design 59.0 41.0Education 44.9 55.1Historical, philosophical studies 40.8 59.2Languages 39.2 60.8Law 41.7 58.3Mass communications, documentation 50.4 49.6
Social studies 46.1 53.9Non-SET total 45.0 55.0
170

In every subject area, a higher proportion of first degree undergraduates disclosed as disabled than research and taught postgraduates (see fig. 2.14).
Within subject areas, the difference between the proportions of first degree undergraduates and other undergraduates who disclosed as disabled ranged from a 0.1% difference for business and administrative studies to an 8.3% difference for combined studies.
Overall, a higher proportion of disabled first degree undergraduates (50.8%) received DSA than disabled students in any other degree level (see fig. 2.14).
2.13 All undergraduates by subject area, degree level, disability status and DSA take-up
First degree undergraduateNon-disabled Disabled
No.%
No.%
SETAgriculture and related subjects 7910 85.
7 1325 14.3
Architecture, building, and planning 30185 90.
0 3360 10.0
Biological sciences 140095 88.6 18045 11.
4
Computer science 59830 89.3 7165 10.
7Engineering and technology 95740 92.
1 8240 7.9
Mathematical sciences 32760 92. 2750 7.7171
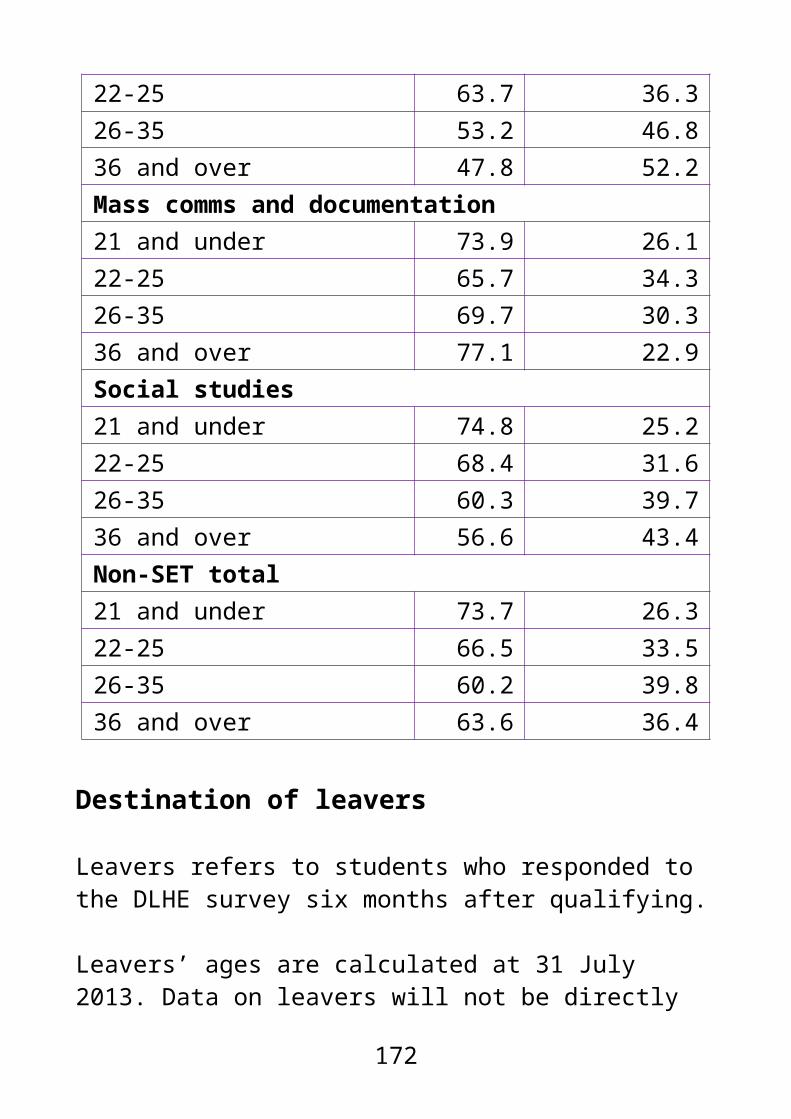
3
Medicine and dentistry 42225 91.7 3825 8.3
Physical sciences 62010 88.5 8030 11.
5Subjects allied to medicine 132895 89.
6 15490 10.4
Veterinary science 4155 85.9 685 14.
1
SET total 607800 89.8 68910 10.
2Non-SETBusiness, administrative studies 189425 93.
6 12845 6.4
Combined 28565 82.4 6085 17.
6
Creative arts and design 115665 82.4 24750 17.
6
Education 54945 89.6 6380 10.
4Historical, philosophical studies 59400 86.
2 9510 13.8
Languages 82460 90.2 8910 9.8
Law 60295 91.4 5660 8.6
Mass communications, documentation 34780 89.
7 4010 10.3
Social studies 130495 88.1 17580 11.
9
Non-SET total 756035 88.8 95735 11.
2
172

Total 1363835 89.2 164645 10.8
First degree undergraduatereceives DSA does not
receive DSA
No. % No. %SETAgriculture and related subjects 780 60.
5 510 39.5
Architecture, building, and planning 1875 57.
8 1370 42.2
Biological sciences 8605 49.3 8850 50.
7
Computer science 3425 49.6 3480 50.
4Engineering and technology 4260 53.
9 3640 46.1
Mathematical sciences 1160 43.6 1500 56.
4
Medicine and dentistry 2090 56.5 1610 43.
5
Physical sciences 3950 50.5 3870 49.
5Subjects allied to medicine 7605 51.
5 7165 48.5
Veterinary science 370 54.5 310 45.
5
SET total 34125 51.4 32305 48.
6Non-SET
173

Business, administrative studies 6105 49.
8 6150 50.2
Combined 1450 23.9 4625 76.
1
Creative arts and design 14700 61.5 9190 38.
5
Education 3475 57.5 2570 42.
5Historical, philosophical studies 4045 44.
1 5135 55.9
Languages 3595 41.8 5015 58.
2
Law 2405 44.4 3010 55.
6Mass communications, documentation 2100 54.
3 1770 45.7
Social studies 8745 51.3 8290 48.
7
Non-SET total 46620 50.5 45755 49.
5
Total 80740 50.8 78060 49.
2
Other undergraduateNon-disabled DisabledNo. % No. %
SETAgriculture and related subjects 5805 87.
6 825 12.4
Architecture, building, and planning 4340 91.
7 395 8.3
174

Biological sciences 9760 89.8 1105 10.
2
Computer science 5260 87.8 730 12.
2Engineering and technology 14385 94.
2 890 5.8
Mathematical sciences 860 89.7 100 10.
3
Medicine and dentistry 515 91.0 50 9.0
Physical sciences 3490 92.2 295 7.8
Subjects allied to medicine 67425 92.
0 5900 8.0
Veterinary science 50 90.7 5 9.3
SET total 111895 91.6 10295 8.4
Non-SETBusiness, administrative studies 27310 93.
5 1895 6.5
Combined 32135 90.7 3285 9.3
Creative arts and design 8820 84.2 1655 15.
8
Education 29805 91.9 2630 8.1
Historical, philosophical studies 6090 89.
7 700 10.3
Languages 16215 94.9 865 5.1
Law 2345 91. 230 9.0
175
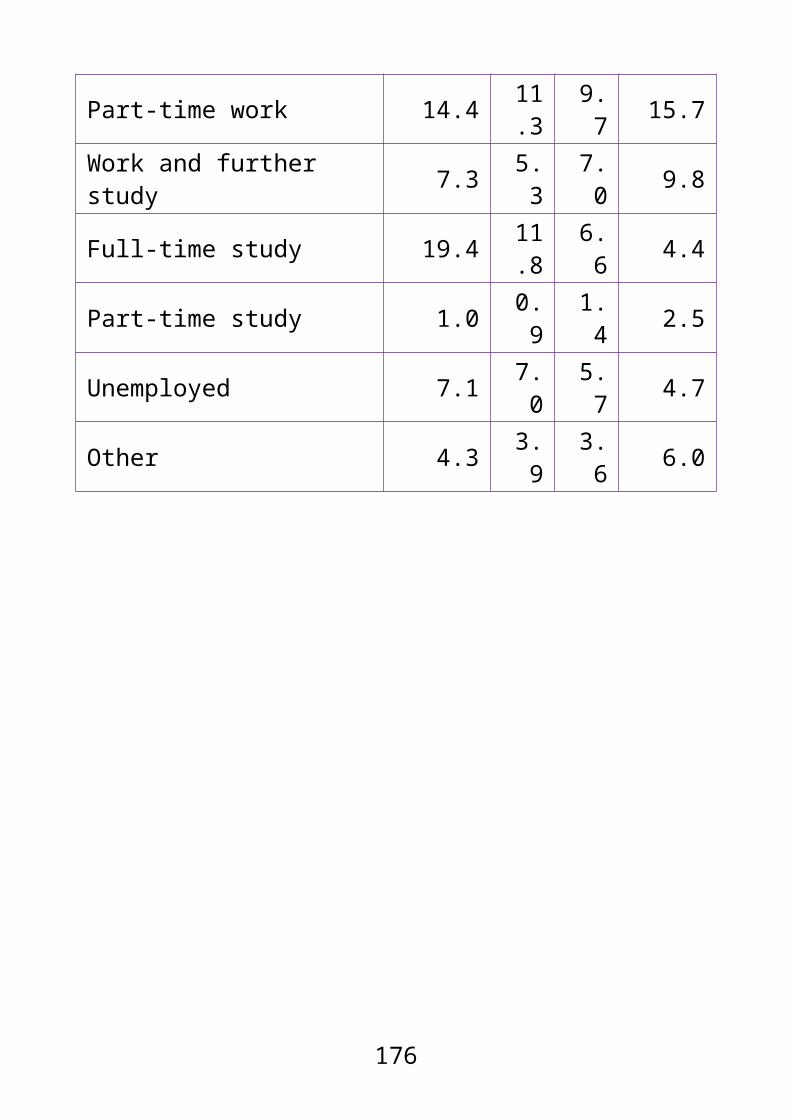
0Mass communications, documentation 1460 86.
3 230 13.7
Social studies 15490 88.6 2000 11.
4
Non-SET total 139670 91.2 13500 8.8
Total 251565 91.4 23795 8.6
Other undergraduatereceives DSA does not
receive DSA
No. % No. %SETAgriculture and related subjects 350 43.
6 450 56.4
Architecture, building, and planning 140 37.
7 230 62.3
Biological sciences 325 36.1 580 63.
9
Computer science 230 34.1 440 65.
9Engineering and technology 250 30.
8 565 69.2
Mathematical sciences 15 17.0 80 83.
0Medicine and dentistry 25 .. 25 ..
Physical sciences 85 30.9 195 69.
1Subjects allied to 2060 38. 3365 62.
176

medicine 0 0Veterinary science 0 .. 5 ..
SET total 3480 37.0 5930 63.
0Non-SETBusiness, administrative studies 450 25.
7 1305 74.3
Combined 150 4.7 3045 95.3
Creative arts and design 700 44.8 860 55.
2
Education 750 32.9 1535 67.
1Historical, philosophical studies 125 23.
2 415 78.8
Languages 165 25.8 480 74.
2
Law 70 31.7 145 68.
3Mass communications, documentation 100 47.
3 110 52.7
Social studies 420 22.5 1445 77.
5
Non-SET total 2925 23.9 9335 76.
1
Total 6405 29.6 15265 70.
4
.. Percentages based on totals of 52 or less are not shown. Percentages based on total number of students minus those whose subject area, degree level or DSA take-up is unknown.
177
Within all subject areas, a higher proportion of disabled taught postgraduates (32.5% received DSA than disabled research postgraduates (28.2%).
Within subject areas, the difference in the proportions of students who disclosed as disabled among research and taught postgraduates ranged from a 6.4% difference for combined studies to a 0.0% difference for medicine and dentistry, subjects allied to medicine, education and social studies.
178

2.14 All postgraduates by subject area, degree level, disability status and DSA take-up
Research postgraduateNon-disabled
Disabled
No. % No. %SETAgriculture and related subjects 880 95.
4 40 4.6
Architecture, building, and planning 1865 94.
4 110 5.6
Biological sciences 12115 92.5 990 7.5
Computer science 4230 94.6 240 5.4
Engineering and technology 12895 95.
3 630 4.7
Mathematical sciences 2525 94.0 160 6.0
Medicine and dentistry 8340 95.8 365 4.2
Physical sciences 10935 93.4 765 6.6
Subjects allied to medicine 6865 93.8 455 6.2
Veterinary science 315 94.5 20 5.5
SET total 60965 94.2 3780 5.8
Non-SETBusiness, administrative 6460 95. 280 4.1
179
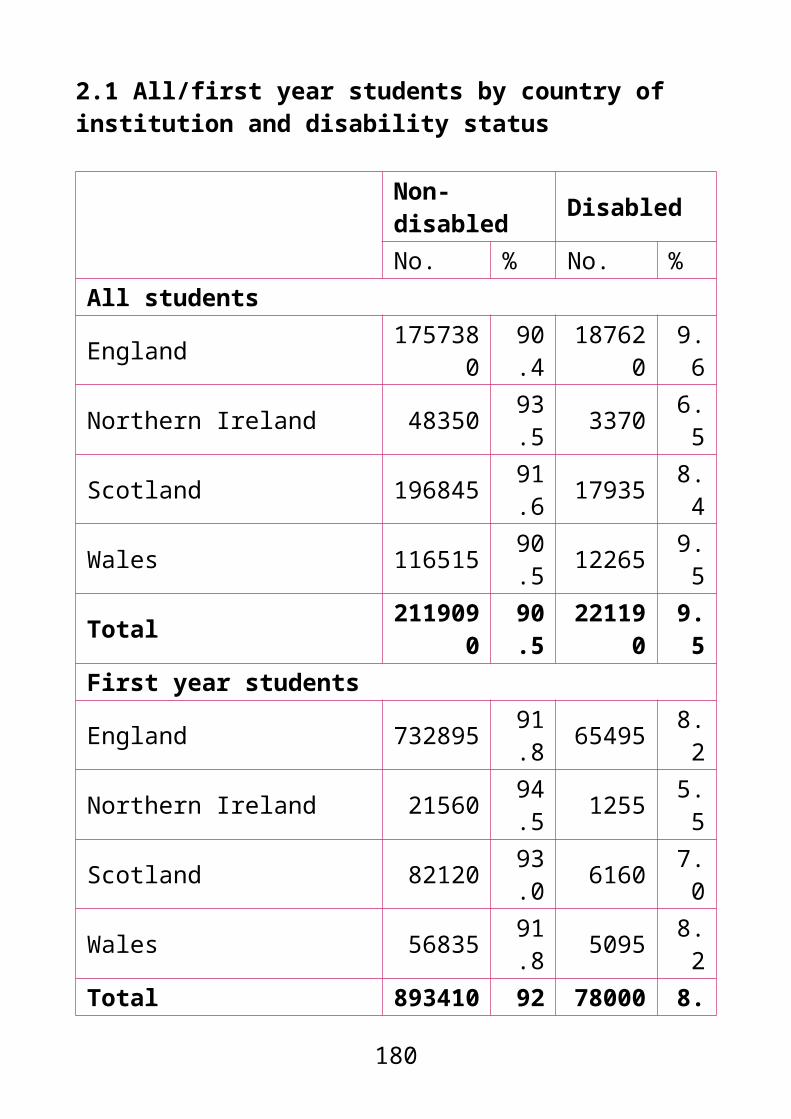
studies 9Combined 25 .. 0 ..
Creative arts and design 3500 89.0 430 11.
0
Education 6420 93.4 455 6.6
Historical, philosophical studies 6725 90.
5 710 9.5
Languages 5615 92.1 480 7.9
Law 2120 92.5 175 7.5
Mass communications, documentation 1075 93.
2 80 6.8
Social studies 9055 92.1 775 7.9
Non-SET total 40995 92.4 3385 7.6
Total 101965
93.4 7165 6.6
Research postgraduatereceives DSA
does not receive DSA
No. % No. %SETAgriculture and related subjects 5 .. 35 ..
Architecture, building, and planning 30 27.
2 75 72.8
Biological sciences 300 31. 645 68.
180

9 1
Computer science 70 30.3 160 69.
7Engineering and technology 160 26.
5 440 73.5
Mathematical sciences 35 21.5 125 78.
5
Medicine and dentistry 100 28.7 255 71.
5
Physical sciences 210 28.1 530 71.
9
Subjects allied to medicine 125 28.7 310 71.
3Veterinary science 5 .. 15 ..
SET total 1040 28.6 2585 71.
4Non-SETBusiness, administrative studies 60 23.
5 205 76.5
Combined 0 .. 0 ..
Creative arts and design 155 36.8 265 63.
2
Education 105 24.2 325 75.
8Historical, philosophical studies 160 24.
1 510 75.9
Languages 110 24.9 335 75.
1
Law 50 31.9 110 68.
1Mass communications, documentation 25 33.
5 50 66.5
181

Social studies 215 29.2 525 70.
8
Non-SET total 890 27.6 2325 72.
4
Total 1925 28.2 4910 71.
8
Taught postgraduateNon-disabled
Disabled
No. % No. %SETAgriculture and related subjects 2065 92.
4 170 7.6
Architecture, building, and planning 11415 91.
8 1025 8.2
Biological sciences 17600 90.7 1815 9.3
Computer science 11495 95.5 545 4.5
Engineering and technology 24480 96.
6 860 3.4
Mathematical sciences 2920 95.0 155 5.0
Medicine and dentistry 10945 95.8 480 4.2
Physical sciences 6915 91.8 615 8.2
Subjects allied to medicine 47730 93.8 3180 6.2
Veterinary science 500 93.6 35 6.4
182
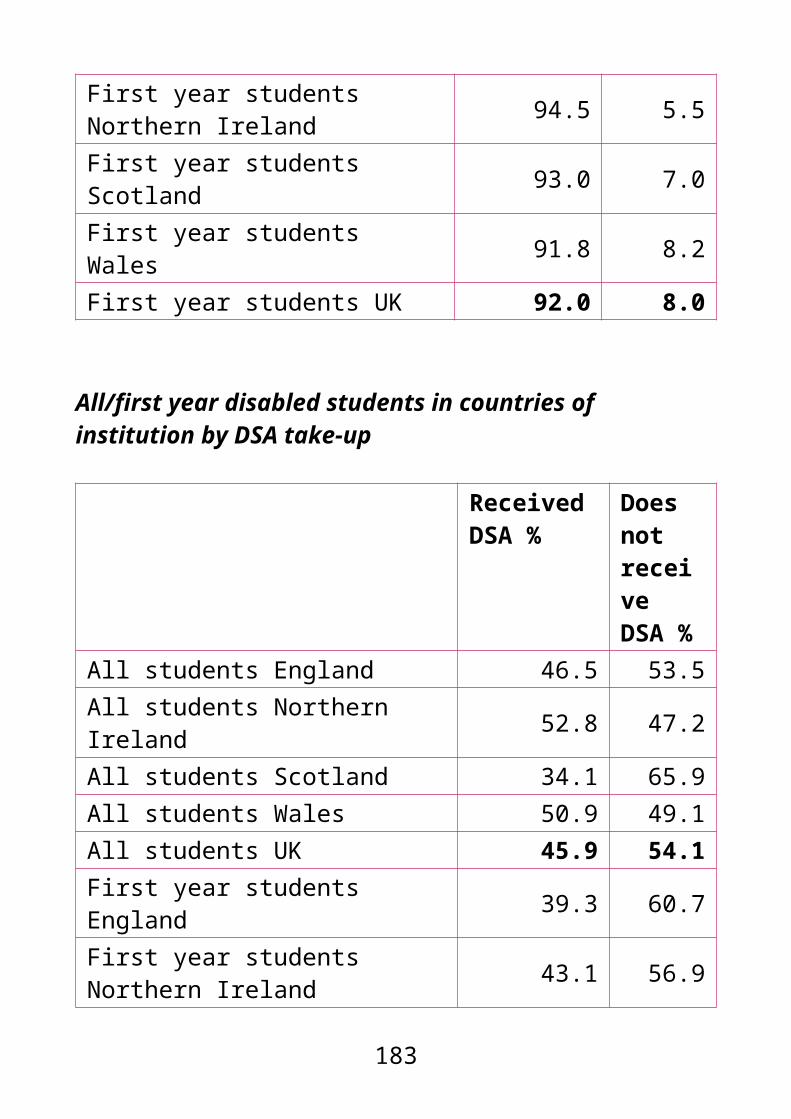
SET total 136070
93.9 8875 6.1
Non-SETBusiness, administrative studies 96285 97.
2 2745 2.8
Combined 148 93.6 100 6.4
Creative arts and design 15940 88.4 2095 11.
6
Education 74060 93.4 5225 6.6
Historical, philosophical studies 8490 88.
4 1115 11.6
Languages 9015 92.6 715 7.4
Law 17245 93.9 1115 6.1
Mass communications, documentation 8180 93.
1 610 6.9
Social studies 34965 92.1 2995 7.9
Non-SET total 265655
94.1 16710 5.9
Total 401725
94.0 25585 6.0
Postgraduate taughtreceives DSA
does not receive DSA
No. % No. %SET
183
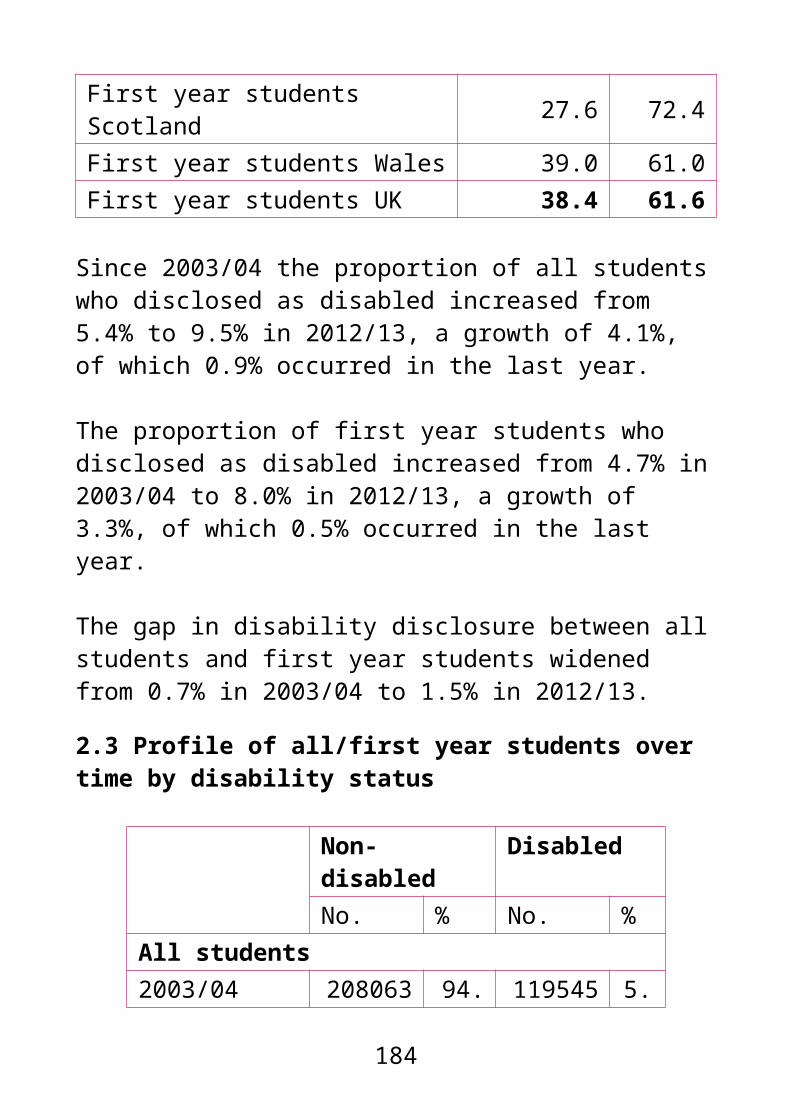
Agriculture and related subjects 50 31.
1 110 68.9
Architecture, building, and planning 420 43.
8 540 56.2
Biological sciences 655 38.5 1045 61.
5
Computer science 145 28.6 360 71.
4Engineering and technology 185 22.
8 625 77.2
Mathematical sciences 30 21.5 115 78.
5
Medicine and dentistry 85 19.0 365 81.
0
Physical sciences 185 31.7 395 68.
3
Subjects allied to medicine 840 28.5 2100 71.
5Veterinary science 10 .. 25 ..
SET total 2605 31.4 5680 68.
6Non-SETBusiness, administrative studies 535 21.
0 2005 79.0
Combined 5 6.9 95 93.1
Creative arts and design 885 44.3 1115 55.
7
Education 1750 36.7 3025 63.
3Historical, philosophical studies 330 31.
5 715 68.5
184

Languages 195 29.0 475 71.
0
Law 325 31.1 715 68.
9Mass communications, documentation 155 27.
7 410 72.3
Social studies 955 34.2 1835 65.
8
Non-SET total 5130 33.1 10385 66.
9
Total 7735 32.5 16065 67.
5
.. Percentages based on totals of 52 or less are not shown.Percentages based on total number of students minus those whose subject area, degree level or DSA take-up is unknown.
All students in SET subject areas and degree levels by disability status
Non-disabled
Disabled
Agriculture and related subjectsFirst degree UG 85.7 14.3Other UG 87.6 12.4Research PG 95.4 *Taught PG 92.4 7.6Architecture, building, and planningFirst degree UG 90.0 10.0Other UG 91.7 8.3Research PG 94.4 5.6
185
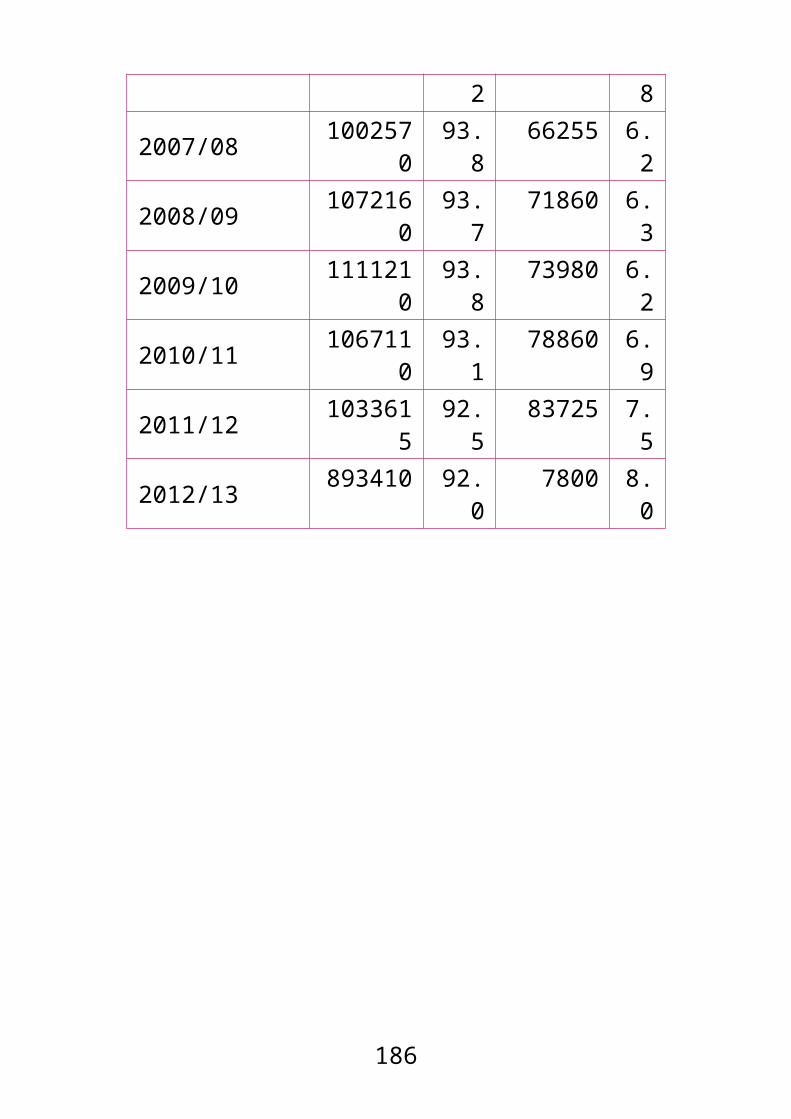
Taught PG 91.8 8.2Biological sciencesFirst degree UG 88.6 11.4Other UG 89.8 10.2Research PG 92.5 7.5Taught PG 90.7 9.3Computer scienceFirst degree UG 89.3 10.7Other UG 87.8 12.2Research PG 94.6 5.4Taught PG 95.5Engineering and technologyFirst degree UG 92.1 7.9Other UG 94.2 5.8Research PG 95.3Taught PG 96.6Mathematical sciencesFirst degree UG 92.3 7.7Other UG 87.7 10.3Research PG 94.0 6.0Taught PG 95.0 5.0Medicine and dentistryFirst degree UG 91.7 8.3Other UG 91.0 9.0Research PG 95.8Taught PG 95.8Physical sciencesFirst degree UG 88.5 11.5Other UG 92.2 7.8Research PG 93.4 6.6
186

Taught PG 91.8 8.2Subjects allied to medicineFirst degree UG 89.6 10.4Other UG 92.0 8.0Research PG 93.8 6.2Taught PG 93.8 6.2Veterinary scienceFirst degree UG 85.9 14.1Other UG 90.7 9.3Research PG 94.5 5.5Taught PG 93.6 6.4SET totalFirst degree UG 89.8 10.2Other UG 91.6 8.4Research PG 94.2 5.8Taught PG 93.9 6.1
* values less than 5.0 are not displayed
187

All students in non-SET subject areas and degree levels by disability status
Non-disabled
Disabled
Business, administrative studiesFirst degree UG 93.6 6.4Other UG 93.5 6.5Research PG 95.9 *Taught PG 97.2CombinedFirst degree UG 82.4 17.6Other UG 90.7 9.3Research PG ..Taught PG 93.6 6.4Creative arts and designFirst degree UG 82.4 17.6Other UG 84.2 15.8Research PG 89.0 11.0Taught PG 88.4 11.6EducationFirst degree UG 89.6 10.4Other UG 91.9 8.1Research PG 93.4 6.6Taught PG 93.4 6.6Historical, philosophical studiesFirst degree UG 86.2 13.8Other UG 89.7 10.3Research PG 90.5 9.5Taught PG 88.4 11.6
188
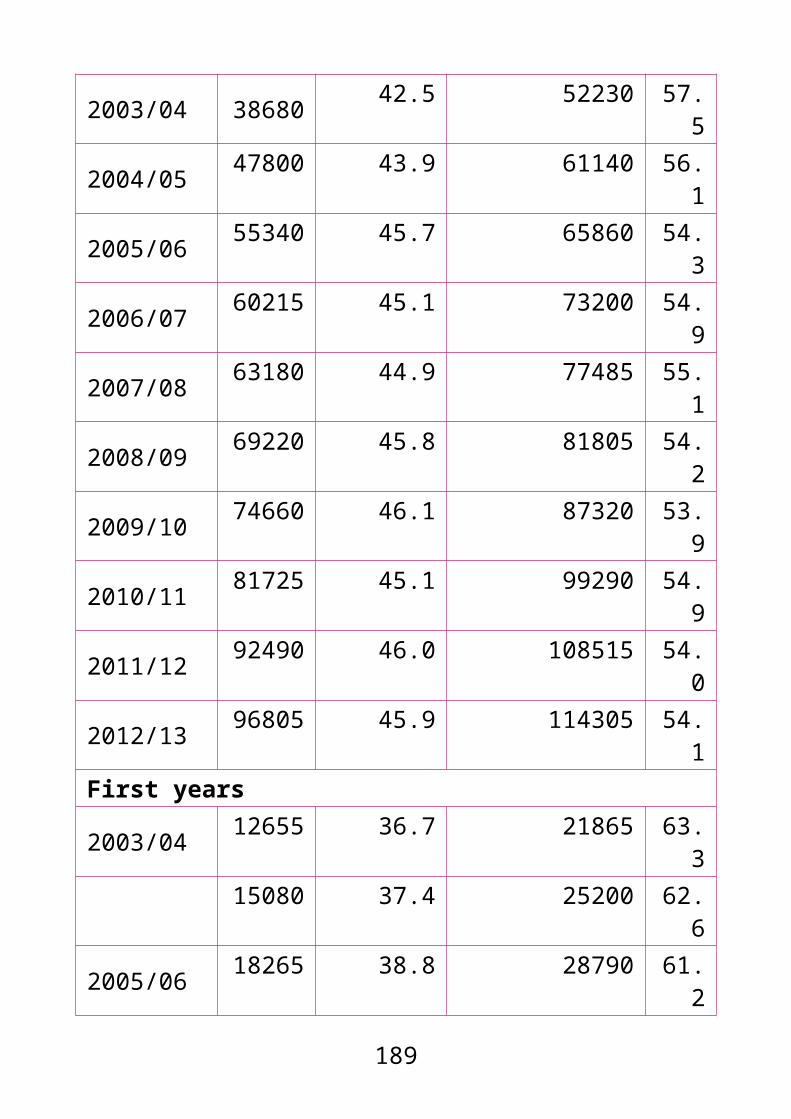
LanguagesFirst degree UG 90.2 9.8Other UG 94.9 5.1Research PG 92.1 7.9Taught PG 92.6 7.4LawFirst degree UG 91.4 8.6Other UG 91.0 9.0Research PG 92.5 7.5Taught PG 93.9 6.1Mass communications, documentationFirst degree UG 89.7 10.3Other UG 86.3 13.7Research PG 93.2 6.8Taught PG 93.1 6.9Social studiesFirst degree UG 88.1 11.9Other UG 88.6 11.4Research PG 92.1 7.9Taught PG 92.1 7.9Non-SET totalFirst degree UG 88.8 11.2Other UG 91.2 8.8Research PG 92.4 7.6Taught PG 94.1 5.9
* values less than 5.0 are not displayed.. percentages based on totals of 52 or less are not shown
189

In every subject area, a higher proportion of first year first degree undergraduates disclosed as disabled than first year research and taught postgraduates.
This difference was most pronounced within agriculture and related subjects, where 14.5% of first year first degree undergraduates disclosed as disabled, compared with 3.7% of first year research postgraduates.
2.15 First year students by subject area, degree level and disability status
First degree undergraduateNon-disabled DisabledNo. % No. %
SETAgriculture and related subjects 2480 85.5 420 14.
5Architecture, building, and planning 9100 91.7 825 8.3
Biological sciences 46930 89.6 5425 10.4
Computer science 20095 90.0 2240 10.0
Engineering and technology 30225 93.4 2145 6.6
Mathematical sciences 10015 93.0 755 7.0Medicine and dentistry 8925 93.3 645 6.7
Physical sciences 18890 89.3 2250 10.7
Subjects allied to medicine 47140 90.4 5000 9.6
Veterinary science 970 92.0 85 8.0190
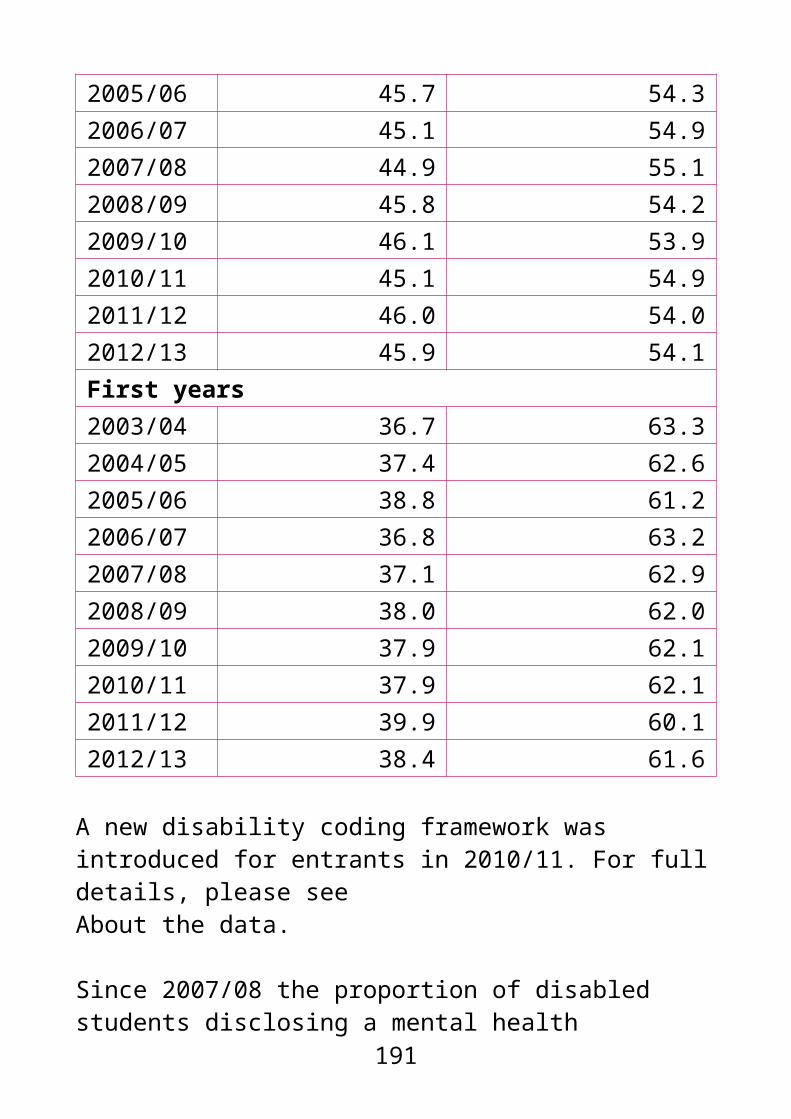
SET total 194770 90.8 19790 9.2
Non-SETBusiness, administrative studies 69395 94.6 3935 5.4
Combined 8245 83.3 1655 16.7
Creative arts and design 39260 84.3 7285 15.7
Education 19480 90.2 2120 9.8Historical, philosophical studies 17420 87.0 2610 13.
0Languages 23625 91.1 2305 8.9Law 20590 92.3 1725 7.7Mass communications, documentation 11765 90.4 1245 9.6
Social studies 42885 89.2 5180 10.8
Non-SET total 252665 90.0 28055 10.
0
Total 447435 90.3 47845 9.7
Other undergraduateNon-disabled DisabledNo. % No. %
SETAgriculture and related subjects 3400 90.5 355 9.5
Architecture, building, and planning 1855 91.8 165 8.2
191

Biological sciences 6135 90.9 610 9.1
Computer science 2735 87.3 400 12.7
Engineering and technology 8380 94.8 460 5.2
Mathematical sciences 350 91.8 30 8.2Medicine and dentistry 265 92.6 20 7.4Physical sciences 2015 93.4 145 6.6Subjects allied to medicine 40510 94.2 2490 5.8
Veterinary science 20 .. 0 ..SET total 65670 93.4 4680 6.6Non-SETBusiness, administrative studies 14495 93.9 935 6.1
Combined 26240 91.0 2600 9.0
Creative arts and design 4520 85.8 750 14.2
Education 17585 92.5 1425 7.5Historical, philosophical studies 3510 90.8 355 9.2
Languages 13880 95.4 670 4.6Law 1635 91.5 155 8.5Mass communications, documentation 705 87.5 100 12.
5
Social studies 9850 89.7 1125 10.3
Non-SET total 92425 91.9 8115 8.1
Total 158095 92.5 12795 7.5
192

Research postgraduateNon-disabled DisabledNo. % No. %
SETAgriculture and related subjects 275 96.3 10 3.7
Architecture, building, and planning 610 95.2 30 4.8
Biological sciences 3940 92.6 315 7.4Computer science 1360 94.6 80 5.4Engineering and technology 4180 95.8 185 4.2
Mathematical sciences 865 95.1 45 4.9Medicine and dentistry 2585 95.9 110 4.1Physical sciences 3615 94.4 215 5.6Subjects allied to medicine 2235 94.4 135 5.6
Veterinary science 115 98.3 0 1.7SET total 19780 94.6 1125 5.4Non-SETBusiness, administrative studies 1945 96.0 80 4.0
Combined 10 .. 0 ..Creative arts and design 1030 90.8 105 9.2Education 1710 92.1 145 7.9Historical, philosophical studies 2145 91.3 205 8.7
Languages 1925 92.2 165 7.8Law 645 92.7 50 7.3Mass communications, documentation 350 95.2 20 4.8
193
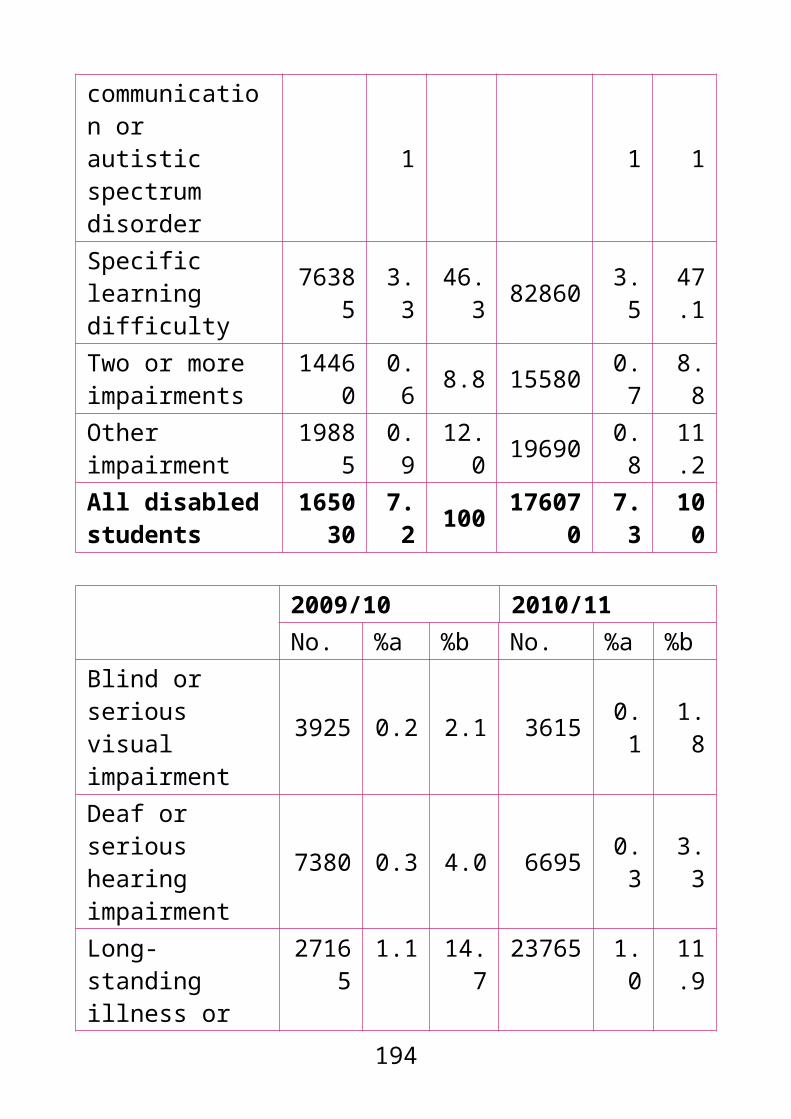
Social studies 2910 92.9 225 7.1Non-SET total 12680 92.7 990 7.3Total 32460 93.9 2115 6.1
Taught postgraduateNon-disabled DisabledNo. % No. %
SETAgriculture and related subjects 1255 93.6 85 6.4
Architecture, building, and planning 6745 92.9 515 7.1
Biological sciences 10770 91.5 1000 8.5Computer science 7055 95.8 310 4.2Engineering and technology 15870 97.0 485 3.0
Mathematical sciences 2180 95.3 105 4.7Medicine and dentistry 6425 95.5 300 4.5Physical sciences 4990 92.6 395 7.4Subjects allied to medicine 26575 93.8 1765 6.2
Veterinary science 225 93.4 15 6.6SET total 82085 94.3 4980 5.7Non-SETBusiness, administrative studies 61475 97.6 1535 2.4
Combined 1270 93.6 85 6.4
Creative arts and design 10275 90.0 1140 10.0
Education 47390 93.1 3525 6.9Historical, philosophical 5300 88.6 685 11.
194

studies 4Languages 6320 93.5 435 6.5Law 12325 94.6 710 5.4Mass communications, documentation 5910 94.1 370 5.9
Social studies 23070 92.8 1780 7.2
Non-SET total 173340 94.4 10265 5.6
Total 255420 94.4 15250 5.6
.. Percentages based on totals of 52 or less are not shown.Percentages based on total number of students minus those whose subject area or degree level is unknown.
195

Continuation
Entrants refers to full-time first degree UK-domiciled 2011/12 entrants. Continuation data indicates the progress of these entrants to 2012/13.
A lower proportion of disabled entrants continued or qualified (90.3%) than non-disabled entrants (91.5%).
2.16 UK-domiciled full-time first degree entrants by continuation category and disability status
Continue or qualify
Transfer No longer in HE
No. % No. % No. %Non-disabled
320630 91.5 667
01.9
23045 6.6
Disabled 34850 90.3 680 1.
8 3040 7.9
Total 355480 91.4 735
01.9
26085 6.7
.. Percentages based on totals of 52 or less are not shown.Percentages based on total number of students minus those whose continuation category is unknown.
UK-domiciled disabled/non-disabled full-time first degree entrants by continuation category
Continue or qualify
Transfer
No longer in HE
% % %Non-disabled 91.5 1.9 6.6
196

Disabled 90.3 1.8 7.9Total 91.4 1.9 6.7
Degree attainment
Qualifiers refers to first degree undergraduate qualifiers. The disability degree attainment gap is calculated: % non-disabled first/2:1 – % disabled first/2:1.
61.6% of disabled qualifiers with two or more impairments obtained a first/2:1 compared with 68.9% of those with a mental health condition.
A higher proportion of disabled qualifiers who received DSA obtained a first/2:1 (66.9%) than those who did not receive DSA (65.3%).
Compared with 2011/12, the proportion of disabled qualifiers who received a first/2:1 increased from 63.9% to 66.0%, an increase of 2.1% [see fig. 3.17, ECU (2013)].
2.17 First degree undergraduate qualifiers by degree class, disability status, DSA take-up and impairment type
First/2:1 2:1/third/pass
No. % No. %
Non-disabled 231900
68.1
108675 31.9
Disabled 25090 66.0 12940 34.0
Blind or serious visual impairment 335 65.
3 180 34.7
197

Deaf or serious hearing impairment 595 68.
8 270 31.2
Long-standing illness or health condition 2615 68.
4 1205 31.6
Mental health condition 2550 68.9 1155 31.1
Personal care support 0 .. 0 ..Physical impairment/mobility issues
770 67.1 380 32.9
Social communication or autistic spectrum disorder
475 62.8 280 37.2
Specific learning difficulty 14075 65.
3 7485 34.7
Two or more impairments 1315 61.
6 820 38.4
Other impairment 2360 66.9 1165 33.1
Total 256990
67.9
121610 32.1
Disabled: receives DSA 13955 66.9 6905 33.1
Disabled: does not receive DSA 10430 65.
3 5535 34.7
Disabled: known DSA status 24385 66.
2 12440 33.8
.. Percentages based on totals of 52 or less are not shown.Percentages based on total number of students minus those whose degree class, DSA take-up or impairment type is unknown.
198

Disabled full-time first degree undergraduate qualifiers in impairment types by degree class
First/2:1 % 2:1/third/pass %
Blind or serious visual impairment 65.3 34.7
Deaf or serious hearing impairment 68.8 31.2
Long-standing illness or health condition 68.4 31.6
Mental health condition 68.9 31.1Personal care support ..Physical impairment/mobility issues
67.1 32.9
Social communication or autistic spectrum disorder
62.8 37.2
Specific learning difficulty 65.3 34.7Two or more impairments 61.6 38.4
Other impairment 66.9 33.1
.. percentages based on totals of 52 or less are not shown
The disability degree attainment gap was highest in Northern Ireland (8.2%) and lowest in Wales (0.7%).
With the exception of Wales, in every nation the proportion of qualifiers receiving a first/2:1 was higher among disabled qualifiers who received DSA than disabled qualifiers who did not receive DSA. This gap was widest in Northern Ireland (2.9%) followed by England (2.0%).
199

Compared with 2011/12, the proportion of disabled qualifiers gaining a first/2:1 increased in all countries, ranging from a 1.2% increase in Wales to 4.7% in Northern Ireland [see fig. 3.18, ECU (2013)].
200

2.18 First degree undergraduate qualifiers by country of institution, degree class, disability status and DSA take-up
First/2:1 2:2/Third/passNo. % No. %
England
Non-disabled 19780 68.0
92970 32.0
Disabled 21620 66.1
11095 33.9
Disabled: receives DSA 12190 67.
25940 32.8
Disabled: does not receive DSA 8820 65.
24705 34.8
Total 219420
67.8
104065
32.2
Northern Ireland
Non-disabled 5525 69.5 2420 30.5
Disabled 395 61.3 250 38.7
Disabled: receives DSA 250 62.
1 155 37.9
Disabled: does not receive DSA 140 59.
2100 40.8
Total 5920 68.9
2675 31.1
Scotland
Non-disabled 16255 72.8 6070 27.2
Disabled 1740 68. 790 31.2
201

8Disabled: receives DSA 720 69.
4 315 30.6
Disabled: does not receive DSA 985 68.
5 455 31.5
Total 17995 72.4 6860 27.6
Wales
Non-disabled 12320 63.1 7215 36.9
Disabled 1335 62.4 805 37.6
Disabled: receives DSA 795 61.
8 495 38.2
Disabled: does not receive DSA 480 63.
2 280 36.8
Total 13650 63.0 8015 37.0
Percentages based on total number of students minus those whose country of institution, degree class or DSA take-up is unknown.
Disabled/non-disabled first degree undergraduate qualifiers in countries of institution and DSA status by degree class
First/2:1
2:2/Third/pass
% %England Non-disabled 68.0 32.0
202

Disabled 66.1 33.9Disabled: receives DSA 67.2 32.8Disabled: does not receive DSA 65.2 34.8
Northern IrelandNon-disabled 69.5 30.5Disabled 61.3 38.7Disabled: receives DSA 62.1 37.9Disabled: does not receive DSA 59.2 40.8
ScotlandNon-disabled 72.8 27.2Disabled 68.8 31.2Disabled: receives DSA 69.4 30.6Disabled: does not receive DSA 68.5 31.5
WalesNon-disabled 63.1 36.9Disabled 62.4 37.6Disabled: receives DSA 61.8 38.2Disabled: does not receive DSA 63.2 36.8
With the exception of medicine and dentistry and business and administrative studies, in every subject area a higher proportion of non-disabled qualifiers received a first/2:1 than disabled qualifiers.
The largest differences were in historical and philosophical studies (7.2% difference), closely followed by mathematical sciences (7.1% difference).
203

64.9% of disabled qualifiers studying business and administrative studies received a first/2:1, compared with 59.9% of non-disabled qualifiers (a 5.0% difference). A higher proportion of disabled qualifiers studying medicine and dentistry also received a first/2:1 compared with nondisabled qualifiers, although the gap was small (0.6%).
204

2.19 First degree undergraduate qualifiers by subject area, degree class and disability status
FirstNon-disabled DisabledNo. % No. %
SETAgriculture and related subjects 400 17.6 50 12.
8Architecture, building, and planning 1545 17.8 155 16.
9
Biological sciences 5650 16.5 560 14.6
Computer science 3220 24.0 350 28.8
Engineering and technology 5880 27.3 415 24.
0
Mathematical sciences 2640 34.5 150 26.9
Medicine and dentistry 565 38.0 50 40.3
Physical sciences 3435 24.0 325 18.6
Subjects allied to medicine 6660 21.0 585 17.
4Veterinary science 5 .. 0 ..
SET total 30005 22.2 2640 18.8
Non-SETBusiness, administrative studies 8630 15.6 565 16.
9Combined 420 16.4 55 15.
205

2
Creative arts and design 6430 19.2 1255 17.0
Education 2490 15.8 225 13.0
Historical, philosophical studies 2785 17.8 320 13.
9
Languages 4010 18.7 355 17.2
Law 1690 10.7 160 12.8
Mass communications, documentation 1470 14.3 155 13.
0
Social studies 5420 15.5 550 12.7
Non-SET total 33345 16.3 3635 15.2
Total 63350 18.6 6275 16.5
2:1Non-disabled DisabledNo. % No. %
SETAgriculture and related subjects 1060 46.4 170 45.
0Architecture, building, and planning 4260 49.1 445 47.
6
Biological sciences 17700 51.6 1875 49.0
Computer science 5155 38.4 530 37.3
206

Engineering and technology 8905 41.4 760 44.
1
Mathematical sciences 2725 35.6 205 36.1
Medicine and dentistry 785 53.0 60 51.3
Physical sciences 6595 46.0 790 45.6
Subjects allied to medicine 14450 45.6 1525 45.
3Veterinary science 35 .. 0 ..
SET total 61665 45.5 6365 45.2
Non-SETBusiness, administrative studies 24450 44.3 1605 48.
0
Combined 1155 45.2 150 41.3
Creative arts and design 17040 51.0 3680 49.9
Education 7710 49.0 815 47.2
Historical, philosophical studies 9990 63.8 1385 60.
5
Languages 13250 61.7 1260 60.8
Law 8735 55.3 650 52.0
Mass communications, documentation 5725 55.7 645 54.
2
Social studies 18825 53.7 2260 52.1
207

Non-SET total 106885 52.1 12450 52.
0
Total 168550 49.5 18815 49.
5
2:2Non-disabled DisabledNo. % No. %
SETAgriculture and related subjects 675 29.7 125 33.
2Architecture, building, and planning 2255 26.0 255 27.
5
Biological sciences 9125 26.6 1150 29.9
Computer science 3655 27.2 390 27.6
Engineering and technology 5245 24.4 435 25.
2
Mathematical sciences 1690 22.1 165 28.9
Medicine and dentistry 100 6.6 5 5.0
Physical sciences 3525 24.6 490 28.1
Subjects allied to medicine 8220 25.9 955 28.
5Veterinary science 10 .. 5 ..
SET total 34490 25.5 3975 28.2
Non-SETBusiness, administrative studies 17540 31.8 970 29.
0208

Combined 695 27.3 105 28.0
Creative arts and design 8045 24.1 2020 27.4
Education 4555 29.0 555 32.0
Historical, philosophical studies 2550 16.3 485 21.
2
Languages 3720 17.3 395 19.0
Law 4530 28.7 355 28.7
Mass communications, documentation 2640 25.7 330 27.
9
Social studies 8940 25.5 1250 28.8
Non-SET total 53215 25.9 6470 27.0
Total 87705 25.8 10440 27.5
Third/passNon-disabled DisabledNo. % No. %
SETAgriculture and related subjects 145 6.3 35 9.0
Architecture, building, and planning 620 7.2 75 8.0
Biological sciences 1825 5.3 250 6.5
Computer science 1395 10.4 150 10.4
209

Engineering and technology 1475 6.9 115 6.7
Mathematical sciences 585 7.7 45 8.0Medicine and dentistry 35 2.4 5 3.4Physical sciences 765 5.4 135 7.8Subjects allied to medicine 2375 7.5 295 8.8
Veterinary science 0 .. 0 ..SET total 9220 6.8 1100 7.8Non-SETBusiness, administrative studies 4605 8.3 205 6.1
Combined 285 11.1 55 15.5
Creative arts and design 1890 5.7 420 5.7Education 970 6.2 135 7.8Historical, philosophical studies 340 2.2 100 4.3
Languages 495 2.3 60 2.9Law 845 5.3 80 6.5Mass communications, documentation 440 4.3 60 5.0
Social studies 1880 5.4 280 6.4Non-SET total 11750 5.7 1395 5.8Total 20970 6.2 2495 6.6
.. Percentages based on totals of 52 or less are not shown.Percentages based on total number of students minus those whose subject area or degree class is unknown.
210

Disabled/non-disabled first degree undergraduate qualifiers in SET subject area by degree class
First 2:1 2:2 Third/pass
Agriculture and related subjects
Disabled 12.8 45.0
33.2
9.0
Non-disabled 17.6 46.4
29.7
6.3
Architecture, building, and planning
Disabled 16.9 47.6
27.5
8.0
Non-disabled 17.8 49.1
26.0
7.2
Biological sciences
Disabled 14.6 49.0
29.9
6.5
Non-disabled 16.5 51.6
26.6
5.3
Computer science
Disabled 24.8 37.3
27.6
10.4
Non-disabled 24.0 38.4
27.2
10.4
Engineering and technology
Disabled 24.0 44.1
25.2
6.7
Non-disabled 27.3 41.4
24.4
6.9
Mathematical sciencesDisabled 26.9 36. 28. 8.0
211

1 9
Non-disabled 34.5 35.6
22.1
7.7
Medicine and dentistry
Disabled 40.3 51.3
5.0 *
Non-disabled 38.0 53.0
6.6
Physical sciences
Disabled 18.6 45.6
28.1
7.8
Non-disabled 24.0 46.0
24.6
5.4
Subjects allied to medicine
Disabled 17.4 45.3
28.5
8.8
Non-disabled 21.0 45.6
25.9
7.5
Veterinary scienceDisabled ..Non-disabled ..SET total
Disabled 18.8 45.2
28.2
7.8
Non-disabled 22.2 45.5
25.5
6.8
* values less than 5.0 are not displayed.. percentages based on totals of 52 or less are not shown
212

Disabled/non-disabled first degree undergraduate qualifiers in non- SET subject area by degree class
First 2:1 2:2 Third/pass
Business and admin studies
Disabled 16.9 48.0
29.0
6.1
Non-disabled 15.6 44.3
31.8
8.3
Combined
Disabled 15.2 41.3
28.0
15.5
Non-disabled 16.4 45.2
27.3
11.1
Creative arts and design
Disabled 17.0 49.9
27.4
5.7
Non-disabled 19.2 51.0
24.1
5.7
Education
Disabled 13.0 47.2
32.0
7.8
Non-disabled 15.8 49.0
29.0
6.2
Historical and philosophical studies
Disabled 13.9 60.5
21.2
*
Non-disabled 17.8 63.8
16.3
LanguagesDisabled 17.2 60. 19.
213

8 0
Non-disabled 18.7 61.7
17.3
Law
Disabled 12.8 52.0
28.7
6.5
Non-disabled 10.7 55.3
28.7
5.3
Mass comms and documentation
Disabled 13.0 54.2
27.9
5.0
Non-disabled 14.3 55.7
25.7
Social studies
Disabled 12.7 52.1
28.8
6.4
Non-disabled 15.5 53.7
25.5
5.4
Non-SET total
Disabled 15.2 52.0
27.0
5.8
Non-disabled 16.3 52.1
25.9
5.7
* values less than 5.0 are not displayed
Destination of leavers
Leavers refers to students who responded to the DLHE survey six months after qualifying.
214

A lower proportion of disabled leavers worked full-time (50.4%) than nondisabled leavers (58.0%). 8.8% of disabled leavers were unemployed compared with 6.1% of non-disabled leavers.
55.8% of leavers who disclosed a specific learning disability worked full-time, compared with 30.1% who disclosed a social communication or autistic spectrum disorder.
2.20 DLHE leavers by leaving destination, disability status and impairment type
Non-disabled
Disabled
No. % No. %
Full-time work total 222305
58.0
22465
50.4
Professional full-time work
179215
46.8
17555
39.4
Non-professional full-time work 42590 11.
1 4860 10.9
Unknown full-time work 500 0.1 55 0.1
Part-time work 46845 12.2 6420 14.
4Work/further study 26175 6.8 2970 6.7
Full-time study 44065 11.5 5450 12.
2Part-time study 4575 1.2 850 1.9Unemployed 23535 6.1 3930 8.8Other 15815 4.1 2465 5.5
Total 383320 100 4455
0 100
215

Blind/serious visual impairment
Deaf/serious hearing impairment
% %Full-time work total 38.9 50.5
Professional full-time work 28.6 41.3
Non-professional full-time work 10.2 9.1
Unknown full-time work 0.0 0.2Part-time work 15.8 14.7Work/further study 5.4 7.2Full-time study 16.1 11.3Part-time study 3.6 2.2Unemployed 12.5 7.8Other 7.7 6.3Total 100 100
216

Long-standing illness/health condition
Mental health condition
% %Full-time work total 51.6 42.1
Professional full-time work 40.4 30.0
Non-professional full-time work 11.0 12.0
Unknown full-time work 0.2 0.2Part-time work 14.2 15.6Work/further study 7.2 7.3Full-time study 12.1 14.0Part-time study 1.4 2.7Unemployed 8.2 11.4Other 5.3 6.8Total 100 100
Personal care support
Physical impairment/mobility issues
% %Full-time work total .. 39.0
Professional full-time work .. 31.4
Non-professional full-time work .. 7.5
Unknown full-time work .. 0.0
217

Part-time work .. 15.2Work/further study .. 6.9Full-time study .. 13.3Part-time study .. 3.2Unemployed ... 13.5Other .. 9.1Total .. 100
Social comm/autistic spectrum disorder
Specific learning difficulty
% %Full-time work total 30.1 55.8
Professional full-time work 22.6 43.9Non-professional full-time work 7.5 11.7
Unknown full-time work 0.0 0.1Part-time work 17.7 14.0Work/further study 4.3 5.8Full-time study 19.9 11.6Part-time study 2.4 1.2Unemployed 22.0 7.5Other 3.6 4.1Total 100 100
Two or more impairments
Another impairment/medical cond.
% %
218

Full-time work total 32.7 46.8Professional full-time work 25.7 36.8
Non-professional full-time work 7.0 10.0
Unknown full-time work 0.0 0.0
Part-time work 13.9 14.9Work/further study 9.4 9.2Full-time study 13.8 11.2Part-time study 6.1 2.3Unemployed 10.8 9.0Other 13.3 6.5Total 100 100
.. Percentages based on totals of 52 or less are not shown.Percentages based on total number of leavers minus those whose leaving destination or impairment type is unknown.
Disabled/non-disabled DLHE leavers by leaving destination
Non-disabled%
Disabled%
Full-time work total 58.0 50.4Other destinations 42.0 49.6
Professional full-time work 46.8 39.4Non-professional full-time work 11.1 10.9
Unknown full-time work 0.1 0.1
219

Part-time work 12.2 14.4Work/further study 6.8 6.7Full-time study 11.5 12.2Part-time study 1.2 1.9Unemployed 6.1 8.8Other 4.1 5.5
220

3 Ethnicity
The proportion of UK-domiciled students who were black and minority ethnic (BME) increased from 14.9% in 2003/04 to 19.6% in 2012/13, a difference of 4.7%.
77.7% of UK-domiciled Chinese research postgraduates studied full-time compared with 52.2% of UK-domiciled black research postgraduates (a 25.5% difference).
A higher proportion of UK-domiciled BME students studied SET subjects (47.9%) than UK-domiciled white students (43.7%). However, this varied by ethnic group. For example, 51.8% of both UK-domiciled Asian and Chinese students studied SET subjects, compared with 41.0% of UK-domiciled mixed students.
10.8% of UK-domiciled black: Caribbean full-time first degree entrants and 10.7% of UK-domiciled full-time first degree entrants of an other black background were no longer in HE, compared with 5.0% of UK-domiciled Asian: Indian and 5.3% of UK-domiciled Chinese full-time first degree entrants.
In all nations, the proportion of UK-domiciled black qualifiers receiving a first/2:1 was lower than for all other ethnic groups. The gap was particularly wide in England, where 73.8% of UK domiciled white first degree qualifiers received a first/2:1, compared with 46.8% of UK-domiciled black first degree qualifiers (a 27.0% difference).
The ethnicity degree attainment gap has decreased from a peak of 18.8% in 2005/06 to 16.1% in 2012/13, and is at its lowest since 2003/04. Nevertheless, the gap in attainment compared with UK-domiciled white first degree qualifiers remains considerable, particularly for UK-domiciled black: African first degree qualifiers
221

(with a gap of 26.8%) and UK domiciled black: Caribbean first degree qualifiers (24.5%).
The ethnicity degree attainment gap was larger among UK domiciled first degree qualifiers who studied non-SET subjects than among those who studied SET subjects.
In every subject, a higher proportion of UK-domiciled white first degree qualifiers received a first/2:1 than UK-domiciled BME first degree qualifiers.
Ethnicity overview
This section presents ethnicity data for UK-domiciled students only.
In 2012/13, 98.0% of students disclosed ethnicity information.
Of those with known ethnicity information, 19.6% of students were BME. However the proportions varied considerably by country, from 22.1% of students in England to 2.3% in Northern Ireland.
46.0% of students studying in London were BME. Excluding London from the England figures brings the proportion of students who were BME to 17.2%.
20.1% of first year students were BME, compared with 19.6% of all students.
222

3.1 All/first year UK-domiciled students by country of institution and ethnic group
White BME total
No. % No. %All studentsEngland 1221790 77.9 346955 22.1
London 144665 54.0 123335 46.0Eng.exc. London 1077125 82.8 223620 17.2
Northern Ireland 42020 97.7 985 2.3
Scotland 150085 92.4 12290 7.6Wales 93950 92.0 8160 8.0UK total 1507845 80.4 368390 19.6First yearsEngland 464110 77.2 136690 22.8
London 58415 54.9 48045 45.1Eng.exc. London 405695 82.1 88645 17.9
Northern Ireland 16850 97.4 455 2.6
Scotland 56500 92.4 4630 7.6Wales 41270 91.3 3935 8.7UK first years total 578730 79.9 145710 20.1
223

Black
All Caribbean African Other
No. % % % %
All studentsEngland 112825 7.2 1.8 5.1 0.4
London 45800 17.1 4.3 11.9 0.9Eng.exc. London 67025 5.2 1.2 3.7 0.3
Northern Ireland 170 0.4 0.0 0.3 0.0
Scotland 2525 1.6 0.1 1.3 0.1Wales 1895 1.9 0.3 1.4 0.1UK total 117420 6.3 1.5 4.4 0.3First yearsEngland 46230 7.7 1.8 5.5 0.4
London 18140 17.0 4.2 12.0 0.9Eng.exc. London 28090 5.7 1.3 4.1 0.3
Northern Ireland 90 0.5 0.0 0.4 0.0
Scotland 995 1.6 0.2 1.4 01Wales 980 2.2 0.3 1.7 0.2UK first years total
48300 6.7 1.5 4.8 0.3
224

Asian
All
No. %All studentsEngland 146270 9.3
London 48945 18.3Eng.exc. London 97325 7.5
Northern Ireland 330 0.8Scotland 5195 3.2Wales 3220 3.2UK total 155015 8.3First yearsEngland 56220 9.4
London 18530 17.4Eng.exc. London 37690 7.6
Northern Ireland 150 0.9Scotland 1895 3.1Wales 1560 3.5UK first years total 59830 8.3
225

Asian
Indian Pakistani Bangladeshi Other
% % % %
All studentsEngland 3.8 2.7 1.0 1.9
London 6.5 3.9 2.8 5.0Eng.exc. London 3.3 2.4 0.6 1.2
Northern Ireland 0.4 0.1 0.0 0.2
Scotland 1.0 1.4 0.1 0.7Wales 1.2 0.7 0.4 0.8UK total 3.4 2.4 0.8 1.7First yearsEngland 3.7 2.7 1.0 1.9
London 6.1 3.6 2.8 4.9Eng.exc. London 3.2 2.5 0.6 1.3
Northern Ireland 0.4 0.2 0.1 0.3
Scotland 0.9 1.5 0.1 0.6Wales 1.2 0.8 0.5 0.9UK first years total
3.2 2.4 0.9 1.7
226

Chinese Mixed
No. % No. %All studentsEngland 14395 0.9 53145 3.4
London 4355 1.6 15005 5.6Eng.exc. London 10040 0.8 38140 2.9
Northern Ireland 160 0.4 255 0.6Scotland 1270 0.8 2510 1.5Wales 560 0.5 1920 1.9UK total 16380 0.9 57830 3.1First yearsEngland 5305 0.9 20225 3.4
London 1610 1.5 5860 5.5Eng.exc. London 3695 0.7 14365 2.9
Northern Ireland 70 0.4 105 0.6Scotland 460 0.8 950 1.6Wales 260 0.6 825 1.8UK first years total 6090 0.8 22110 3.1
All Arab Other
No. % % %All studentsEngland 20325 1.3 0.1 1.1
London 9230 3.4 0.4 3.1Eng.exc. London 11090 0.9 0.1 0.8
Northern Ireland 75 0.2 0.0 0.2Scotland 790 0.5 0.1 0.4
227

Wales 560 0.5 0.1 0.5UK total 21745 1.2 0.1 1.0First yearsEngland 8710 1.5 0.3 1.1
London 3905 3.7 0.8 2.9Eng.exc. London 4810 1.0 0.2 0.8
Northern Ireland 35 0.2 0.0 0.2Scotland 330 0.5 0.1 0.4Wales 305 0.7 0.1 0.6UK first years total 9385 1.3 0.3 1.0
Unknown
No. %All studentsEngland 28695 1.8
London 6885 2.5Eng.exc. London 21810 1.6
Northern Ireland 2370 5.2Scotland 5465 3.3Wales 2250 2.2UK total 38780 2.0First yearsEngland 12815 2.1
London 3155 2.9Eng.exc. London 9660 1.9
Northern Ireland 2220 11.4Scotland 2505 3.9Wales 1400 3.0UK first years total 18940 2.5
228

Percentages based on total number of students minus those whose country of institution or ethnic group is unknown.
All UK-domiciled students in countries of institution by ethnic group
White
Black
Asian
Chinese
Mixed
Other
England 77.9 7.2 9.3 0.9 3.4 1.3London 54.0 17.1 18.3 1.6 5.6 3.4Eng.exc. London
82.8 5.2 7.5 0.8 2.9 0.9
Northern Ireland 97.7 0.4 0.8 0.4 0.6 0.2
Scotland 92.4 1.6 3.2 0.8 1.5 0.5Wales 92.0 1.9 3.2 0.5 1.9 0.5
The proportion of students who were BME increased from 14.9% in 2003/04 to 19.6% in 2012/13, a difference of 4.7%.
There has been an increase in the proportion of all BME groups with the exception of Chinese students, which has remained static.
The largest increase has been the proportion of black students which has risen from 4.4% in 2003/04 to 6.3% in 2012/13. The proportion of mixed students has more than doubled from 1.4% 2003/04 to 3.1% in 2012/13.
The proportion of white students has decreased from 85.1% in 2003/04 to 80.4% in 2012/13.
229

3.2 Profile of all UK-domiciled students over time by ethnic group
White %
BME total %
Black %
Asian %
2003/04 85.1 14.9 4.4 7.22004/05 84.5 15.5 4.7 7.32005/06 83.9 16.1 5.0 7.42006/07 83.4 16.6 5.2 7.52007/08 82.8 17.2 5.4 7.62008/09 82.2 17.8 5.7 7.72009/10 81.9 18.1 5.9 7.72010/11 81.6 18.4 5.9 7.82011/12 81.2 18.8 6.0 7.92012/13 80.4 19.6 6.3 8.3
Chinese % Mixed % Other %2003/04 0.9 1.4 0.92004/05 0.9 1.7 0.92005/06 0.9 1.9 0.92006/07 0.9 2.1 0.92007/08 0.9 2.3 1.02008/09 0.9 2.5 1.02009/10 0.9 2.6 1.02010/11 0.9 2.8 1.02011/12 0.9 2.9 1.12012/13 0.9 3.1 1.2
Percentages based on total number of students minus those whose ethnic group is unknown.
230
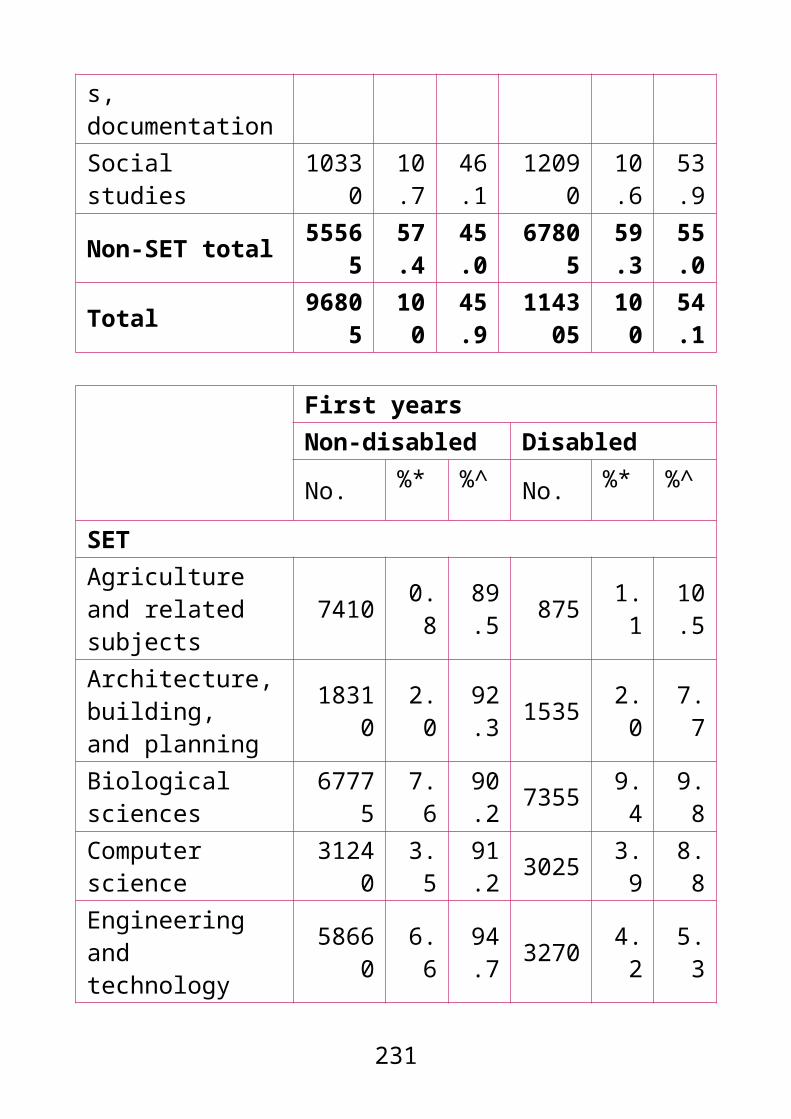
All UK-domiciled students over time by ethnic group
Chinese % Mixed % Other %2003/04 0.9 1.4 0.92004/05 0.9 1.7 0.92005/06 0.9 1.9 0.92006/07 0.9 2.1 0.92007/08 0.9 2.3 1.02008/09 0.9 2.5 1.02009/10 0.9 2.6 1.02010/11 0.9 2.8 1.02011/12 0.9 2.9 1.12012/13 0.9 3.1 1.2
Overall, 31.9% of all BME students were black and 42.1% were Asian. Among first year students, 33.1% were black and 41.1% were Asian.
22.6% of all BME students were black: African and 17.2% were Asian: Indian. Just 4.3% of all BME students were Asian: Bangladeshi and 0.7% were Arab.
3.3 All/first year BME UK-domiciled students by ethnic group
All students First yearsNo. % No. %
Black 117420 31.9 48300 33.1Black: Caribbean 28165 7.6 11150 7.7Black: African 83365 22.6 34675 23.8Other black background 5885 1.6 2475 1.7
Asian 155015 42.1 59830 41.1
231

Asian: Indian 63235 17.2 23495 16.1Asian: Pakistani 44840 12.2 17555 12.0Asian: Bangladeshi 15865 4.3 6280 4.3Other Asian background 31075 8.4 12495 8.6
Chinese 16380 4.4 6090 4.2Mixed 57830 15.7 22110 15.2Other 21745 5.9 9385 6.4
Arab 2450 0.7 1965 1.3Other 19300 5.2 7420 5.1
BME total 368390 100 145710 100
Percentages based on total number of students minus those whose ethnic group is unknown.
All/first year BME UK-domiciled students by ethnic group
All students First years% %
Black 31.9 33.1Black: Caribbean 7.6 7.7Black: African 22.6 23.8Other black background 1.6 1.7
Asian 42.1 41.1Asian: Indian 17.2 16.1Asian: Pakistani 12.2 12.0Asian: Bangladeshi 4.3 4.3Other Asian background 8.4 8.6
232

Chinese 4.4 4.2Mixed 15.7 15.2Other 5.9 6.4
Arab 0.7 1.3Other 5.2 5.1
BME total 100 100
Mode and level
Overall, a higher proportion of Chinese students studied full-time (81.6%) than any other ethnic group. This was particularly stark among research postgraduates, where 77.7% of Chinese students studied full-time compared with 52.2% of black students (a 25.5% difference).
Black and Asian students made up a higher proportion of first degree undergraduates (6.4% and 8.9% respectively) than research postgraduates (3.3 and 6.3% respectively).
3.4 All UK students by degree level, mode and ethnic group
WhiteNo. %* %^
All levelsFull-time 1016010 67.4 78.5Part-time 491835 32.6 84.4All students 1507845 100 80.4First degree undergraduateFull-time 867670 83.4 78.4Part-time 172395 16.6 84.6All first degree 1040065 100 79.4
233
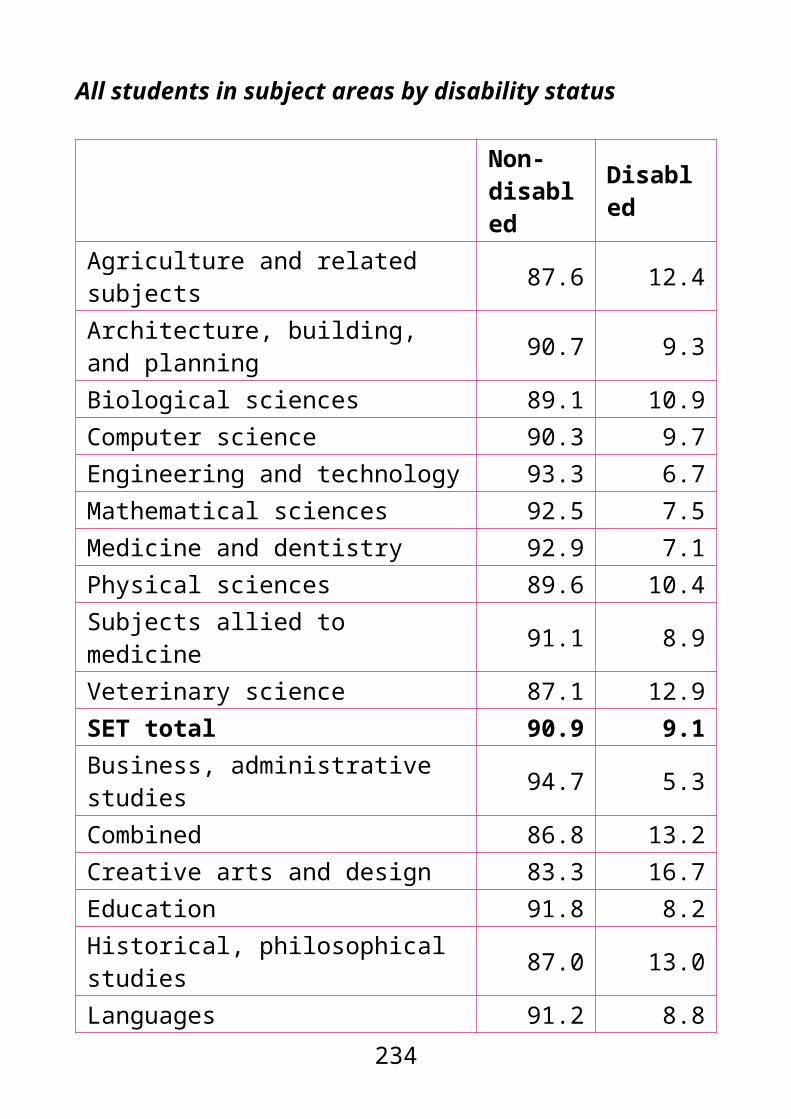
undergraduateOther undergraduateFull-time 50125 24.4 78.9Part-time 155125 75.6 86.5All other undergraduates 205250 100 84.5
Postgraduate researchFull-time 32990 64.1 83.8Part-time 18480 35.9 84.2All research postgraduates 51470 100 84.0
Postgraduate taughtFull-time 65230 83.8 77.5Part-time 145830 84.2 82.1All taught postgraduates 211060 84.0 80.6
BMENo. %* %^
All levelsFull-time 277545 75.3 21.5Part-time 90840 24.7 15.6All students 368390 100 19.6First degree undergraduateFull-time 238880 88.4 21.6Part-time 31265 11.6 15.4All first degree undergraduate 270150 100 20.6
Other undergraduateFull-time 13405 35.6 21.1Part-time 24245 64.4 13.5
234

All other undergraduates 37645 100 15.5
Research postgraduate Full-time 6365 64.7 16.2Part-time 3470 35.3 15.8All research postgraduates 9835 100 16.0
Taught postgraduate Full-time 18895 37.2 22.5Part-time 31860 62.8 17.9All taught postgraduates 50760 100 19.4
BlackNo. %* %^
All levelsFull-time 83225 70.9 6.4Part-time 34195 29.1 5.9All students 117420 100 6.3First degree undergraduateFull-time 70230 84.3 6.3Part-time 13115 15.7 6.4All first degree undergraduate 83345 100 6.4
Other undergraduateFull-time 6070 38.3 9.6Part-time 9795 61.7 5.5All other undergraduates 15865 100 6.5
Research postgraduate Full-time 1040 52.2 2.6
235
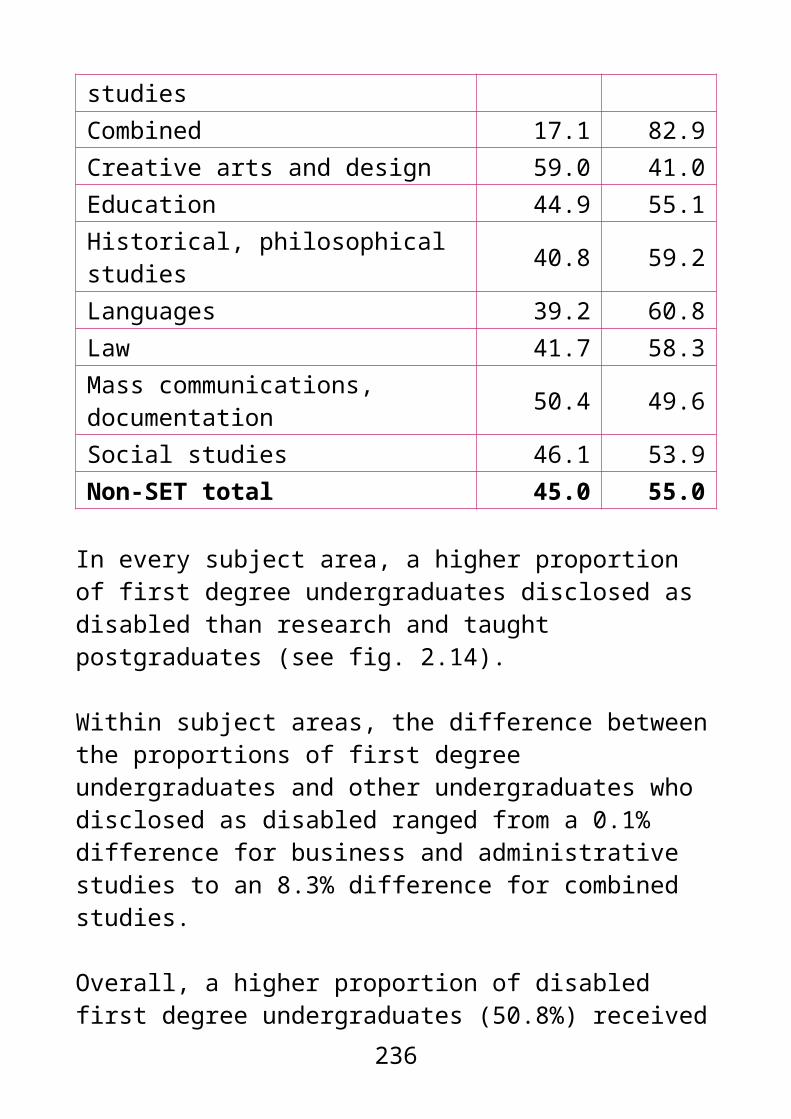
Part-time 955 47.8 4.3All research postgraduates 1995 100 3.3
Taught postgraduate Full-time 5880 36.3 7.0Part-time 10330 63.7 5.8All taught postgraduates 16210 100 6.2
AsianNo. %* %^
All levelsFull-time 119870 77.3 9.3Part-time 35140 22.7 6.0All students 155015 100 8.3First degree undergraduateFull-time 105645 90.8 9.5Part-time 10655 9.2 5.2All first degree undergraduate 116295 100 8.9
Other undergraduateFull-time 4565 33.5 7.2Part-time 9050 66.5 5.0All other undergraduates 13615 100 5.6
Research postgraduate Full-time 2490 64.4 6.3Part-time 1380 35.6 6.3All research postgraduates 3870 100 6.3
Taught postgraduate 236

Full-time 71715 33.8 8.5Part-time 14055 66.2 7.9All taught postgraduates 21230 100 8.1
ChineseNo. %* %^
All levelsFull-time 13365 81.6 1.0Part-time 3015 18.4 0.5All students 16380 100 0.9First degree undergraduateFull-time 10775 93.9 1.0Part-time 695 6.1 0.3All first degree undergraduate 11475 100 0.9
Other undergraduateFull-time 255 28.7 0.4Part-time 630 71.3 0.4All other undergraduates 885 100 0.4
Research postgraduateFull-time 785 77.7 2.0Part-time 225 22.3 1.0All research postgraduates 1010 100 1.6
Taught postgraduateFull-time 1550 51.4 1.8Part-time 1465 48.6 0.8All taught postgraduates 3010 100 1.2
237

MixedNo. %* %^
All levelsFull-time 45480 78.6 3.5Part-time 12350 21.4 2.1All students 57830 100 3.1First degree undergraduateFull-time 39440 88.8 3.6Part-time 4975 11.2 2.4All first degree undergraduate 44415 100 3.4
Other undergraduateFull-time 1915 37.7 3.0Part-time 3165 62.3 1.8All other undergraduates 5080 100 2.1
Research postgraduateFull-time 1255 71.9 3.2Part-time 490 28.1 2.2All research postgraduates 1745 100 2.8
Taught postgraduateFull-time 2870 43.5 3.4Part-time 3725 56.5 2.1All taught postgraduates 6590 100 2.5
OtherNo. %* %^
All levels238

Full-time 15605 71.8 1.2Part-time 6140 28.2 1.1All students 21745 100 1.2First degree undergraduateFull-time 12790 87.5 1.2Part-time 1825 12.5 0.9All first degree undergraduate 14615 100 1.1
Other undergraduateFull-time 600 27.2 0.9Part-time 1605 72.8 0.9All other undergraduates 2200 100 0.9
Research postgraduateFull-time 790 65.3 0.2Part-time 420 34.7 1.9All research postgraduates 1215 100 2.0
Taught postgraduateFull-time 1425 38.4 1.7Part-time 2290 61.6 1.3All taught postgraduates 3715 100 1.4
* within an ethnic group, the percentage of students in a mode (compare vertically within a degree level)^ within a degree level and mode, the percentage of students in an ethnic group (compare horizontally)Percentages based on total number of students minus those whose degree level, mode or ethnic group is unknown.
239
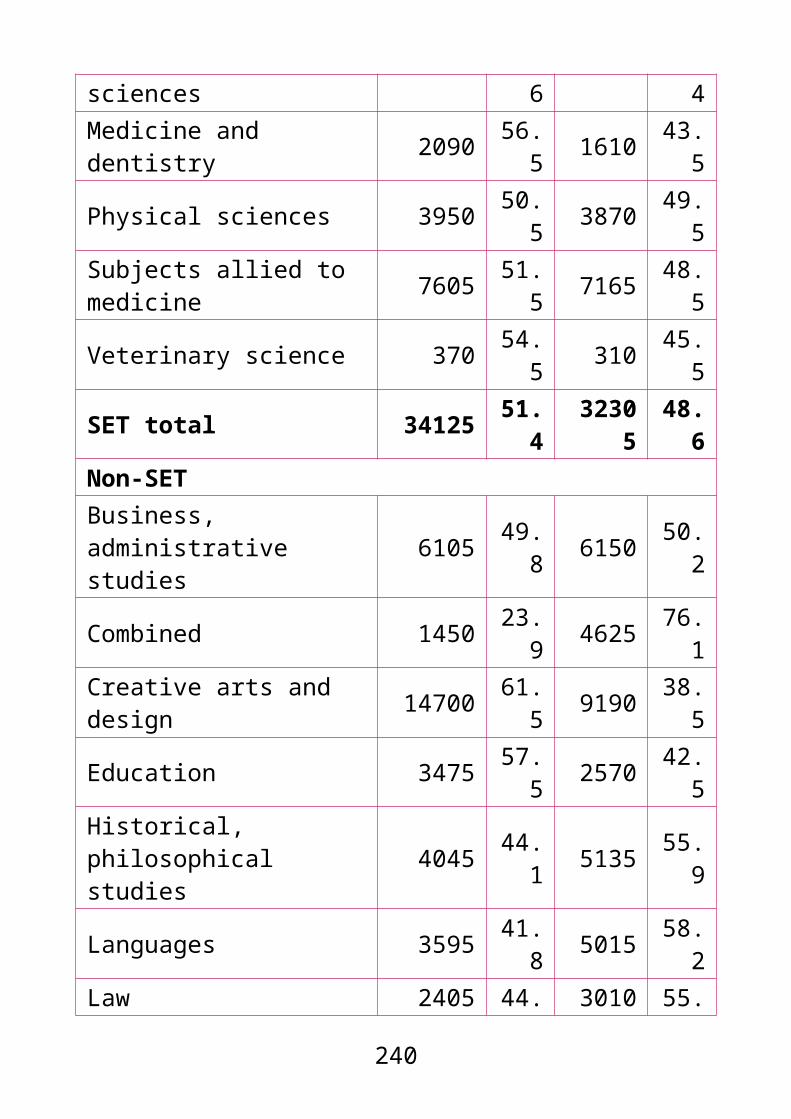
All full-time/part-time UK-domiciled students by BME/white identity
White BMEAll full-time 78.5 21.5All part-time 84.4 15.6All students 80.4 19.6
All full-time/part-time UK-domiciled students in degree levels by BME/white identity
White BMEFull-time first degree undergraduates 78.4 21.6Part-time first degree undergraduates 84.6 15.4All first degree undergraduates 79.4 20.6Full-time other undergraduates 78.9 21.1Part-time other undergraduates 86.5 13.5All other undergraduates 84.5 15.5Full-time research postgraduates 83.8 16.2Part-time research postgraduates 84.2 15.8All research postgraduates 84.0 16.0Full-time taught postgraduates 77.5 22.5Part-time taught postgraduates 82.1 17.9All taught postgraduates 80.6 19.4
A higher proportion of first year first degree undergraduates were BME (22.2%) than the overall student population studying at this level (20.1%). At all other degree levels, the proportions of first year students who were BME were similar to those across all years (see fig. 3.4).
240

With the exception of other undergraduates, within every degree level and ethnic group a higher proportion of first year students studied full-time than for all years (see fig. 3.4).
Compared with 2011/12, there was an increase in the proportion of first year BME first degree undergraduates, from 20.4% to 22.2% [see fig. 2.5, ECU (2013)].
3.5 UK first years by degree level, mode and ethnic group
White BME totalNo. %* %^ No. %* %^
All levels
Full-time 354655
61.3
77.0
105890
72.7
23.0
Part-time 224075
38.7
84.9 39820 27.
315.
1
All students 578730 100 79.
914571
0 100 20.1
First degree undergraduate
Full-time 270505
84.3
76.4 83575 91.
423.
6
Part-time 50230 15.7
86.5 7865 8.6 13.
5All first degree undergraduate
320735 100 77.
8 91440 100 22.2
Other undergraduate
Full-time 19665 16.2
78.4 5420 24.
921.
6241

Part-time 101985
83.8
86.2 16380 75.
113.
8All other undergraduates
121650 100 84.
8 21800 100 15.2
Research postgraduate
Full-time 11230 73.2
83.4 2235 72.
216.
6
Part-time 4115 26.8
82.7 860 27.
817.
3All research postgraduates
15345 100 83.2 3095 100 16.
8
Taught Postgraduate
Full-time 53255 44.0
78.4 14660 49.
921.
6
Part-time 67745 56.0
82.2 14710 50.
117.
8All taught postgraduates
121000 100 80.
5 29370 100 19.5
Black AsianNo. %* %^ No. %* %^
All levels
Full-time 33420 69.2
7.3 44295 74.0
9.6
Part-time 14875 30.8
5.6 15535 26.0
5.9
All students 48300 100 6.7 59830 100 8.3First degree undergraduateFull-time 26660 88. 7.5 35615 93. 10.
242

3 9 1
Part-time 3545 11.7 6.1 2330 6.1 4.0
All first degree undergraduate
30205 100 7.3 37945 100 9.2
Other undergraduate
Full-time 2125 24.5 8.5 2090 25.
3 8.3
Part-time 6540 75.5 5.5 6150 74.
7 5.2
All other undergraduates
8665 100 6.0 8240 100 5.7
Research postgraduate
Full-time 385 62.3 2.9 845 70.
1 6.3
Part-time 235 37.7 4.7 360 29.
9 7.2
All research postgraduates
620 100 3.4 1205 100 6.5
Taught Postgraduate
Full-time 4250 48.2 6.3 5745 46.
2 8.5
Part-time 4560 51.8 5.5 6690 53.
8 8.1
All taught postgraduates
8810 100 5.9 12435 100 8.3
243

Chinese Mixed
No. %* %^ No. %* %^
All levels
Full-time 4760 78.2
1.0 16775 75.9
3.6
Part-time 1330 21.8
0.5 5330 24.1
2.0
All students 6090 100 0.8 22110 100 3.1
First degree undergraduate
Full-time 3200 95.8 0.9 13190 90.
43.7
Part-time 140 4.2 0.2 1400 9.6 2.4
All first degree undergraduate
3340 100 0.8 14585 100 3.5
Other undergraduate
Full-time 115 19.6 0.5 800 27.
63.2
Part-time 465 80.4 0.4 2095 72.
41.8
All other undergraduates
575 100 0.4 2900 100 2.0
Research postgraduate
Full-time 245 80.7 1.8 465 80.
33.5
Part-time 60 19.3 1.2 115 19.
72.3
244
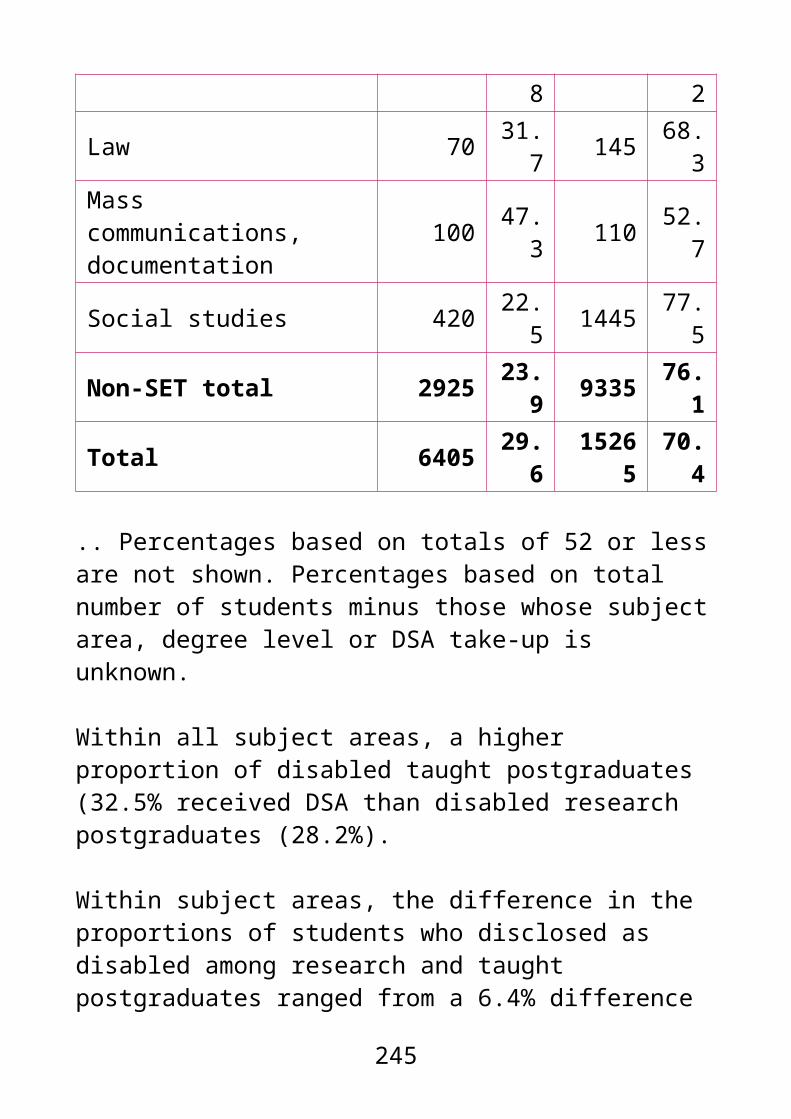
All research postgraduates
305 100 1.7 580 100 3.1
Taught Postgraduate
Full-time 1200 64.2 1.8 2320 57.
43.4
Part-time 670 35.8 0.8 1720 42.
62.1
All taught postgraduates
1870 100 1.2 4045 100 2.7
OtherNo. %* %^
All levelsFull-time 6640 70.7 1.4Part-time 2745 29.3 1.0All students 9385 100 1.3First degree undergraduateFull-time 4910 91.5 1.4Part-time 455 8.5 0.8All first degree undergraduate 5365 100 1.3Other undergraduateFull-time 295 20.6 1.2Part-time 1130 79.4 1.0All other undergraduates 1420 100 1.0Research postgraduateFull-time 290 75.2 2.2Part-time 95 24.8 1.9All research postgraduates 385 100 2.1Taught Postgraduate
245

Full-time 1145 51.8 1.7Part-time 1065 48.2 1.3All taught postgraduates 2210 100 1.5
* within an ethnic group, the percentage of students in a mode (compare vertically within a degree level)^ within a degree level and mode, the percentage of students in an ethnic group (compare horizontally)Percentages based on total number of students minus those whose degree level, mode or ethnic group is unknown.
First year full-time/part-time UK-domiciled students by BME/white identity
White BMEFull-time students 77.0 23.0Part-time student 84.9 15.1All students 79.9 20.1
First year full-time/part-time UK-domiciled students in degree levels by BME/white identity
White BMEFull-time first degree undergraduates
76.4 23.6
Part-time first degree undergraduates
86.5 13.5
All first degree undergraduates 77.8 22.2Full-time other undergraduates 78.4 21.6Part-time other undergraduates 86.2 13.8All other undergraduates 84.8 15.2Full-time research postgraduates 83.4 16.6
246

Part-time research postgraduates 82.7 17.3All research postgraduates 83.2 16.8Full-time taught postgraduates 78.4 21.6Part-time taught postgraduates 82.2 17.8All taught postgraduates 80.5 19.5
Subjects
A higher proportion of BME students studied SET subjects (47.9%) than white students (43.7%). However, this varied by ethnic group. For example, 51.8% of both Asian and Chinese students studied SET subjects, compared with 41.0% of mixed students.
Relatively high proportions of students studying medicine and dentistry (31.9%), law (31.6%), business and administrative studies (28.9%) and computer science (28.1%) were BME.
In contrast, only 3.9% of students studying veterinary science and 4.6% of those in agriculture and related subjects were BME.
3.6 All UK-domiciled students by subject area and ethnic group
White BME totalNo. %* %^ No. %* %^
SETAgriculture and related subjects 15735 1.0 95.4 760 0.2 4.6
Architecture, building, and
32760 2.2 80.8 7775 2.1 19.2
247

planningBiological sciences 146605 9.7 82.0 32235 8.7 18.0
Computer science 49785 3.3 71.9 19465 5.3 28.1
Engineering and technology 82300 5.5 78.0 23220 6.3 22.0
Mathematical sciences 25980 1.7 78.3 7215 2.0 21.7
Medicine and dentistry 37650 2.5 68.1 17675 4.8 31.9
Physical sciences 68935 4.6 87.9 9450 2.6 12.1
Subjects allied to medicine 194810 12.9 76.9 58555 15.9 23.1
Veterinary science 4485 0.3 96.1 185 0.0 3.9
SET total 659045 43.7 78.9 176535 47.9 21.1Non-SETBusiness, administrative studies
146745 9.7 71.1 59625 16.2 28.9
Combined 60180 4.0 90.5 6290 1.7 9.5Creative arts and design 126225 8.4 86.9 19085 5.2 13.1
Education 141515 9.4 87.1 21025 5.7 12.9Historical, philosophical studies
74605 4.9 91.4 7060 1.9 8.6
Languages 89065 5.9 88.3 11815 3.2 11.7Law 45495 3.0 68.4 21005 5.7 31.6Mass 32700 2.2 82.2 7065 1.9 17.8
248

communications, documentationSocial studies 132265 8.8 77.3 38885 10.6 22.7Non-SET total 848800 56.3 81.6 191855 52.1 18.4
Total 1507845 100 80.4 368390 100 19.6
Black AsianNo. %* %^ No. %* %^
SETAgriculture and related subjects
275 0.2 1.7 180 0.1 1.1
Architecture, building, and planning
2505 2.1 6.2 2930 1.9 7.2
Biological sciences 9925 8.5 5.5 13075 8.4 7.3
Computer science 5795 4.9 8.4 9475 6.1 13.7
Engineering and technology
6700 5.7 6.3 10240 6.6 9.7
Mathematical sciences 1145 1.0 3.4 3910 2.5 11.8
Medicine and dentistry 1785 1.5 3.2 11200 7.2 20.2
Physical sciences 1825 1.6 2.3 4145 2.7 5.3
Subjects allied to medicine 23565 20.
1 9.3 25135 16.2 9.9
Veterinary 10 0.0 0.2 55 0.0 1.2
249

science
SET total 53525 45.6 6.4 80340 51.
8 9.6
Non-SETBusiness, administrative studies
19800 16.9 9.6 26935 17.
4 13.1
Combined 2180 1.9 3.3 2155 1.4 3.2Creative arts and design 5885 5.0 4.1 4680 3.0 3.2
Education 6260 5.3 3.9 9395 6.1 5.8Historical, philosophical studies
1515 1.3 1.9 2330 1.5 2.9
Languages 2300 2.0 2.3 3985 2.6 3.9
Law 6695 5.7 10.1 10165 6.6 15.3
Mass communications, documentation
2905 2.5 7.3 1730 1.1 4.4
Social studies 16350 13.9 9.6 13295 8.6 7.8
Non-SET total 63895 54.
4 6.1 74670 48.2 7.2
Total 117420
100 6.3 15501
510
0 8.3
Chinese Mixed
No. %* %^ No. %* %^
SET
250

Agriculture and related subjects 45 0.3 0.
3 215 0.4 1.3
Architecture, building, and planning
545 3.3 1.3 1195 2.1 3.0
Biological sciences 1000 6.1 0.
6 6330 10.9 3.5
Computer science 960 5.8 1.
4 2130 3.7 3.1
Engineering and technology 1485 9.1 1.
4 3005 5.2 2.8
Mathematical sciences 835 5.1 2.
5 980 1.7 3.0
Medicine and dentistry 1240 7.6 2.
2 2135 3.7 3.9
Physical sciences 725 4.4 0.9 2210 3.8 2.8
Subjects allied to medicine 1635 10.0 0.
6 5400 9.3 2.1
Veterinary science 20 0.1 0.
4 80 0.1 1.8
SET total 8490 51.8 1.0
23685
41.0 2.8
Non-SETBusiness, administrative studies
3230 19.7 1.6 6525 11.
3 3.2
Combined 215 1.3 0.3 1285 2.2 1.9
Creative arts and design 1180 7.2 0.
8 6055 10.5 4.2
Education 640 3.9 0. 3350 5.8 2.1
251
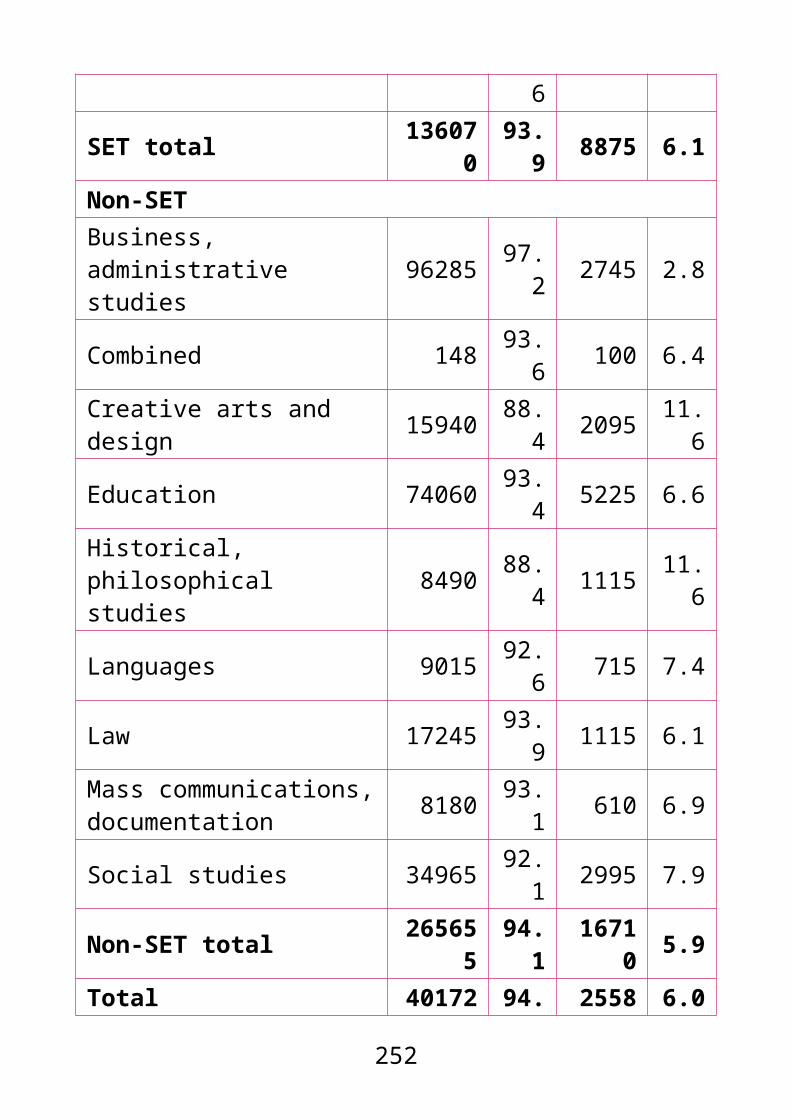
4Historical, philosophical studies
250 1.5 0.3 2430 4.2 3.0
Languages 545 3.3 0.5 3920 6.8 3.9
Law 540 3.3 0.8 2520 4.4 3.8
Mass communications, documentation
245 1.5 0.6 1720 3.0 4.3
Social studies 1050 6.4 0.6 6340 11.
0 3.7
Non-SET total 7890 48.2 0.8
34145
59.0 3.3
Total 16380 100 0.
95783
010
0 3.1
OtherNo. %* %^
SETAgriculture and related subjects 45 0.2 0.3Architecture, building, and planning 600 2.8 1.5Biological sciences 1905 8.8 1.1Computer science 1110 5.1 1.6Engineering and technology 1790 8.2 1.7Mathematical sciences 345 1.6 1.0Medicine and dentistry 1320 6.1 2.4Physical sciences 545 2.5 0.7Subjects allied to medicine 2820 13.0 1.1Veterinary science 15 0.1 0.3
252

SET total 10495 48.3 1.3Non-SETBusiness, administrative studies 3130 14.4 1.5Combined 455 2.1 0.7Creative arts and design 1280 5.9 0.9Education 1375 6.3 0.8Historical, philosophical studies 540 2.5 0.7Languages 1070 4.9 1.1Law 1090 5.0 1.6Mass communications, documentation 465 2.1 1.2
Social studies 1845 8.5 1.1Non-SET total 11250 51.7 1.1Total 21745 100 1.2
* within an ethnic group, the percentage of students in a subject area (compare vertically)^ within a subject area, the percentage of students in an ethnic group (compare horizontally)Percentages based on total number of students minus those whose subject area or ethnic group is unknown.
253
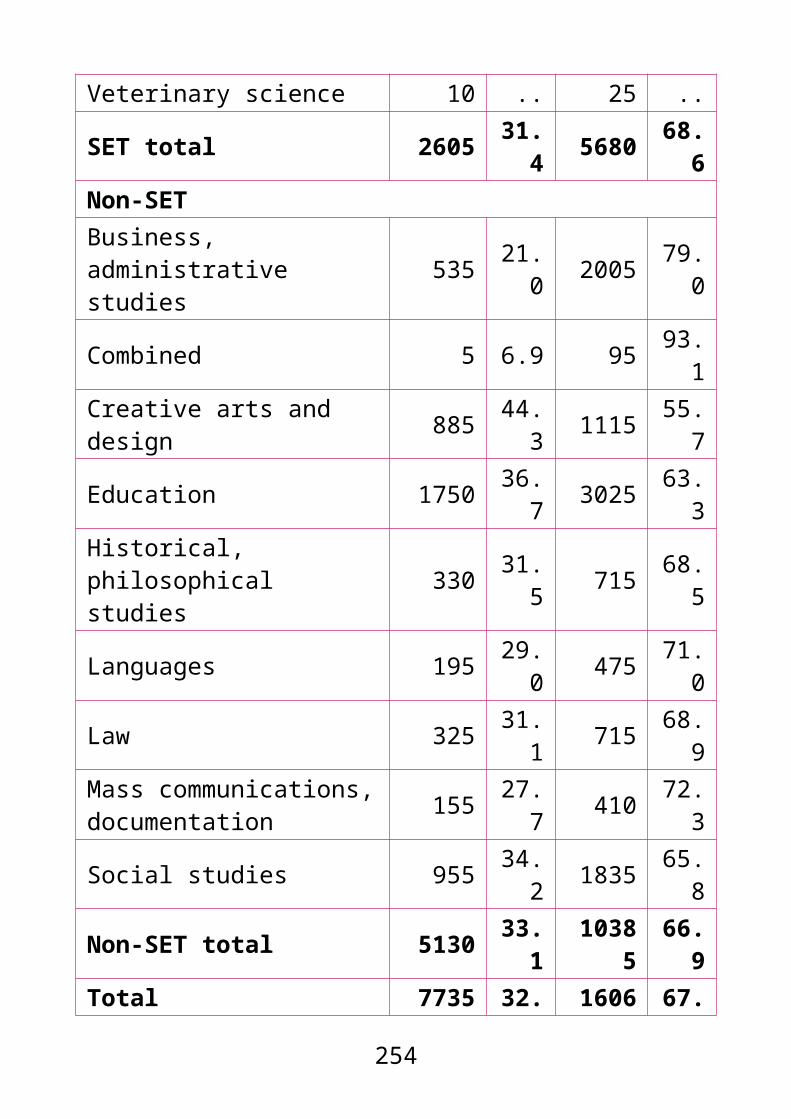
All UK-domiciled students in SET subject areas by ethnic group
White
Black
Asian
Chinese
Mixed
Other
Agriculture and related subjects
1.0 0.2 0.1 0.3 0.4 0.3
Architecture, building, and planning
2.2 2.1 1.9 3.3 2.1 1.5
Biological sciences 9.7 8.5 8.4 6.1 10.9 1.1
Computer science 3.3 4.9 6.1 5.8 3.7 1.6
Engineering and technology
5.5 5.7 6.6 9.1 5.2 1.7
Mathematical sciences 1.7 1.0 2.5 5.1 1.7 1.0
Medicine and dentistry
2.5 1.5 7.2 7.6 3.7 2.4
Physical sciences 4.6 1.6 2.7 4.4 3.8 0.7
Subjects allied to medicine
12.9 20.1 16.2 10.0 9.3 1.1
Veterinary science 0.3 0.0 0.0 0.1 0.1 0.3
254

All UK-domiciled students in non-SET subject areas by ethnic group
White
Black
Asian
Chinese
Mixed
Other
Business, administrative studies
9.7 16.9 17.4 19.7 11.3 14.4
Combined 4.0 1.9 1.4 1.3 2.2 2.1Creative arts and design 8.4 5.0 3.0 7.2 10.5 5.9
Education 9.4 5.3 6.1 3.9 5.8 6.3Historical, philosophical studies
4.9 1.3 1.5 1.5 4.2 2.5
Languages 5.9 2.0 2.6 3.3 6.8 4.9Law 3.0 5.7 6.6 3.3 4.4 5.0Mass communications, documentation
2.2 2.5 1.1 1.5 3.0 2.1
Social studies 8.8 13.9 8.6 6.4 11.0 8.5
Across all ethnic groups, the proportion of students who studied SET subjects was lower among first years than for all students. The difference ranged from 0.6% for black students to 4.5% for Chinese students (see fig. 3.6).
4.7% of students who studied agriculture and related subjects were BME, compared with 33.3% of those studying medicine and dentistry.
255

3.7 First year UK-domiciled students by subject area and ethnic group
White BME totalNo. %* %^ No. %* %^
SETAgriculture and related subjects 6640 1.1 95.
3 325 0.2 4.7
Architecture, building, and planning
10865 1.9 79.4 2825 1.9 20.
6
Biological sciences 52320 9.0 80.
6 12615 8.7 19.4
Computer science 17190 3.0 70.
6 7145 4.9 29.4
Engineering and technology 27925 4.8 76.
7 8480 5.8 23.3
Mathematical sciences 7830 1.4 77.
0 2340 1.6 23.0
Medicine and dentistry 9895 1.7 66.
7 4950 3.4 33.3
Physical sciences 22155 3.8 86.
2 3545 2.4 13.8
Subjects allied to medicine 88470 15.
377.
6 25540 17.5
22.4
Veterinary science 1095 0.2 95.
0 60 0.0 5.0
SET total 244385
42.2
78.3 67825 46.
521.
7Non-SETBusiness, administrative
53370 9.2 69.9
22945 15.7
30.1
256

studies
Combined 32540 5.6 90.3 3505 2.4 9.7
Creative arts and design 43645 7.5 86.
3 6950 4.8 13.7
Education 71670 12.4
86.6 11090 7.6 13.
4Historical, philosophical studies
24440 4.2 90.5 2575 1.8 9.5
Languages 29965 5.2 86.9 4515 3.1 13.
1
Law 17460 3.0 68.1 8180 5.6 31.
9Mass communications, documentation
11510 2.0 80.5 2795 1.9 19.
5
Social studies 49755 8.6 76.4 15325 10.
523.
6
Non-SET total 334345
57.8
81.1 77885 53.
518.
9
Total 578730 100 79.
914571
0 100 20.1
Black Asian No. %* %^ No. %* %^
SETAgriculture and related subjects 130 0.3 1.9 75 0.1 1.1
Architecture, building, and planning
875 1.8 6.4 1045 1.7 7.6
257

Biological sciences 4100 8.5 6.3 4950 8.3 7.6
Computer science 2195 4.5 9.0 3385 5.7 13.9
Engineering and technology 2480 5.1 6.8 3700 6.2 10.
2Mathematical sciences 390 0.8 3.8 1255 2.1 12.
4Medicine and dentistry 555 1.2 3.8 3075 5.1 20.
7Physical sciences 725 1.5 2.8 1545 2.6 6.0Subjects allied to medicine
10300
21.3 9.0 1096
018.
3 9.6
Veterinary science 0 0.0 0.1 20 0.0 1.7
SET total 21750
45.0 7.0 3001
550.
2 9.6
Non-SETBusiness, administrative studies
7770 16.1
10.2
10075
16.8
13.2
Combined 1220 2.5 3.4 1165 1.9 3.2Creative arts and design 2210 4.6 4.4 1710 2.9 3.4
Education 3145 6.5 3.8 4985 8.3 6.0Historical, philosophical studies
610 1.3 2.3 850 1.4 3.1
Languages 885 1.8 2.6 1530 2.6 4.4
Law 2635 5.5 10.3 3940 6.6 15.
4Mass communications, documentation
1165 2.4 8.2 655 1.1 4.6
258
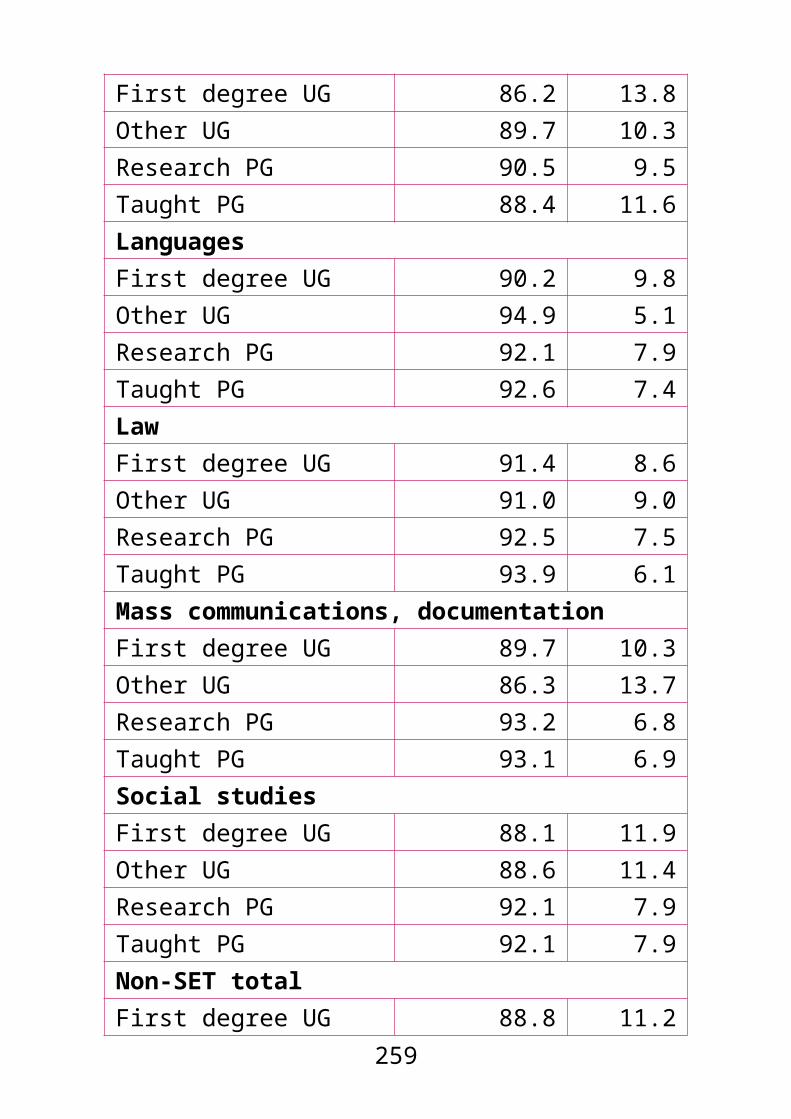
Social studies 6900 14.3
10.6 4900 8.2 7.5
Non-SET total 26545
55.0 6.4 2981
549.
8 7.2
Total 48300 100 6.7 5983
0 100 8.3
Chinese Mixed
No. %* %^ No. %* %^
SETAgriculture and related subjects 15 0.2 0.
2 85 0.4 1.2
Architecture, building, and planning
220 3.6 1.6 425 1.9 3.1
Biological sciences 360 5.9 0.6 2375 10.
7 3.7
Computer science 340 5.6 1.4 780 3.5 3.2
Engineering and technology 470 7.7 1.
3 1045 4.7 2.9
Mathematical sciences 255 4.2 2.
5 290 1.3 2.8
Medicine and dentistry 315 5.2 2.
1 595 2.7 4.0
Physical sciences 235 3.9 0.9 800 3.6 3.1
Subjects allied to medicine 665 10.
90.6 2355 10.
7 2.1
Veterinary science 10 0.2 0.9 25 0.1 2.1
259

SET total 2880 47.3
0.9 8775 39.
7 2.8
Non-SET
Business, administrative studies
1305 21.4
1.7 2455 11.
1 3.2
Combined 130 2.1 0.4 700 3.2 1.9
Creative arts and design 385 6.3 0.
8 2140 9.7 4.2
Education 365 6.0 0.4 1835 8.3 2.2
Historical, philosophical studies
95 1.6 0.4 805 3.6 3.0
Languages 255 4.1 0.7 1370 6.2 4.0
Law 210 3.4 0.8 960 4.3 3.7
Mass communications, documentation
100 1.6 0.7 675 3.0 4.7
Social studies 370 6.1 0.6 2390 10.
8 3.7
Non-SET total 3210 52.7
0.8
13330
60.3 3.2
Total 6090 100 0.8
22110 100 3.1
OtherNo. %* %^
260

SETAgriculture and related subjects 20 0.2 0.3Architecture, building, and planning 265 2.8 1.9Biological sciences 830 8.9 1.3Computer science 440 4.7 1.8Engineering and technology 785 8.4 2.2Mathematical sciences 150 1.6 1.5Medicine and dentistry 410 4.4 2.8Physical sciences 235 2.5 0.9Subjects allied to medicine 1260 13.4 1.1Veterinary science 5 0.0 0.3SET total 4405 46.9 1.4Non-SETBusiness, administrative studies 1340 14.3 1.8Combined 290 3.1 0.8Creative arts and design 500 5.3 1.0Education 755 8.1 0.9Historical, philosophical studies 215 2.3 0.8Languages 475 5.0 1.4Law 445 4.7 1.7Mass communications, documentation 200 2.2 1.4
Social studies 765 8.2 1.2Non-SET total 4980 53.1 1.2Total 9385 100 1.3
* within an ethnic group, the percentage of students in a subject area (compare vertically)^ within a subject area, the percentage of students in an ethnic group (compare horizontally)
261

Percentages based on total number of students minus those whose subject area or ethnic group is unknown.
At every degree level, the proportion of students who were BME was higher in SET than non-SET subject areas; for first degree undergraduates the difference was 2.3% and for taught postgraduates the difference was 4.1%.
Compared with 2011/12, the proportion of other undergraduates studying law who were BME increased from 24.6% to 30.9%, a 6.3% difference.
The proportion of computer science taught postgraduates who were BME decreased from 34.2% to 32.2%, a 2.0% difference [see fig. 2.8, ECU (2013)].
3.8 All UK-domiciled students by subject area, degree level and BME/white identity
First degree undergraduateWhite BMENo. % No. %
SETAgriculture and related subjects 8015 95.
6370 4.4
Architecture, building, and planning 21740 79.
75535 20.
3
Biological sciences 118425 81.5
26965 18.5
Computer science 41055 71.8
16130 28.2
Engineering and technology 58355 76.
218210 23.
8
262

Mathematical sciences 23250 78.1
6525 21.9
Medicine and dentistry 27780 68.1
12995 31.9
Physical sciences 56090 88.0
7685 12.0
Subjects allied to medicine 101545 74.
634555 25.
4
Veterinary science 3790 96.5
140 3.5
SET total 460045 78.1
129105
21.9
Non-SETBusiness, administrative studies 98510 69.
0 44220 31.0
Combined 29445 89.0 3645 11.
0
Creative arts and design 107855 86.7 16480 13.
3
Education 51600 86.6 8010 13.
4Historical, philosophical studies 58835 91.
5 5480 8.5
Languages 73595 88.3 9720 11.
7
Law 36065 68.0 17005 32.
0Mass communications, documentation 27295 81.
8 6060 18.2
Social studies 96820 76.1 30425 23.
9Non-SET total 580020 80. 14104 19.
263

4 5 6
Total 1040065
79.4
270150
20.6
Other undergraduateWhite BMENo. % No. %
SETAgriculture and related subjects 6025 96.
4 220 3.6
Architecture, building, and planning 3815 87.
3 555 12.7
Biological sciences 8060 82.1 1760 17.
9
Computer science 4030 73.8 1430 26.
2Engineering and technology 12415 91.
1 1210 8.9
Mathematical sciences 695 81.3 160 18.
7
Medicine and dentistry 440 85.2 75 14.
8
Physical sciences 2735 88.5 355 11.
5Subjects allied to medicine 55875 79.
7 14190 20.3
Veterinary science 50 .. 0 ..
SET total 94140 82.5
199960
17.5
Non-SETBusiness, administrative studies 19955 80.
0 5000 20.0
264
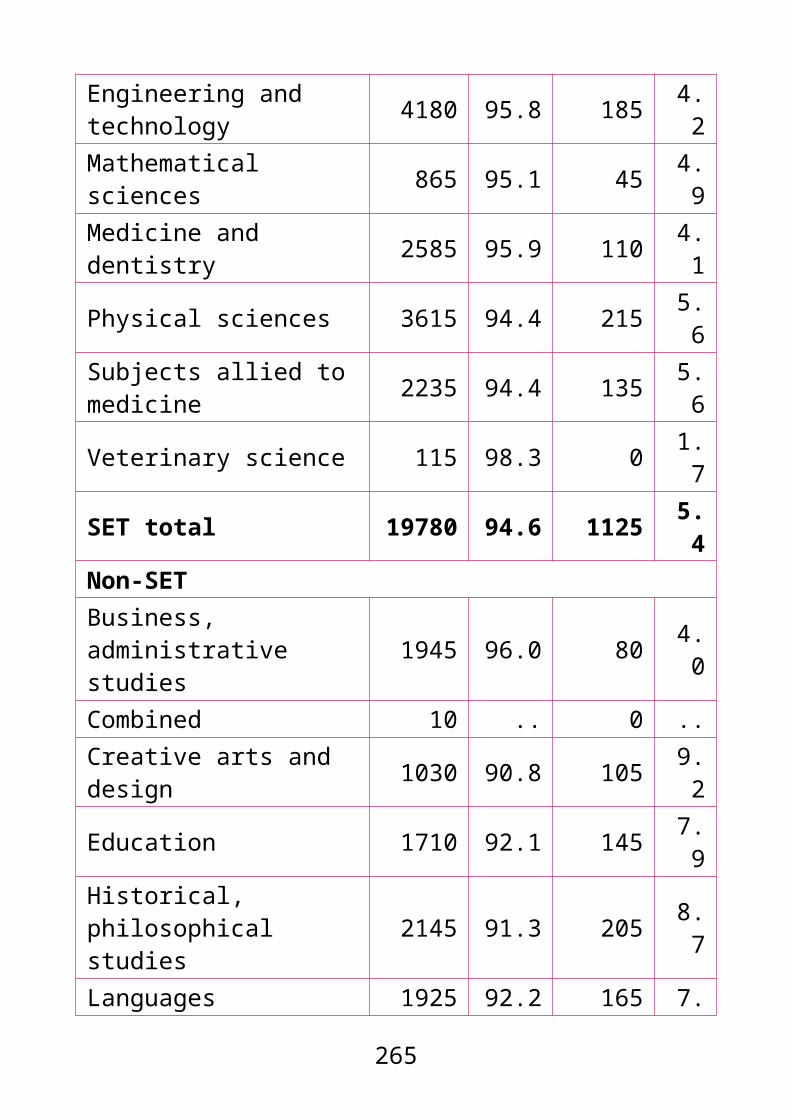
Combined 29545 92.2 2495 7.8
Creative arts and design 7485 84.8 1345 15.
2
Education 25145 87.7 3530 12.
3Historical, philosophical studies 5285 89.
0 655 11.0
Languages 7695 87.4 1115 12.
6
Law 1580 69.1 705 30.
9Mass communications, documentation 1180 77.
4 345 22.6
Social studies 13245 84.1 2500 15.
9
Non-SET total 111110
86.3 17690 13.
7
Total 205250
84.5 37645 15.
5
Research postgraduateWhite BMENo. % No. %
SETAgriculture and related subjects 390 87.
8 55 12.2
Architecture, building, and planning 700 79.
3 185 20.7
Biological sciences 7750 88.3
1030
11.7
Computer science 1470 79. 375 20.
265

6 4
Engineering and technology 4275 75.4
1390
24.6
Mathematical sciences 1085 84.1 205 15.
9
Medicine and dentistry 4310 72.7
1620
27.3
Physical sciences 6445 89.6 745 10.
4
Subjects allied to medicine 3945 81.8 880 18.
2
Veterinary science 210 90.2 25 9.8
SET total 30580 82.4
6510
17.6
Non-SETBusiness, administrative studies 2060 75.
1 685 24.9
Combined 15 .. 5 ..
Creative arts and design 2330 92.4 190 7.6
Education 3850 86.7 590 13.
3Historical, philosophical studies 4195 92.
4 345 7.6
Languages 3000 89.6 350 10.
4
Law 785 77.2 235 22.
8Mass communications, documentation 520 85.
4 90 14.6
Social studies 4140 83. 840 16.
266

1 9
Non-SET total 20890 86.3
3320
13.7
Total 51470 84.0
9835
16.0
Taught postgraduateWhite BMENo. % No. %
SETAgriculture and related subjects 1305 92.0 115 8.0
Architecture, building, and planning 6505 81.2 1505 18.8
Biological sciences 12370 83.3 2475 16.7Computer science 3225 67.8 1530 32.2Engineering and technology 7260 75.1 24110 24.9
Mathematical sciences 950 74.3 325 25.7Medicine and dentistry 5120 63.2 2985 36.8Physical sciences 3665 84.6 665 15.4Subjects allied to medicine 33450 78.9 8925 21.1
Veterinary science 435 95.2 20 4.8SET total 74280 78.0 20960 22.0Non-SET
Business, administrative studies 26225 72.9 9725 27.1
Combined 1180 89.0 145 11.0Creative arts and 8560 88.9 1070 11.1
267

designEducation 60920 87.3 8895 12.7Historical, philosophical studies 6290 91.6 580 8.4
Languages 4780 88.3 635 11.7Law 7060 69.7 3065 30.3Mass communications, documentation 3705 86.7 570 13.3
Social studies 18065 77.9 5120 22.1Non-SET total 136780 82.1 29800 17.9Total 211060 80.6 50760 19.4
.. Percentages based on totals of 52 or less are not shown.Percentages based on total number of students minus those whose subject area, degree level or BME/white identity is unknown.
All UK-domiciled students in SET subject areas and degree levels by BME/white identity
White BMEAgriculture and related subjectsFirst degree UG 95.6 *Other UG 96.4PG research 87.8 12.2PG taught 92.0 8.0Architecture, building, and planningFirst degree UG 79.7 20.3Other UG 87.3 12.7PG research 79.3 20.7PG taught 81.2 18.8Biological sciences
268

First degree UG 81.5 18.5Other UG 82.1 17.9PG research 88.3 11.7PG taught 83.3 16.7Computer scienceFirst degree UG 71.8 28.2Other UG 73.8 26.2PG research 79.6 20.4PG taught 67.8 32.2Engineering and technologyFirst degree UG 76.2 23.8Other UG 91.1 8.9PG research 75.4 24.6PG taught 75.1 24.9Mathematical sciencesFirst degree UG 78.1 21.9Other UG 81.3 18.7PG research 84.1 15.9PG taught 74.3 25.7Medicine and dentistryFirst degree UG 68.1 31.9Other UG 85.2 14.8PG research 72.7 27.3PG taught 63.2 36.8Physical sciencesFirst degree UG 88.0 12.0Other UG 88.5 11.5PG research 89.6 10.4PG taught 84.6 15.4Subjects allied to medicine
269

First degree UG 74.6 25.4Other UG 79.7 20.3PG research 81.8 18.2PG taught 78.9 21.1Veterinary scienceFirst degree UG 96.5Other UG ..PG research 90.2 9.8PG taught 95.2SET totalFirst degree UG 78.1 21.9Other UG 82.5 17.5PG research 82.4 17.6PG taught 78.0 22.0
* values less than 5.0 are not displayed.. percentages based on totals of 52 or less are not shown
All UK-domiciled students in non-SET subject areas and degree levels by BME/white identity
White BMEBusiness, administrative studiesFirst degree UG 69.0 31.0Other UG 80.0 20.0PG research 75.1 24.9PG taught 72.9 27.1CombinedFirst degree UG 89.0 11.0Other UG 92.2 7.8PG research ..
270

PG taught 89.0 11.0Creative arts and designFirst degree UG 86.7 13.3Other UG 84.8 15.2PG research 92.4 7.6PG taught 88.9 11.1EducationFirst degree UG 86.6 13.4Other UG 87.7 12.3PG research 86.7 13.3PG taught 87.3 12.7Historical, philosophical studiesFirst degree UG 91.5 8.5Other UG 89.0 11.0PG research 92.4 7.6PG taught 91.6 8.4LanguagesFirst degree UG 88.3 11.7Other UG 87.4 12.6PG research 89.6 10.4PG taught 88.3 11.7LawFirst degree UG 68.0 32.0Other UG 69.1 30.9PG research 77.2 22.8PG taught 69.7 30.3Mass communications, documentationFirst degree UG 81.8 18.2Other UG 77.4 22.6PG research 85.4 14.6
271

PG taught 86.7 13.3Social studiesFirst degree UG 76.1 23.9Other UG 84.1 15.9PG research 83.1 16.9PG taught 77.9 22.1Non-SET totalFirst degree UG 80.4 19.6Other UG 86.3 13.7PG research 86.3 13.7PG taught 82.1 17.9
.. percentages based on totals of 52 or less are not shown
Within SET subject areas, at every degree level except other undergraduate, the proportions of students who were BME were higher among first year students than students across all years. These differences ranged from 0.2% among research postgraduates to 1.3% among first degree undergraduates.
Within non-SET subject areas, the proportions of first degree undergraduates and research postgraduates who were BME were higher among first year students than students across all years (differences of 1.8% and 1.5%, respectively) (see fig. 3.8).
Compared with 2011/12, among students studying medicine and dentistry, the proportion of first degree undergraduates who were BME increased from 29.6% to 32.8%, a difference of 3.2%. However among other undergraduates the proportion of students who were BME
272
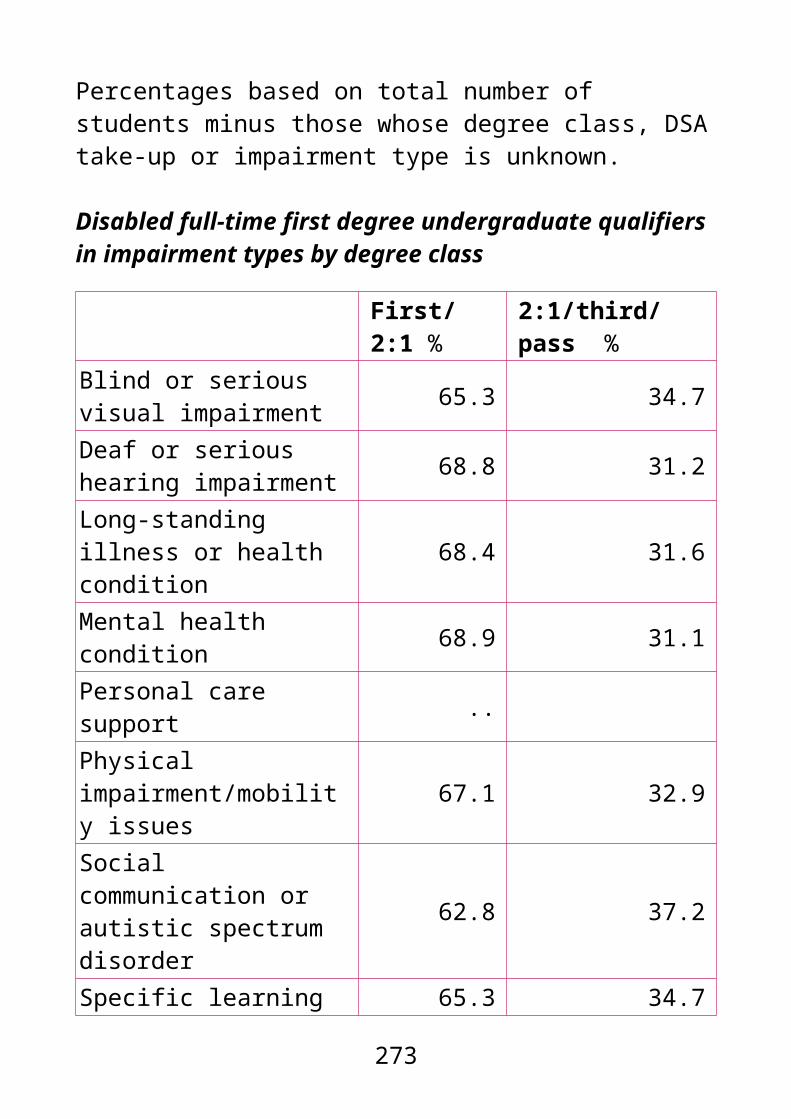
dropped from 23.5% to 18.3%, a difference of 5.2% [see fig. 2.9, ECU (2013)].
273

3.9 First year UK-domiciled students by subject area, degree level and BME/white identity
First degree undergraduateWhite BMENo. % No. %
SETAgriculture and related subjects 2475 94.
8 135 5.2
Architecture, building, and planning 5770 76.
3 1795 23.7
Biological sciences 38365 80.0 9575 20.
0
Computer science 13035 69.8 5630 30.
2Engineering and technology 16360 72.
8 6115 27.2
Mathematical sciences 6765 77.5 1960 22.
5
Medicine and dentistry 5630 67.2 2750 32.
8
Physical sciences 16415 86.0 2675 14.
0
Subjects allied to medicine 36045 74.8
12115
25.2
Veterinary science 825 95.6 40 4.4
SET total 141690
76.8
42785
23.2
Non-SET
274

Business, administrative studies 30885 66.
81536
033.
2
Combined 8020 87.5 1145 12.
5
Creative arts and design 34685 85.9 5670 14.
1
Education 17790 84.6 3240 15.
4Historical, philosophical studies 16895 90.
5 1775 9.5
Languages 20245 87.0 3020 13.
0
Law 11630 67.2 5685 32.
8Mass communications, documentation 8550 79.
2 2245 20.8
Social studies 30345 74.3
10520
25.7
Non-SET total 179045
78.6
48655
21.4
Total 320735
77.8
91440
22.2
Other undergraduateWhite BMENo. % No. %
SETAgriculture and related subjects 3405 96.
8 115 3.2
Architecture, building, and planning 1600 88.
7 205 11.3
Biological sciences 4570 78. 1260 21.
275

4 6
Computer science 2060 75.9 650 24.
1Engineering and technology 6900 91.
7 625 8.3
Mathematical sciences 210 71.1 85 28.
9
Medicine and dentistry 195 81.7 45 18.
3
Physical sciences 1390 86.6 215 13.
4
Subjects allied to medicine 32705 80.6 7890 19.
4Veterinary science 20 .. 0 ..
SET total 53065 82.7
11090
17.3
Non-SET
Business, administrative studies 9530 79.
0 2530 21.0
Combined 23505 91.3 2240 8.7
Creative arts and design 3560 85.9 585 14.
1
Education 13780 88.3 1835 11.
7Historical, philosophical studies 2830 88.
7 360 11.3
Languages 5855 85.9 965 14.
1
Law 1025 66.5 515 33.
5
276
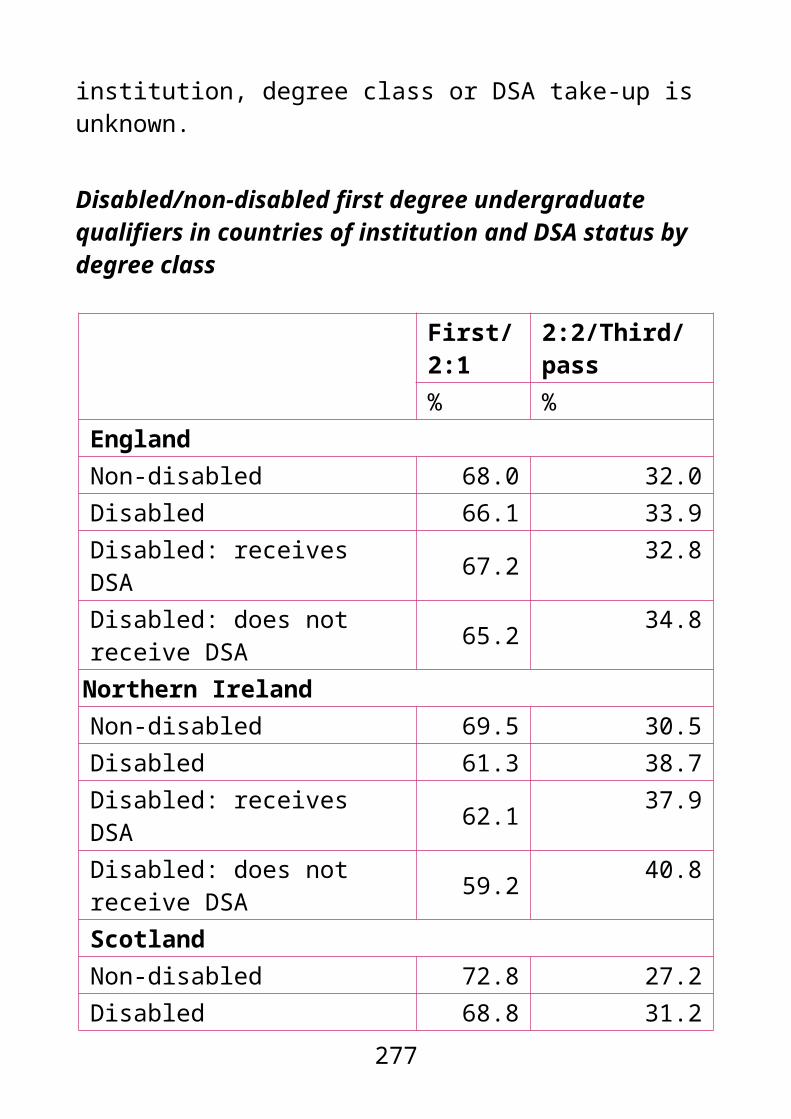
Mass communications, documentation 525 75.
5 170 24.5
Social studies 7965 84.0 1515 16.
0
Non-SET total 68585 86.5
10710
13.5
Total 121650
84.8
21800
15.2
Research postgraduateWhite BMENo. % No. %
SETAgriculture and related subjects 120 88.
6 15 11.4
Architecture, building, and planning 200 78.
2 55 21.8
Biological sciences 2420 88.2 325 11.
8
Computer science 445 81.2 105 18.
8
Engineering and technology 1240 74.4 425 25.
6
Mathematical sciences 340 83.3 70 16.
7
Medicine and dentistry 1330 72.9 495 27.
1
Physical sciences 2005 89.4 235 10.
6
Subjects allied to medicine 1170 80.3 290 19.
7Veterinary science 60 85. 10 14.
277
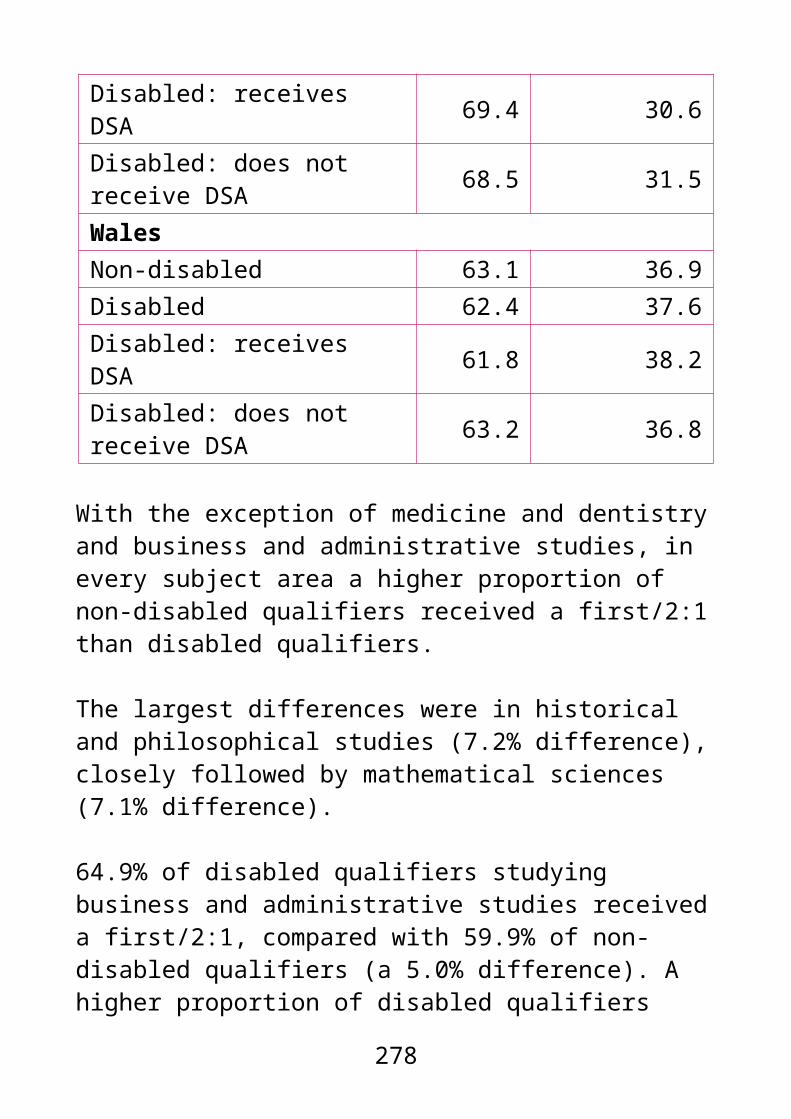
3 7
SET total 9325 82.2 2020 17.
8Non-SETBusiness, administrative studies 550 71.
5 220 28.5
Combined 5 .. 0 ..
Creative arts and design 650 91.8 60 8.2
Education 995 84.7 180 15.
3Historical, philosophical studies 1210 91.
3 115 8.7
Languages 985 89.3 120 10.
7
Law 240 76.1 75 23.
9Mass communications, documentation 150 81.
7 35 18.3
Social studies 1235 81.8 275 18.
2
Non-SET total 6020 84.8 1075 15.
2
Total 15345 83.2 3095 16.
8
Taught postgraduateWhite BMENo. % No. %
SETAgriculture and related subjects 640 91.0 65 9.0
278

Architecture, building, and planning 3295 81.0 775 19.0
Biological sciences 6960 82.7 1455 17.3Computer science 1655 68.5 760 31.5Engineering and technology 3425 72.2 1315 27.8
Mathematical sciences 515 69.5 225 30.5Medicine and dentistry 2740 62.2 1665 37.8Physical sciences 2345 84.9 420 15.1Subjects allied to medicine 18545 78.0 5245 22.0
Veterinary science 185 95.4 10 4.6SET total 40305 77.2 11930 22.8Non-SETBusiness, administrative studies 12400 71.9 4840 28.1
Combined 1005 89.3 120 10.7Creative arts and design 4750 88.3 630 11.7
Education 39100 87.0 5835 13.0Historical, philosophical studies 3500 91.5 325 8.5
Languages 2880 87.5 410 12.5Law 4570 70.5 1910 29.5Mass communications, documentation 2285 86.9 345 13.1
Social studies 10205 77.2 3020 22.8Non-SET total 80695 82.2 17440 17.8Total 121000 80.5 29370 19.5
.. Percentages based on totals of 52 or less are not shown.
279
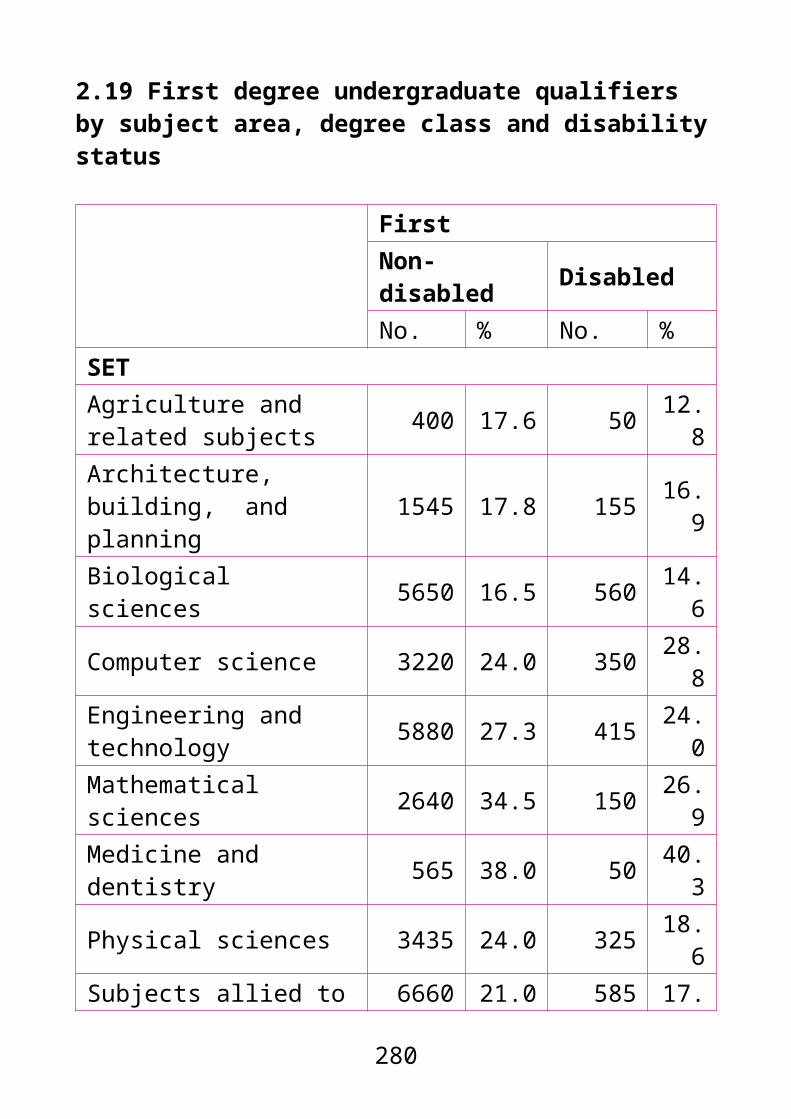
Percentages based on total number of students minus those whose subject area, degree level or BME/white identity is unknown.
280

Continuation
Entrants refers to full-time first degree UK-domiciled 2011/12 entrants. Continuation data indicates the progress of these entrants to 2012/13.
93.2% of Chinese entrants continued or qualified, compared with 85.5% of students from another black background. 10.8% of black: Caribbean entrants and 10.7% of entrants of another black background were no longer in HE, compared with 5.0% of Asian: Indian and 5.3% of Chinese students.
4.2% of students from another background transferred to a different higher education institution, compared with 1.5% of white and Chinese students.
3.10 UK-domiciled full-time first degree entrants by continuation category and ethnic group
Continue or qualify
Transfer No longer in HE
No. % No. % No. %White 278390 92.2 4395 1.5 19225 6.4BME total 73795 88.7 2870 3.4 6530 7.9Black 22160 86.4 1020 4.0 2455 9.6
Black: Caribbean 5225 85.7 215 3.5 660 10.8
Black: African 15930 86.8 760 4.1 1670 9.1
Other black background 1005 85.5 45 3.8 125 10.7
Asian 31895 89.8 1245 3.5 2395 6.7
281

Asian: Indian 12545 92.3 365 2.7 680 5.0
Asian: Pakistani 9650 88.3 440 4.0 840 7.7
Asian: Bangladeshi 3620 87.7 170 4.1 340 8.3
Other Asian background 6080 88.3 275 4.0 530 7.7
Chinese 3405 93.2 55 1.5 195 5.3Mixed 12770 89.4 375 2.6 1140 8.0Other 3570 87.3 175 4.2 350 8.5Total 352190 91.4 7265 1.9 25755 6.7
Percentages based on total number of students minus those whose continuation category or ethnic group is unknown
UK-domiciled full-time first degree entrants in ethnic groups by continuation category
Continue or qualify
Transfer No longer in HE
% % %White 92.2 1.5 6.4BME total 88.7 3.4 7.9Black 86.4 4.0 9.6
Black: Caribbean 85.7 3.5 10.8
Black: African 86.8 4.1 9.1
Other black background 85.5 3.8 10.7
Asian 89.8 3.5 6.7
282

Asian: Indian 92.3 2.7 5.0Asian: Pakistani 88.3 4.0 7.7
Asian: Bangladeshi 87.7 4.1 8.3
Other Asian background 88.3 4.0 7.7
Chinese 93.2 1.5 5.3Mixed 89.4 2.6 8.0Other 87.3 4.2 8.5Total 91.4 1.9 6.7
Degree attainment
Qualifiers refers to UK domiciled first degree undergraduate qualifiers. The ethnicity degree attainment gap is calculated: % white first/2:1 – % BME first/2:1.
The ethnicity degree attainment gap was highest in England, where 73.8% of white qualifiers obtained a first/2:1 compared with 57.0% of BME qualifiers (16.8% gap).
In all nations, the proportion of black qualifiers receiving a first/2:1 was lower than for all other ethnic groups. The gap was particularly wide in England, where 73.8% of white qualifiers received a first/2:1, compared with 46.8% of black qualifiers (a 27.0% difference).
Compared with 2011/12, the ethnicity degree attainment gap has narrowed in England (by 1.7%) and Scotland (by 1.1%). However, it has widened in Northern Ireland (by 4.3%) and Wales (by 2.9%) [see fig. 2.11, ECU (2013)].
283

284

3.11 UK-domiciled first degree undergraduate qualifiers by country of institution, degree class and ethnic group
First 2:1No. % No. %
England
White 43530 20.9 109870
52.9
BME total 6985 12.2 257000
44.8
Black 1310 7.5 6835 39.3
Asian 3330 13.2 11645 46.2
Chinese 420 16.4 1210 47.3
Mixed 1530 16.6 4655 50.4
Other 395 13.4 1355 46.2
Total 50515 19.1 135570
51.1
Northern Ireland
White 1290 16.3 4135 52.4
BME total 20 18.1 45 41.9
Black 0 .. 0 ..Asian 5 .. 10 ..Chinese 5 .. 10 ..Mixed 5 .. 15 ..
285

Other 0 .. 5 ..
Total 1310 16.4 4180 52.2
Scotland
White 3545 18.6 10355 54.4
BME total 150 12.1 655 52.9
Black 5 3.2 85 46.2
Asian 60 11.2 275 51.4
Chinese 25 18.6 75 54.3
Mixed 55 15.6 200 59.6
Other 5 12.3 25 45.6
Total 3695 18.2 11020 54.3
Wales
White 2765 17.1 8175 50.6
BME total 120 10.6 485 43.7
Black 15 6.8 80 36.4
Asian 45 10.4 185 42.6
Chinese 10 14.6 30 39.0
Mixed 40 11.9 165 50.
286

9
Other 10 13.6 25 45.8
Total 2885 16.7 8660 50.2
2:2 Third/passNo. % No. %
EnglandWhite 45385 21.8 9025 4.3BME total 19350 33.7 5305 9.3Black 7010 40.3 2240 12.9Asian 8235 32.6 2015 8.0Chinese 715 27.9 215 8.4Mixed 2465 26.7 580 6.3Other 930 31.6 260 8.8Total 64735 24.4 14330 5.4Northern IrelandWhite 2125 26.9 345 4.4BME total 35 33.3 5 6.7Black 0 .. 0 ..Asian 10 .. 5 ..Chinese 10 .. 0 ..Mixed 10 .. 5 ..Other 0 .. 0 ..Total 2160 27.0 350 4.4ScotlandWhite 4470 23.5 655 3.4BME total 370 29.3 70 5.7Black 75 39.8 20 10.8
287

Asian 175 32.6 25 4.8Chinese 30 22.1 5 5.0Mixed 70 20.9 15 3.8Other 20 31.6 5 10.5Total 4840 23.9 725 3.6WalesWhite 4465 27.7 740 4.6BME total 410 36.9 100 8.9Black 100 45.9 25 10.9Asian 170 38.7 35 8.3Chinese 25 31.7 10 14.6Mixed 100 30.6 20 6.6Other 20 30.5 5 10.2Total 4880 28.3 835 4.8
.. Percentages based on totals of 52 or less are not shown.Percentages based on total number of students minus those whose country of institution, degree class or ethnic group is unknown.
288
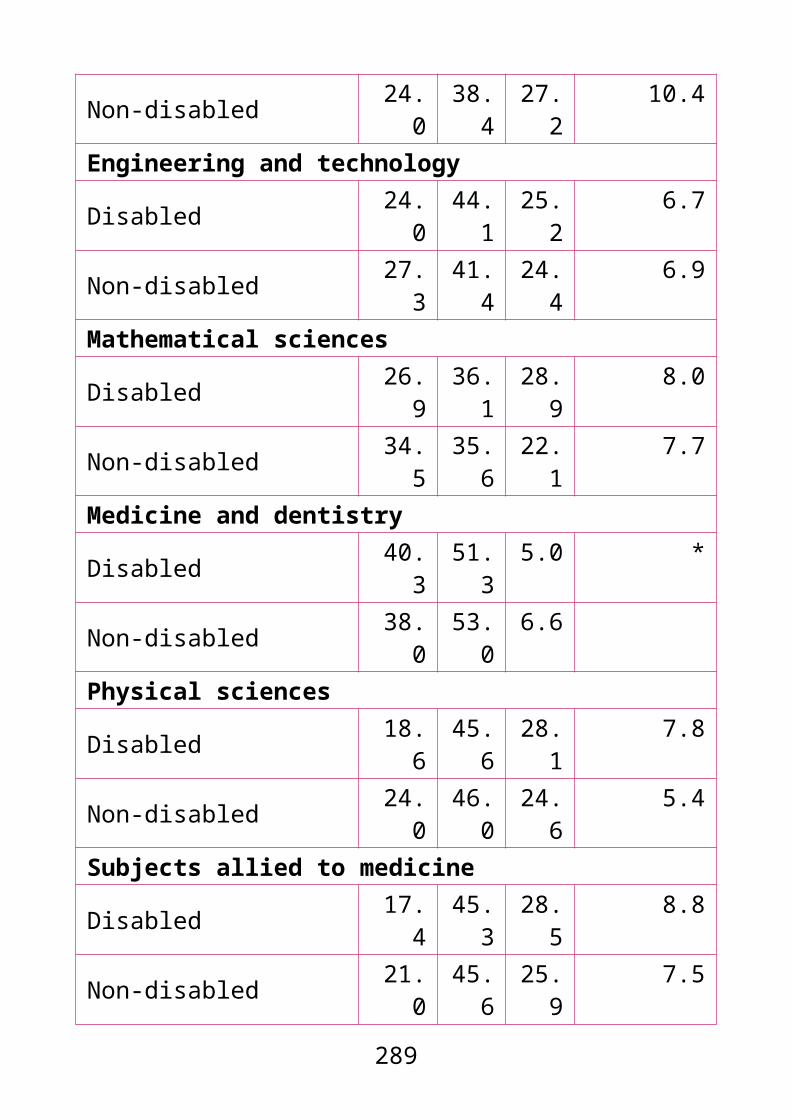
BME/white UK-domiciled first degree undergraduate qualifiers in countries of institution by degree class
First 2:1 2:2 Third/passEngland white 20.9 52.9 21.8 8England BME 12.2 44.8 33.7 9.3Northern Ireland white 16.3 52.4 26.9
Northern Ireland BME 18.1 41.9 33.3 6.7
Scotland white 18.6 54.4 23.5Scotland BME 12.1 52.9 29.3 5.7Wales white 17.1 50.6 27.7Wales BME 10.6 43.7 36.9 8.9
* values less than 5.0 are not displayed
The proportion of qualifiers who received a first/2:1 has increased by 9.5% between 2003/04 to 2012/13.
From 2003/04 to 2012/13 the increase in qualifiers receiving a first/2:1 was largest among Asian: Indian qualifiers (15.7%) followed by Asian: Bangladeshi qualifiers (14.8%) and Asian: Pakistani qualifiers (13.8%). The increase was smallest among qualifiers from an other black background (4.1%).
The ethnicity degree attainment gap has decreased from a peak of 18.8% in 2005/06 to 16.1% in 2012/13, and is at its lowest since 2003/04. Nevertheless, the gap in attainment compared with white qualifiers remains considerable, particularly for black: African qualifiers (with a gap of 26.8%) and black: Caribbean qualifiers (24.5%).
289

3.12 Profile of UK-domiciled first degree UG qualifiers receiving a first/2:1 over time by ethnic group
White BME totalNo. % No. %
2003/04 121820 63.1 15150 45.92004/05 126560 63.8 16350 46.02005/06 131130 64.7 17445 45.92006/07 133065 65.5 19015 46.92007/08 143140 66.4 20910 48.12008/09 141970 67.2 22625 49.22009/10 148500 67.9 24275 49.32010/11 159870 69.5 26655 51.12011/12 173730 71.5 30285 53.82012/13 183670 73.2 34170 57.1
Black
No. % Caribbean%
African %
Other %
2003/04 2580 35.5 38.1 33.1 39.72004/05 2870 36.2 38.6 34.8 36.52005/06 3230 35.7 37.9 34.3 38.02006/07 3635 36.7 40.4 34.9 37.22007/08 4185 37.7 40.7 36.5 37.12008/09 4740 38.1 41.5 37.0 35.82009/10 5125 38.1 41.0 37.1 36.82010/11 6015 40.7 42.1 40.3 39.42011/12 7185 43.2 45.3 42.5 41.92012/13 8335 46.8 48.7 46.4 43.8
290
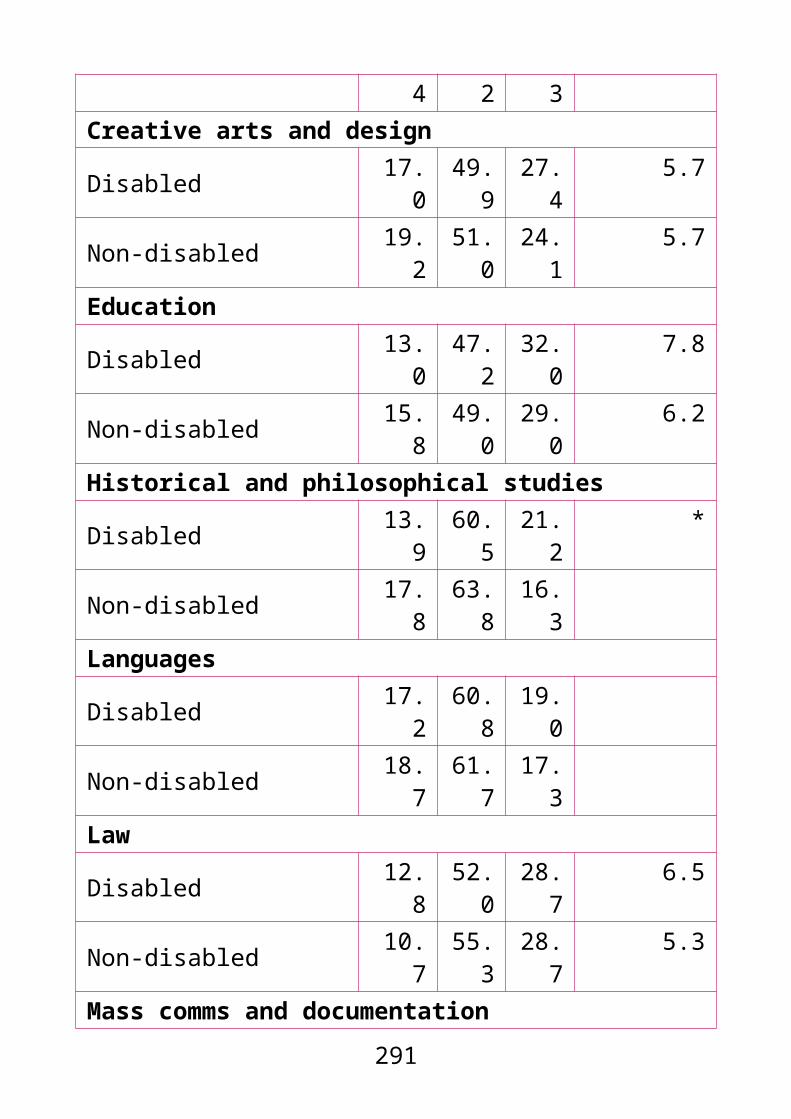
AsianAll
No. % Indian%
Pakis-tani %
Bangla-deshi %
Other %
2003/04 8485 46.3 48.7 40.4 41.4 50.82004/05 8860 46.3 48.6 40.8 41.8 50.62005/06 9110 45.7 49.0 39.4 41.2 48.22006/07 9560 46.8 50.0 41.9 41.6 48.52007/08 10225 48.2 51.6 43.9 42.0 48.92008/09 10905 50.1 54.2 44.1 45.6 50.62009/10 11450 50.0 54.0 45.0 44.7 49.82010/11 12290 52.1 56.2 46.9 48.1 52.02011/12 13645 55.2 60.0 49.3 51.7 54.72012/13 15560 59.3 64.4 54.2 56.2 57.4
Chinese MixedNo. % No. %
2003/04 1300 51.2 1615 62.22004/05 1315 49.1 2390 60.32005/06 1410 52.6 2875 61.02006/07 1420 51.8 3390 61.42007/08 1445 53.1 3860 61.62008/09 1550 55.4 4155 62.72009/10 1625 56.8 4730 62.52010/11 1705 58.7 5240 62.82011/12 1775 62.7 6050 65.52012/13 1795 63.9 6660 67.1
Other TotalAll
291
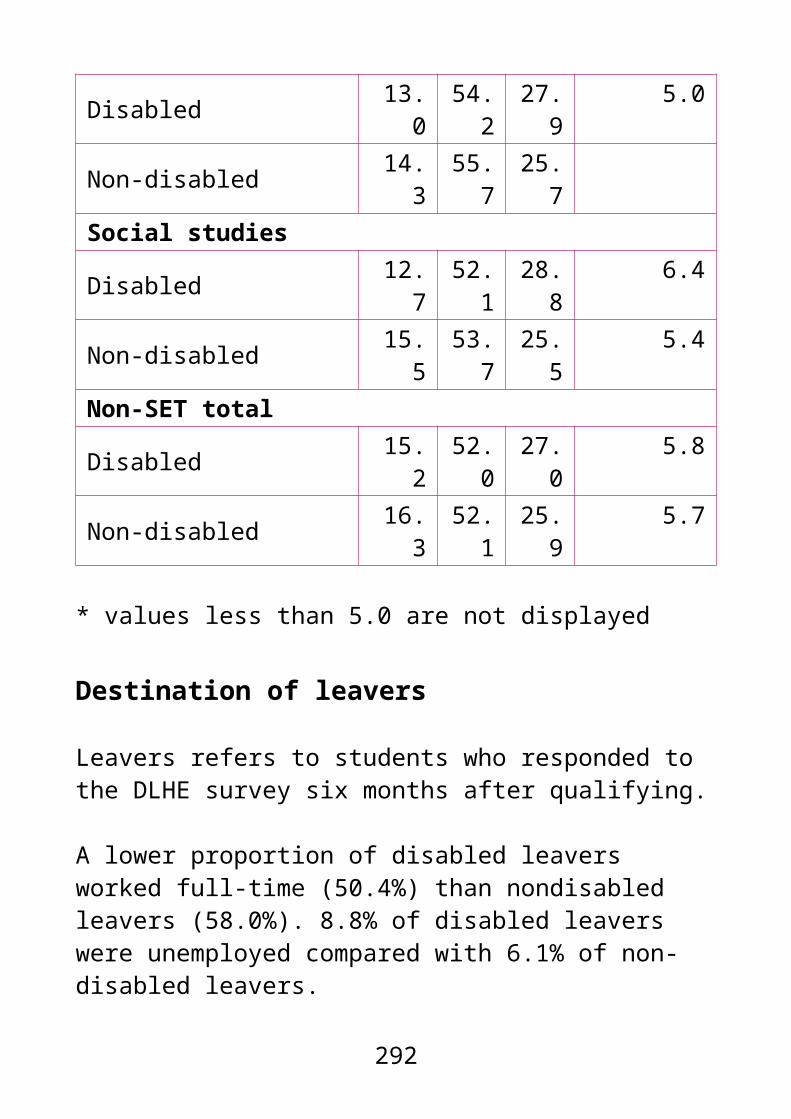
No. % No. %2003/04 1175 51.9 136970 60.62004/05 910 49.0 142905 61.12005/06 820 49.2 148575 61.72006/07 1015 51.2 152080 62.42007/08 1200 54.8 164050 63.32008/09 1275 53.1 164595 64.02009/10 1350 54.4 172775 64.52010/11 1405 54.9 186525 66.12011/12 1635 57.5 204015 68.22012/13 1820 59.5 217840 70.1
Percentages based on total number of students minus those whose degree classification or ethnic group is unknown.
UK-domiciled first degree undergraduate qualifiers receiving a first/2:1 by ethnic group over time
White
Black
Asian
Chinese
Mixed
Other
2003/04 63.1 35.5 46.3 51.2 62.2 51.9
2004/05 63.8 36.2 46.3 49.1 60.3 49.0
2005/06 64.7 35.7 45.7 52.6 61.0 49.2
2006/07 65.5 36.7 46.8 51.8 61.4 51.2
2007/08 66.4 37.7 48.2 53.1 61.6 54.8
2008/09 67.2 38.1 50.1 55.4 62.7 53.1
292

2009/10 67.9 38.1 50.0 56.8 62.5 54.4
2010/11 69.5 40.7 52.1 58.7 62.8 54.9
2011/12 71.5 43.2 55.2 62.7 65.5 57.5
2012/13 73.2 46.8 59.3 63.9 67.1 59.5
20.4% of white qualifiers received a first, compared with 12.2% of BME qualifiers (a difference of 8.2%). In contrast, 26.8% of white qualifiers received a 2:2/third/pass compared with 42.9% of BME qualifiers.
The proportion of qualifiers who received a first varied between BME groups. 20.0% of Arab and 16.5% of Chinese qualifiers received a first, compared with 6.1% of other black background and 7.4% of black: Caribbean.
The highest proportion of qualifiers to receive a third/ pass was among other black qualifiers (14.7%), while the lowest was among white qualifiers (4.3%).
3.13 UK-domiciled first degree undergraduate qualifiers by degree class and ethnic group
First 2:1No. % No. %
White 51130 20.4 132535
52.8
BME total 7275 12.2 26895 45.0
Black 1335 7.5 7005 39.3
293

Black: Caribbean 325 7.4 1800 41.3
Black: African 955 7.6 4885 38.8
Other black background 50 6.1 315 37.7
Asian 3905 13.5 13445 46.3
Asian: Indian 1780 15.8 5470 48.6
Asian: Pakistani 750 10.1 3285 44.1
Asian: Bangladeshi 320 10.8 1345 45.3
Other Asian background 590 13.0 2015 44.4
Chinese 465 16.5 1330 47.4
Mixed 1625 16.4 5035 50.7
Other 410 13.3 1415 46.2
Arab 25 20.0 60 47.7
Other 380 13.0 1350 46.1
Total 58405 18.8 159430
51.3
2:2 Third/passNo. % No. %
White 56445 22.5 10760 4.3
294

BME total 20165 33.7 5480 9.2
Black 7185 40.4 2285 12.8
Black: Caribbean 1725 39.6 510 11.7
Black: African 5110 40.6 1650 13.1
Other black background 350 41.5 125 14.7
Asian 9370 32.3 2310 8.0Asian: Indian 3255 28.9 760 6.8Asian: Pakistani 2740 36.8 675 9.0Asian: Bangladeshi 1055 35.6 245 8.3Other Asian background 1535 33.8 400 8.8Chinese 780 27.8 235 8.3Mixed 2645 26.7 615 6.2Other 965 31.6 270 8.9Arab 35 26.2 10 6.2Other 930 31.8 265 9.0Total 76610 24.7 16240 5.2
Percentages based on total number of students minus those whose degree class or ethnic group is unknown.
UK-domiciled first degree undergraduate qualifiers in ethnic groups by degree class
First 2:1 2:2 Third/pass
White 20.4 52.8 22.5 4.3BME total 12.2 45.0 33.7 9.2
295

Black 7.5 39.3 40.4 12.8Black: Caribbean 7.4 41.3 39.6 11.7Black: African 7.6 38.8 40.6 13.1Other black background 6.1 37.7 41.5 14.7
Asian 13.5 46.3 32.3 8.0Asian: Indian 15.8 48.6 28.9 6.8Asian: Pakistani 10.1 44.1 36.8 9.0Asian: Bangladeshi 10.8 45.3 35.6 8.3Other Asian background 13.0 44.4 33.8 8.8
Chinese 16.5 47.4 27.8 8.3Mixed 16.4 50.7 26.7 6.2Other 13.3 46.2 31.6 8.9Arab 20.0 47.7 26.2 6.2Other 13.0 46.1 31.8 9.0
Within SET subject areas, 71.6% of white qualifiers obtained a first/2:1, compared with 57.6% of BME qualifiers (a 14.0% gap).
However, the degree attainment gap varied by BME ethnic group, from 27.1% for qualifiers from an other black background to 4.5% for Chinese qualifiers.
The highest proportion of qualifiers to receive a third/ pass was among other black qualifiers (14.7%), while the lowest was among Arab qualifiers (3.7%).
3.14 UK-domiciled first degree undergraduate qualifiers in SET subjects by degree class and ethnic group
First 2:1296

No. % No. %White 23775 23.9 47495 47.7BME total 3600 14.3 10875 43.3Black 625 8.8 2710 38.0Black: Caribbean 125 8.8 570 40.6Black: African 480 8.8 2035 37.4Other black background 20 7.2 105 37.3Asian 2120 16.0 6015 45.5Asian: Indian 980 18.7 2475 47.0Asian: Pakistani 385 12.1 1405 44.5Asian: Bangladeshi 140 13.2 485 45.5Other Asian background 365 15.0 1030 42.1Chinese 245 19.2 615 47.9Mixed 660 19.0 1590 45.8Other 195 15.5 560 44.0Arab 20 21.5 35 42.9Other 180 15.1 525 44.1Total 27375 21.9 58370 46.8
2:2 Third/passNo. % No. %
White 23275 23.4 5120 5.1BME total 8180 32.6 2440 9.7Black 2825 39.5 980 13.7Black: Caribbean 540 38.6 170 12.0Black: African 2165 39.7 770 14.1Other black background 115 40.8 40 14.7Asian 4005 30.3 1090 8.2Asian: Indian 1450 27.6 355 6.7Asian: Pakistani 1075 33.9 300 9.5
297

Asian: Bangladeshi 340 32.1 95 9.2Other Asian background 810 33.1 240 9.8Chinese 330 25.5 95 7.4Mixed 955 27.6 260 7.5Other 400 31.4 115 9.2Arab 25 31.9 5 3.7Other 370 31.3 115 9.5Total 31455 25.2 7560 6.1
Percentages based on total number of students minus those whose degree class or ethnic group is unknown.
The ethnicity degree attainment gap was larger among qualifiers who studied non-SET subjects than among those who studied SET subjects (see fig. 3.14).
74.3% of white qualifiers obtained a first/2:1, compared with 56.7% of BME qualifiers (a 17.6% gap).
However, the degree attainment gap varied by BME ethnic group, from 30.9% for qualifiers from another black background to 5.9% for mixed qualifiers.
As with qualifiers who studied SET subjects (see fig. 3.14), the ethnic group with the highest proportion of qualifiers to receive a third/pass was those from another black background (14.8%).
3.15 UK-domiciled first degree undergraduate qualifiers in non-SET subjects by degree class and ethnic group
First 2:1No. % No. %
298

White 27355 18.1 85040 56.2BME total 3675 10.6 16020 46.1Black 705 6.6 4290 40.2Black: Caribbean 200 6.8 1235 41.6Black: African 475 6.6 2845 39.8Other black background 30 5.5 210 37.9Asian 1790 11.3 7430 47.0Asian: Indian 795 13.3 2995 49.9Asian: Pakistani 365 8.6 1880 43.8Asian: Bangladeshi 180 9.5 860 45.2Other Asian background 225 10.8 985 47.0Chinese 220 14.3 715 46.9Mixed 965 15.0 3445 53.4Other 210 11.8 855 47.8Arab 10 .. 25 ..Other 205 11.7 825 47.6
Total 31030 16.7 101065 54.4
2:2 Third/passNo. % No. %
White 33175 21.9 5640 3.7BME total 11985 34.5 3040 8.8Black 4365 40.9 1305 12.2Black: Caribbean 1185 40.0 345 11.6Black: African 2945 41.2 880 12.3Other black background 235 41.9 80 14.8Asian 5365 33.9 1225 7.7Asian: Indian 1805 30.0 405 6.8Asian: Pakistani 1670 38.9 375 8.7
299

Asian: Bangladeshi 715 37.5 150 7.8Other Asian background 725 34.7 160 7.5Chinese 450 29.7 140 9.1Mixed 1690 26.1 355 5.5Other 570 31.7 155 8.7Arab 10 .. 5 ..Other 560 32.2 150 8.6Total 45160 24.3 8680 4.7
.. Percentages based on totals of 52 or less are not shown.Percentages based on total number of students minus those whose degree class or ethnic group is unknown.
In every subject, a higher proportion of white qualifiers received a first/2:1 than BME qualifiers.
Among SET subject areas, the largest ethnicity degree attainment gap was in architecture, building and planning where 72.4% of white qualifiers received a first/2:1, compared with 50.4% of BME qualifiers (a gap of 22.0%). There were also prominent ethnicity degree attainment gaps in computer science (17.5%) and in physical sciences (15.1%). The smallest ethnicity degree attainment gap was in medicine and dentistry (3.4%).
Among non-SET subject areas, the largest ethnicity degree attainment gap was in combined subjects where 65.0% of white qualifiers received a first/2:1, compared with 41.0% of BME qualifiers (a 24.0% difference). There were also wide ethnicity degree attainment gaps in creative arts and design (20.0%) and education (19.9%). The smallest ethnicity degree attainment gap was in historical and philosophical studies (6.1%).
300

3.16 UK-domiciled first degree undergraduate qualifiers by subject area, degree class and BME/white identity
FirstWhite BMENo. % No. %
SETAgriculture and related subjects 410 17.8 10 8.6
Architecture, building, planning 1335 20.8 125 9.5
Biological sciences 5020 17.4 575 9.8Computer science 2375 28.5 545 16.1Engineering and technology 3670 31.5 615 17.7
Mathematical sciences 1905 37.4 405 26.4Medicine and dentistry 380 40.5 145 31.0Physical sciences 3070 23.9 235 15.7Subjects allied to medicine 5615 24.2 955 12.7
Veterinary science 5 .. 0 ..SET total 23775 23.9 3600 14.3Non-SETBusiness, administrative studies 5265 20.8 1465 12.7
Combined 415 17.7 35 9.1Creative arts and design 6370 20.0 485 11.5Education 2470 16.6 145 7.5Historical, philosophical studies 2665 17.5 160 11.6
301
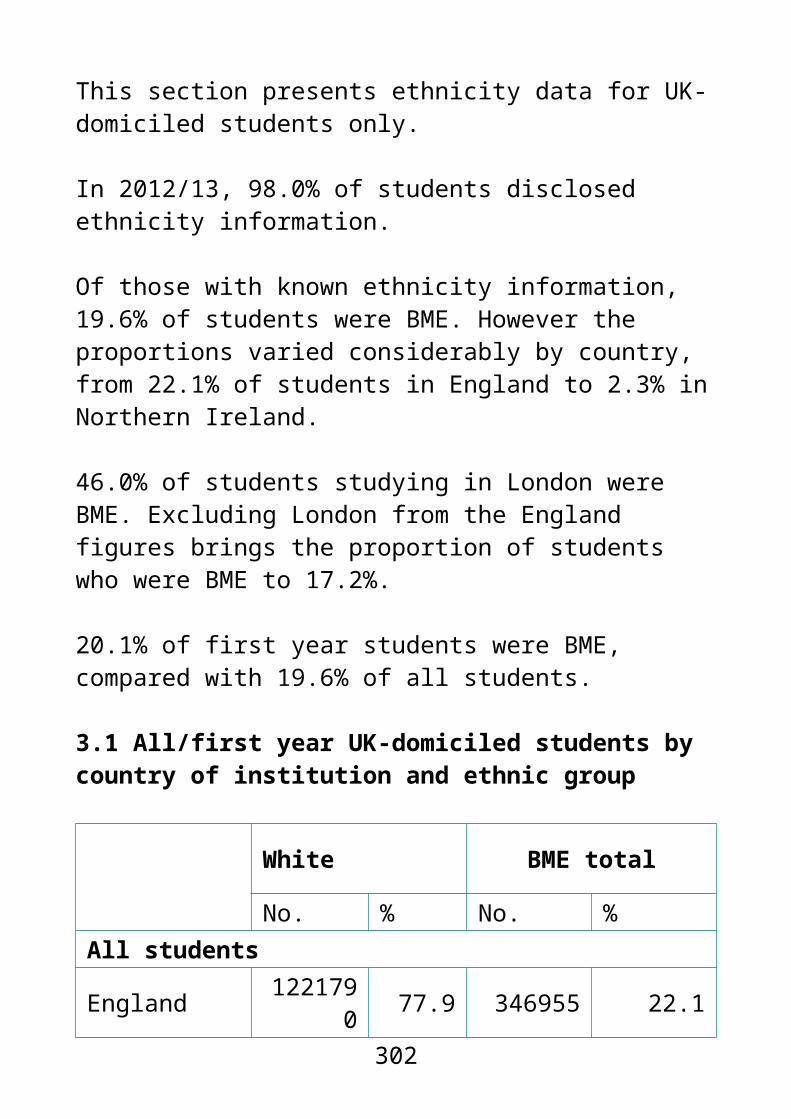
Languages 3580 19.2 280 12.3Law 1230 13.6 280 7.0Mass communications, documentation 1295 15.7 95 6.1
Social studies 4065 15.8 730 9.7Non-SET total 27355 18.1 3675 10.6Total 51130 20.4 7275 12.2
2:1White BMENo. % No. %
SETAgriculture and related subjects 1095 47.5 40 42.1
Architecture, building, planning 3315 51.6 535 40.9
Biological sciences 15300 53.0 2740 46.7Computer science 3430 41.1 1225 36.0Engineering and technology 5105 43.8 1500 43.1
Mathematical sciences 1855 36.3 590 38.5Medicine and dentistry 485 52.1 270 58.2Physical sciences 6145 47.8 610 40.9Subjects allied to medicine 10735 46.3 3370 45.1
Veterinary science 30 .. 0 ..
SET total 47495 47.7 10875 43.3
Non-SETBusiness, administrative studies 13160 52.1 5000 43.4
302

Combined 1120 47.3 120 31.9Creative arts and design 16830 53.0 1765 41.5Education 7490 50.4 755 39.6Historical, philosophical studies 9735 63.8 865 63.6
Languages 11890 63.7 1360 59.9Law 5340 59.2 1940 48.5Mass communications, documentation 4780 58.0 745 48.7
Social studies 14690 57.1 3470 46.4
Non-SET total 85040 56.2 16020 46.1
Total 132535 52.8 2689
5 45.0
2:2White BMENo. % No. %
SETAgriculture and related subjects 660 28.6 45 43.5
Architecture, building, planning 1440 22.4 495 37.7
Biological sciences 7295 25.3 2050 35.0Computer science 1930 23.1 1145 33.8Engineering and technology 2365 20.3 1055 30.4
Mathematical sciences 1065 20.8 395 25.9Medicine and dentistry 50 5.6 40 8.2Physical sciences 3055 23.7 505 33.8Subjects allied to 5410 23.4 2455 32.8
303
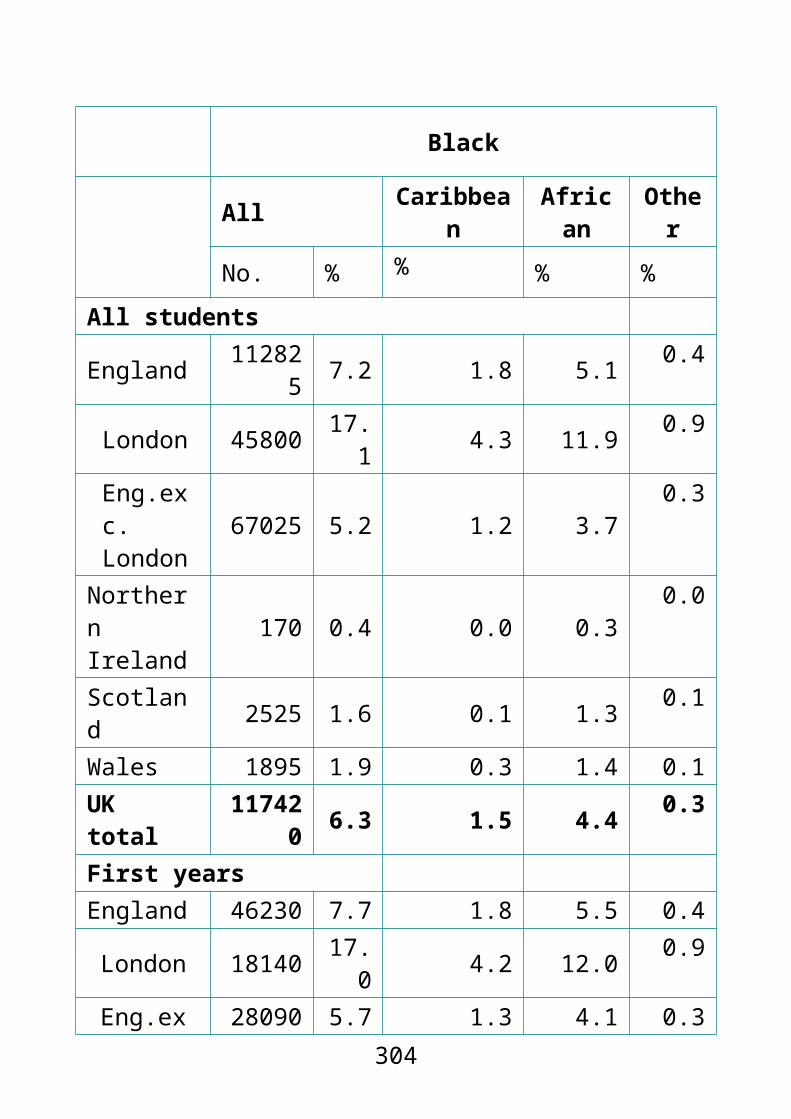
medicineVeterinary science 10 .. 0 ..SET total 23275 23.4 8180 32.6Non-SETBusiness, administrative studies 5845 23.1 4020 34.8
Combined 590 25.0 150 40.6Creative arts and design 7160 22.5 1540 36.2Education 4120 27.7 790 41.4Historical, philosophical studies 2510 16.4 290 21.4
Languages 2885 15.4 540 23.8Law 2145 23.8 1455 36.4Mass communications, documentation 1925 23.3 570 37.1
Social studies 5995 23.3 2630 35.2
Non-SET total 33175 21.9 11985 34.5
Total 56445 22.5 20165 33.7
Third/passWhite BMENo. % No. %
SETAgriculture and related subjects 140 6.1 5 5.9
Architecture, building, planning 330 5.2 155 11.9
Biological sciences 1250 4.3 500 8.5Computer science 605 7.3 480 14.2
304

Engineering and technology 500 4.3 300 8.7
Mathematical sciences 280 5.5 140 9.3Medicine and dentistry 15 1.8 10 2.6Physical sciences 590 4.6 145 9.6Subjects allied to medicine 1400 6.1 700 9.4
Veterinary science 0 .. 0 ..SET total 5120 5.1 2440 9.7Non-SETBusiness, administrative studies 1005 4.0 1050 9.1
Combined 235 10.0 70 18.4Creative arts and design 1405 4.4 465 10.9Education 790 5.3 220 11.5Historical, philosophical studies 355 2.3 45 3.4
Languages 315 1.7 90 4.0Law 310 3.4 325 8.2Mass communications, documentation 240 2.9 125 8.2
Social studies 980 3.8 650 8.7Non-SET total 5640 3.7 3040 8.8Total 10760 4.3 5480 9.2
.. Percentages based on totals of 52 or less are not shown.Percentages based on total number of students minus those whose subject area, degree class or BME/white identity is unknown.
305

BME/white UK-domiciled first degree undergraduate qualifiers in SET subject areas by degree class
First 2:1 2:2 Third/passAgriculture and related subjectsWhite 17.8 47.5 28.6 6.1BME 8.6 42.1 43.5 5.9Architecture, building, and planningWhite 20.8 51.6 22.4 5.2BME 9.5 40.9 37.7 11.9Biological sciencesWhite 17.4 53.0 25.3 *BME 9.8 46.7 35.0 8.5Computer scienceWhite 28.5 41.1 23.1 7.3BME 16.1 36.0 33.8 14.2Engineering and technologyWhite 31.5 43.8 20.3BME 17.7 43.1 30.4 8.7Mathematical sciencesWhite 37.4 36.3 20.8 5.5BME 26.4 38.5 25.9 9.3Medicine and dentistryWhite 40.5 52.1 5.6BME 31.0 58.2 8.2Physical sciencesWhite 23.9 47.8 23.7BME 15.7 40.9 33.8 9.6Subjects allied to medicineWhite 24.2 46.3 23.4 6.1
306

BME 12.7 45.1 32.8 9.4Veterinary scienceWhite ..BME ..SET totalWhite 23.9 47.7 23.4 5.1BME 14.3 43.3 32.6 9.7
* values less than 5.0 are not displayed.. percentages based on totals of 52 or less are not shown
BME/white UK-domiciled first degree undergraduate qualifiers in non-SET subject areas by degree class
First 2:1 2:2 Third/passBusiness and admin studiesWhite 20.8 52.1 23.1 *BME 12.7 43.4 34.8 9.1CombinedWhite 17.7 47.3 25.0 10.0BME 9.1 31.9 40.6 18.4Creative arts and designWhite 20.0 53.0 22.5BME 11.5 41.5 36.2 10.9EducationWhite 16.6 50.4 27.7 5.3BME 7.5 39.6 41.4 11.5Historical and philosophical studiesWhite 17.5 63.8 16.4BME 11.6 63.6 21.4Languages
307

White 19.2 63.7 15.4BME 12.3 59.9 23.8LawWhite 13.6 59.2 23.8BME 7.0 48.5 36.4 8.2Mass comms and documentationWhite 15.7 58.0 23.3BME 6.1 48.7 37.1 8.2Social studiesWhite 15.8 57.1 23.3BME 9.7 46.4 35.2 8.7Non-SET totalWhite 18.1 56.2 21.9BME 10.6 46.1 34.5 8.8
* values less than 5.0 are not displayed
308
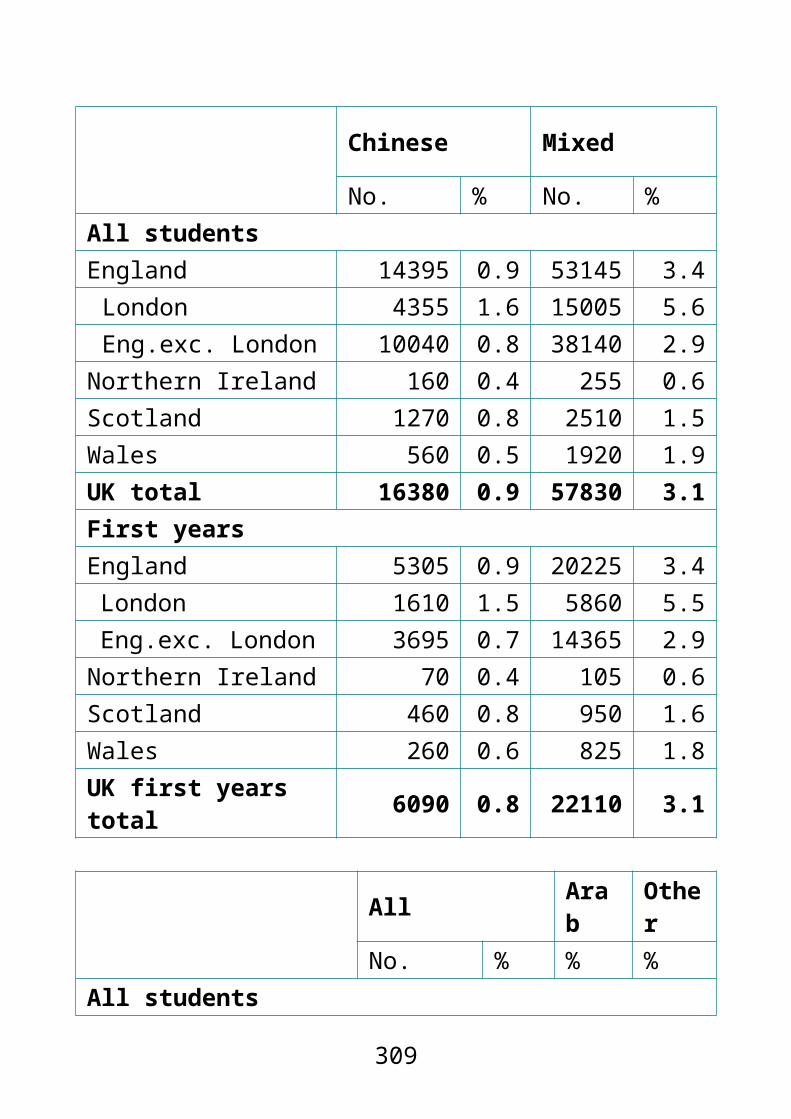
Destination of leavers
Leavers refers to students who responded to the DLHE survey six months after qualifying. 59.1% of white leavers were in full-time work, compared with
51.0% of BME leavers. Full-time employment was particularly low among Arab (40.7%), Asian: Bangladeshi (46.2%) and Asian: Pakistani (46.3%) leavers.
Overall, 11.8% of white and 14.2% of BME leavers were in full-time and part-time study.
3.17 UK-domiciled DLHE leavers by leaving destination and ethnic group
White BME totalNo. % No. %
Full-time work total 193295 59.1 35180 51.0Professional full-time work 154755 47.3 27785 40.3
Non-professional full-time work 38160 11.7 7280 10.6
Unknown full-time work 375 0.1 115 0.2
Part-time work 41000 12.5 9675 14.0Work and further study 23230 7.1 3995 5.8Full-time study 34650 10.6 8670 12.6Part-time study 3880 1.2 1090 1.6Unemployed 17085 5.2 7465 10.8Other 14130 4.3 2850 4.1Total 327270 100 68925 100
309
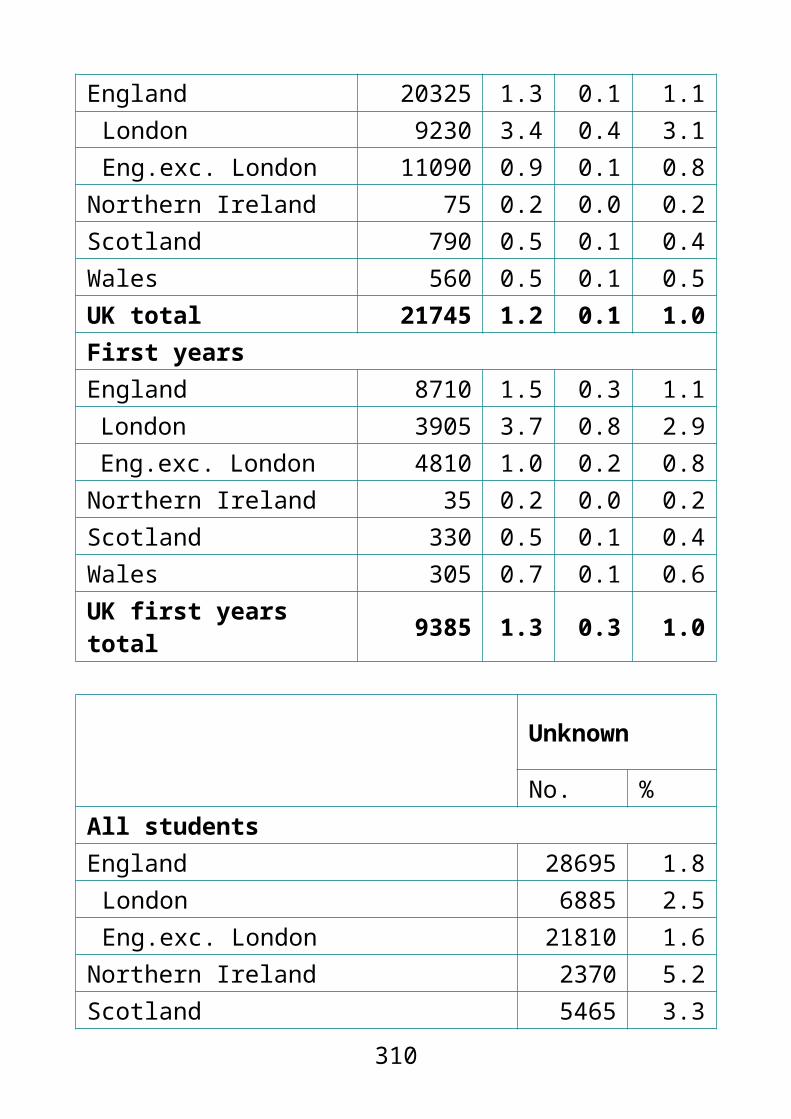
BlackAll
No. % Caribbean %
African %
Other %
Full-time work total 9780 49.
5 52.3 48.4 50.9
Professional full-time work
7500 38.0 38.8 37.7 37.9
Non-professional full-time work
2255 11.4 13.4 10.6 12.4
Unknown full-time work 25 0.1 0.1 0.1 0.5
Part-time work 3045 15.
4 17.8 14.7 13.8
Work and further study 1120 5.7 6.3 5.4 6.1
Full-time study 2280 11.
5 9.2 12.4 11.5
Part-time study 335 1.7 1.5 1.7 2.2
Unemployed 2385 12.1 9.1 13.2 11.5
Other 815 4.1 3.8 4.2 4.0
Total 19765 100 100 100 100
310
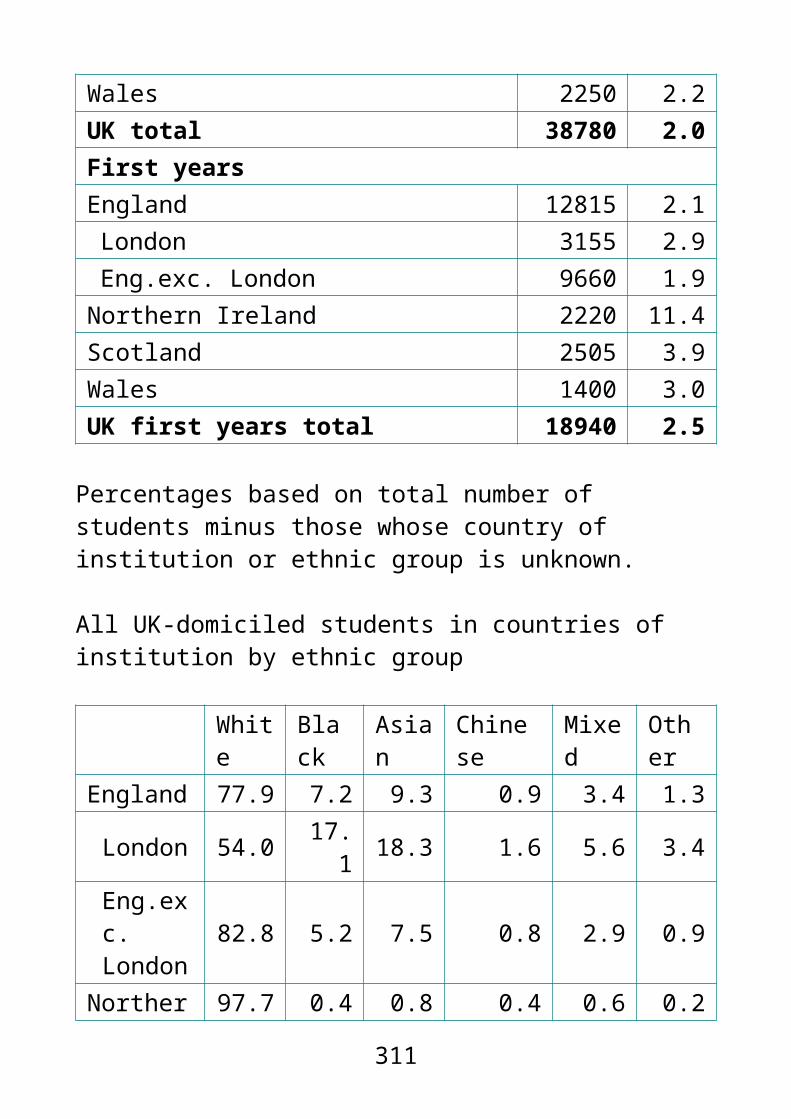
AsianAllNo. %
Full-time work total 15820 51.2Professional full-time work 12670 41.0Non-professional full-time work 3090 10.0Unknown full-time work 55 0.2
Part-time work 4255 13.8Work and further study 1835 5.9Full-time study 3975 12.9Part-time study 495 1.6Unemployed 3385 11.0Other 1140 3.7Total 30905 100
AsianIndian %.
Pakistani %
Bangladeshi %
Other %
Full-time work total 56.3 46.3 46.2 48.9
Professional full-time work
46.8 36.2 31.9 39.4
Non-professional full-time work
9.3 9.9 14.3 9.3
Unknown full-time work 0.2 0.2 0.1 0.2
Part-time work 12.0 14.5 19.5 13.6Work and 6.1 6.2 5.7 5.2
311

further studyFull-time study 11.8 13.7 11.4 15.0Part-time study 1.3 2.0 1.8 1.7
Unemployed 9.4 12.8 11.9 11.5Other 3.2 4.4 3.3 4.0Total 100 100 100 100
Chinese MixedNo. % No. %
Full-time work total 1625 50.3 6060 54.2Professional full-time work 1355 41.9 4730 42.3
Non-professional full-time work 265 8.2 1305 11.7
Unknown full-time work 5 0.2 25 0.2Part-time work 350 10.8 1535 13.7Work and further study 150 4.6 690 6.2Full-time study 510 15.8 1375 12.3Part-time study 30 0.9 150 1.3Unemployed 405 12.5 845 7.6Other 160 5.0 530 4.7Total 3235 100 11185 100
OtherAll Arab OtherNo. % % %
Full-time work total 1895 49.4 40.7 49.9Professional full-time work 1520 39.7 37.3 39.8
Non-professional 365 9.5 3.4 9.8312

full-time workUnknown full-
time work 10 0.2 0.0 0.2
Part-time work 490 12.7 5.1 13.1Work and further study 200 5.3 5.1 5.3
Full-time study 525 13.7 31.1 12.8Part-time study 80 2.1 3.4 2.0Unemployed 445 11.6 13.0 11.5Other 200 5.2 1.7 5.4Total 3835 100 100 100
Percentages based on total number of leavers minus those whose leaving destination or ethnic group is unknown.
White UK-domiciled DLHE leavers by leaving destination
WhiteFull-time work total 59.1
Other destination’s 40.9Professional full-time work 47.3Non-professional full-time work 11.7Unknown full-time work 0.1
Part-time work 12.5Work and further study 7.1Full-time study 10.6Part-time study 1.2Unemployed 5.2Other 4.3
313

BME UK-domiciled DLHE leavers by leaving destination
BMEFull-time work total 51.0
Other destination’s 49.0Professional full-time work 40.3Non-professional full-time work 10.6Unknown full-time work 0.2
Part-time work 14.0Work and further study 5.8Full-time study 12.6Part-time study 1.6Unemployed 10.8Other 4.1
314

4 Gender
Female students made up 56.2% of all students and 57.5% of first year students in the UK. The largest gender difference within a country was in Northern Ireland, at 14.8% for all students and 17.8% for first year students.
Overall, female students comprised the majority of students in all degree levels with the exception of research postgraduates, where 53.1% were male.
The gender composition of degree levels fluctuates by domicile. Women comprise a larger proportion of UK students than both EU and non-EU students at any given degree level.
Within SET subject areas, male students made up the majority of first degree undergraduates (51.7%) and research postgraduates (56.6%), while female students comprised the majority of other undergraduates (63.7%) and taught postgraduates (53.6%).
The SET subject with the largest gender gap across all degree levels was engineering and technology. The gender gap was particularly wide in this subject area among other undergraduates, where 90.9% of students were men and only 9.1% women.
A higher proportion of female UK-domiciled full-time first degree entrants continued or qualified in 2012/13 than male
UK-domiciled full-time first degree entrants (92.3% to 90.3% respectively), a difference of 2.0%.
A higher proportion of male UK-domiciled full-time first degree entrants (7.7%) than female UK-domiciled full-time first degree entrants (5.9%) were no longer in higher education, a difference of 1.8%.
Across the UK there was a negative degree attainment gap with a higher proportion of female first degree
315

qualifiers receiving a first/2:1 than male first degree qualifiers.
Compared with 2011/12, the negative gender degree attainment gap has widened in Wales (-6.1% in 2011/12) and Northern Ireland (-2.9%).
Gender overview
Female students made up 56.2% of all students and 57.5% of first year students in the UK.
This gender difference was largest in Northern Ireland, at 14.8% for all students and 17.8% for first year students.
4.1 All/first year students by country of institution and gender
Female MaleNo. % No. %
All studentsEngland 1093555 56.2 851285 43.8Northern Ireland 29670 57.4 22050 42.6
Scotland 122470 57.1 92085 42.9Wales 69125 53.7 59615 46.3Total 1314820 56.2 1025030 43.8First year studentsEngland 461100 57.8 337215 42.2Northern Ireland 13445 58.9 9365 41.1
Scotland 50890 57.8 37165 42.2Wales 33255 53.7 28650 46.3Total 558690 57.5 412400 42.5
316

Percentages based on total number of students minus those whose country of institution or gender is unknown.
All/first year students in countries of institution by gender
Female MaleAll students England 56.2% 43.8%All students Northern Ireland 57.4% 42.6%
All students Scotland 57.1% 42.9%All students Wales 53.7% 46.3%All students UK 56.2% 43.8%First years England 57.8% 42.2%First years Northern Ireland 58.9% 41.1%
First years Scotland 57.8% 42.2%First years Wales 53.7% 46.3%First years UK 57.5% 42.5%
There has consistently been a higher proportion of female students than male students. While the proportion of men has gradually increased from 42.7% in 2003/04 to 43.8% in 2012/13, there was still a difference of 12.4%.
This trend was also observed among first year students, with the proportion of men increasing from 41.2% in 2003/04 to 42.5% in 2012/13. However, the proportion of first year students who were male in 2012/13 was 0.4% lower than in 2011/12.
In 2012/13 the gender gap among first year students stood at 15.0%.
317

4.2 Profile of all/first year students over time by gender
Female MaleNo. % No. %
All students2003/04 1260140 57.3 940035 42.72004/05 1284605 57.4 951665 42.62005/06 1313130 57.6 968110 42.42006/07 1325260 57.5 979440 42.52007/08 1317735 57.1 988220 42.92008/09 1363810 56.9 1032230 43.12009/10 1412185 56.6 1081225 43.42010/11 1411090 56.4 1090200 43.62011/12 1406940 56.4 1089685 43.62012/13 1314820 56.2 1025030 43.8First year students2003/04 594505 58.8 417395 41.22004/05 592825 58.6 418020 41.42005/06 620335 58.7 437185 41.32006/07 618110 58.5 439195 41.52007/08 321140 58.1 447550 41.92008/09 661520 57.8 482495 42.22009/10 681575 57.5 503610 42.52010/11 655190 57.2 490770 42.82011/12 638445 57.1 478880 42.92012/13 558690 57.5 412400 42.5
Percentages based on total number of students minus those whose gender is unknown.
318
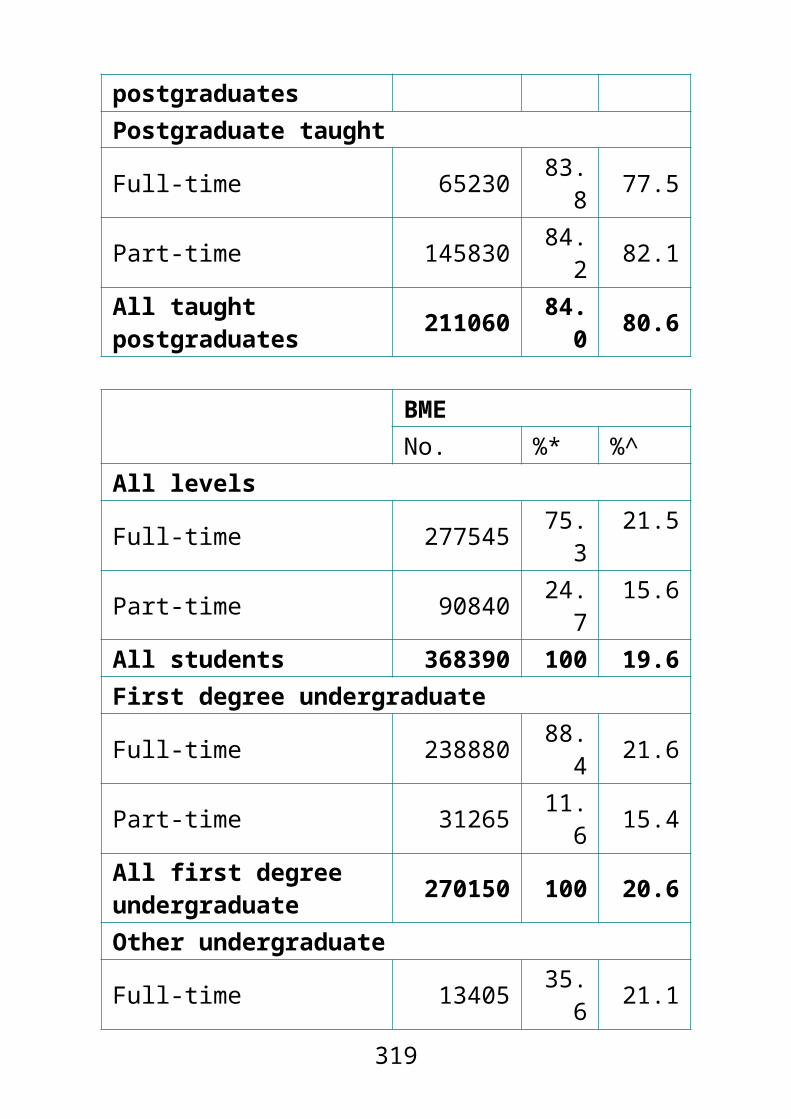
All/first year students over time by gender
Female MaleFirst year
All student
s
First year
All students
2003/04 58.8 57.3 41.2 42.72004/05 58.6 57.4 41.4 42.62005/06 58.7 57.6 41.3 42.42006/07 58.5 57.5 41.5 42.52007/08 58.1 57.1 41.9 42.92008/09 57.8 56.9 42.2 43.12009/10 57.5 56.6 42.5 43.42010/11 57.2 56.4 42.8 43.62011/12 57.1 56.4 42.9 43.62012/13 57.5 56.2 42.5 43.8
Overall, female students comprised the majority of students in all degree levels with the exception of research postgraduates, where 53.1% were male.
However, the gender composition of degree levels fluctuates by domicile. Women comprise a larger proportion of UK students than both EU and non-EU students at any given degree level.
For example, the proportion of other undergraduates who were female was considerably higher among those who were UK-domiciled (64.6%) than for those domiciled in the EU (52.3%) and non-EU (57.4%).
319

4.3 All students by degree level, domicile category and gender
Female MaleNo. %* %^ No. %* %^
All UK 1100035 83.7 57.5 814600 79.5 42.5All EU 67210 5.1 53.7 58060 5.7 46.3All non-EU 147580 11.2 49.2 152375 14.9 50.8Total 1314820 100 56.2 1025030 100 43.8First degree undergraduateAll UK 738385 87.8 55.7 586100 85.2 44.3All EU 40230 4.8 55.1 32810 4.8 44.9All non-EU 62180 7.4 47.5 68690 10.0 52.5Total 840795 100 55.0 687595 100 45.0Other undergraduateAll UK 163295 92.9 64.6 89310 90.0 35.4All EU 3350 1.9 52.3 3055 3.1 47.7All non-EU 9215 5.2 57.4 6850 6.9 42.6Total 175865 100 63.9 99215 100 36.1Research postgraduateAll UK 31215 61.1 48.8 32740 56.5 51.2All EU 6705 13.1 48.0 7270 12.5 52.0All non-EU 13205 25.8 42.4 17970 31.0 57.6Total 51130 100 46.9 57985 100 53.1Taught postgraduateAll UK 167135 67.7 61.1 106450 59.1 38.9All EU 16925 6.9 53.1 14930 8.3 46.9All non-EU 62975 25.5 51.7 58860 32.7 48.3Total 247030 100 57.8 180235 100 42.2
* within a gender, the percentage of students in a domicile category (compare vertically within a degree level)
320
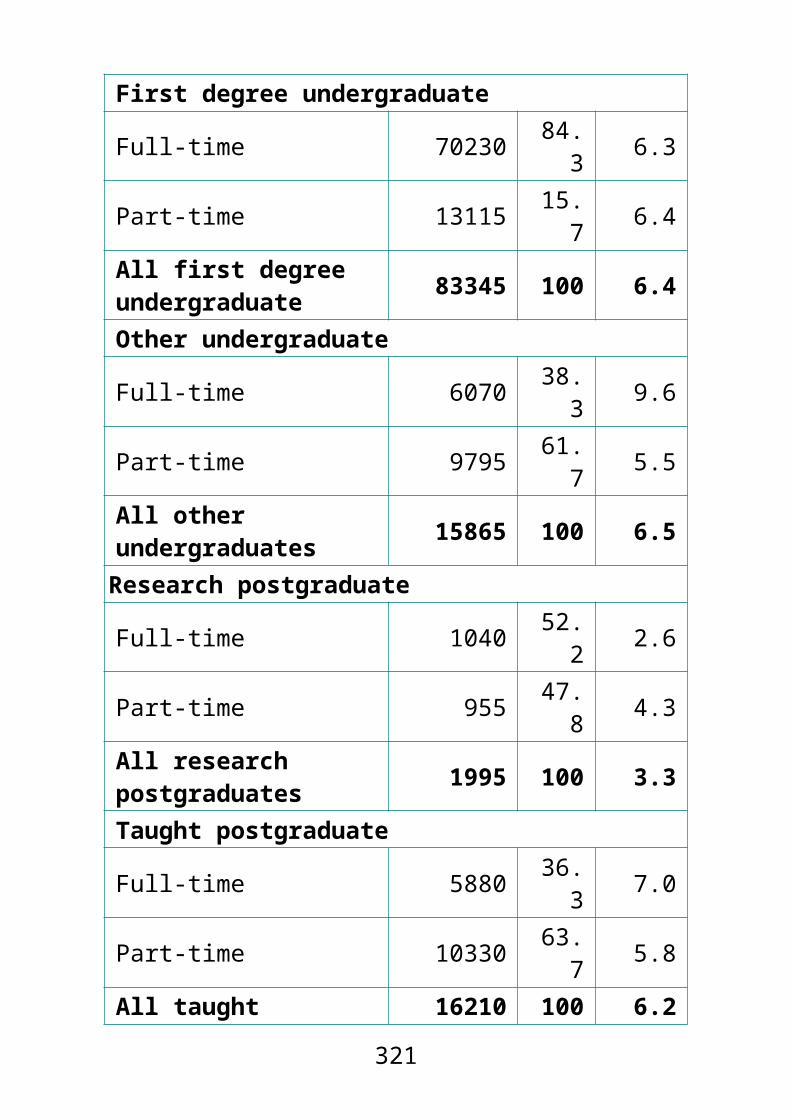
^ within a degree level and domicile category, the percentage of students who are female/male (compare horizontally)
Percentages based on total number of students minus those whose degree level, domicile category or gender is unknown.
All/first year students over time by gender
Female MaleAll UK 57.5% 42.5%All EU 53.7% 46.3%All non-EU 49.2% 50.8%UK first degree undergraduates 55.7% 44.3%EU first degree undergraduates 55.1% 44.9%Non-EU first degree undergraduates 47.5% 52.5%
UK other undergraduates 64.6% 35.4%EU other undergraduates 52.3% 47.7%Non-EU other undergraduates 57.4% 42.6%UK research postgraduates 48.8% 51.2%EU research postgraduates 48.0% 52.0%Non-EU research postgraduates 42.4% 57.6%
UK taught postgraduates 61.1% 38.9%EU taught postgraduates 53.1% 46.9%Non-EU taught postgraduates 51.7% 48.3%
321

Mode and level
At every degree level a higher proportion of female students studied part-time than male students.
This was most apparent among research postgraduates where 29.4% of female students studied part-time compared with 24.8% of male students (a difference of 4.6%).
74.9% of female and 70.6% of male other undergraduates studied part-time.
4.4 All students by degree level, mode and gender
Female MaleNo. %* %^ No. %* %^
All full-time 916635 69.7 54.5 765400 74.7 45.5All part-time 398185 30.3 60.5 259630 25.3 39.5Total 1314820 100 56.2 1025030 100 43.8First degree undergraduateFull-time 715215 85.1 54.5 597050 86.8 45.5Part-time 125585 14.9 58.1 90550 13.2 41.9Total 840795 100 55.0 687595 100 45.0Other undergraduateFull-time 44125 25.1 60.2 29210 29.4 39.8Part-time 131740 74.9 65.3 70005 70.6 34.7Total 175865 100 63.9 99215 100 36.1Research postgraduateFull-time 36075 70.6 45.3 43595 75.2 54.7Part-time 15055 29.4 51.1 14385 24.8 48.9Total 51130 100 46.9 57985 100 53.1Taught postgraduateFull-time 121220 49.1 55.9 95545 53.0 44.1Part-time 125810 50.9 59.8 84690 47.0 40.2
322

Total 247030 100 57.8 180235 100 42.2
* within a gender, the percentage of students in a mode (compare vertically within a degree level)
^ within a degree level and mode, the percentage of students who are female/male (compare horizontally)
Percentages based on total number of students minus those whose degree level, mode or gender is unknown.
All full-time/part-time students in degree levels by gender
Female MaleAll full-time 54.5% 45.5%All part-time 60.5% 39.5%All students 56.2% 43.8%Full-time first degree undergraduates 54.5% 45.5%
Part-time first degree undergraduates 58.1% 41.9%
All first degree undergraduates 55.0% 45.0%Full-time other undergraduates 60.2% 39.8%Part-time other undergraduates 65.3% 34.7%All other undergraduates 63.9% 36.1%Full-time research postgraduates 45.3% 54.7%Part-time research postgraduates 51.1% 48.9%
All research postgraduates 46.9% 53.1%Full-time taught postgraduates 55.9% 44.1%Part-time taught postgraduates 59.8% 40.2%All taught postgraduates 57.8% 42.2%
323

While overall 60.2% of full-time other undergraduates were female (see fig. 4.4), among first years, female students accounted for 52.8% of fulltime other undergraduates (a 7.4% difference).
4.5 First year students by degree level, mode and gender
Female MaleNo. %* %^ No. %* %^
All full-time 366225 65.6 54.7 303055 73.5 45.3All part-time 192465 34.4 63.8 109345 26.5 36.2Total 558690 100 57.5 412400 100 42.5First degree undergraduateFull-time 237105 86.4 54.7 196020 88.8 45.3Part-time 37475 13.6 60.3 24660 11.2 39.7Total 274580 100 55.4 220680 100 44.6Other undergraduateFull-time 17485 16.0 52.8 15635 25.5 47.2Part-time 91865 84.0 66.8 45630 74.5 33.2Total 109350 100 64.1 61265 100 35.9Research postgraduateFull-time 12840 79.4 45.9 15140 82.2 54.1Part-time 3325 20.6 50.4 3270 17.8 49.6Total 16165 100 46.8 18405 100 53.2Taught postgraduateFull-time 98795 62.3 56.4 76260 68.1 43.6Part-time 59805 37.7 62.6 35785 31.9 37.4Total 158600 100 58.6 112045 100 41.4
* within a gender, the percentage of students in a mode (compare vertically within a degree level)^ within a degree level and mode, the percentage of students who are female/male (compare horizontally)
324

Percentages based on total number of students minus those whose degree level, mode or gender is unknown.
First year full-time/part-time students in degree levels by gender
Female MaleAll full-time 54.7% 45.3%All part-time 63.8% 36.2%All students 57.5% 42.5%Full-time first degree undergraduates 54.7% 45.3%
Part-time first degree undergraduates 60.3% 39.7%
All first degree undergraduates 55.4% 44.6%Full-time other undergraduates 52.8% 47.2%Part-time other undergraduates 66.8% 33.2%All other undergraduates 64.1% 35.9%Full-time research postgraduates 45.9% 54.1%Part-time research postgraduates 50.4% 49.6%
All research postgraduates 46.8% 53.2%Full-time taught postgraduates 56.4% 43.6%Part-time taught postgraduates 62.6% 37.4%All taught postgraduates 58.6% 41.4%
Subjects
Of those studying SET subjects, a slightly higher proportion were female than male (50.6% compared with 49.4%).
Particularly high proportions of students were female in subjects allied to medicine (79.4%), veterinary science
325
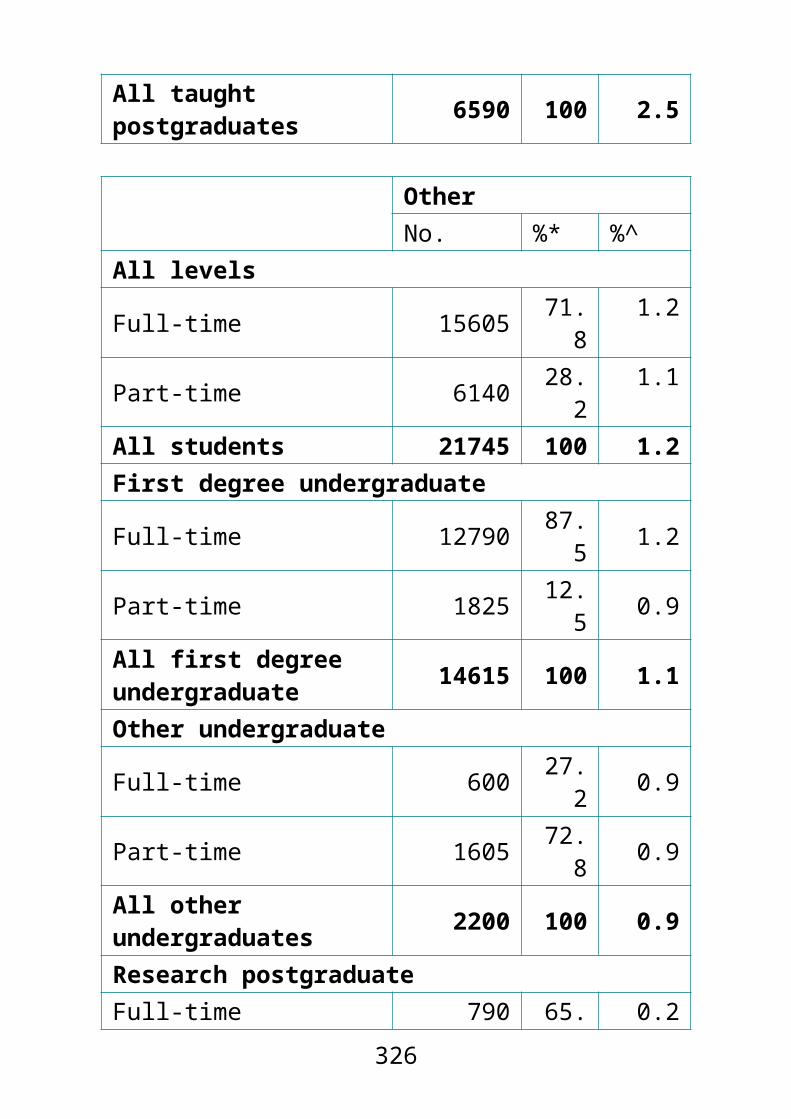
(75.5%), biological sciences (61.1%) and agriculture and related subjects (60.4%).
There were high proportions of men in engineering and technology (84.2%), computer science (82.6%) and architecture, building and planning (66.3%).
Women were in the majority for all non-SET subjects except for business and administrative studies where they made up49.0% of students. 76.1% of students studying education and 68.6% studying languages were women.
4.6 All students by subject area and gender
Female MaleNo. %* %^ No. %* %^
SETAgriculture and related subjects
11500 0.9 60.4 7525 0.7 39.6
Architecture, building, planning
17740 1.3 33.7 34945 3.4 66.3
Biological sciences 123135 9.4 61.1 78305 7.6 38.9
Computer sciences 15535 1.2 17.4 73955 7.2 82.6
Engineering and technology 24975 1.9 15.8 133115 13.0 84.2
Mathematical sciences 16340 1.2 38.7 25890 2.5 61.3
Medicine and dentistry 37460 2.8 56.1 29285 2.9 43.9
Physical 37115 2.8 39.9 55930 5.5 60.1
326
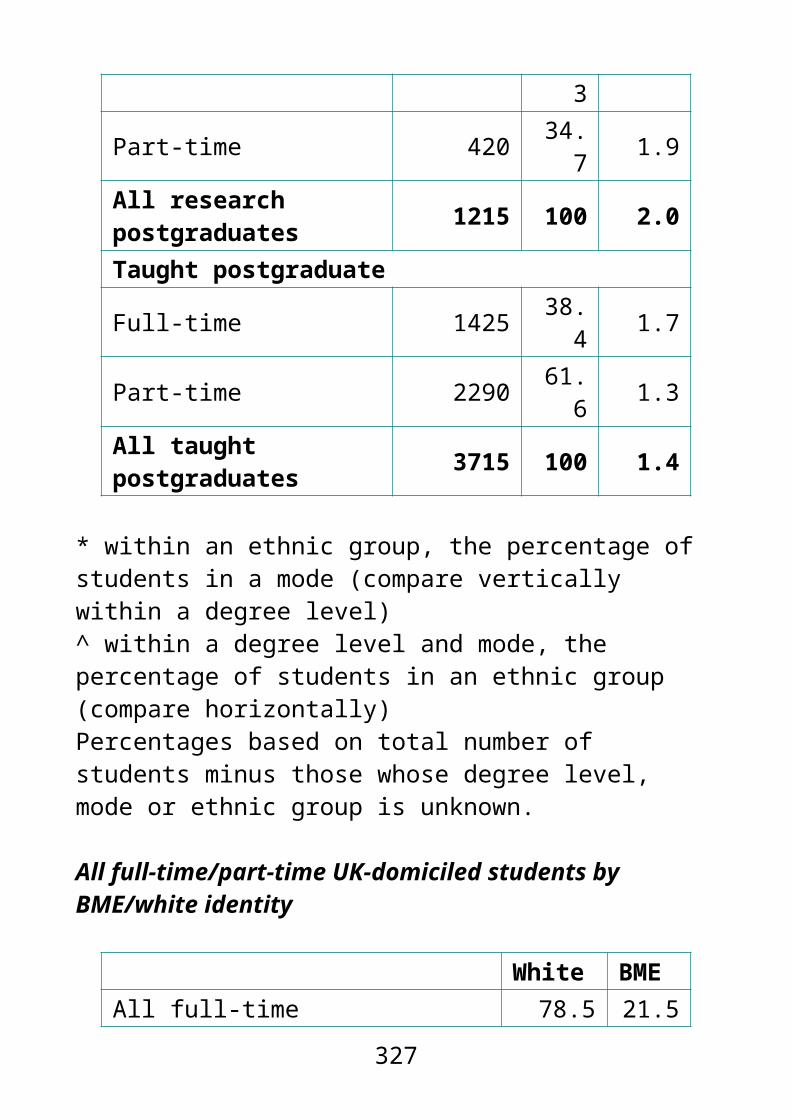
sciencesSubjects allied to medicine 222380 16.9 79.4 57555 5.6 20.6
Veterinary science 4350 0.3 75.5 1410 0.1 24.5
SET Total 510525 38.8 50.6 497920 48.6 49.4Non-SETBusiness, admin studies 165290 12.6 49.0 171940 16.8 51.0
Combined 44135 3.4 61.6 27545 2.7 38.4Creative arts and design 107655 8.2 62.3 65115 6.4 37.7
Education 136940 10.4 76.1 42970 4.2 23.9Historical and philosophical studies
49220 3.7 53.1 43435 4.2 46.9
Languages 85290 6.5 68.6 38950 3.8 31.4Law 53770 4.1 60.3 35410 3.5 39.7Mass comms and documentation
29400 2.2 58.3 21020 2.1 41.7
Social studies 432590 10.1 62.2 80730 7.9 37.8Non-SET total 804295 61.2 60.4 527110 51.4 39.6Total 1314820 100 56.2 1025030 100 43.8
* within a gender, the percentage of students in a subject area (compare vertically)^ within a subject area, the percentage of students who are female/male (compare horizontally)
Percentages based on total number of students minus those whose subject area or gender is unknown.
327

All students in subject areas by gender
Female MaleAgriculture and related subjects 60.4% 39.6%Architecture, building, planning 33.7% 66.3%Biological sciences 61.1% 38.9%Computer sciences 17.4% 82.6%Engineering and technology 15.8% 84.2%Mathematical sciences 38.7% 61.3%Medicine and dentistry 56.1% 43.9%Physical sciences 39.9% 60.1%Subjects allied to medicine 79.4% 20.6%Veterinary science 75.5% 24.5%SET Total 50.6% 49.4%Business, admin studies 49.0% 51.0%Combined 61.6% 38.4%Creative arts and design 62.3% 37.7%Education 76.1% 23.9%Historical and philosophical studies 53.1% 46.9%
Languages 68.6% 31.4%Law 60.3% 39.7%Mass comms and documentation 58.3% 41.7%
Social studies 62.2% 37.8%Non-SET total 60.4% 39.6%
The gender profile for first year students was generally similar to the profile of all students; however there were some differences at subject level.
For example, among those studying architecture, building and planning, the proportion of first year students who were
328

women was 2.4% higher than that of all students (36.1% and 33.7% respectively; see fig. 4.6).
Among those studying mass communications and documentation, the proportion of first year students who were men was 3.1% lower than that of all students (38.8% and 41.7% respectively; see fig. 4.6).
4.7 First year students by subject area and gender
Female MaleNo. %* %^ No. %* %^
SETAgriculture and related subjects
4800 0.9 57.9 3485 0.8 42.1
Architecture, building, planning
7155 1.3 36.1 12685 3.1 63.9
Biological sciences 45585 8.2 60.7 29475 7.1 39.3
Computer sciences 6225 1.1 18.2 28040 6.8 81.8
Engineering and technology 10305 1.8 16.6 51610 12.5 83.4
Mathematical sciences 5555 1.0 38.7 8785 2.1 61.3
Medicine and dentistry 11005 2.0 57.1 8265 2.0 42.9
Physical sciences 13100 2.3 40.3 19415 4.7 59.7
Subjects allied to medicine 101585 18.2 80.7 24265 5.9 19.3
Veterinary 1085 0.2 75.7 350 0.1 24.3
329
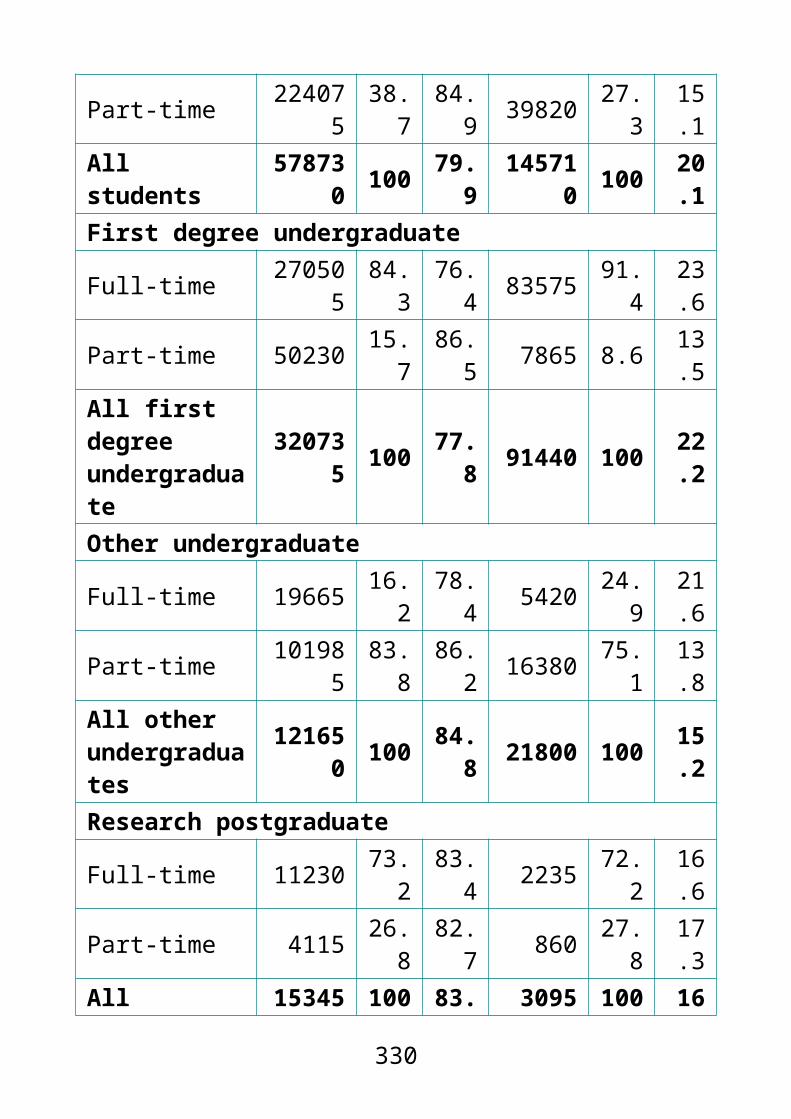
scienceSET Total 206395 36.9 52.5 186375 45.2 47.5Non-SETBusiness, admin studies 77285 13.8 50.3 76500 18.6 49.7
Combined 24760 4.4 61.7 15345 3.7 38.3Creative arts and design 40360 7.2 62.8 23930 5.8 37.2
Education 69380 12.4 74.3 24000 5.8 25.7Historical and philosophical studies
17350 3.1 54.0 14795 3.6 46.0
Languages 32875 5.9 66.7 16420 4.0 33.3Law 22475 4.0 59.4 15350 3.7 40.6Mass comms and documentation
12535 2.2 51.2 7935 1.9 38.8
Social studies 55275 9.9 63.5 31745 7.7 36.5Non-SET total 352295 63.1 60.9 226020 54.8 39.1Total 558690 100 57.5 412400 100 42.5
* within a gender, the percentage of students in a subject area (compare vertically)
^ within a subject area, the percentage of students who are female/male (compare horizontally)
Percentages based on total number of students minus those whose subject area or gender is unknown.
330

First year students in subject areas by gender
Female MaleAgriculture and related subjects 57.9% 42.1%Architecture, building, planning 36.15 63.9%Biological sciences 60.7% 39.3%Computer sciences 18.2% 81.8%Engineering and technology 16.6% 83.4%Mathematical sciences 38.7% 61.3%Medicine and dentistry 57.1% 42.9%Physical sciences 40.3% 59.7%Subjects allied to medicine 80.7% 19.3%Veterinary science 75.7% 24.3%SET Total 52.5% 47.5%Business, admin studies 50.3% 49.7%Combined 61.7% 38.3%Creative arts and design 62.8% 37.2%Education 74.3% 25.7%Historical and philosophical studies 54.0% 46.0%
Languages 66.7% 33.3%Law 59.4% 40.6%Mass comms and documentation 51.2% 38.8%
Social studies 63.5% 36.5%Non-SET total 60.9% 39.1%
Within SET subject areas, male students made up the majority of first degree undergraduates (51.7%) and research postgraduates (56.6%), while female students comprised the majority of other undergraduates (63.7%) and taught postgraduates (53.6%).
331

The SET subject with the largest gender gap across all degree levels was engineering and technology. The gender gap was particularly wide in this subject area among other undergraduates, where 90.9% of students were men and only 9.1% women. The proportions of non-SET students who were female were slightly higher at undergraduate levels (60.3% first undergraduate and 64.1% other undergraduate) than at postgraduate levels (51.9% postgraduate research and 60.0% postgraduate taught). However, across all degree levels the majority of students studying non-SET subjects overall were women.
4.8 All students by subject area, degree level and gender
First degree undergraduateFemale MaleNo. % No. %
SETAgriculture and related subjects 6145 66.5 3090 33.5
Architecture, building, planning 10780 32.1 22760 67.9
Biological sciences 95830 60.6 62300 39.4Computer sciences 10495 15.7 56500 84.3Engineering and technology 14830 14.3 89140 85.7
Mathematical sciences 14035 39.5 21470 60.5Medicine and dentistry 25545 55.5 20505 44.5Physical sciences 27845 39.8 42190 60.2Subjects allied to medicine 117705 79.3 30675 20.7Veterinary science 3715 76.7 1125 23.3SET Total 326915 48.3 349760 51.7Non-SET
332

Business, admin studies 98665 48.8 103600 51.2Combined 20915 60.4 13730 39.6Creative arts and design 87700 62.5 52705 37.5Education 52225 85.2 9100 14.8Historical and philosophical studies 36705 53.3 32200 46.7
Languages 64820 70.9 26550 29.1Law 40935 62.1 25015 37.9Mass comms and documentation 21900 56.5 16890 43.5
Social studies 90020 60.8 58040 39.2Non-SET total 513880 60.3 337835 39.7Total 840795 55.0 687595 45.0
Other undergraduateFemale MaleNo. % No. %
SETAgriculture and related subjects 3545 53.5 3085 46.5
Architecture, building, planning 1270 26.9 3460 73.1
Biological sciences 6080 56.3 4715 43.7Computer sciences 1150 19.2 4845 80.8Engineering and technology 1390 9.1 13865 90.9
Mathematical sciences 390 40.6 570 59.4Medicine and dentistry 430 75.9 135 24.1Physical sciences 1580 41.8 2205 58.2Subjects allied to medicine 61915 84.4 11405 15.6Veterinary science 45 87.0 5 13.0SET Total 77795 63.7 44300 36.3Non-SETBusiness, admin studies 15080 51.6 14125 48.4
333

Combined 22335 63.0 13090 37.0Creative arts and design 6415 61.6 3990 38.4Education 24730 76.2 7705 23.8Historical and philosophical studies 4180 62.3 2535 37.7
Languages 9935 58.3 7110 41.7Law 1585 61.5 995 38.5Mass comms and documentation 725 42.9 965 57.1
Social studies 13090 74.8 4400 25.2Non-SET total 98070 64.1 54915 35.9Total 175865 63.9 99215 36.1
Research postgraduateFemale MaleNo. % No. %
SETAgriculture and related subjects 520 56.6 400 43.4
Architecture, building, planning 780 39.6 1195 60.4
Biological sciences 7890 60.2 5210 39.8Computer sciences 1090 24.4 3375 75.6Engineering and technology 3160 23.4 10365 76.6
Mathematical sciences 765 28.5 1920 71.5Medicine and dentistry 4950 56.8 3755 43.2Physical sciences 4260 36.4 7440 63.6Subjects allied to medicine 4460 60.9 2860 39.1Veterinary science 215 64.2 120 35.8SET Total 28095 43.4 36645 56.6Non-SETBusiness, admin studies 2780 41.3 3955 58.7Combined 15 - 10 -
334

Creative arts and design 2055 52.3 1875 47.7Education 4485 65.3 2390 34.7Historical and philosophical studies 3285 44.2 4145 55.8
Languages 3680 60.3 2420 39.7Law 1105 48.2 1190 51.8Mass comms and documentation 585 50.8 565 49.2
Social studies 5045 51.3 4785 48.7Non-SET total 23035 51.9 21340 48.1Total 51130 46.9 57985 53.1
Taught postgraduateFemale MaleNo. % No. %
SETAgriculture and related subjects 1290 57.6 950 42.4
Architecture, building, planning 4910 39.5 7530 60.5
Biological sciences 13335 68.7 6075 31.3Computer sciences 2800 23.3 9235 76.7Engineering and technology 5595 22.1 19740 77.9
Mathematical sciences 1150 37.4 1925 62.6Medicine and dentistry 6540 57.2 4885 42.8Physical sciences 3430 45.6 4095 54.4Subjects allied to medicine 38295 75.2 12615 24.8Veterinary science 375 70.2 160 29.8SET Total 77720 53.6 67215 46.4Non-SETBusiness, admin studies 48765 49.2 50260 50.8Combined 870 55.1 710 44.9Creative arts and design 11490 63.7 6545 36.3
335

Education 55500 70.0 23775 30.0Historical and philosophical studies 5050 52.6 4550 47.4
Languages 6860 70.5 2870 29.5Law 10145 55.3 8210 44.7Mass comms and documentation 6190 70.4 2600 29.6
Social studies 24440 64.4 13500 35.6Non-SET total 169310 60.0 113025 40.0Total 247030 57.8 180235 42.2
.. Percentages based on totals of 52 or less are not shown.
Percentages based on total number of students minus those whose subject area, degree level or gender is unknown.
All students in SET subject areas and degree levels by gender
Female %
Male %
Agriculture and related subjects
1st degree UG 66.5 33.5Other UG 53.5 46.5
Research UG 56.6 43.4Taught UG 57.6 42.4
Architecture, building, planning
1st degree UG 32.1 67.9Other UG 26.9 73.1
Research UG 39.6 60.4Taught UG 39.5 60.5
Biological sciences
1st degree UG 60.6 39.4Other UG 56.3 43.7
Research UG 60.2 39.8Taught UG 68.7 31.3
Computer sciences 1st degree UG 15.7 84.3
336

Other UG 19.2 80.8Research UG 24.4 75.6
Taught UG 23.3 76.7
Engineering and technology
1st degree UG 14.3 85.7Other UG 9.1 90.9
Research UG 23.4 76.6Taught UG 22.1 77.9
Mathematical sciences
1st degree UG 39.5 60.5Other UG 40.6 59.4
Research UG 28.5 71.5Taught UG 37.4 62.6
Medicine and dentistry
1st degree UG 55.5 44.5Other UG 75.9 24.1
Research UG 56.8 43.2Taught UG 57.2 42.8
Physical sciences
1st degree UG 39.8 60.2Other UG 41.8 58.2
Research UG 36.4 63.6Taught UG 45.6 54.4
Subjects allied to medicine
1st degree UG 79.3 20.7Other UG 84.4 15.6
Research UG 60.9 39.1Taught UG 75.2 24.8
Veterinary science 1st degree UG 76.7 23.3Other UG 87.0 13.0
Research UG 64.2 35.8Taught UG 70.2 29.8
SET Total
1st degree UG 48.3 51.7Other UG 63.7 36.3
Research UG 43.4 56.6Taught UG 53.6 46.4
337

All students in non-SET subject areas and degree levels by gender
Female %
Male %
Business, admin studies
1st degree UG 48.8 51.2Other UG 51.6 48.4
Research UG 41.3 58.7Taught UG 49.2 50.8
Combined 1st degree UG 60.4 39.6Other UG 63.0 37.0
Research UG -Taught UG 55.1 44.9
Creative arts and design
1st degree UG 62.5 37.5Other UG 61.6 37.4
Research UG 52.3 47.7Taught UG 63.7 36.3
Education 1st degree UG 85.2 14.8Other UG 76.2 23.8
Research UG 65.3 34.7Taught UG 70.0 30.0
Historical and philosophical studies
1st degree UG 53.3 46.7Other UG 62.3 37.7
Research UG 44.2 55.8Taught UG 52.6 47.4
Languages 1st degree UG 70.9 29.1Other UG 58.3 41.7
Research UG 60.3 39.7Taught UG 70.5 29.5
Law 1st degree UG 62.1 37.9Other UG 61.5 38.5
Research UG 48.2 51.8Taught UG 55.3 44.7
Mass comms and 1st degree UG 56.5 43.5
338

documentation Other UG 42.9 57.1Research UG 50.8 49.2
Taught UG 70.4 29.6Social studies 1st degree UG 60.8 39.2
Other UG 74.8 25.2Research UG 51.3 48.7
Taught UG 64.4 35.6Non-SET total 1st degree UG 60.3 39.7
Other UG 64.1 35.9Research UG 51.9 48.1
Taught UG 60.0 40.0
.. percentages based on totals of 52 or less are not shown
34.5% of first year other undergraduates studying mathematical sciences were women compared with 40.6% of other undergraduates across all years in this subject (a 6.1% difference; see fig. 4.8).
46.5% of first year other undergraduates studying mass communications and documentation were women compared with 42.9% of other undergraduates across all years in this subject (a 3.6% difference; see fig. 4.8).
339

4.9 First year students by subject area, degree level and gender
First degree undergraduateFemale MaleNo. % No. %
SETAgriculture and related subjects 1980 68.3 920 31.7
Architecture, building, planning 3410 34.3 6520 65.7
Biological sciences 31090 59.4 21265 40.6Computer sciences 3435 15.4 18895 84.6Engineering and technology 4590 14.2 27780 85.8
Mathematical sciences 4265 39.6 6505 60.4Medicine and dentistry 5210 54.5 4355 45.5Physical sciences 8395 39.7 12750 60.3Subjects allied to medicine 42195 8039 9940 19.1Veterinary science 815 77.4 240 22.6SET Total 105390 49.1 109165 50.9Non-SETBusiness, admin studies 35535 48.5 37790 51.5Combined 5820 58.8 4080 41.2Creative arts and design 29140 62.6 17400 37.4Education 18490 85.6 3105 14.4Historical and philosophical studies 10755 53.7 9275 46.3
Languages 18405 71.0 7525 29.0Law 13775 61.7 8535 38.3Mass comms and documentation 7845 57.5 5525 42.5
Social studies 29780 62.0 18285 38.0Non-SET total 169190 60.3 111515 39.7
340

Total 274580 55.4 220680 44.6
Other undergraduateFemale MaleNo. % No. %
SETAgriculture and related subjects 1870 49.8 1890 50.2
Architecture, building, planning 500 24.9 1515 75.1
Biological sciences 3950 59.2 2730 40.8Computer sciences 635 20.2 2500 79.8Engineering and technology 830 9.4 7990 90.6
Mathematical sciences 130 34.5 250 65.5Medicine and dentistry 220 77.5 65 22.5Physical sciences 835 38.6 1325 61.4Subjects allied to medicine 36265 84.3 6730 15.7Veterinary science 20 - 5 -SET Total 45260 64.4 24995 35.6Non-SETBusiness, admin studies 8330 54.0 7100 46.0Combined 18195 63.1 10640 36.9Creative arts and design 3220 62.0 1975 38.0Education 13955 73.4 5055 26.6Historical and philosophical studies 2365 62.4 1425 37.6
Languages 8390 57.8 6130 42.2Law 1090 61.0 700 39.0Mass comms and documentation 375 46.5 430 53.5
Social studies 8165 74.4 2815 25.6Non-SET total 64090 63.9 36270 36.1Total 109350 64.1 61265 35.9
341

Research postgraduateFemale MaleNo. % No. %
SETAgriculture and related subjects 165 586 120 41.4
Architecture, building, planning 275 42.6 370 57.4
Biological sciences 2540 59.8 1710 40.2Computer sciences 340 23.5 1100 76.5Engineering and technology 1050 24.1 3315 75.9
Mathematical sciences 235 26.0 675 74.0Medicine and dentistry 1535 56.9 1165 43.1Physical sciences 1405 36.7 2420 63.3Subjects allied to medicine 1390 58.7 975 41.3Veterinary science 75 65.2 40 34.8SET Total 9010 43.1 11890 56.9Non-SETBusiness, admin studies 870 42.9 1155 57.1Combined 5 - 5 -Creative arts and design 595 52.4 540 47.6Education 1260 67.9 595 32.1Historical and philosophical studies 1025 43.7 1325 56.3
Languages 1270 60.9 820 39.1Law 350 50.3 345 49.7Mass comms and documentation 185 50.8 180 49.2
Social studies 1585 50.6 1545 49.4Non-SET total 7150 52.3 6520 47.7Total 16165 46.8 18405 53.2
342
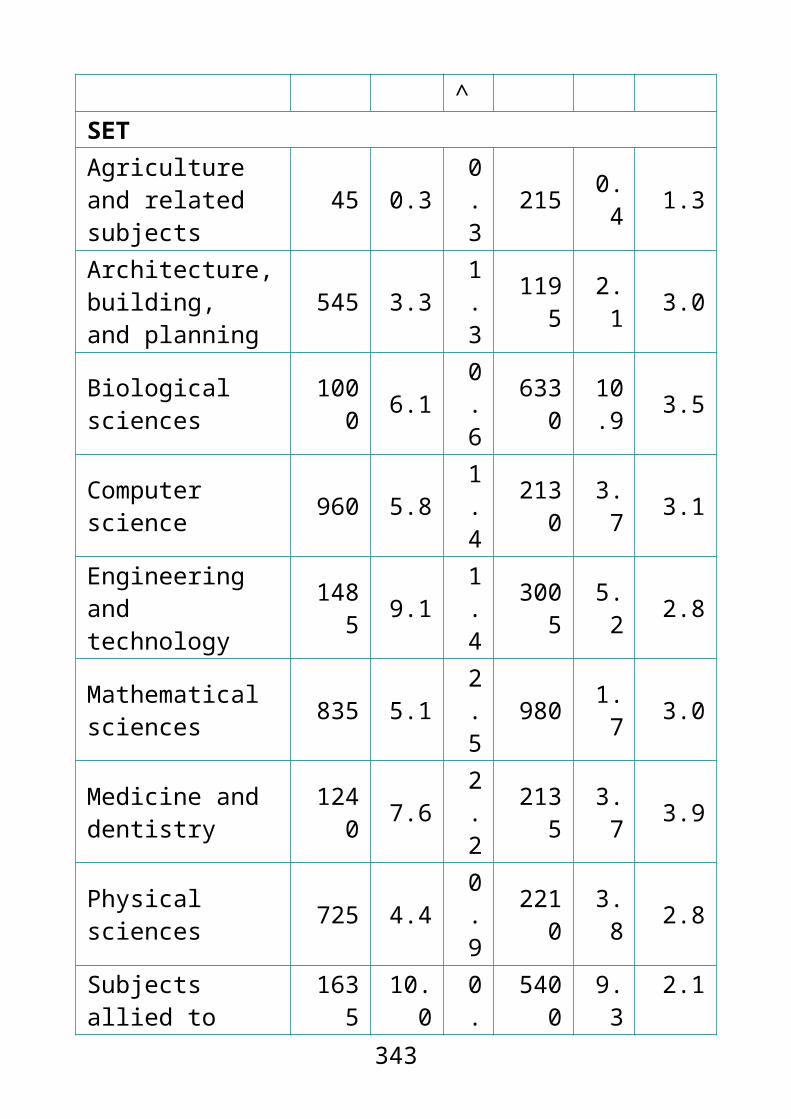
Taught postgraduateFemale MaleNo. % No. %
SETAgriculture and related subjects 780 58.3 560 41.7
Architecture, building, planning 2970 41.0 4285 59.0
Biological sciences 8000 68.0 3770 32.0Computer sciences 1815 24.7 5545 75.3Engineering and technology 3830 23.4 12525 76.6
Mathematical sciences 925 40.5 1360 59.5Medicine and dentistry 4040 60.1 2685 39.9Physical sciences 2465 45.8 2920 54.2Subjects allied to medicine 21730 76.7 6615 23.3Veterinary science 175 72.2 65 27.8SET Total 46735 53.7 40325 46.3Non-SETBusiness, admin studies 32550 51.7 30455 48.3Combined 740 54.4 620 45.6Creative arts and design 7405 64.9 4010 35.1Education 35675 70.1 15240 29.9Historical and philosophical studies 3205 53.6 2775 46.4
Languages 4805 71.2 1945 28.8Law 7255 55.7 5775 44.3Mass comms and documentation 4485 71.4 1800 28.6
Social studies 15745 63.4 9100 26.6Non-SET total 111865 60.9 71720 39.1Total 158600 58.6 112405 41.4
.. Percentages based on totals of 52 or less are not shown.
343

Percentages based on total number of students minus those whose subject area, degree level or gender is unknown.
Continuation
Entrants refers to full-time first degree UK-domiciled 2011/12 entrants. Continuation data indicates the progress of these entrants to 2012/13.
A higher proportion of female entrants continued or qualified in 2012/13 than male entrants (92.3% to 90.3% respectively), a difference of 2.0%.
A higher proportion of male entrants (7.7%) than female entrants (5.9%) were no longer in higher education, a difference of 1.8%.
4.10 UK-domiciled full-time first degree entrants by continuation category and gender
Continue or qualify
Transfer No longer in HE
No. % No. % No. %Female 197425 92.3 3840 1.8 12700 5.9Male 158050 90.3 3515 2.0 13385 7.7Total 355475 91.4 7350 1.9 26085 6.7
UK-domiciled female/male full-time first degree entrants by continuation category
Female MaleContinue or qualify 92.3 90.3Transfer 1.8 2.0
344

No longer in HE 5.9 7.7
Degree attainment
Qualifiers refers to first degree undergraduate qualifiers. The gender degree attainment gap is calculated: % male first/2:1 – % female first/2:1.
Across the UK there was a negative degree attainment gap with a higher proportion of female qualifiers receiving a first/2:1 than male qualifiers. The gaps are as follows:Wales -8.2%, Northern Ireland -4.9%, England -4.6% and Scotland -4.2%.
Compared with 2011/12, the negative gender degree attainment gap has widened in Wales (-6.1% in 2011/12) and Northern Ireland (-2.9%) [see fig. 1.11, ECU (2013)].
4.11 First degree undergraduate qualifiers by country of institution, degree class and gender
First 2:1No. % No. %
EnglandFemale 33650 18.5 93185 51.3Male 26450 18.6 66110 46.6Total 60100 18.6 159295 49.2Northern IrelandFemale 850 16.7 2765 54.2Male 595 17.1 1710 48.9Total 1445 16.8 4475 52.1ScotlandFemale 2475 17.8 7855 56.5Male 2165 19.8 5500 50.3
345

Total 4640 18.7 13355 53.7WalesFemale 1950 16.4 5975 50.3Male 1480 15.1 4245 43.4Total 3430 15.8 10220 47.2
2:2 Third/passNo. % No. %
EnglandFemale 44500 24.5 10285 5.7Male 38835 27.4 10430 7.4Total 83335 25.8 20715 6.4Northern IrelandFemale 1310 25.7 175 3.4Male 990 28.4 195 5.6Total 2305 26.8 370 4.3ScotlandFemale 3150 22.7 425 3.1Male 2735 25.0 545 5.0Total 5885 23.7 975 3.9WalesFemale 3350 28.2 595 5.0Male 3265 33.3 805 8.2Total 6615 30.5 1400 6.5
Percentages based on total number of students minus those whose country of institution, degree class or gender is unknown.
Female/male first degree undergraduate qualifiers in countries of institution by degree class
First 2:1 2:1 Third/passEngland
346

Female 18.5% 51.3% 24.5% 5.7%Male 18.6% 46.6% 27.4% 7.4%Northern IrelandFemale 16.7% 54.2% 25.7% *%Male 17.1% 48.9% 28.4% 5.6%ScotlandFemale 17.8% 56.5% 22.7%Male 19.8% 50.3% 25.0% 5.0%WalesFemale 16.4% 50.3% 28.2% 5.0%Male 15.1% 43.4% 33.3% 8.2%
* values less than 5.0 are not displayed
Overall, a slightly higher proportion of male SET qualifiers received a first than female SET qualifiers (22.1% compared with 21.5%).
This represents a small increase in the proportions of male (21.0%) and female (19.9%) SET qualifiers receiving a first in 2011/12, and a narrowing of the gap between the two [see fig. 1.12, ECU (2013)].
The most notable exception to this was in agriculture and related subjects, where 19.0% of female qualifiers received a first, compared with 12.8% of male qualifiers.
The inverse was true of non-SET qualifiers, with a higher proportion of women receiving a first. The difference in the proportions of female and male qualifiers receiving a first was largest within business and administrative studies where 18.2% of female qualifiers achieved a first, compared with 13.2% of male qualifiers (a difference of 5.0%).
347

However, in some non-SET areas a higher proportion of male qualifiers achieved a first than female qualifiers.
4.12 First degree undergraduate qualifiers by subject area, degree class and gender
FirstFemale MaleNo. % No. %
SETAgriculture and related subjects 335 19.0 115 12.8
Architecture, building, planning 545 18.4 1155 17.4
Biological sciences 4095 17.8 2115 14.0Computer sciences 605 23.5 2965 24.2Engineering and technology 1135 31.1 5160 26.4
Mathematical sciences 1200 35.0 1595 33.3Medicine and dentistry 365 40.3 250 35.5Physical sciences 1555 23.5 2200 23.4Subjects allied to medicine 5870 21.0 1375 19.5Veterinary science 5 - 0 -SET Total 15705 21.5 16935 22.1Non-SETBusiness, admin studies 5375 18.2 3820 13.2Combined 305 16.4 170 16.0Creative arts and design 4765 18.5 2915 19.3Education 2380 15.7 335 14.4Historical and philosophical studies 1695 18.1 1405 16.4
Languages 3080 18.3 1285 19.2Law 1195 11.1 655 10.3Mass comms and 940 14.7 685 13.5
348

documentationSocial studies 3485 14.5 2485 16.1Non-SET total 23220 16.6 13755 15.4Total 38925 18.3 30690 18.5
2:1Female MaleNo. % No. %
SETAgriculture and related subjects 850 48.0 380 42.6
Architecture, building, planning 1440 48.5 3265 49.1
Biological sciences 12685 55.1 6895 45.6Computer sciences 1060 41.2 4625 37.7Engineering and technology 1605 43.9 8060 41.2
Mathematical sciences 1245 36.3 1685 35.2Medicine and dentistry 470 52.1 375 53.8Physical sciences 3270 49.3 4120 43.7Subjects allied to medicine 12725 45.4 3245 46.0Veterinary science 35 - 5 -SET Total 35375 48.5 32645 42.7Non-SETBusiness, admin studies 13760 46.6 12290 42.3Combined 840 45.0 470 44.2Creative arts and design 13375 52.1 7340 48.7Education 7460 49.3 1070 46.2Historical and philosophical studies 6025 64.2 5350 62.4
Languages 10600 63.0 3905 58.2Law 6030 56.3 3350 52.9Mass comms and documentation 3660 57.3 2710 53.4
349

Social studies 12650 52.8 8430 54.7Non-SET total 74400 53.3 44920 50.1Total 109775 51.7 77565 46.7
2:2Female MaleNo. % No. %
SETAgriculture and related subjects 490 27.6 315 35.2
Architecture, building, planning 760 25.7 1745 26.3
Biological sciences 5325 23.1 4945 32.7Computer sciences 695 27.0 3350 27.3Engineering and technology 745 20.5 4930 25.2
Mathematical sciences 760 22.2 1095 22.9Medicine and dentistry 40 4.7 60 8.8Physical sciences 1505 22.7 2505 26.6Subjects allied to medicine 7270 26.0 1905 27.0Veterinary science 10 - 5 -SET Total 17605 24.1 20855 27.3Non-SETBusiness, admin studies 8370 28.4 10135 34.9Combined 510 27.4 290 27.4Creative arts and design 6220 24.2 3845 25.5Education 4360 28.8 755 32.4Historical and philosophical studies 1460 15.6 1570 18.3
Languages 2800 16.6 1315 19.6Law 2975 27.7 1915 30.3Mass comms and documentation 1550 24.2 1420 28.0
Social studies 6465 27.0 3725 24.1
350
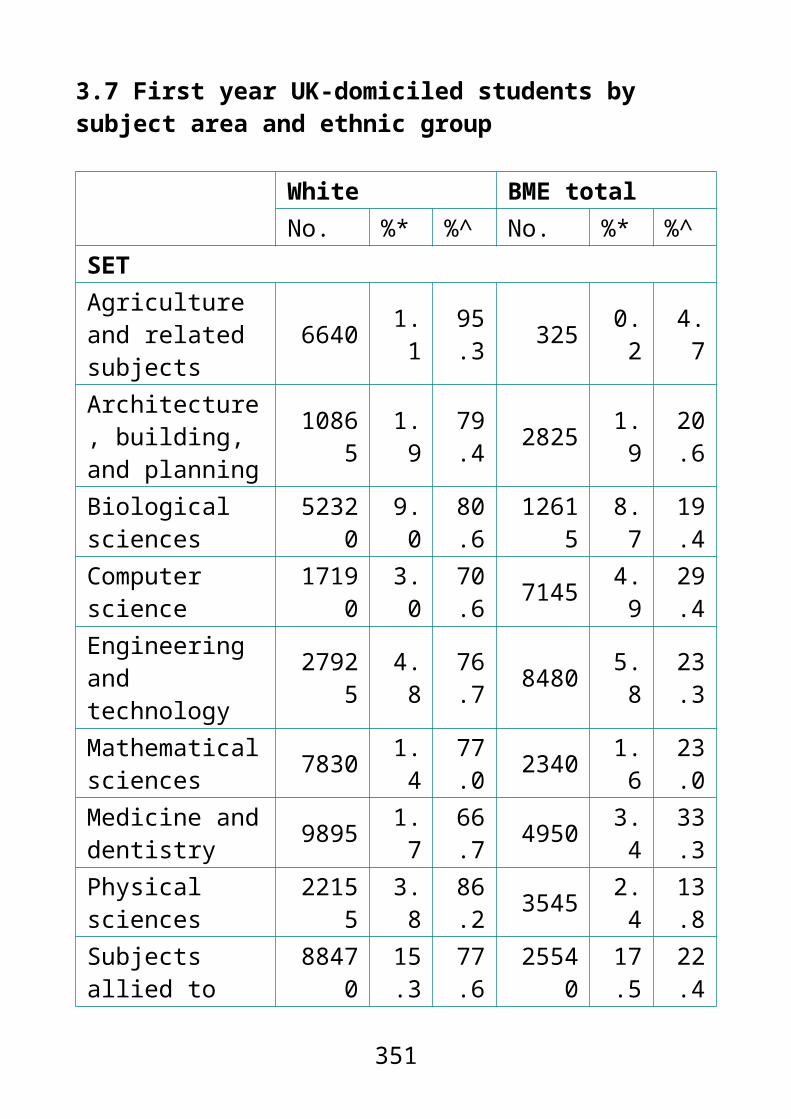
Non-SET total 34705 24.9 24970 27.9Total 52310 24.6 45825 27.6
Third/passFemale MaleNo. % No. %
SETAgriculture and related subjects 95 5.3 85 9.
Architecture, building, planning 220 7.3 480 7.2
Biological sciences 915 4.0 1155 7.6Computer sciences 210 8.2 1330 10.8Engineering and technology 165 4.5 1425 7.3
Mathematical sciences 225 6.5 410 8.5Medicine and dentistry 25 3.0 15 1.9Physical sciences 305 4.6 595 6.3Subjects allied to medicine 2140 7.6 525 7.5Veterinary science 0 - 0 -SET Total 4300 5.9 6015 7.9Non-SETBusiness, admin studies 2015 6.8 2800 9.6Combined 210 11.2 130 12.4Creative arts and design 1335 5.2 980 6.5Education 940 6.2 160 7.0Historical and philosophical studies 200 2.1 240 2.8
Languages 355 2.1 200 3.0Law 515 4.8 410 6.5Mass comms and documentation 240 3.7 260 5.1
Social studies 1375 5.7 780 5.1Non-SET total 7180 5.1 5960 6.7
351
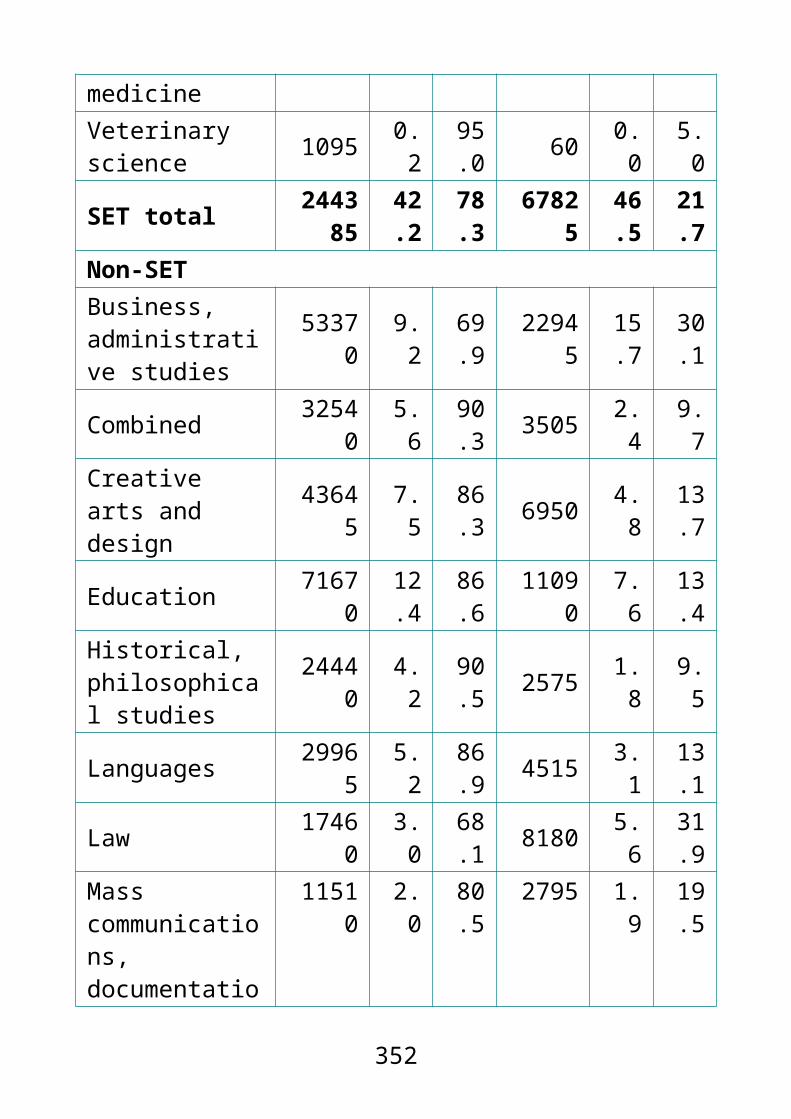
Total 11480 5.4 11975 7.2
.. Percentages based on totals of 52 or less are not shown.
Percentages based on total number of students minus those whose subject area, degree class or gender is unknown.
Female/male first degree undergraduate qualifiers in SET subject areas by degree class
First 2:1 2:2 Third/passAgriculture and related subjects
Female 19.0% 48.0% 27.6% 5.3%Male 12.8% 42.6% 35.2% 9.4%
Architecture, building, planning
Female 18.4% 48.5% 25.7% 7.3%Male 17.4% 49.1% 26.3% 7.2%
Biological sciences
Female 17.8% 55.1% 23.1% *Male 14.0% 45.6% 32.7% 7.6%
Computer sciences
Female 23.5% 41.2% 27.0% 8.2%Male 24.2% 37.7% 27.3% 10.8%
Engineering and technology
Female 31.1% 43.9% 20.5%Male 26.4% 41.2% 25.2% 7.3%
Mathematical sciences
Female 35.0% 36.3% 22.2% 6.5%Male 33.3% 35.2% 22.9% 8.5%
Medicine and dentistry
Female 40.3% 52.1%Male 35.5% 53.8% 8.8%
Physical sciences Female 23.5% 49.3% 22.7%Male 23.4% 43.7% 26.6% 6.3%
Subjects allied to medicine
Female 21.0% 45.4% 26.0% 7.6%Male 19.5% 46.0% 27.0% 7.5%
Veterinary science
Female - - - -Male - - - -
SET Total Female 21.5% 48.5% 24.1% 5.9%Male 22.1% 42.7% 27.3% 7.9%
352

* values less than 5.0 are not displayed
.. percentages based on totals of 52 or less are not shown
Female/male first degree undergraduate qualifiers in non-SET subject areas by degree class
First 2:1 2:2 Third/pass
Business, admin studies
Female 18.2% 46.6% 28.4% 6.8%
Male 13.2% 42.3% 34.9% 9.6%
Combined
Female 16.4% 45.0% 27.4% 11.2%
Male 16.0% 44.2% 27.4% 12.4%
Creative arts and design
Female 18.5% 52.1% 24.2% 5.2%
Male 19.3% 48.7% 25.5% 6.5%
Education
Female 15.7% 49.3% 28.8% 6.2%
Male 14.4% 46.2% 32.4% 7.0%
Historical and philosophical studies
Female 18.1% 64.2% 15.6% *
Male 16.4% 62.4% 18.3%
Languages
Female 18.3% 63.0% 16.6%
Male 19.2% 58.2% 19.6%
Law Female 11.1% 56.3%
27.7%
353
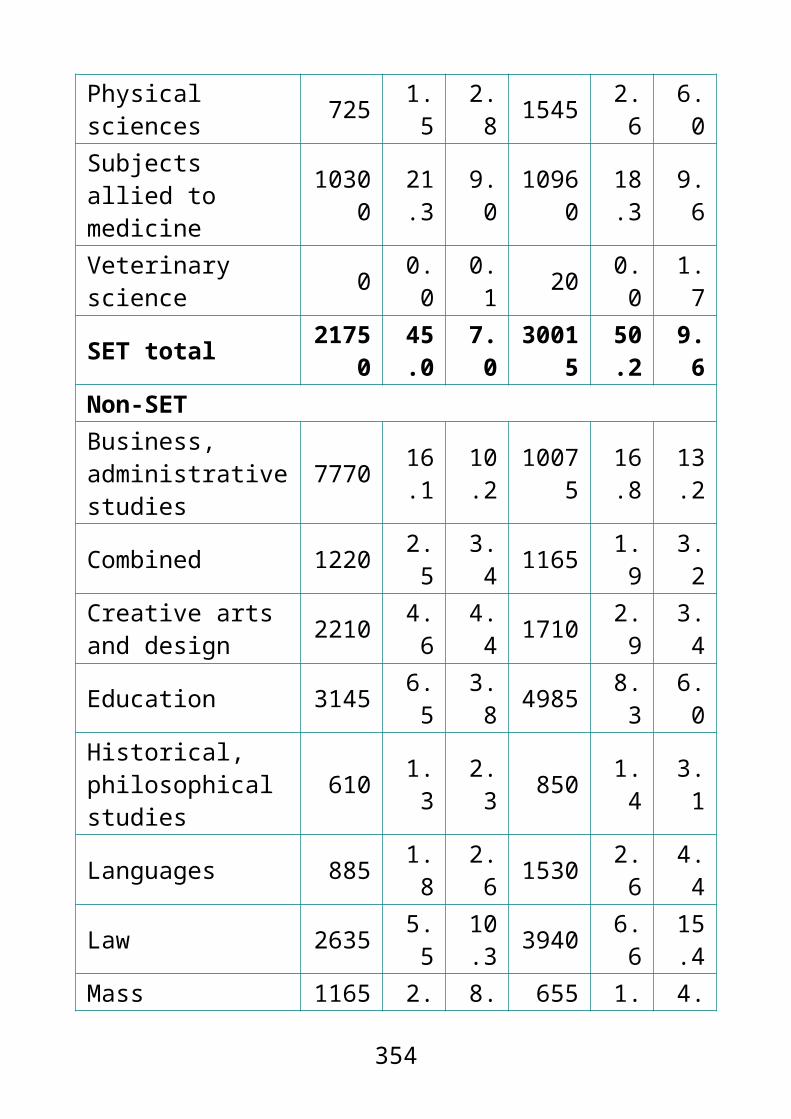
Male 10.3% 52.9% 30.3% 6.5%
Mass comms and documentation
Female 14.7% 57.3% 24.2%
Male 13.5% 53.4% 28.0% 5.1%
Social studies
Female 14.5% 52.8% 27.0% 5.7%
Male 16.1% 54.7% 24.1% 5.1%
Non-SET totalFemale 16.6% 53.3
% 24.9% 5.1%
Male 15.4% 50.1% 27.9% 6.7%
* values less than 5.0 are not displayed
354

Destination of leavers
Leavers refers to students who responded to the DLHE survey six months after qualifying.
Although similar proportions of male and female leavers were in full-time work, a higher proportion of men were in professional full-time work than women (47.3% compared with 45.0%).
There were higher rates of nonprofessional full-time work and part-time work among women than men.
A higher proportion of male leavers (12.9%) than female leavers (10.6%) went on to fulltime study.
4.13 DLHE leavers by leaving destination and gender
Female MaleNo. % No. %
Full-time work total 141815 57.1 102940 57.4Professional full-time work 111930 45.0 84825 47.3Non-professional full-time work 29595 11.9 17825 10.0
Unknown full-time work 290 0.1 265 0.1Part-time work 34680 14.0 18580 10.4Work and further study 17970 7.2 11175 6.2Full-time study 16440 10.6 23075 12.9Part-time study 3270 1.3 2150 1.2Unemployed 13140 5.3 14325 8.0Other 11155 4.5 7120 4.0Total 248470 100 179365 100
355

Percentages based on total number of leavers minus those whose leaving destination or gender is unknown.
Female/male DLHE leavers by leaving destination
Female MaleFull-time work total 57.1 57.4Other dest’s 42.9 42.6Professional full-time work 45.0 47.3Non-professional full-time work 11.9 10.0
Unknown full-time work 0.1 0.1Part-time work 14.0 10.4Work and further study 7.2 6.2Full-time study 10.6 12.9Part-time study 1.3 1.2Unemployed 5.3 8.0Other 4.5 4.0
356

5 Multiple identities
77.0% of students who disclosed a social communication/autistic spectrum disorder and 63.4% of students with a specific learning difficulty were aged 21 and under.
Male students had a younger age profile than female students:
72.3% of male students were aged 25 and under, compared with 67.0% of female students.
Among UK-domiciled students, a higher proportion of white students disclosed as disabled (11.6%) than BME students (8.4%).
9.7% of female students disclosed as disabled compared with 9.1% of male students.
20.5% of male UK-domiciled students were from BME backgrounds, compared with 19.0% of female UK-domiciled students.
The disability degree attainment gap was largest for first degree qualifiers aged 36 and over, where 62.8% of non-disabled first degree qualifiers received a first/2:1 compared with 56.9% of disabled first degree qualifiers (a 5.9% gap).
The ethnicity degree attainment gap between age groups was lowest for first degree qualifiers aged 21 and under (7.5%) and highest for first degree qualifiers aged 36 and over (24.3%).
Among those aged 21 and under, 75.0% of female first degree qualifiers and 68.8% of male first degree qualifiers received a first/2:1.
The disability degree attainment gap was larger among female first degree qualifiers than among male first degree qualifiers. 67.2% of disabled female first degree qualifiers received a first/2:1 compared with 70.3% of
357

non-disabled female first degree qualifiers (a 3.1% gap). In comparison, 64.3% of disabled male first degree qualifiers received a first/2:1 compared with 65.3% of non-disabled male first degree qualifiers (a 1.0% gap).
In all UK-domiciled ethnic groups, a higher proportion of female first degree qualifiers received a first/2:1 than male first degree qualifiers. This gender degree attainment gap was largest among UK-domiciled Chinese first degree qualifiers where 66.6% of women and 60.9% of men received a first/2:1.
The ethnicity degree attainment gap was largest between UK-domiciled white male first degree qualifiers (71.2%) and UK-domiciled black male first degree qualifiers (44.1%), with a gap of 27.1%.
Age and disability
This table refers to students’ age on entry and those who disclosed as disabled (disabled) and did not disclose as disabled or whose disability status was unknown (non-disabled).
A higher proportion of students aged 36 and over disclosed as disabled than students in any other age group (10.6%). Students aged 36 and over comprised 33.6% of students who were deaf or had a serious hearing impairment and 36.9% of those with two or more impairments.
Some impairment types had a particularly young age profile. For example, 77.0% of students who disclosed a social communication/autistic spectrum disorder and 63.4% of students with a specific learning difficulty were aged 21 and under.
358

5.1 All students by disability status, impairment type and age group
359

360
21 and under 22-25No. %* %^ No. %* %^
Disabled 120120 9.6 54.
3 30170 8.3 13.6
Blind/serious visual impairment 1560 1.3 46.
8 435 1.4 13.1
Deaf/serious hearing impairment
2320 1.9 40.7 620 2.1 10.
9
Long-standing illness or health condition
12150 10.1
52.4 2815 9.3 12.
1
Mental health condition 11935 9.9 48.
5 3895 12.9
15.8
Personal care support 0 0.0 - 0 0.0 -
Physical impairment/mobility issues
3145 2.6 40.8 840 2.8 10.
9
Social comm./autistic spectrum disorder
3930 3.3 77.0 625 2.1 12.
3
Specific learning difficulty 67970 56.
663.
4 15630 51.8
14.6
Two or more impairments 5920 4.9 31.
1 2185 7.2 11.5
Other impairment 11190 9.3 44.4 3125 10.
412.
4
Non-disabled 1136915
90.4
53.7
334370
91.7
15.8
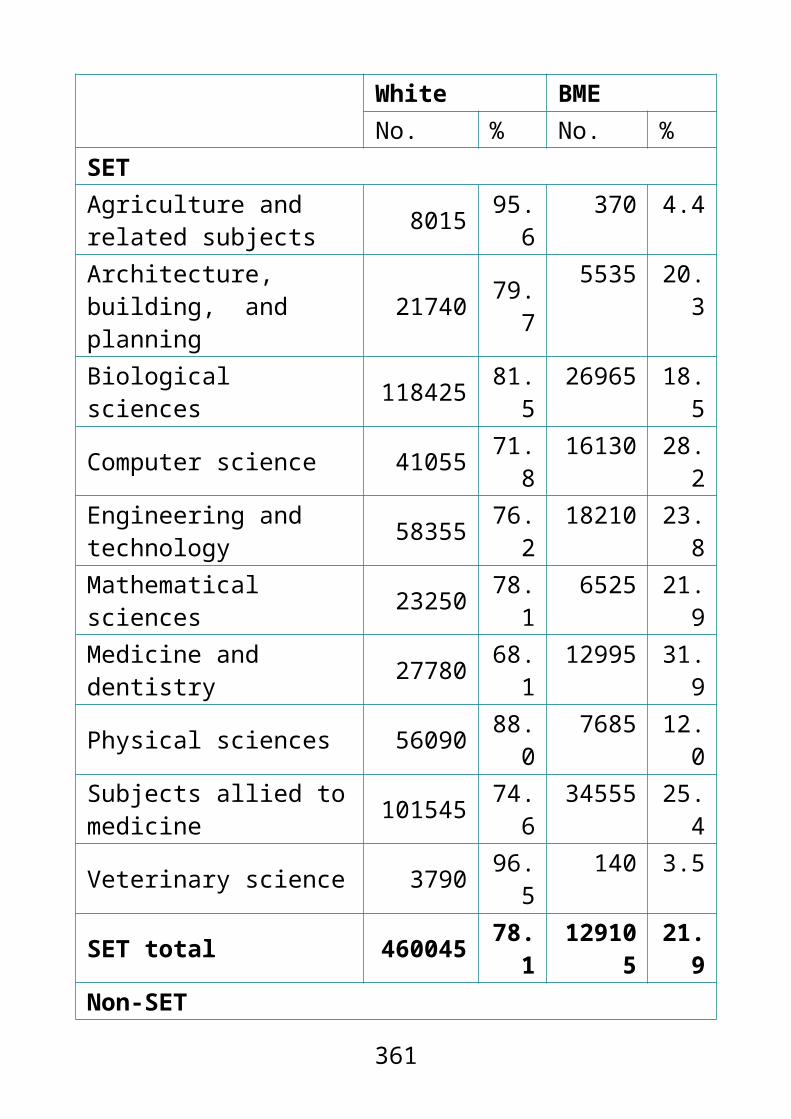
* within an age group, the percentage of students in a disability status and impairment type (compare vertically)
361
26-35 36 and overNo. %* %^ No. %* %^
Disabled 34280 9.2 15.5 36590 10.
616.
5Blind/serious visual impairment 530 1.5 15.
8 810 2.2 24.3
Deaf/serious hearing impairment 840 2.5 14.
8 1910 5.2 33.6
Long-standing illness or health condition
3420 10.0
14.7 4815 13.
220.
8
Mental health condition 4870 14.
219.
8 3935 10.8
16.0
Personal care support 0 0.0 - 0 0.0 -
Physical impairment/mobility issues
1240 3.6 16.1 2480 6.8 32.
2
Social comm./autistic spectrum disorder
335 1.0 6.6 210 0.6 4.1
Specific learning difficulty 14670 42.
813.
7 8965 24.5 8.4
Two or more impairments 3910 11.
420.
5 7035 19.2
36.9
Other impairment 4470 13.0
17.7 6425 17.
625.
5
Non-disabled 339935
90.8
16.0
307285
89.4
14.5
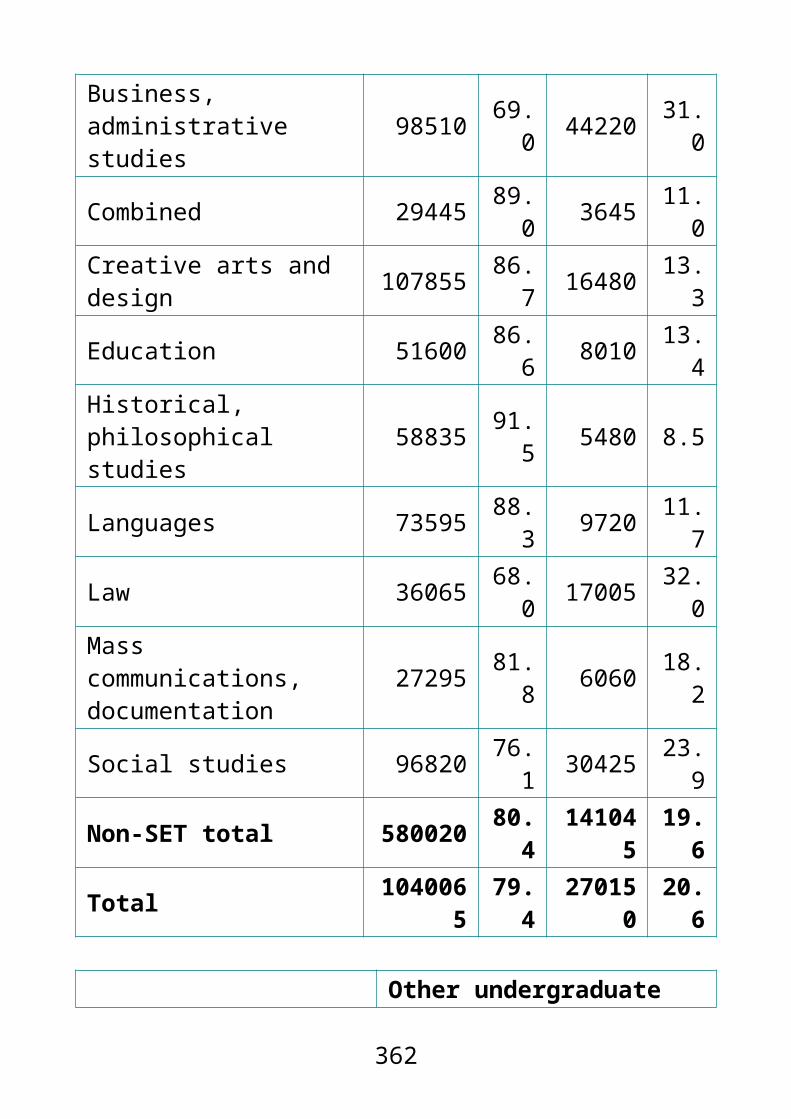
^ within a disability status and impairment type, the percentage of students in an age group (compare horizontally)
.. Percentages based on totals of 52 or less are not shown.Percentages based on total number of students minus those whose impairment type or age group is unknown.
362

Disabled students in impairment types by age group
21 and under
22-25 26-35 36 and over
Blind/serious visual impairment
46.8% 13.1% 15.8% 24.3%
Deaf/serious hearing impairment
40.7% 10.9% 14.8% 33.6%
Long-standing illness or health condition
52.4% 12.1% 14.7% 20.8%
Mental health condition 48.5% 15.8% 19.8% 16.0%Personal care support .. .. .. ..Physical impairment/mobility issues
40.8% 10.9% 16.1% 32.2%
Social comm./autistic spectrum disorder
77.0% 12.3% 6.6% *
Specific learning difficulty
63.4% 14.6% 13.7% 8.4%
Two or more impairments
31.1% 11.5% 20.5% 36.9%
Other impairment 44.4% 12.4% 17.7% 25.5%
Disabled students in age groups by impairment type
21 and under
22-25 26-35 36 and over
Blind/serious visual impairment
1.3 1.4 1.5 2.2
Deaf/serious hearing impairment
1.9 2.1 2.5 5.2
Long-standing illness or health condition
10.1 9.3 10.0 13.2
Mental health condition 9.9 12.9 14.2 10.8
363

Physical impairment/mobility issues
2.6 2.8 3.6 6.8
Social comm./autistic spectrum disorder
3.3 2.1 1.0 0.6
Specific learning difficulty
56.6 51.8 42.8 24.5
Two or more impairments
4.9 7.2 11.4 19.2
Other impairment 9.3 10.4 13.0 17.6
Age and ethnicity
This table refers to UK-domiciled students’ age on entry and ethnic group.
BME students had a younger age profile than white students, with 70.3% aged 25 and under compared with 67.9% of white students. This was particularly the case forChinese (80.2% aged 25 and under) and Asian (78.9%) students. In contrast, 55.1% of black students were aged 25 and under.
5.2 UK-domiciled students by age group and ethnic group
364

365
White BME totalNo. %* %^ No. %* %^
21 and under 841985 55.9
79.5
216845
58.9
20.5
22-25 181235 12.0
81.2 42050 11.
418.
826-35 228075 15.
179.
7 58175 15.8
20.3
36 and over 256170 17.0
83.3 51220 13.
916.
7Total 150747
0 100 80.4
368295 100 19.
6
Black AsianNo. %* %^ No. %* %^
21 and under 51700 44.0 4.9 10606
068.
410.
022-25 12975 11.
1 5.8 16340 10.5 7.3
26-35 24370 20.8 8.5 19440 12.
5 6.8
36 and over 28365 24.2 9.2 13155 8.5 4.3
Total 117410 100 6.3 15499
5 100 8.3

* within an ethnic group, the percentage of students in an age group (compare vertically)
^ within an age group, the percentage of students in an ethnic group (compare horizontally)Percentages based on total number of students minus those whose age group or ethnic group is unknown.
366
Chinese MixedNo. %* %^ No. %* %^
21 and under 10570 64.5 1.0 37045 64.
1 3.5
22-25 2575 15.7 1.2 7485 12.
9 3.4
26-35 2025 12.4 0.7 8150 14.
1 2.8
36 and over 1205 7.4 0.4 5140 8.9 1.7Total 16375 100 0.9 57820 100 3.1
OtherNo. %* %^
21 and under 11470 52.9 1.1
22-25 2680 12.3 1.2
26-35 4195 19.3 1.5
36 and over 3355 15.5 1.1
Total 21695 100 1.2

UK-domiciled students in ethnic groups by age group
21 and under
22-25 26-35 36 and over
White 55.9% 12.0% 15.1% 17.0%BME total 58.9% 11.4% 15.8% 13.9%Black 44.0% 11.1% 20.8% 24.2%Asian 68.4% 10.5% 12.5% 8.5%Chinese 64.5% 15.7% 12.4% 7.4%Mixed 64.1% 12.9% 14.1% 8.9%Other 52.9% 12.3% 19.3% 15.5%
UK-domiciled students in age groups by ethnic group
21 and under
22-25 26-35 36 and over
White 79.5% 81.2% 79.7% 83.3%Black 4.9% 5.8% 8.5% 9.2%Asian 10.0% 7.3% 6.8% 4.3%Chinese 1.0% 1.2% 0.7% 0.4%Mixed 3.5% 3.4% 2.8% 1.7%Other 1.1% 1.2% 1.5% 1.1%
367

Age and gender
This table refers to students’ age on entry and gender.
Male students had a younger age profile than female students: 72.3% of male students were aged 25 and under, compared with 67.0% of female students.
Female students comprised 63.4% of those aged 36 and over, but only 54.0% of those aged 21 and under.
5.3 All students by age group and gender
Students in age groups by gender
368
Female MaleNo. %* %^ No. %* %^
21 and under 678355 51.6
54.0 578590 56.
546.
022-25 202525 15.
455.
6 161955 15.8
44.4
26-35 215680 16.4
57.6 158455 15.
542.
436 and over 217920 16.
663.
4 125775 12.3
36.6
Total 1314480 100 56.
2102477
0 100 43.8

Female/male students by age group
21 and under 22-25 26-35 36 and overFemale 51.6 15.4 16.4 16.6Male 56.5 15.8 15.5 12.3
Disability and ethnicity
This table refers to the ethnicity of UK-domiciled students who disclosed as disabled (disabled) or did not disclose as disabled or whose disability status was unknown (non-disabled).
A higher proportion of white students disclosed as disabled (11.6%) than BME students (8.4%).
Disability disclosure rates were highest among mixed students (12.5%) and lowest among Chinese students (4.5%).
5.4 UK-domiciled students by disability status and ethnic group
369
Female Male21 and under 54.0% 46.0%22-25 55.6% 44.4%26-35 57.6% 42.4%36 and over 63.4% 36.6%

* within a disability status, the percentage of students in an ethnic group (compare vertically)
^ within an ethnic group, the percentage of students who are disabled/non-disabled (compare horizontally)Percentages based on total number of students minus those whose ethnic group is unknown.
UK-domiciled students in ethnic groups by disability status
370
Non-disabled DisabledNo. %* %^ No. %* %^
White 1332875
79.8
88.4
174970
85.0
11.6
BME total 337475 20.2
91.6 30910 15.
0 8.4
Black 105950 6.3 90.2 11470 5.6 9.8
Asian 145505 8.7 93.9 9510 4.6 6.1
Chinese 15640 0.9 95.5 740 0.4 4.5
Mixed 50615 3.0 87.5 7215 3.5 12.
5
Other 19770 1.2 90.9 1975 1.0 9.1
Total 1670350 100 89.
020588
5 100 11.0

* values less than 5.0 are not displayed
Disabled/non-disabled students by ethnic group
Compared with 2011/12, the proportion of BME students disclosing a disability has increased across all impairment types [see fig. 5.5, ECU (2013)].
BME students made up 22.8% of students who were blind or had a serious visual impairment and 9.0% of students who disclosed a social communication or autistic spectrum disorder.
371
Non-disabled DisabledWhite 88.4% 11.6%
BME total 91.6% 8.4%
Black 90.2% 9.8%
Asian 93.9% 6.1%
Chinese 95.5% *
Mixed 87.5% 12.5%
Other 90.9% 9.1%
Non-disabled DisabledWhite 79.8 85.0
Black 6.3 5.6
Asian 8.7 4.6
Chinese 0.9 0.4
Mixed 3.0 3.5
Other 1.2 1.0

14.0% of Chinese disabled students reported a mental health condition, compared with 7.7% of black disabled students.
14.2% of Asian disabled students reported a long standing illness or health condition, compared with 8.2% of mixed disabled students.
5.5 UK-domiciled disabled students by impairment type and ethnic group
372
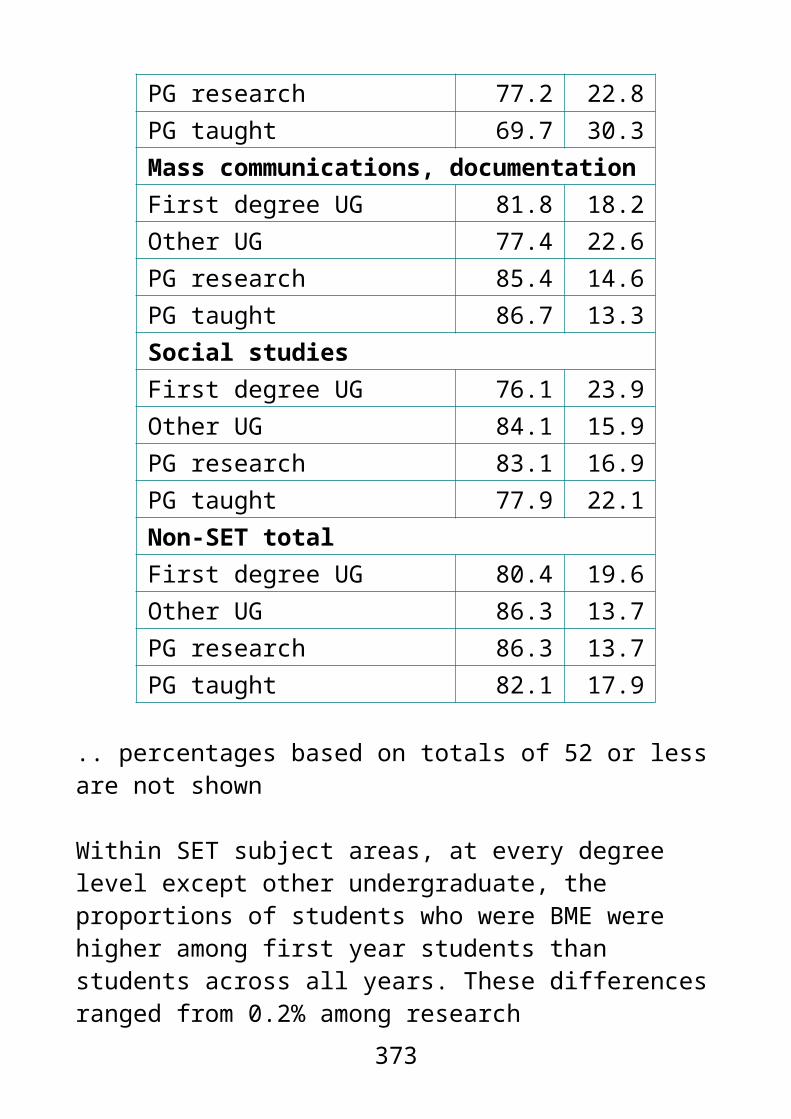
373
White BME totalNo. %* %^ No. %* %^
Blind/serious visual impairment 2265 1.3 77.
2 665 2.2 22.8
Deaf/serious hearing impairment 4505 2.6 85.
9 740 2.4 14.1
Long-standing illness or health condition
17465 10.0
82.5 3695 11.
917.
5
Mental health condition 19530 11.
286.
2 3135 10.1
13.8
Personal care support 0 0.0 - 0 0.0 -
Physical impairment/mobility issues
5860 3.3 83.7 1140 3.7 16.
3
Social comm./autistic spectrum disorder
1395 2.5 91.0 435 1.4 9.0
Specific learning difficulty 86005 49.
285.
0 15175 49.1
15.0
Two or more impairments 15980 9.1 88.
2 2130 6.9 11.8
Other impairment 18970 10.8
83.3 3790 12.
316.
7
Disabled students 174970
100
85.0 30910 10
015.
0

374
Black AsianNo. %* %^ No. %* %^
Blind/serious visual impairment 225 2.0 7.6 300 3.2 10.
3Deaf/serious hearing impairment 225 2.0 4.3 325 3.4 6.2
Long-standing illness or health condition
1475 12.9 7.0 1350 14.
2 6.4
Mental health condition 880 7.7 3.9 970 10.
2 4.3
Personal care support 0 0.0 - 0 0.0 -
Physical impairment/mobility issues
455 4.0 6.5 415 4.4 6.0
Social comm./autistic spectrum disorder
115 1.0 2.3 100 1.0 2.0
Specific learning difficulty 5955 51.
9 5.9 4150 43.6 4.1
Two or more impairments 770 6.7 4.3 585 6.2 3.2
Other impairment 1365 11.9 6.0 1310 13.
8 5.8
Disabled students 11470 100 5.6 9510 10
0 4.6

375
Chinese MixedNo. %* %^ No. %* %^
Blind/serious visual impairment 25 3.1 0.8 85 1.2 2.9
Deaf/serious hearing impairment 20 2.8 0.4 130 1.8 2.4
Long-standing illness or health condition
85 11.2 0.4 590 8.2 2.8
Mental health condition 105 14.
0 0.5 975 13.5 4.3
Personal care support 0 0.0 - 0 0.0 -
Physical impairment/mobility issues
20 2.8 0.3 175 2.4 2.5
Social comm./autistic spectrum disorder
20 2.4 0.4 180 2.5 3.7
Specific learning difficulty 340 46.
1 0.3 3765 52.2 3.7
Two or more impairments 45 5.9 0.2 560 7.8 3.1
Other impairment 85 11.6 0.4 750 10.
4 3.3
Disabled students 740 100 0.4 7215 10
0 3.5
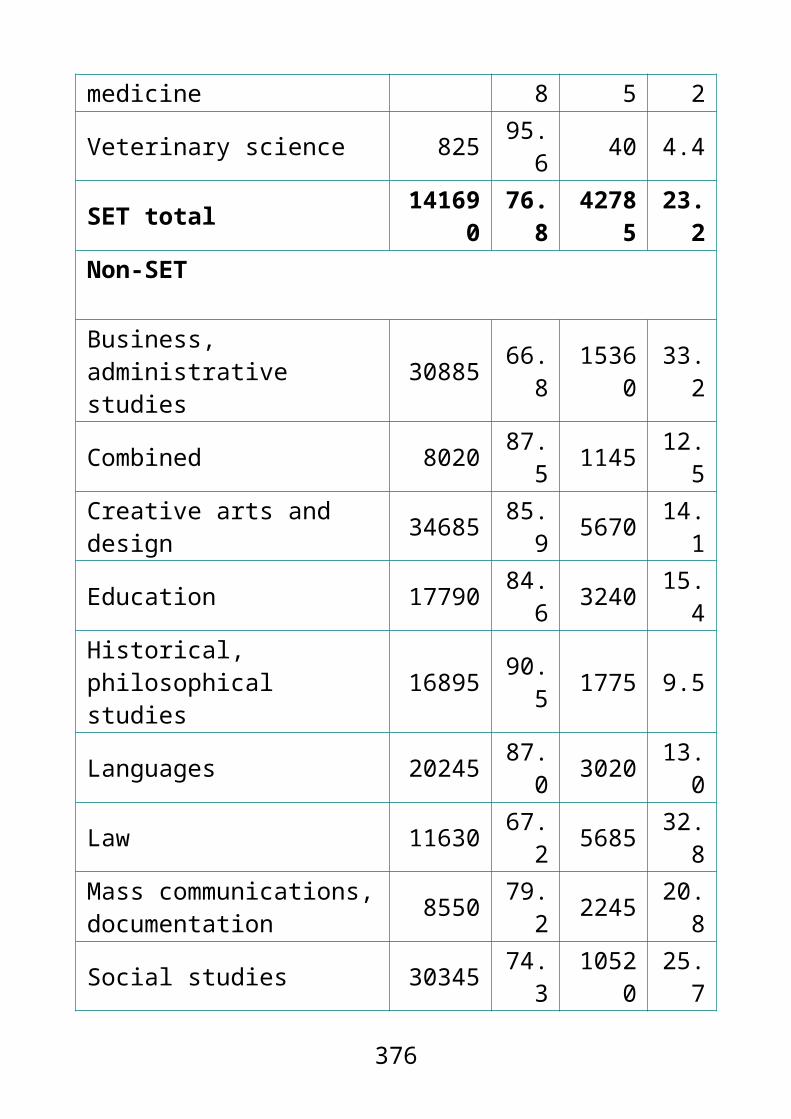
* within an ethnic group, the percentage of students in an impairment type (compare vertically)
^ within an impairment type, the percentage of students in an ethnic group (compare horizontally)
376
OtherNo. %* %^
Blind/serious visual impairment 35 1.7 1.1
Deaf/serious hearing impairment 40 2.0 0.8
Long-standing illness or health condition
190 9.7 0.9
Mental health condition 205 10.
3 0.9
Personal care support 0 0.0 -
Physical impairment/mobility issues
75 3.8 1.1
Social comm./autistic spectrum disorder
25 1.3 0.5
Specific learning difficulty 960 48.
7 1.0
Two or more impairments 165 8.5 0.9
Other impairment 280 14.1 1.2
Disabled students 1975 100 1.0
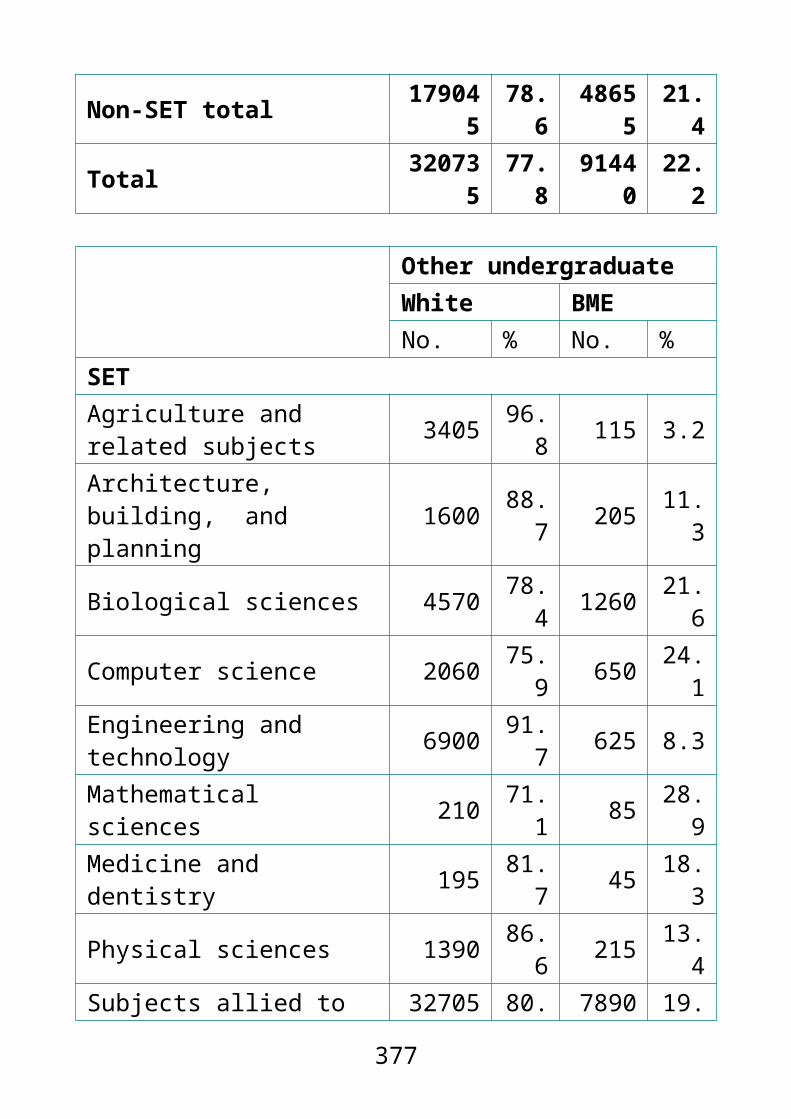
.. Percentages based on totals of 52 or less are not shown.Percentages based on total number of students minus those whose impairment type or ethnic group is unknown.
377

UK-domiciled disabled students in impairment types by ethnic group
White Black Asian Chin-ese Mixed Other
Blind/serious visual impairment 72.2 7.6 10.3 0.8 2.9 1.1
Deaf/serious hearing impairment 85.9 4.3 6.2 0.4 2.4 0.8
Long-standing illness or health condition
82.5 7.0 6.4 0.4 2.8 0.9
Mental health condition 86.2 3.9 4.3 0.5 4.3 0.9
Physical impairment/mobility issues
83.7 6.5 6.0 0.3 2.5 1.1
Social comm./autistic spectrum disorder
91.0 2.3 2.0 0.4 3.7 0.5
Specific learning difficulty 85.0 5.9 4.1 0.3 3.7 1.0
Two or more impairments 88.2 4.3 3.2 0.2 3.1 0.9
Other impairment 83.3 6.0 5.8 0.4 3.3 1.2
UK-domiciled disabled students in ethnic groups by impairment type
White Black Asian Chin-ese Mixed Other
Blind/serious visual impairment 1.3 2.0 3.2 3.1 1.2 1.7
378

Deaf/serious hearing impairment 2.6 2.0 3.4 2.8 1.8 2.0
Long-standing illness or health condition
10.0 12.9 14.2 11.2 8.2 9.7
Mental health condition 11.2 7.7 10.2 14.0 13.5 10.3
Physical impairment/mobility issues
3.3 4.0 4.4 2.8 2.4 3.8
Social comm./autistic spectrum disorder
2.5 1.0 1.0 2.4 2.5 1.3
Specific learning difficulty 49.2 51.9 43.6 46.1 52.2 48.7
Two or more impairments 9.1 6.7 6.2 5.9 7.8 8.5
Other impairment 10.8 11.9 13.8 11.6 10.4 14.1
Disability and gender
This table refers to students who disclosed as disabled (disabled) and did not disclose as disabled or whose disability status was unknown (non-disabled) and their gender.
9.7% of female students disclosed as disabled compared with 9.1% of male students.
79.8% of students who disclosed a social communication or autistic spectrum disorder were male. In contrast, 66.7% of students who disclosed a mental health condition were female.
379

A higher proportion of female disabled students (9.5%) disclosed two or more impairments than male disabled students (7.4%), a difference of 2.1%.
5.6 All students by disability status, impairment type and gender
380

381
Female MaleNo. %* %^ No. %* %^
Disabled 128110 9.7 57.
9 93040 9.1 42.1
Blind/serious visual 1670 1.3 50.
1 1665 1.8 49.9
Deaf/serious hearing 6450 2.7 60.
6 2240 2.4 39.4
Long-standing illness or health condition
14150 11.0
61.0 9045 9.7 39.
0
Mental health condition 16420 12.
866.
7 8205 8.8 33.3
Personal care support 5 0.0 - 0 0.0 -
Physical impairment/mobility issues
4690 3.7 60.9 3015 3.2 39.
1
Social comm./autistic spectrum disorder
1030 0.8 20.2 4075 4.4 79.
8
Specific learning difficulty 58815 45.
954.
8 48420 52.0
45.2
Two or more impairments 12205 9.5 64.
1 6840 7.4 35.9
Other impairment 15675 12.2
62.2 9535 10.
337.
8
Non-disabled 1186710
90.3
56.0
931990
90.9
44.0
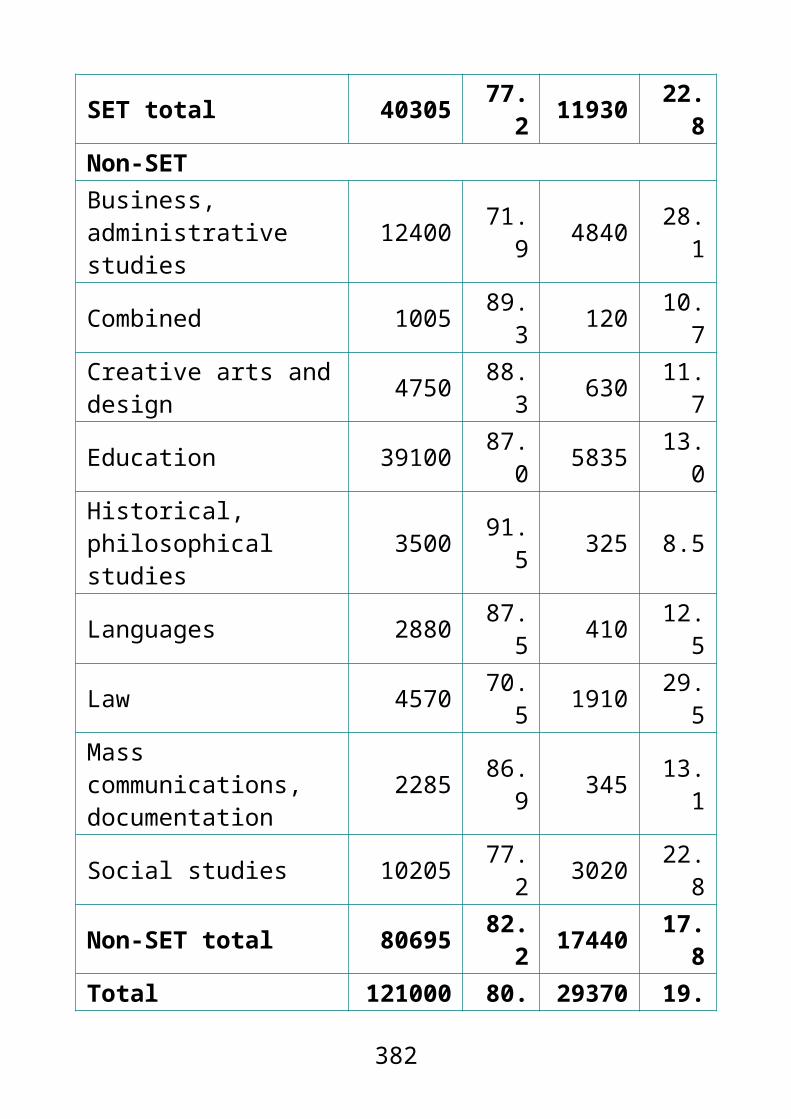
* within a gender, the percentage of students in a disability status/the percentage of disabled students in an impairment type (compare vertically)
^ within a disability status and impairment type, the percentage of students who are female/male (compare horizontally)
.. Percentages based on totals of 52 or less are not shown.Percentages based on total number of students minus those whose impairment type or gender is unknown.
Disabled students in impairment types by gender
382
Female MaleBlind/serious visual impairment
50.1% 49.9%
Deaf/serious hearing impairment
60.6% 39.4%
Long-standing illness or health condition
61.0% 39.0%
Mental health condition 66.7% 33.3%Personal care support - -Physical impairment/mobility issues
60.9% 39.1%
Social comm./autistic spectrum disorder
20.2% 19.2%
Specific learning difficulty 54.8% 45.2%Two or more impairments
64.1% 35.9%
Other impairment 62.2% 37.8%

383

Female/male disabled students by impairment type
Ethnicity and gender
This table refers to UK domiciled students’ ethnic group and gender.
Within every ethnic group, the majority of students were female.
Black students had the highest proportion of women (59.3%), while Chinese students had the lowest (52.2%).
384
Female MaleBlind/serious visual impairment
1.3 1.8
Deaf/serious hearing impairment
2.7 2.7
Long-standing illness or health condition
11.0 9.7
Mental health condition 12.8 8.8Personal care support 0 0Physical impairment/mobility issues
3.7 3.2
Social comm./autistic spectrum disorder
0.8 4.4
Specific learning difficulty 45.9 52.0Two or more impairments
9.5 7.4
Other impairment 12.2 10.3

20.5% of male students were from BME backgrounds, compared with 19.0% of female students.
5.7 UK-domiciled students by ethnic group and gender
* within a gender, the percentage of students in an ethnic group (compare vertically)
^ within an ethnic group, the percentage of students who are female/male (compare horizontally)Percentages based on total number of students minus those whose ethnic group or gender is unknown.
385
Female MaleNo. %* %^ No. %* %^
White 875075 81.0
58.0
632580
79.5
42.0
BME total 204780 19.0
55.6
163565
20.5
44.4
Black 69595 6.4 59.3 47810 6.0 40.
7
Asian 81560 7.6 52.6 73445 9.0 47.
4
Chinese 8555 0.8 52.2 7825 1.0 47.
8
Mixed 33315 3.1 57.6 24510 3.1 42.
4
Other 11760 1.1 54.1 9975 1.3 45.
9
Total 1079855 100 57.
679614
5 100 42.4

UK-domiciled students in ethnic groups by gender
UK-domiciled female/male students by ethnic group
Degree attainment
Qualifiers refers to first degree undergraduate qualifiers.
In every age group, a higher proportion of non-disabled qualifiers received a first/2:1 degree than disabled qualifiers.
386
Female MaleWhite 58.0% 42.0%
BME total 55.6% 44.4%
Black 59.3% 40.7%
Asian 52.6% 47.4%
Chinese 52.2% 47.8%
Mixed 57.6% 42.4%
Other 54.1% 45.9%
Female MaleWhite 81.0 79.5
Black 6.4 6.0
Asian 7.6 9.2
Chinese 0.8 1.0
Mixed 3.1 3.1
Other 1.1 1.3

The disability degree attainment gap was largest for qualifiers aged 36 and over, where 62.8% of nondisabled qualifiers received a first/2:1 compared with 56.9% of disabled qualifiers (a 5.9% gap).
The disability degree attainment gap was smallest for qualifiers aged 26–35, where 62.0% of non-disabled qualifiers received a first/2:1 compared with 61.3% of disabled qualifiers (a 0.7% gap).
Compared with 2011/12, the proportion of disabled students receiving a first/2:1 increased across all age groups. The largest increase was within the 21 and under age group (2.8%) [see fig. 5.13, ECU (2013)].
5.8 First degree undergraduate qualifiers by degree class, disability status and age group
387

388
First and 2:1 First
No. % No. %
Non-disabled21 and under 81685 72.6 18695 16.6
22-25 114205 67.1 32640 19.2
26-35 20935 62.0 6935 20.5
36 and over 15075 62.8 5080 21.2
Total 231900 68.1 63350 18.6
Disabled21 and under 7060 70.6 1455 14.6
22-25 12920 66.5 6280 16.9
26-35 3000 61.3 935 19.1
36 and over 2110 56.9 600 16.2
Total 25090 66.0 6275 16.5
All qualifiers 256990 67.9 69625 18.4

389
2:1 2:2No. % No. %
Non-disabled21 and under 62990 56.0 27075 24.122-25 81565 47.9 44720 26.326-35 14000 41.4 9500 28.136 and over 9995 41.6 6410 26.7Total 168550 49.5 87705 25.8Disabled21 and under 5600 56.0 2605 26.022-25 9640 49.6 5270 27.126-35 2065 42.2 1415 28.936 and over 1510 40.7 1150 31.1Total 18815 49.5 10440 27.5All qualifiers 187365 49.5 98145 25.9
Third/passNo. %
Non-disabled21 and under 3705 3.322-25 11385 6.726-35 3355 9.936 and over 2520 10.5Total 20970 6.2Disabled21 and under 335 3.422-25 1240 6.426-35 475 9.736 and over 445 12.0Total 2495 6.6All qualifiers 23465 6.2

Percentages based on total number of students minus those whose degree class or age group is unknown.
Disabled/non-disabled first degree undergraduate qualifiers in age groups by degree class
First 2:1 2:2 Third/passNon-disabled 21 and under
16.6% 56.0% 24.1% *
Non-disabled 22-25 19.2% 47.9% 26.3% 6.7%Non-disabled 26-35 20.5% 41.4% 28.1% 9.9%Non-disabled 36 and over
21.2% 41.6% 26.7% 10.5%
Disabled 21 and under
14.6% 56.0% 26.0% -
Disabled 22-25 16.9% 49.6% 27.1% 6.4%Disabled 26-35 19.1% 42.2% 28.9% 9.7%Disabled 36 and over
16.2% 40.7% 31.1% 12.0%
* values less than 5.0 are not displayed
Across every age group, a higher proportion of white qualifiers received a first/2:1 than BME qualifiers.
The ethnicity degree attainment gap between age groups was lowest for qualifiers aged 21 and under (7.5%) and highest for qualifiers aged 36 and over (24.3%).
390

5.9 UK-domiciled first degree undergraduate qualifiers by degree class, BME/white identity and age group
391
First and 2:1 FirstNo. % No. %
White21 and under 67170 74.8 15205 16.922-25 85850 73.7 25015 21.526-35 16885 69.3 6030 24.736 and over 13765 68.0 4885 24.1Total 183670 73.2 51130 20.4BME21 and under 12540 67.3 2540 13.622-25 16150 55.2 3520 12.026-35 3155 47.7 735 11.136 and over 2320 43.7 475 8.9Total 34170 57.1 7275 12.2All qualifiers 217840 70.1 58405 18.8

392
2:1 2:2No. % No. %
White21 and under 51965 57.9 20225 22.522-25 60840 52.2 25625 22.026-35 10850 44.5 5870 24.136 and over 8880 43.9 4730 23.4Total 132535 52.8 56445 22.5BME21 and under 10000 53.6 5360 28.722-25 12630 43.2 10180 34.826-35 2420 36.5 2475 37.436 and over 1850 34.8 2150 40.4Total 26895 45.0 20165 33.7All qualifiers 159430 51.3 76610 24.7

Percentages based on total number of students minus those whose degree class, BME/white identity or age group is unknown.
393
Third/passNo. %
White21 and under 2400 2.722-25 4995 4.326-35 1625 6.736 and over 1740 8.6Total 10760 4.3BME
21 and under 740 4.022-25 2905 9.926-35 990 14.936 and over 845 15.9Total 5480 9.2All qualifiers 16240 5.2
UK-domiciled BME/white first degree undergraduate qualifiers in age groups by degree class
First 2:1 2:2 Third/passWhite 21 and under 16.9% 57.9% 22.5% *White 22-25 21.5% 52.2% 22.0% -White 26-35 24.7% 44.5% 24.1% 6.7%White 36 and over 24.1% 43.9% 23.4% 8.6%BME 21 and under 13.6% 53.6% 28.7% -BME 22-25 12.0% 43.2% 34.8% 9.9%BME 26-35 11.1% 36.5% 37.4% 14.9%BME 36 and over 8.9% 34.8% 40.4% 15.9%
* values less than 5.0 are not displayed
Within every age group apart from the 36 and over group, a higher proportion of female qualifiers achieved a first/2:1 than male qualifiers.
Among those aged 21 and under, 75.0% of female qualifiers and 68.8% of male qualifiers received a first/2:1; a difference of 6.2%.
A higher proportion of male qualifiers received a third/pass than female qualifiers across all age groups.
Compared with 2011/12, there has been an increase in the proportion of female qualifiers achieving a first/2:1 in every age group except 36 and over [see fig. 5.10, ECU (2013)].
394

395
First and 2:1 FirstNo. % No. %
Female21 and under 54095 75.0 11890 16.522-25 68895 69.6 18815 19.026-35 13750 62.2 4315 19.536 and over 11970 62.0 3905 20.2Total 148705 70.0 38930 18.3Male21 and under 34645 68.8 8260 16.422-25 58210 64.2 17100 18.826-35 10180 61.4 3550 21.436 and over 5215 62.1 1775 21.1Total 108255 65.2 30690 18.5All qualifiers 256960 67.9 69615 18.4

396
2:1 2:2No. % No. %
Female21 and under 42205 58.5 16150 22.422-25 50080 50.6 24595 24.826-35 9435 42.7 6275 28.436 and over 8060 41.7 5290 27.4Total 109775 51.7 52310 24.6Male21 and under 26385 52.4 13525 26.922-25 41115 45.3 25395 28.026-35 6630 40.0 4635 28.036 and over 3440 41.0 2275 27.1Total 77565 46.7 42825 27.6All qualifiers 187345 49.5 98135 25.9

Percentages based on total number of students minus those whose degree class, gender or age group is unknown.
Female/male first degree undergraduate qualifiers in age groups by degree class
First 2:1 2:2 Third/passFemale 21 and under
16.5% 58.5% 22.4% *
Female 22-25 19.0% 50.6% 24.8% 5.6%Female 26-35 19.5% 42.7% 28.4% 9.4%Female 36 and over 20.2% 41.7% 27.4% 10.6%Male 21 and under 16.4% 52.4% 26.9% -Male 22-25 18.8% 45.3% 28.0% 7.9%Male 26-35 21.4% 40.0% 28.0% 10.6%
397
Third/passNo. %
Female21 and under 1855 2.622-25 5500 5.626-35 2070 9.436 and over 2055 10.6Total 11480 5.4Male
21 and under 2185 4.322-25 7120 7.926-35 1760 0.636 and over 910 10.8Total 11980 7.2All qualifiers 23460 6.2

Male 36 and over 21.1% 41.0% 27.1% 10.8%
* values less than 5.0 are not displayed
For all ethnic groups, a higher proportion of non-disabled qualifiers received a first/2:1 than disabled qualifiers.
The disability degree attainment gap was largest among white qualifiers, where 73.9% of non-disabled qualifiers achieved a first/2:1 compared with 68.3% of disabled qualifiers (a difference of 5.6%).
The disability degree attainment gap was lowest among mixed qualifiers where 67.4% of non-disabled and 65.3% of disabled qualifiers received a first/2:1; a difference of 2.1%.
5.11 UK-domiciled first degree undergraduate qualifiers by degree class, disability status and ethnic group
398

399
First and 2:1 FirstNo. % No. %
Non-disabledWhite 162795 73.9 45815 20.8BME total 31425 57.5 6700 12.3Black 7545 47.2 1220 7.6Asian 14635 59.6 3260 13.3Chinese 1730 64.0 440 16.4Mixed 5860 67.4 1420 16.3Other 1650 59.8 365 13.1Total 194220 70.6 52515 19.1DisabledWhite 20870 68.3 5315 17.4BME total 2745 53.6 570 11.2Black 790 43.5 115 6.3Asian 920 54.8 185 11.0Chinese 65 61.5 25 21.1Mixed 800 65.3 205 16.8Other 170 57.4 45 15.2Total 23620 66.2 5890 16.5All qualifiers 217840 70.1 58405 18.8

400
2:1 2:2No. % No. %
Non-disabledWhite 116980 53.1 48465 22.0BME total 24720 45.2 18355 33.6Black 6330 39.6 6445 40.3Asian 11380 46.4 8000 32.6Chinese 1285 47.6 750 27.8Mixed 4440 51.0 2290 26.3Other 1290 46.6 865 31.4Total 141700 51.5 66820 24.3DisabledWhite 15555 50.9 7980 26.1BME total 2175 42.4 1810 35.3Black 675 37.1 740 40.8Asian 735 43.9 585 34.9Chinese 45 40.4 30 26.6Mixed 595 48.6 355 29.1Other 125 42.2 100 33.4Total 17730 49.7 9790 27.4All qualifiers 159430 51.3 76610 24.7
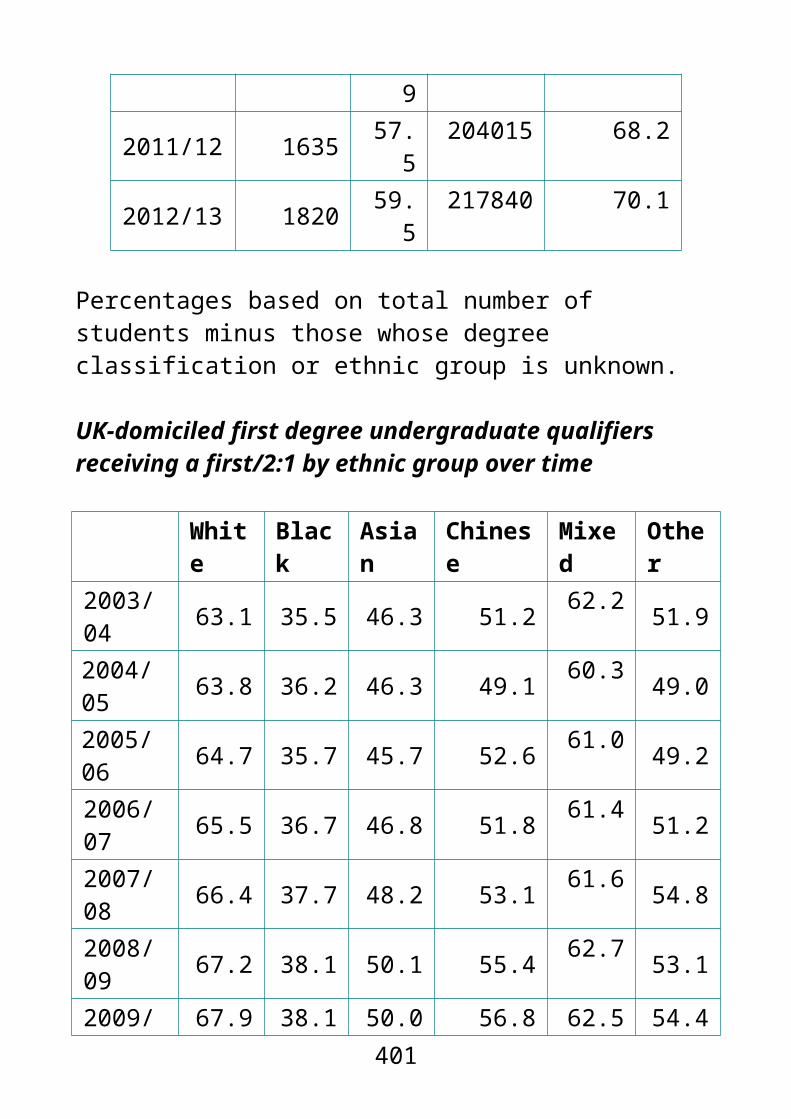
Percentages based on total number of students minus those whose degree class or ethnic group is unknown.
401
Third/passNo. %
Non-disabledWhite 9035 4.1BME total 4915 9.0Black 1995 12.5Asian 1905 7.8Chinese 220 8.2Mixed 545 6.3Other 245 8.8Total 13950 5.1DisabledWhite 1725 5.6BME total 565 11.1Black 285 15.8Asian 170 10.2Chinese 15 11.9Mixed 70 5.6Other 25 9.1Total 2290 6.4All qualifiers 16240 5.2

Non-disabled first degree undergraduate qualifiers in ethnic groups by degree class
First 2:1 2:2 Third/passNon-disabled white 20.8% 53.1% 22.0% *Non-disabled BME total 12.3% 45.2% 33.6% 9.0%
Non-disabled black 7.6% 39.6% 40.3% 12.5%Non-disabled Asian 13.3% 46.4% 32.6% 7.8%Non-disabled Chinese 16.4% 47.6% 27.8% 8.2%
Non-disabled mixed 16.3% 51.0% 26.3% 6.3%
Non-disabled other 13.1% 46.6% 31.4% 8.8%
First 2:1 2:2 Third/passDisabled white 17.4% 50.9% 26.1% 5.6%Disabled BME total 11.2% 42.4% 35.3% 11.1%Disabled black 6.3% 37.1% 40.8% 15.8%Disabled Asian 11.0% 43.9% 34.9% 10.2%Disabled Chinese 21.1% 40.4% 26.6% 11.9%Disabled mixed 16.8% 48.6% 29.1% 5.6%Disabled other 15.2% 42.2% 33.4% 9.1%
* values less than 5.0 are not displayed
The disability degree attainment gap was larger among female qualifiers than among male qualifiers. 67.2% of disabled female qualifiers received a first/2:1 compared with 70.3% of non-disabled female qualifiers (a 3.1% gap). In comparison, 64.3% of disabled male qualifiers received a first/2:1 compared with 65.3% of non-disabled male qualifiers (a 1.0% gap).
402
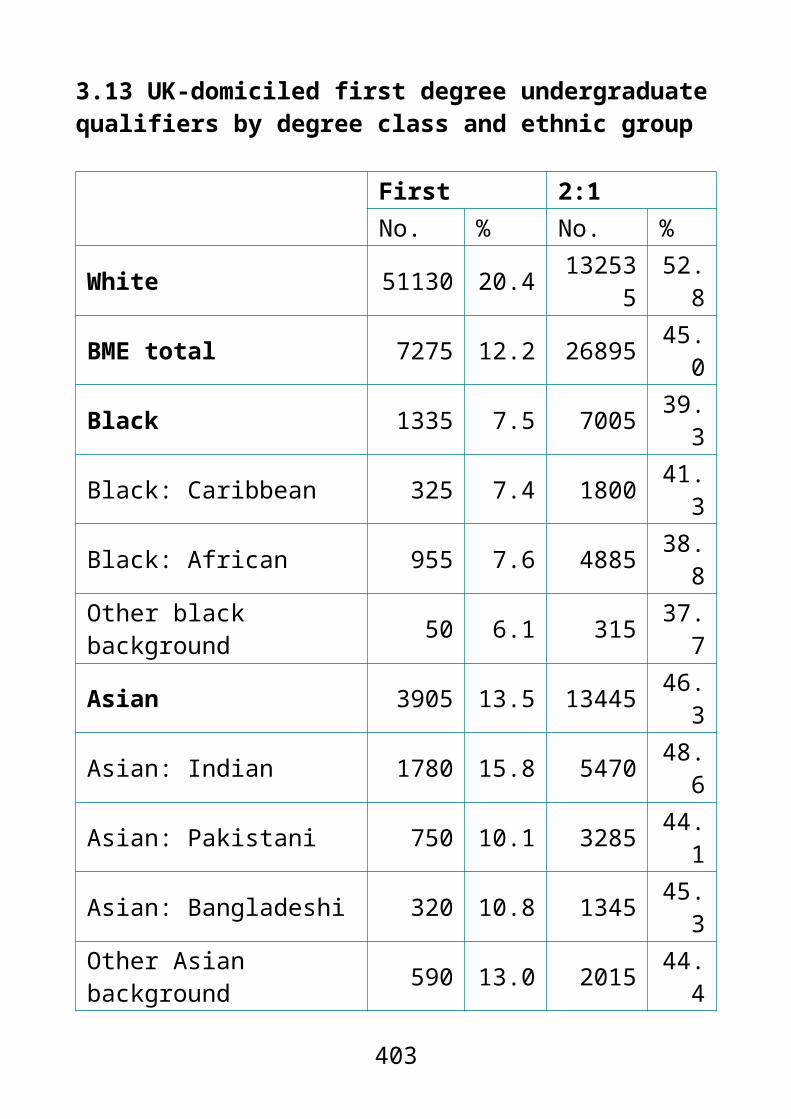
Compared with 2011/12, the proportion of male and female disabled qualifiers receiving a first/2:1 increased slightly, from 65.0% to 67.2% for women and from 62.4% to 64.3% for men [see fig. 5.9, ECU (2013)].
5.12 First degree undergraduate qualifiers by degree class, gender and disability status
403
First and 2:1 FirstNo. % No. %
FemaleNon-disabled 133990 70.3 35410 18.6Disabled 14715 67.2 3515 16.1Total 148705 70.0 38930 18.3MaleNon-disabled 97890 65.3 27930 18.6Disabled 10365 64.3 2760 17.1Total 108255 65.2 30690 18.5All qualifiers 25690 67.9 69615 18.4
2:1 2:2No. % No. %
FemaleNon-disabled 98575 51.7 46470 24.4Disabled 11200 51.1 5840 26.7Total 109775 51.7 52310 24.6MaleNon-disabled 69960 46.7 41225 27.5Disabled 7605 47.2 4600 28.6Total 77565 46.7 45825 27.6All qualifiers 187345 49.5 98125 25.9

Percentages based on total number of students minus those whose degree class or gender is unknown.
Disabled first degree undergraduate qualifiers in ethnic groups by degree class
First 2:1 2:2 Third/passFemale non-disabled 18.6% 51.7% 24.4% 5.3%
Female disabled 16.1% 51.1% 26.7% 6.2%Male non-disabled 18.6% 46.7% 27.5% 7.2%Male disabled 17.1% 47.2% 28.6% 7.1%
In all ethnic groups, a higher proportion of female qualifiers received a first/2:1 than male qualifiers. This gender degree attainment gap was largest among Chinese qualifiers where 66.6% of women and 60.9% of men received a first/2:1.
The ethnicity degree attainment gap was largest between white male qualifiers (71.2%) and black male qualifiers (44.1%), with a gap of 27.1%.
404
Third/passNo. %
FemaleNon-disabled 10130 5.3Disabled 1350 6.2Total 11480 5.4Male
Non-disabled 10835 7.2Disabled 1145 7.1Total 11980 7.2All qualifiers 23460 6.2

However, across all ethnic groups a higher proportion of male qualifiers received a first than female qualifiers.
5.13 UK-domiciled first degree undergraduate qualifiers by degree class, gender and ethnic group
405
First and 2:1 FirstNo. % No. %
FemaleWhite 107355 74.7 29090 20.3BME total 19880 58.5 3905 11.5Black 5215 48.6 790 7.4Asian 8610 60.6 1725 12.1Chinese 990 66.6 245 16.5Mixed 4020 69.3 940 16.2Other 1040 59.9 205 11.7Total 127235 71.6 32995 18.6MaleWhite 76305 71.2 22035 20.6BME total 14280 55.3 3370 13.0Black 3115 44.1 540 7.7Asian 6945 57.9 1715 14.3Chinese 805 60.9 220 16.6Mixed 2635 64.1 685 16.7Other 775 59.0 205 15.5Total 90585 68.1 25405 19.1All qualifiers 217815 70.1 58400 18.8

406
2:1 2:2No. % No. %
FemaleWhite 78260 54.5 30710 21.4BME total 15975 47.0 11255 33.1Black 4425 41.3 4255 39.7Asian 6885 48.4 4580 32.2Chinese 745 50.1 395 26.5Mixed 3085 53.1 1470 25.3Other 835 48.1 555 31.9Total 94240 53.1 41960 23.6MaleWhite 54270 50.6 25735 24.0BME total 10910 42.2 8910 34.5Black 2575 36.4 2930 41.4Asian 5230 43.6 4005 33.4Chinese 585 44.3 385 29.2Mixed 1945 47.3 1175 28.6Other 570 43.5 410 31.3Total 65180 49.0 34645 26.0All qualifiers 159415 51.3 76605 24.7
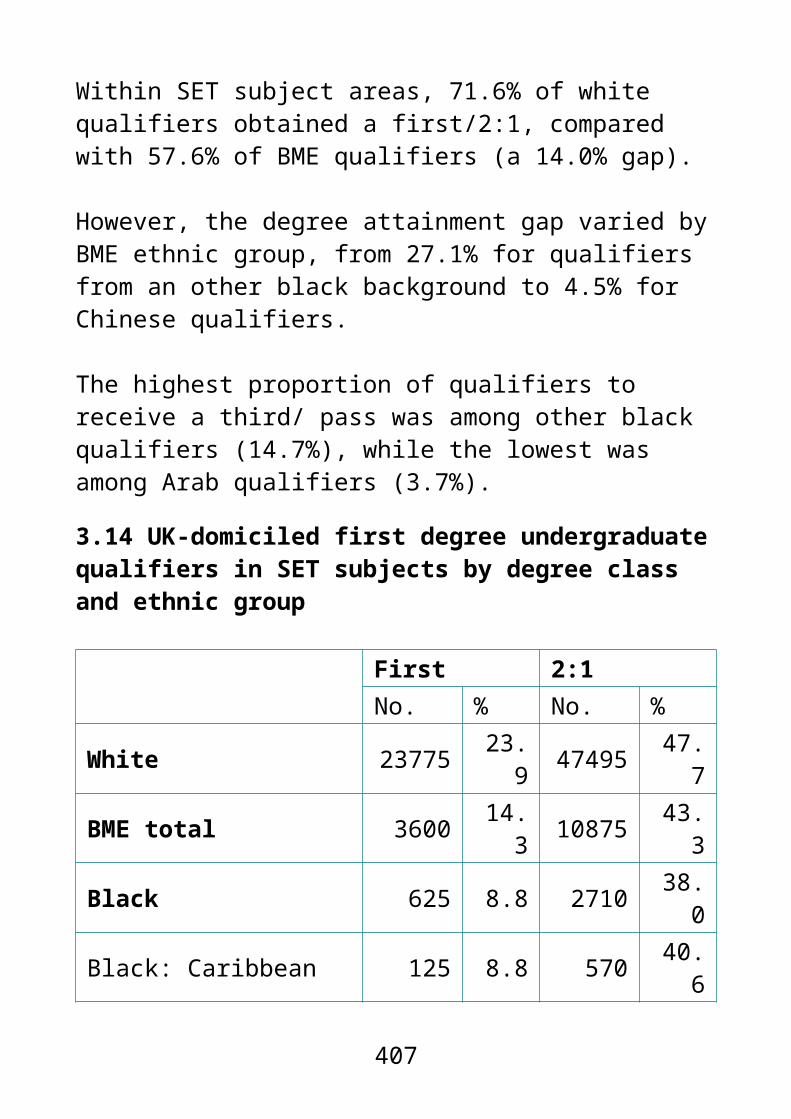
Percentages based on total number of students minus those whose degree class or ethnic group is unknown.
UK-domiciled female first degree undergraduate qualifiers in ethnic groups by degree class
First 2:1 2:2 Third/passFemale white 20.3% 54.5% 21.4% *Female BME total 11.5% 47.0% 33.1% 8.4%
407
Third/passNo. %
FemaleWhite 5585 3.9BME total 2840 8.4Black 1255 11.7Asian 1025 7.2Chinese 105 6.9Mixed 315 5.4Other 145 8.3Total 8425 4.7Male
White 5175 4.8BME total 2635 10.2Black 1025 14.5Asian 1050 8.8Chinese 130 9.9Mixed 300 7.3Other 125 9.7Total 7815 5.9All qualifiers 16240 5.2

Female black 7.4% 41.3% 39.7% 11.7%Female Asian 12.1% 48.4% 32.2% 7.2%Female Chinese 16.5% 50.1% 26.5% 6.9%Female Mixed 16.2% 53.1% 25.3% 5.4%Female other 11.7% 48.1% 31.9% 8.3%
* values less than 5.0 are not displayed
UK-domiciled male first degree undergraduate qualifiers in ethnic groups by degree class
First 2:1 2:2 Third/passMale white 20.6% 50.6% 24.0% *Male BME total 13.0% 42.2% 34.5% 10.2%Male black 7.7% 36.4% 41.4% 14.5%Male Asian 14.3% 43.6% 33.4% 8.8%Male Chinese 16.6% 44.3% 29.2% 9.9%Male Mixed 16.7% 47.3% 28.6% 7.3%Male other 15.5% 43.5% 31.3% 9.7%
Sector group profile
The profile of students varied considerably by sector group.
GuildHE institutions had the youngest student profile; 63.3% of their students were aged 21 and under, compared with 50.7% of students in the Million+ group.
GuildHE also had the highest proportion of students who disclosed as disabled (14.2%), while the Russell Group had the lowest (7.5%).
408

Million+ institutions had the highest proportion of students who were BME, with over a quarter of its UK-domiciled students from BME backgrounds (26.4%). In contrast, 14.1% of students studying at GuildHE institutions were BME.
While there were more female students than male students in every sector group, the difference was highest in GuildHE institutions (where 59.7% of students were women) and lowest in Russell Group institutions (53.7%).
Compared with 2011/12, the proportion of students in University Alliance institutions who were BME increased by 3.2% [see fig. 5.14, ECU (2013)].
5.14 All students by sector group of institution, age group, disability status, DSA take-up, ethnic group and gender
409

410
1994 Group GuildHENo. % No. %
Age21 and under 72025 53.2 67560 63.322-25 22850 16.9 13390 12.526-35 22590 16.7 12660 11.936 and over 17865 13.2 13175 12.3Total 135325 100 106785 100Disability statusNon-disabled 122715 90.7 91675 85.8Disabled 12620 9.3 15190 14.2Total 135335 100 106865 100DSA take-upDisabled: receives DSA 5350 46.7 8960 61.8
Disabled: does not receive DSA 6095 53.3 5530 38.2
Total 11445 100 14490 100EthnicityWhite 74875 76.7 80570 85.9BME total 22785 23.3 13260 14.1Black 7675 7.9 5025 5.4Asian 8070 8.3 4455 4.7Chinese 1060 1.1 355 0.4Mixed 4325 4.4 2825 3.0Other 1655 1.7 600 0.6All UK-domiciled students
97660 100 93830 100
GenderFemale 74770 55.2 63835 59.7Male 60565 44.8 43030 40.3Total 135335 100 106860 100

411
Million+ Russell GroupNo. % No. %
Age21 and under 140910 50.7 347045 61.122-25 43255 15.6 100395 17.726-35 47200 17.0 71810 12.636 and over 46750 16.8 48825 8.6Total 278115 100 568080 100Disability statusNon-disabled 253710 91.2 525755 92.5Disabled 24440 8.8 42630 7.5Total 278150 100 568390 100DSA take-upDisabled: receives DSA 10795 46.9 18165 44.4
Disabled: does not receive DSA 12210 53.1 22735 55.6
Total 23005 100 40905 100EthnicityWhite 172420 73.6 333245 82.8BME total 61925 26.4 69150 17.2Black 27805 11.9 10860 2.7Asian 21310 9.1 33895 8.4Chinese 1325 0.6 6200 1.5Mixed 7785 3.3 13560 3.4Other 3695 1.6 4640 1.2All UK-domiciled students
234345 100 402400 100
GenderFemale 162235 58.3 305090 53.7Male 115915 41.7 262990 46.3Total 278150 100 568080 100

412
University Alliance
No affiliation
No. % No. %Age21 and under 292320 58.1 337175 45.122-25 71600 14.2 113050 15.126-35 72680 14.4 147275 19.736 and over 66785 13.3 150470 20.1Total 503385 100 747970 100Disability statusNon-disabled 456965 90.8 668270 89.3Disabled 46450 9.2 79855 0.7Total 503415 100 748125 100DSA take-upDisabled: receives DSA 23250 51.9 30285 39.6
Disabled: does not receive DSA 21575 48.1 46160 60.4
Total 44825 100 76445 100EthnicityWhite 339700 79.7 507040 81.6BME total 86610 20.3 114650 18.4Black 27645 6.5 38410 6.2Asian 38575 9.0 48705 7.8Chinese 3235 0.8 4200 0.7Mixed 12415 2.9 16915 2.7Other 4740 1.1 6415 1.0All UK-domiciled students
426310 100 621690 100
GenderFemale 273445 54.3 435450 58.2Male 229860 45.7 312675 41.8Total 503305 100 748125 100

Percentages based on total number of students minus those whose sector group of institution, age group, DSA take-up, ethnic group or gender is unknown.
All students in sector group of institution by gender
Female Male1994 Group 55.2% 44.8%GuildHE 59.7% 40.3%Million+ 58.3% 41.7%Russell Group 53.7% 46.3%University Alliance 54.3% 45.7%No affiliation 58.2% 41.8%
All students in sector group of institution by age group
21 and under
22-25 26-35 36 and over
1994 Group 53.2% 16.9% 16.7% 13.2%
GuildHE 63.3% 12.5% 11.9% 12.3%
Million+ 50.7% 15.6% 17.0% 16.8%
Russell Group 61.1% 17.7% 12.6% 8.6%
University Alliance 58.1% 14.2% 14.4% 13.3%
No affiliation 45.1% 15.1% 19.7% 20.1%
All UK-domiciled students in sector group of institution by ethnic group
413

White Black Asian Chinese Mixed Other1994 Group 76.7 7.9 8.3 1.1 4.4 1.7
GuildHE 85.9 5.4 4.7 0.4 3.0 0.6Million+ 73.6 11.9 9.1 0.6 3.3 1.6Russell Group 82.8 2.7 8.4 1.5 3.4 1.2
University Alliance 79.7 6.5 9.0 0.8 2.9 1.1
No affiliation 81.6 6.2 7.8 0.7 2.7 1.0
All students in sector group of institution by disability status
Non-disabled Disabled1994 Group 90.7% 9.3%GuildHE 85.8% 14.2%Million+ 91.2% 8.8%Russell Group 92.5% 7.5%University Alliance 90.8% 9.2%No affiliation 89.3% 10.7%
All students in sector group of institution by DSA take-up
Receives DSA Does not receive DSA
1994 Group 46.7% 53.3%GuildHE 61.8% 38.2%Million+ 46.9% 53.1%Russell Group 44.4% 55.6%University Alliance 51.9% 48.1%No affiliation 39.6% 60.4%
414

415

6 Other protected characteristics
The Equality Act 2010 extended the number of protected characteristics to cover new areas including gender identity, religion and belief and sexual orientation.
Changes to the HESA student record for 2012/13 allowed institutions to return information in these areas on an optional basis. This section presents high-level findings on collection and monitoring rates. Because these are currently voluntary to return, we do not yet have a national demographic picture of the student population in relation to gender identity, religion and belief or sexual orientation.
ECU encourages institutions to collect and return this data where appropriate. Once the data begins to be captured and the numbers become reliable, ECU hopes to provide further detail on these characteristics in future reports.
Further guidance can be found at: www.ecu.ac.uk/guidance-resources/using-data-and-
evidence/collecting-data www.ecu.ac.uk/guidance-resources/using-data-and-
evidence/introducing-new-categories www.ecu.ac.uk/guidance-resources/using-data-and-
evidence/encouraging-disclosure-equality-info
About this dataData on a student record is said to be returned if the institution provided any information to HESA about gender identity, religion and belief or sexual orientation. This includes where a student selected prefer not to say or refused to provide the information about the characteristic in
416
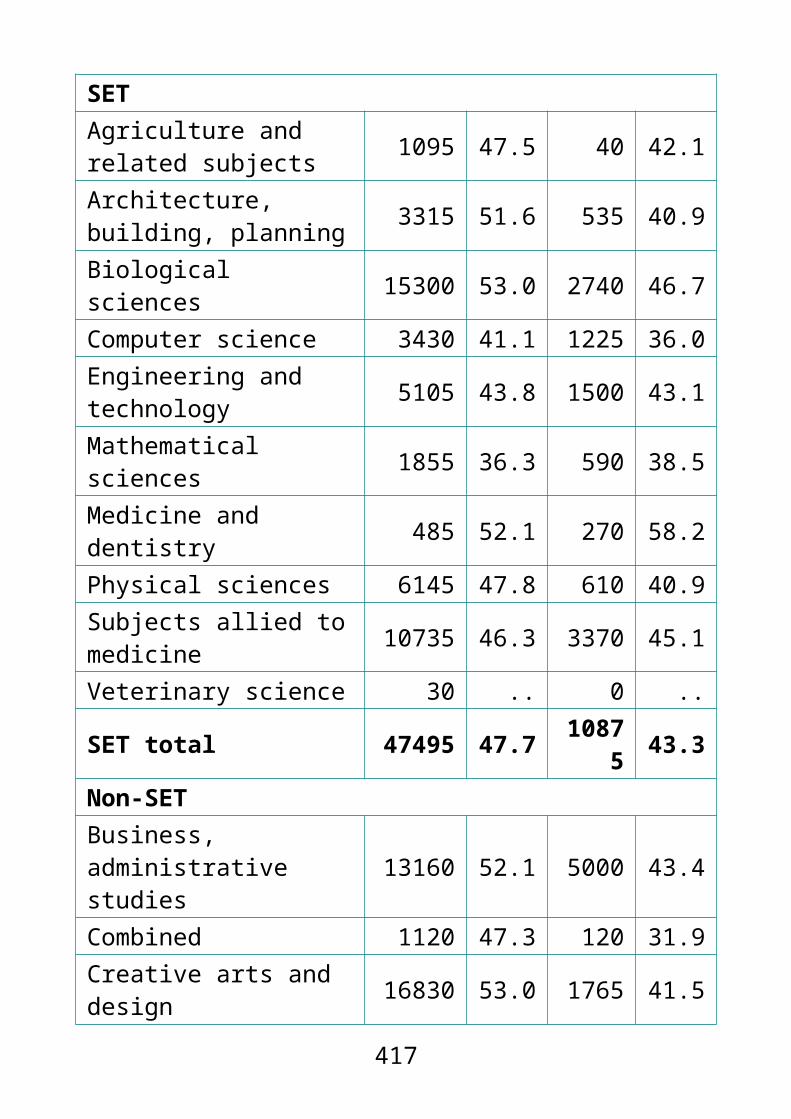
question. Where a student record was returned to HESA without data, this section reports it as blank.
It is not possible to determine from the data presented whether the blank student records were due to the question being unanswered or unasked.
Gender identity
A small number of institutions reported a much higher than average proportion of their students to have disclosed a gender identity different to the gender they were assigned at birth. This suggests that there may have been some data collection issues ie individual institutional questions may have been phrased in a way that led to confusion among student participants. Gender identity
Overall, 73 of 161 institutions (45.3%) returned student data on gender identity to HESA. Similar proportions of English and Scottish institutions returned this data (between 44% and 45%).
Two thirds (66.7%) of Welsh institutions returned this data, compared with no Northern Irish institutions.
417

6.1 Institutional returns for gender identity information by country of institution
Returned data Did not return data TotalNo. HEI % No. HEI % No.
HEIEngland 59 45.4 71 54.6 130Northern Ireland 0 0.0 4 100 4
Scotland 8 44.4 10 55.6 18Wales 6 66.7 3 33.3 9All institutions 73 45.3 88 54.7 161
HEI higher education institution
Institutional returns for gender identity by country of institution
Returned data Did not return dataEngland 45.4% 54.6%Northern Ireland 100.0%Scotland 44.4% 55.6%Wales 66.7% 33.3%UK 45.3% 54.7%
It is clear from the data that institutions have taken different approaches to monitoring students’ gender identity, with institutional return rates concentrated on either extreme of the scale. Of the 73 institutions who returned this data to HESA, 30.2% had returned data for up to 20% of their students while 35.6% had done so for 80% or more of their students.
418

InstitutionsNo. %* %^
0% (no returns) 88 54.7 n/aUp to 10% 21 13.0 28.810%-20% 1 0.6 1.420%-30% 4 2.5 5.530%-40% 6 3.7 8.240%-50% 3 1.9 4.150%-60% 4 2.5 5.560%-70% 5 3.1 6.870%-80% 3 1.9 4.180%-90% 12 7.5 16.4Over 90% 14 8.7 19.2All institutions 161 100 100
Institutional return rates on gender identity
0% (no returns) 88Up to 10% 2110%-20% 120%-30% 430%-40% 640%-50% 350%-60% 460%-70% 570%-80% 380%-90% 12Over 90% 14
It is not possible to determine from the data presented whether students for whom there was no information (blank) were asked the question and did not provide a response or were not asked the question.
419
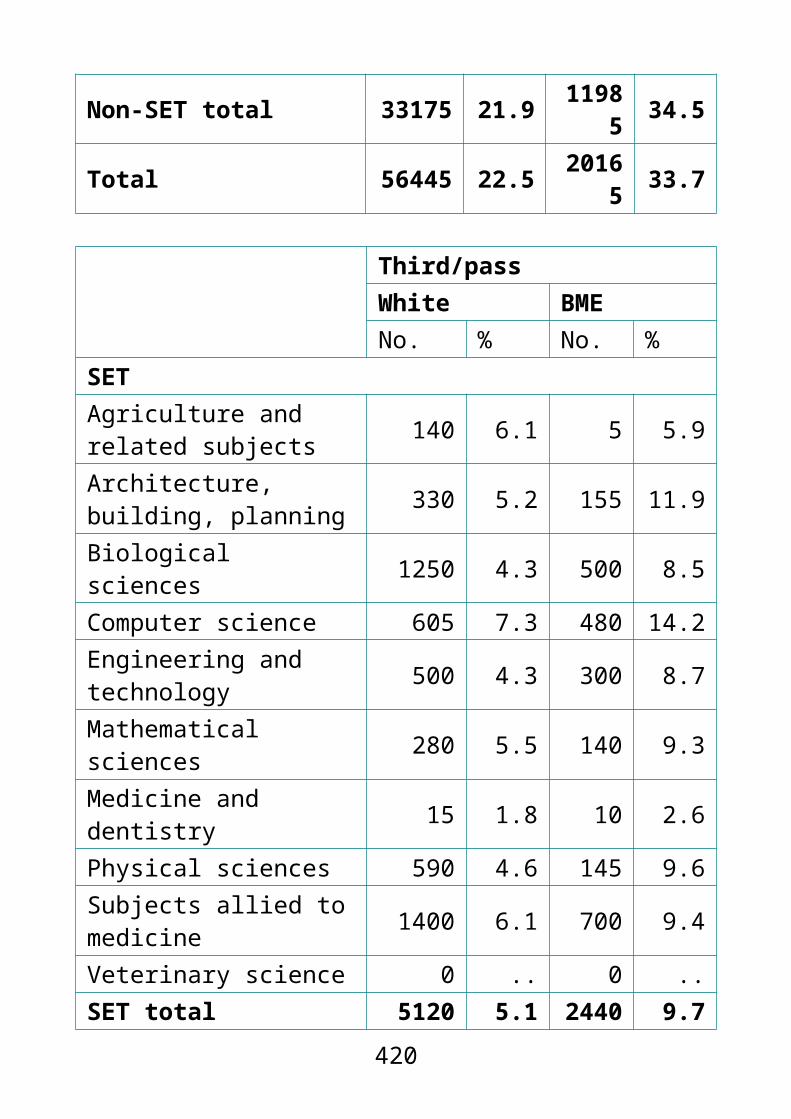
Of the students in institutions that monitored gender identity, 43.3% provided information, 4.3% refused and for 52.4% the data were blank. This means that among students in institutions that returned gender identity data to HESA, at least 47.6% of students were given the option to return data on their gender identity.
6.3 Gender identity disclosure rates in institutions monitoring for gender identity
StudentsNo. %
Provided information 364635 43.3Refuse to provide 35920 4.3Blank 441350 52.4Total 841900 100
Gender identity disclosure rates in institutions monitoring for gender identity
Provided information 43.3Refuse to provide 52.4Blank 4.3
Gender identity data was returned to HESA for 17.1% of students. However, a small number of institutions reported a much higher than average proportion of their students disclosing a gender identity different to the gender they were assigned at birth. This suggests there may have been some issues with data collection. For example, the question could have been phrased in a way that led to confusion among participants.
420
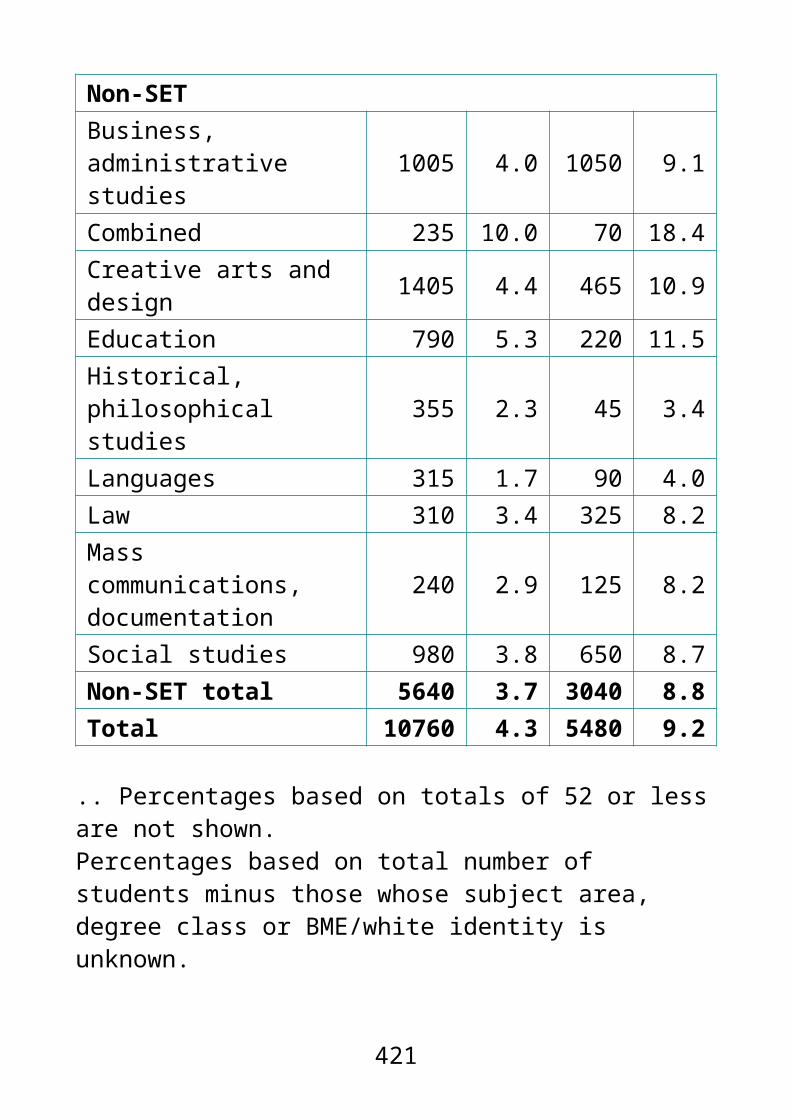
While the relatively low return rate alongside possible data anomalies means that we do not yet have an accurate picture of gender identity in the student population, the data is presented here in order to give a sense of the question asked and possible responses.
6.4 All students by gender identity
ResponseNo. %
Gender identity is the same 357175 15.3Gender identity is different 7455 0.3Information refused 35920 1.5Blank 1939725 82.9Total 2340275 100
All students by gender identity
Gender identity is the same 15.3Gender identity is different 0.3Information refused 1.5Blank 82.9
Religion and belief
72 out of 161 institutions returned religion and belief data on students to HESA (44.7%). Return rates were markedly higher among Welsh institutions (77.8%), and lower in Scottish (38.9%) and Northern Irish institutions (0.0%). The proportion of English institutions returning this data was broadly in line with the national average (44.6%).
421

6.5 Institutional returns for religion and belief information by country of institution
Returned data Did not return data TotalNo. HEI % No. HEI % No. HEI
England 58 44.6 72 55.4 130Northern Ireland 0 0.0 4 100 4
Scotland 7 38.9 11 61.1 18Wales 7 77.8 2 22.2 9All institutions
72 44.7 89 55.3 161
HEI higher education institution
Institutional returns for religion and belief by country of institution
Returned data Did not return dataEngland 44.6 55.4Northern Ireland 100.0Scotland 38.9 61.1Wales 77.8 22.2UK 44.7 55.3
Some institutions returned religion and belief data for the majority of their students, while others provided information for only a small proportion, indicating that monitoring approaches varied by institution.
Of the 73 institutions who returned student religion and belief data to HESA, 20 institutions (27.4%) returned data on this characteristic for up to 20% of their students, while
422

29 institutions (39.7%) returned data for 80% or more of their students.
InstitutionsNo. %* %^
0% (no returns) 88 54.7 n/aUp to 10% 18 11.2 24.710%-20% 2 1.2 2.720%-30% 3 1.9 4.130%-40% 7 4.3 9.640%-50% 3 1.9 4.150%-60% 2 1.2 2.760%-70% 6 3.7 8.270%-80% 3 1.9 4.180%-90% 12 7.5 16.4Over 90% 17 10.6 23.3All institutions 161 100 100
Institutional return rates on religion and belief
0% (no returns) 88Up to 10% 1810%-20% 220%-30% 330%-40% 740%-50% 350%-60% 260%-70% 670%-80% 380%-90% 12Over 90% 17
Of the students in institutions that monitored religion and belief, 36.9% provided information, 6.0% refused and for
423

57.1% the data were blank. This means that among students in institutions that returned religion and belief data to HESA, at least 42.9% of students were given the option to return data on their religion and belief.
6.7 Religion and belief disclosure rates in institutions monitoring for religion and belief
StudentsNo. %
Provided information 394635 36.9Refuse to provide 64430 6.0Blank 610550 57.1Total 1069615 100
Religion and belief disclosure rates in institutions monitoring for religion and belief
Provided information 36.9Refuse to provide 6.0Blank 57.1
Overall, religion and belief information was unknown (blank) for 80.4% of all students studying in higher education. This data therefore is not indicative of numbers and trends in student religion and belief, but is presented in order to give a sense of the questions asked and possible responses.
6.8 All students by religion and belief
ResponseNo. %
No religion 170900 7.3Buddhist 5905 0.3
424
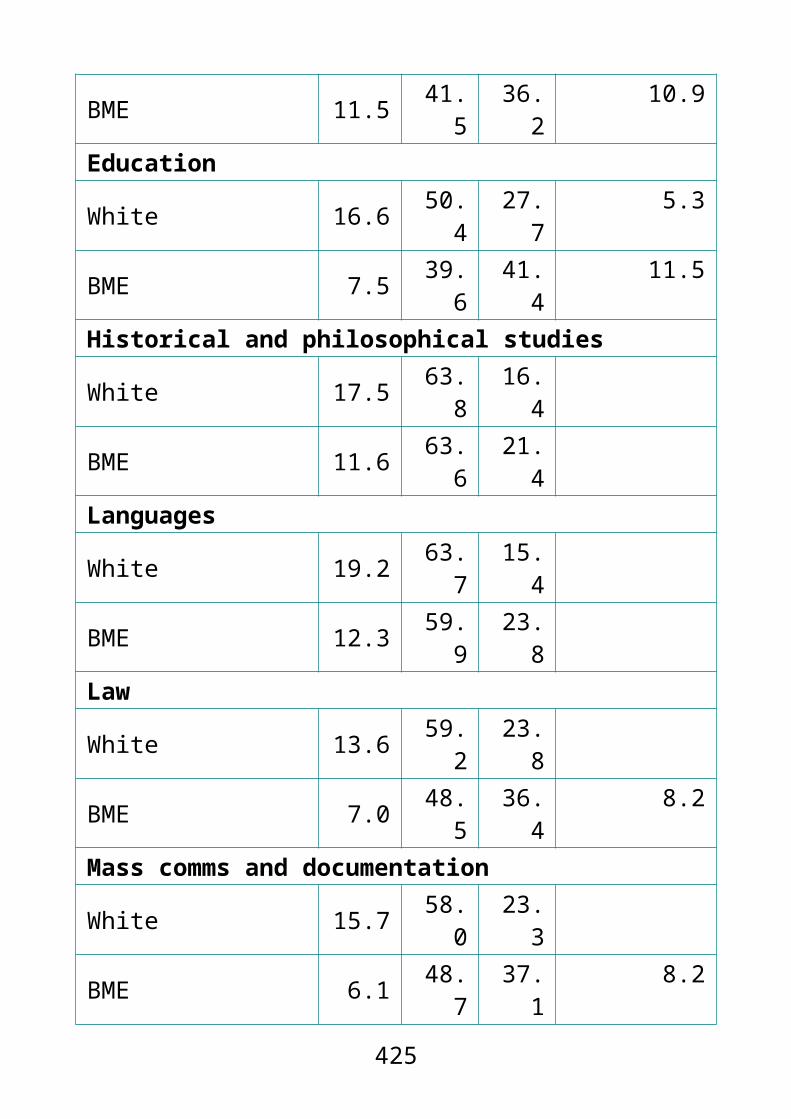
Christian 163555 6.9Hindu 9240 0.4Jewish 2020 0.1Muslim 26930 1.2Sikh 2945 0.1Spiritual 4400 0.2Any other religion or belief 8740 0.4Information refused 64430 2.8Blank 1881210 80.4Total 2340275 100All students by religion and belief
No religion 7.3Buddhist 0.3Christian 6.9Hindu 0.4Jewish 0.1Muslim 1.2Sikh 0.1Spiritual 0.2Any other religion or belief 0.4Information refused 2.8Blank 82.9
Sexual orientation
Overall, 75 of 161 institutions (46.6%) returned student data on sexual orientation to HESA. Data return rates varied by country: 77.8% of Welsh institutions returned this data to HESA, compared with no Northern Irish institutions.
6.9 Institutional returns for sexual orientation information by country of institution
425

Returned data Did not return data TotalNo. HEI % No. HEI % No.
HEIEngland 60 46.2 70 53.8 130Northern Ireland 0 0.0 4 100 4
Scotland 8 44.4 10 55.6 18Wales 7 77.8 2 22.2 9All institutions 75 46.6 86 53.4 161HEI higher education institution
Institutional returns for sexual orientation by country of institution
Returned data Did not return dataEngland 46.2% 53.8%Northern Ireland 100.0%Scotland 44.4% 55.6%Wales 77.8% 22.2%UK 46.6% 53.4%
It is clear from the data that institutions have taken different approaches to monitoring students’ sexual orientation, with some institutions returning data for a small proportion of their students and others returning data for close to 100% of their students.
Of the 75 institutions who returned student sexual orientation data to HESA, 23 institutions (30.7%) returned data on this characteristic for up to 20% of their students, while 27 institutions (36.0%) returned data for 80% or more of their students.
426

6.10 Institutional return rates on sexual orientation
InstitutionsNo. %* %^
0% (no returns) 86 53.4 n/aUp to 10% 20 12.4 26.710%-20% 3 1.9 4.020%-30% 5 3.1 6.730%-40% 5 3.1 6.740%-50% 3 1.9 4.050%-60% 3 1.9 4.060%-70% 6 3.7 8.070%-80% 3 1.9 4.080%-90% 14 8.7 18.7Over 90% 13 8.1 17.3All institutions 161 100 100
* within all HEIs, the percentage in each return rate band (compare vertically)
^ within HEIs that returned sexual orientation data, the percentage of HEIs in each return rate band (compare vertically)
Institutional return rates on sexual orientation
0% (no returns) 86Up to 10% 2010%-20% 320%-30% 530%-40% 540%-50% 350%-60% 360%-70% 6
427
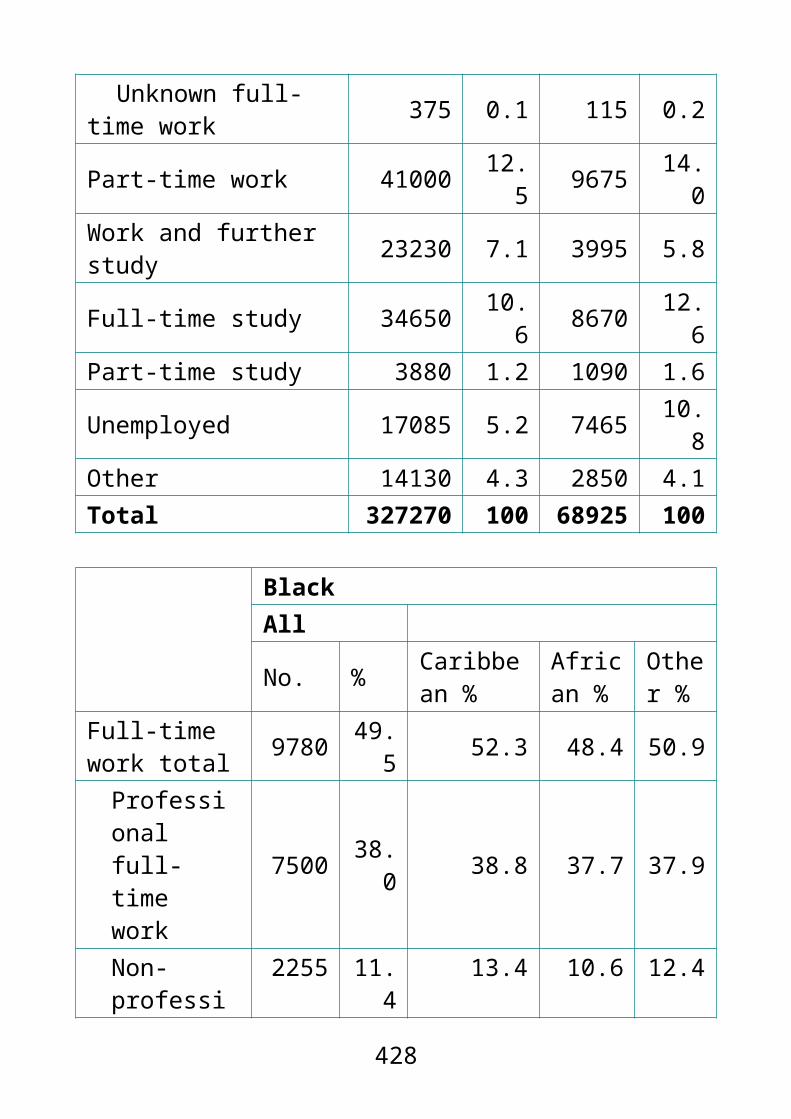
70%-80% 380%-90% 14Over 90% 13
Of the students in institutions that monitored for sexual orientation, 34.4% provided information, 5.7% refused and for 59.9% the data field was blank. This means that among students in institutions that returned sexual orientation data to HESA, at least 40.1% of students were given the option to return data on their sexual orientation.
6.11 Sexual orientation disclosure rates in institutions monitoring for sexual orientation
StudentsNo. %
Provided information 365875 34.4Refuse to provide 60205 5.7Blank 637560 59.9Total 1063645 100
Sexual orientation disclosure rates in institutions monitoring for sexual orientation
Provided information 34.4Refuse to provide 5.7Blank 59.9
Data on sexual orientation was returned to HESA for 18.2% of all students. For this reason, no accurate conclusions can be drawn about the number of, or trends among, students who identify as bisexual, gay, lesbian, heterosexual or other, as yet. The data is presented in order to give a sense of the question asked and possible responses.
428

6.12 All students by sexual orientation
ResponseNo. %
Bisexual 5930 0.3Gay men 4780 0.2Gay women/lesbian 2375 0.1Heterosexual 345545 14.8Other 7245 0.3Information refused 60205 2.6Blank 1914195 81.8Total 2340275 100
All students by sexual orientation
Bisexual 0.3Gay men 0.2Gay women/lesbian 0.1Heterosexual 14.8Other 0.3Information refused 2.6Blank 82.9
429

Index
Overview
0.1 All/first year students by country of institution........240.2 Profile of all/first year students over time..................250.3 All/first year students by degree level and mode......260.4 All students by subject area and degree level..........270.5 First year students by subject area and degree level31
0.6 UK-domiciled full-time first degree entrants by continuation category........................................................34UK-domiciled full-time first degree entrants by continuation category................................................................................350.7 First degree undergraduate qualifiers by country of institution and degree class..............................................35First degree undergraduate qualifiers in countries of institution by degree class....................................................360.8 First degree undergraduate qualifiers by subject area and degree class........................................................37First degree undergraduate qualifiers in subject areas by degree class.........................................................................390.9 DLHE leavers by leaving destination.........................41DLHE leavers by leaving destination...................................41
1 Age
1.1 All/first year students by country of institution and age group............................................................................45All/first year students in countries of institution by age group....................................................................................461.2 Profile of all students over time by age group..........47All students over time by age group.....................................48
430

1.3 All students by degree level, domicile category and age group............................................................................491.4 All students by degree level, mode, and age group51
All students in domicile categories and degree levels by age group.............................................................................54All full-time/part-time students in degree levels by age group....................................................................................561.5 First year students by degree level, mode and age group...................................................................................57First year full-time/part-time students...................................601.6 All students by subject area and age group..............611.7 First year students by subject area and age group64
All students in subject areas by age group..........................68First year students in subject areas by age group...............691.8 All undergraduates by subject area, degree level and age group.....................................................................711.9 All postgraduates by subject area, degree level and age group............................................................................76All students in SET subject areas and degree levels by age group....................................................................................81All students in non-SET subject areas and degree levels by age group.............................................................................831.10 First year undergraduates by subject area, degree level and age group............................................................861.11 First year postgraduates by subject area, degree level and age group............................................................911.12 UK-domiciled full-time first degree entrants by continuation category and age group..............................96UK-domiciled full-time first degree entrants in age groups by continuation category......................................................971.13 First degree undergraduate qualifiers by degree class, mode and age group...............................................98
431

Full-time/part-time first degree undergraduate qualifiers in age groups by degree class.................................................991.14 First degree undergraduate qualifiers by country of institution, degree class and age group....................100First degree undergraduate qualifiers in countries of institution and age groups by degree class........................1011.15 First degree undergraduate qualifiers by subject area, degree class and age group..................................103First degree undergraduate qualifiers in SET subject areas and age groups by degree class........................................107First degree undergraduate qualifiers in non-SET subject areas and age groups by degree class..............................1091.16 DLHE leavers by leaving destination and age group.................................................................................112DLHE leavers in age groups by leaving destination...........113
2 Disability
2.1 All/first year students by country of institution and disability status................................................................1162.2 All/first year disabled students by country of institution and DSA take-up............................................116All/first year students in countries of institution by disability status..................................................................................117All/first year disabled students in countries of institution by DSA take-up.......................................................................1182.3 Profile of all/first year students over time by disability status................................................................119All/first year students over time by disability status............1202.4 Profile of all/first year disabled students over time by DSA take-up.................................................................121All/first year disabled students over time by DSA take-up...........................................................................................1222.5 Profile over time of disabled students by impairment type................................................................124
432

Profile over time of disabled students by impairment type...........................................................................................1272.6 All students by degree level, domicile category and disability status................................................................128All students in domicile categories and degree levels by disability status...................................................................1292.7 All students by degree level, mode and disability status.................................................................................1312.8 Disabled students by degree level, mode and DSA take-up...............................................................................132All full-time/part-time students in degree levels by disability status..................................................................................133All full-time/part-time disabled students in degree levels by DSA take-up.......................................................................1342.9 All/disabled students by degree level and impairment type................................................................135All disabled students in degree levels by impairment type...........................................................................................1372.10 First year students by degree level, mode and disability status................................................................1392.11 Disabled first year students by degree level, mode and DSA take-up...............................................................141First year full-time/part-time students in degree levels by disability status...................................................................142First year full-time/part-time disabled students in degree levels by DSA take-up........................................................1432.12 All/first year students by subject area, disability status and DSA take-up...................................................144All students in subject areas by disability status................149All disabled students in subject areas by DSA take-up......1502.14 All postgraduates by subject area, degree level, disability status and DSA take-up..................................157All students in SET subject areas and degree levels by disability status...................................................................161
433

All students in non-SET subject areas and degree levels by disability status...................................................................1642.15 First year students by subject area, degree level and disability status.........................................................1662.16 UK-domiciled full-time first degree entrants by continuation category and disability status..................171UK-domiciled disabled/non-disabled full-time first degree entrants by continuation category......................................1712.17 First degree undergraduate qualifiers by degree class, disability status, DSA take-up and impairment type....................................................................................172Disabled full-time first degree undergraduate qualifiers in impairment types by degree class......................................1732.18 First degree undergraduate qualifiers by country of institution, degree class, disability status and DSA take-up...............................................................................175Disabled/non-disabled first degree undergraduate qualifiers in countries of institution and DSA status by degree class...........................................................................................1762.19 First degree undergraduate qualifiers by subject area, degree class and disability status........................178Disabled/non-disabled first degree undergraduate qualifiers in SET subject area by degree class..................................182Disabled/non-disabled first degree undergraduate qualifiers in non- SET subject area by degree class.........................1842.20 DLHE leavers by leaving destination, disability status and impairment type.............................................185Disabled/non-disabled DLHE leavers by leaving destination...........................................................................................189
3 Ethnicity
3.1 All/first year UK-domiciled students by country of institution and ethnic group............................................193
434

3.2 Profile of all UK-domiciled students over time by ethnic group......................................................................200All UK-domiciled students over time by ethnic group.........2013.3 All/first year BME UK-domiciled students by ethnic group.................................................................................201All/first year BME UK-domiciled students by ethnic group...........................................................................................2023.4 All UK students by degree level, mode and ethnic group.................................................................................203All full-time/part-time UK-domiciled students by BME/white identity................................................................................210All full-time/part-time UK-domiciled students in degree levels by BME/white identity...............................................2103.5 UK first years by degree level, mode and ethnic group.................................................................................211First year full-time/part-time UK-domiciled students by BME/white identity..............................................................215First year full-time/part-time UK-domiciled students in degree levels by BME/white identity..................................2153.6 All UK-domiciled students by subject area and ethnic group......................................................................216All UK-domiciled students in SET subject areas by ethnic group..................................................................................222All UK-domiciled students in non-SET subject areas by ethnic group.......................................................................2233.7 First year UK-domiciled students by subject area and ethnic group..............................................................2243.8 All UK-domiciled students by subject area, degree level and BME/white identity...........................................229All UK-domiciled students in SET subject areas and degree levels by BME/white identity...............................................234All UK-domiciled students in non-SET subject areas and degree levels by BME/white identity..................................2363.9 First year UK-domiciled students by subject area, degree level and BME/white identity..............................239
435
3.10 UK-domiciled full-time first degree entrants by continuation category and ethnic group........................244UK-domiciled full-time first degree entrants in ethnic groups by continuation category....................................................2453.11 UK-domiciled first degree undergraduate qualifiers by country of institution, degree class and ethnic group......................................................................247BME/white UK-domiciled first degree undergraduate qualifiers in countries of institution by degree class...........2503.12 Profile of UK-domiciled first degree UG qualifiers receiving a first/2:1 over time by ethnic group.............251UK-domiciled first degree undergraduate qualifiers receiving a first/2:1 by ethnic group over time....................2533.13 UK-domiciled first degree undergraduate qualifiers by degree class and ethnic group.................254UK-domiciled first degree undergraduate qualifiers in ethnic groups by degree class......................................................2563.14 UK-domiciled first degree undergraduate qualifiers in SET subjects by degree class and ethnic group.................................................................................2573.15 UK-domiciled first degree undergraduate qualifiers in non-SET subjects by degree class and ethnic group......................................................................2593.16 UK-domiciled first degree undergraduate qualifiers by subject area, degree class and BME/white identity...............................................................................261BME/white UK-domiciled first degree undergraduate qualifiers in SET subject areas by degree class................266BME/white UK-domiciled first degree undergraduate qualifiers in non-SET subject areas by degree class.........2673.17 UK-domiciled DLHE leavers by leaving destination and ethnic group..............................................................269White UK-domiciled DLHE leavers by leaving destination...........................................................................................273
436
BME UK-domiciled DLHE leavers by leaving destination...........................................................................................274
437

4 Gender
4.1 All/first year students by country of institution and gender...............................................................................276All/first year students in countries of institution by gender...........................................................................................2774.2 Profile of all/first year students over time by gender278
All/first year students over time by gender.........................2794.3 All students by degree level, domicile category and gender...............................................................................280All/first year students over time by gender.........................2814.4 All students by degree level, mode and gender......282All full-time/part-time students in degree levels by gender...........................................................................................2834.5 First year students by degree level, mode and gender...............................................................................284First year full-time/part-time students in degree levels by gender................................................................................2854.6 All students by subject area and gender.................286All students in subject areas by gender.............................2884.7 First year students by subject area and gender.....289First year students in subject areas by gender..................2914.8 All students by subject area, degree level and gender...............................................................................292All students in SET subject areas and degree levels by gender................................................................................296All students in non-SET subject areas and degree levels by gender................................................................................2984.9 First year students by subject area, degree level and gender........................................................................3004.10 UK-domiciled full-time first degree entrants by continuation category and gender.................................304UK-domiciled female/male full-time first degree entrants by continuation category.........................................................304
438
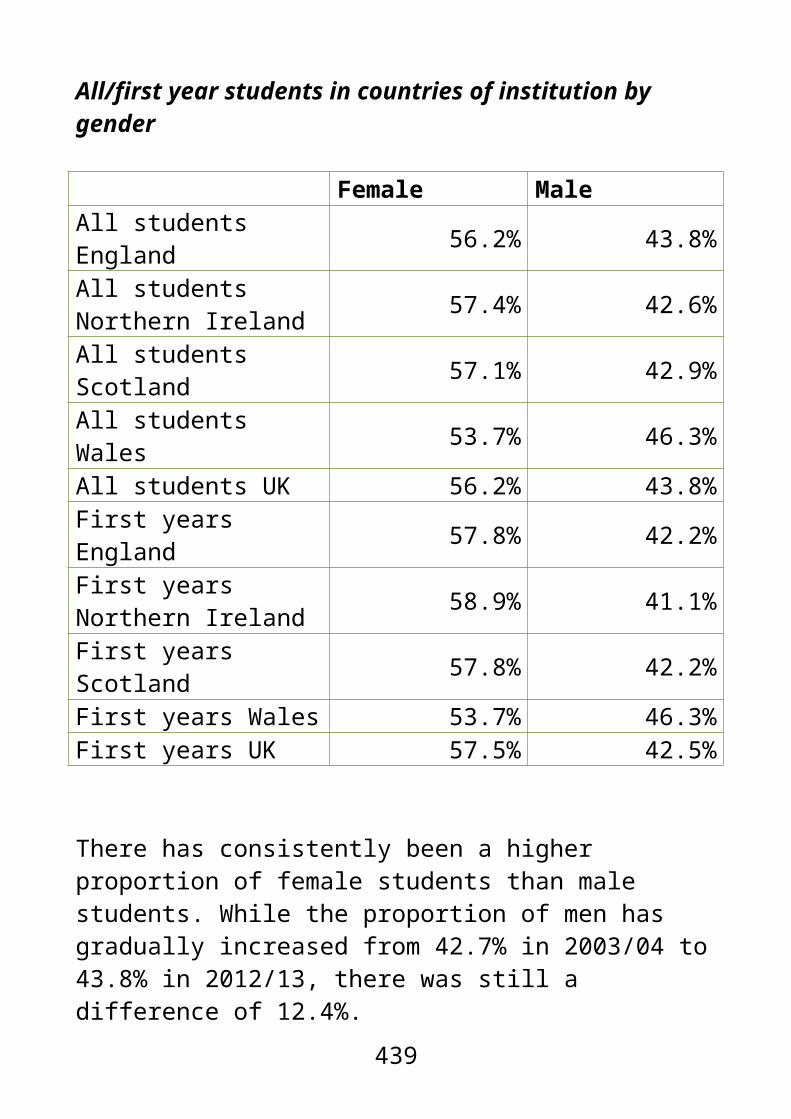
4.11 First degree undergraduate qualifiers by country of institution, degree class and gender.........................305Female/male first degree undergraduate qualifiers in countries of institution by degree class..............................3064.12 First degree undergraduate qualifiers by subject area, degree class and gender........................................308Female/male first degree undergraduate qualifiers in SET subject areas by degree class............................................312Female/male first degree undergraduate qualifiers in non-SET subject areas by degree class....................................3134.13 DLHE leavers by leaving destination and gender314
Female/male DLHE leavers by leaving destination............315
5 Multiple identities
5.1 All students by disability status, impairment type and age group...................................................................318Disabled students in impairment types by age group........320Disabled students in age groups by impairment type........3205.2 UK-domiciled students by age group and ethnic group.................................................................................321UK-domiciled students in ethnic groups by age group.......323UK-domiciled students in age groups by ethnic group.......3235.3 All students by age group and gender.....................324Students in age groups by gender.....................................324Female/male students by age group..................................3245.4 UK-domiciled students by disability status and ethnic group......................................................................325UK-domiciled students in ethnic groups by disability status...........................................................................................326Disabled/non-disabled students by ethnic group...............3265.5 UK-domiciled disabled students by impairment type and ethnic group..............................................................327
439

UK-domiciled disabled students in impairment types by ethnic group.......................................................................331UK-domiciled disabled students in ethnic groups by impairment type..................................................................3315.6 All students by disability status, impairment type and gender........................................................................333Disabled students in impairment types by gender.............334Female/male disabled students by impairment type..........3355.7 UK-domiciled students by ethnic group and gender336
UK-domiciled students in ethnic groups by gender............336UK-domiciled female/male students by ethnic group.........3375.8 First degree undergraduate qualifiers by degree class, disability status and age group...........................338Disabled/non-disabled first degree undergraduate qualifiers in age groups by degree class...........................................3405.9 UK-domiciled first degree undergraduate qualifiers by degree class, BME/white identity and age group.....341UK-domiciled BME/white first degree undergraduate qualifiers in age groups by degree class............................343Female/male first degree undergraduate qualifiers in age groups by degree class......................................................3455.11 UK-domiciled first degree undergraduate qualifiers by degree class, disability status and ethnic group.................................................................................346Non-disabled first degree undergraduate qualifiers in ethnic groups by degree class......................................................3495.12 First degree undergraduate qualifiers by degree class, gender and disability status.................................350Disabled first degree undergraduate qualifiers in ethnic groups by degree class......................................................3515.13 UK-domiciled first degree undergraduate qualifiers by degree class, gender and ethnic group...352UK-domiciled female first degree undergraduate qualifiers in ethnic groups by degree class........................................354
440

UK-domiciled male first degree undergraduate qualifiers in ethnic groups by degree class...........................................3555.14 All students by sector group of institution, age group, disability status, DSA take-up, ethnic group and gender...............................................................................356All students in sector group of institution by gender...........359All students in sector group of institution by age group......360All UK-domiciled students in sector group of institution by ethnic group.......................................................................360All students in sector group of institution by disability status...........................................................................................360All students in sector group of institution by DSA take-up...........................................................................................361
6 Other protected characteristics
6.1 Institutional returns for gender identity information by country of institution..................................................364Institutional returns for gender identity by country of institution............................................................................364Institutional return rates on gender identity........................3656.3 Gender identity disclosure rates in institutions monitoring for gender identity........................................366Gender identity disclosure rates in institutions monitoring for gender identity..............................................................3666.4 All students by gender identity.................................367All students by gender identity...........................................3676.5 Institutional returns for religion and belief information by country of institution.............................368Institutional returns for religion and belief by country of institution............................................................................368Institutional return rates on religion and belief...................3696.7 Religion and belief disclosure rates in institutions monitoring for religion and belief...................................370
441
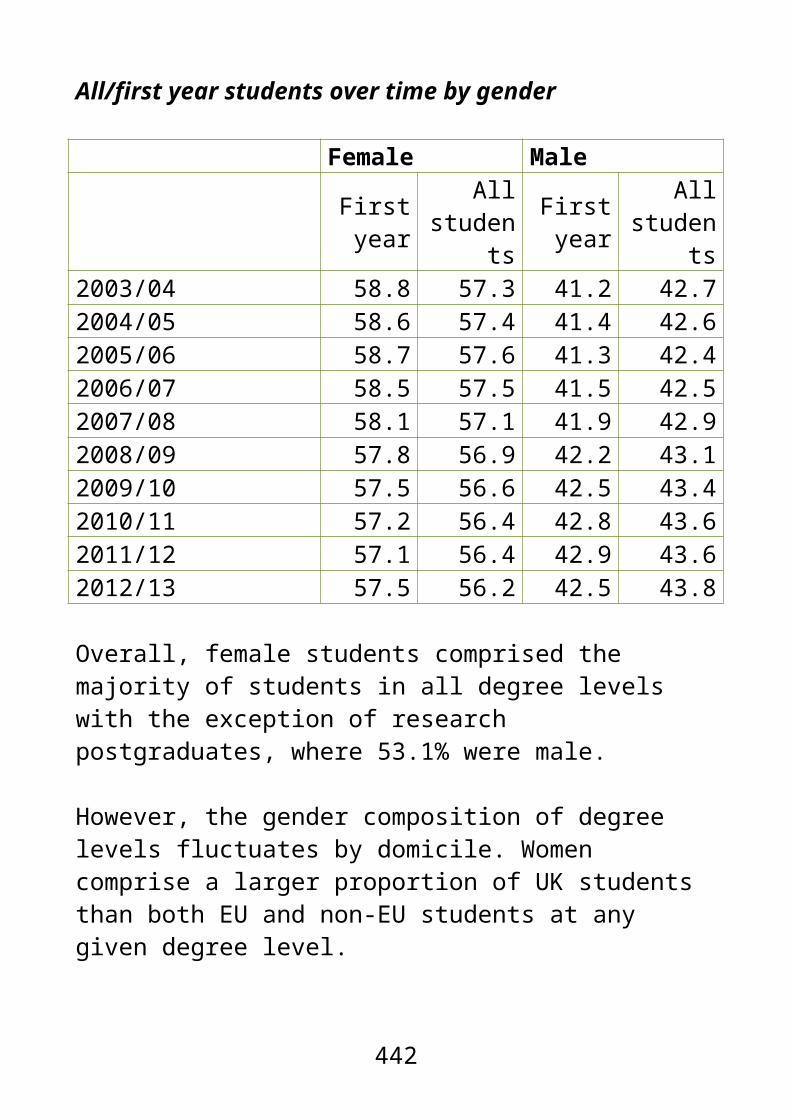
Religion and belief disclosure rates in institutions monitoring for religion and belief........................................3706.8 All students by religion and belief............................370All students by religion and belief.......................................3716.9 Institutional returns for sexual orientation information by country of institution.............................371Institutional returns for sexual orientation by country of institution............................................................................3726.10 Institutional return rates on sexual orientation.....373Institutional return rates on sexual orientation...................3736.11 Sexual orientation disclosure rates in institutions monitoring for sexual orientation...................................374Sexual orientation disclosure rates in institutions monitoring for sexual orientation..........................................................3746.12 All students by sexual orientation..........................375All students by sexual orientation.......................................375
442
Equality Challenge Unit
ECU works to further and support equality and diversity for staff and students in higher education across all four nations of the UK, and in colleges in Scotland.
ECU works closely with colleges and universities to seek to ensure that staff and students are not unfairly excluded, marginalised or disadvantaged because of age, disability, gender identity, marital or civil partnership status, pregnancy or maternity status, race, religion or belief, sex, sexual orientation or through any combination of these characteristics or other unfair treatment.
Providing a central source of expertise, research, advice and leadership, we support institutions in building a culture that provides equality of both opportunity and outcome, promotes good relations, values the benefits of diversity and provides a model of equality for the wider UK society.
Did you find this publication useful?
Your feedback will help us to improve and develop our publications and resources, and help us to ensure that we produce materials that support your work.
Please take a few minutes to complete our publications feedback survey: www.surveymonkey.com/s/ecu-publications-feedback
You can also email us with your feedback: [email protected]
443

Equality Challenge Unit
7th floor, Queen’s House55/56 Lincoln’s Inn FieldsLondon, WC2A 3LJ
Telephone 020 7438 1010Fax 020 7438 1011Email [email protected]
© Equality Challenge Unit 2014
ECU’s publications are produced free of charge to the UK HE sector and also for colleges in Scotland. Information can be reproduced as long as it is accurate, the source is identified and it will not be used for profit. Alternative formats are available:
Email [email protected]
Company limited by guarantee. Registered in England and Wales, No. 05689975.
Charity no. 1114417 (England and Wales) and SC043601 (Scotland).
This version of ‘Equality in higher education: statistical report 2014 - Part 2: students’ has been formatted for use with an On-Screen-Reader (OSR). Although every effort is made to ensure an exact transcript of the original document some data may appear differently in this transcribed version.
444