Introduction - University of Central Florida€¦ · Web viewLiterature Review. The first bicycle...
32
Analyzing Bicycle Sharing System User Destination Choice Preferences: An Investigation of Chicago’s Divvy System Ahmadreza Faghih-Imani PhD Student Department of Civil Engineering and Applied Mechanics McGill University Ph: 514-398-6823, Fax: 514-398-7361 E-mail: [email protected] Naveen Eluru* Assistant Professor Department of Civil Engineering and Applied Mechanics McGill University Ph: 514-398-6823, Fax: 514-398-7361 E-mail: [email protected] *Corresponding author
Transcript of Introduction - University of Central Florida€¦ · Web viewLiterature Review. The first bicycle...

Analyzing Bicycle Sharing System User Destination Choice Preferences: An Investigation of Chicago’s Divvy System
Ahmadreza Faghih-ImaniPhD Student
Department of Civil Engineering and Applied MechanicsMcGill University
Ph: 514-398-6823, Fax: 514-398-7361E-mail: [email protected]
Naveen Eluru*Assistant Professor
Department of Civil Engineering and Applied MechanicsMcGill University
Ph: 514-398-6823, Fax: 514-398-7361E-mail: [email protected]
*Corresponding author
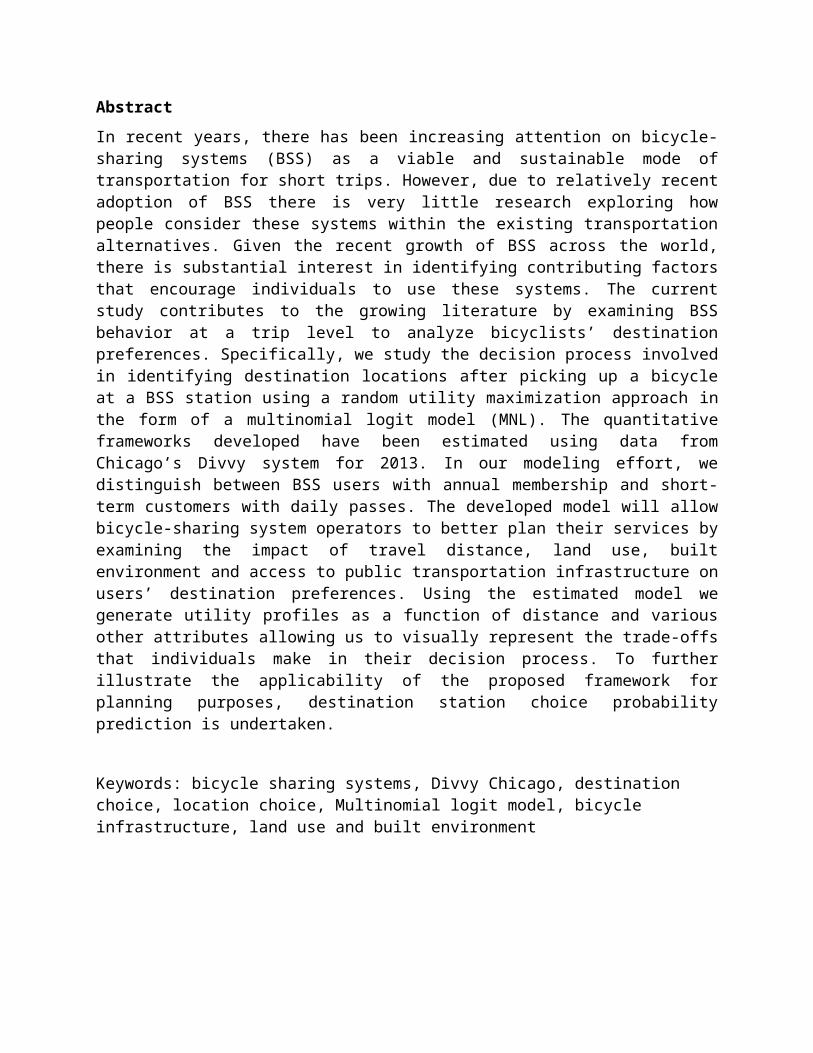
Abstract
In recent years, there has been increasing attention on bicycle-sharing systems (BSS) as a viable and sustainable mode of transportation for short trips. However, due to relatively recent adoption of BSS there is very little research exploring how people consider these systems within the existing transportation alternatives. Given the recent growth of BSS across the world, there is substantial interest in identifying contributing factors that encourage individuals to use these systems. The current study contributes to the growing literature by examining BSS behavior at a trip level to analyze bicyclists’ destination preferences. Specifically, we study the decision process involved in identifying destination locations after picking up a bicycle at a BSS station using a random utility maximization approach in the form of a multinomial logit model (MNL). The quantitative frameworks developed have been estimated using data from Chicago’s Divvy system for 2013. In our modeling effort, we distinguish between BSS users with annual membership and short-term customers with daily passes. The developed model will allow bicycle-sharing system operators to better plan their services by examining the impact of travel distance, land use, built environment and access to public transportation infrastructure on users’ destination preferences. Using the estimated model we generate utility profiles as a function of distance and various other attributes allowing us to visually represent the trade-offs that individuals make in their decision process. To further illustrate the applicability of the proposed framework for planning purposes, destination station choice probability prediction is undertaken.
Keywords: bicycle sharing systems, Divvy Chicago, destination choice, location choice, Multinomial logit model, bicycle infrastructure, land use and built environment

1. Introduction
In recent years, bicycle-sharing systems (BSS) have attracted increasing attention as a viable mode of transportation for short trips. Currently, there are about half a million public bicycles around the world; about 400 cities have installed or are planning to install a bicycle-sharing system (Fishman et al., 2013). Bicycle-sharing systems free the user from the need to secure their bicycles avoiding bicycle theft issues (van Lierop et al., 2013; Rietveld and Daniel, 2004). At the same time, the decision to make a trip can be made in a short time frame providing an instantaneously accessible alternative for a one-way or a round trip. Bicycle-sharing systems provide a healthier and affordable transport mode for the younger generation. These systems can enhance accessibility to public transportation systems by improving the last mile connectivity (Shaheen et al., 2010). Moreover, installing bicycle-sharing systems promotes active transportation that can enhance physical activity levels to obtain better health outcomes. Furthermore, the recent observed trends in travel behavior among the millennial generation (or millenials) demonstrate that the younger generation is willing to drive less. They are more environmentally conscious and incline more towards shared transportation systems (Benjamin et al., 2012; Dutzik and Baxandall, 2013).
Cities, by installing bicycle-sharing systems, are focusing on inducing a modal shift to cycling, and subsequently decrease traffic congestion and air pollution. There is significant evidence from the travel behavior data in the United States to support bicycle-sharing system installation. According to data from the National Household Travel Survey (NHTS) 2009, about 37.6% of the trips by private vehicles in the United States are less than 2 miles long. The NHTS data also indicates that about 73.6% of bicycle trips in the US are less than 2 miles long. Even if a small proportion of the shorter private vehicle trips (around dense urban cores) are substituted with bicycle-sharing system trips it offers substantial benefits to individuals, cities and the environment. A well designed and planned bicycle-sharing system can play a complimentary role to existing public transportation infrastructure.
While cities are supporting bicycle-sharing systems as a more sustainable transport mode, due to their relatively recent adoption there is very little research exploring how people consider these systems within the existing transportation alternatives. Given the recent growth of bicycle-sharing systems across major cities in China, Europe and US, there is a substantial interest in identifying contributing factors that encourage individuals to use these systems. Understanding the individuals’ decision processes in adoption and usage of bicycle-sharing systems will enable bicycle-sharing system operators to better plan their services. The current study contributes to the growing literature on bicycle-sharing systems by examining bicycle-sharing system behavior at a trip level to analyze bicyclists’ destination preferences. Specifically, we study the decision process involved in identifying destination locations after picking up the bicycle at a BSS station. The decision process formulated for the bicycle destination choice is analogous to the trip distribution step in the traditional four-step travel demand planning framework for vehicular demand. In the trip distribution module, given the origin locations of the trips, we apply a quantitative model to distribute the trips in the study region. The proposed research effort develops an equivalent framework within the realm of bicycle-sharing systems.
The decision process is studied using a random utility maximization approach where individuals choose the destination that offers them the highest utility from the universal choice set of stations in the study region. In the random utility maximization approach, the destination

station utility is affected by individual bicyclist attributes (such as age and gender), trip attributes (such as time period of the day) and destination attributes (such as distance from the origin station, bicycle infrastructure variables and land use and built environment attributes). There have been several location choice studies in traditional travel demand literature that adopt a random utility maximization approach for understanding destination/location preferences (for example see Chakour and Eluru 2014 for analysis of railway station choice; see Waddell et al. 2007 for workplace and residential location choice; see Sivakamur and Bhat 2007 for activity location choice). The current study adapts this approach to the bicycle-sharing system data.
The proposed quantitative analysis is conducted employing trip data for Chicago’s Divvy bicycle-sharing system from July to December 2013. Chicago’s bicycle-sharing system was launched in June 2013 with 300 stations and 3000 bicycles. The trips information including origin and destination stations, time and duration of trips and type of user are available online on Divvy website (https://www.divvybikes.com/datachallenge). The Divvy trip database is augmented with temporal characteristics, bicycle infrastructure, land use, and built environment attributes allowing us to examine the influence of these factors on BSS users’ destination station choice. In our modeling effort, we distinguish between BSS users with annual membership and short-term customers with daily passes and present separate models for each of these rider types due to the inherent differences among the two bicycling groups. The random utility framework employed in our analysis takes the form of a multinomial logit model (MNL). The quantitative framework developed will allow bicycle-sharing system operators to examine the impact of travel distance, land use, built environment and access to public transportation infrastructure on users’ destination preferences. The estimated model is validated using a hold out sample data that has not been used for estimation. To illustrate the applicability of the proposed framework for planning purposes, destination station choice probability prediction is undertaken. Finally, a trade-off analysis to illustrate the relationship between important attributes affecting the destination choice process is also undertaken.
The remainder of the paper is organized in the following order. A brief overview of earlier research is presented in Section 2. Section 3 describes the data and the sample formation procedures. In Section 4, model structure, estimation results are described. Section 5 describes model validation, prediction and elasticity profiles for important variables generated using the model developed. Finally, Section 6 summarizes and concludes the paper.
2. Literature Review
The first bicycle-sharing system was introduced in the 1960s in the Netherlands (DeMaio, 2009; Shaheen et al., 2010). However, these systems became popular and relatively successful around the world only over the past few years. The first generation of public bikes in the 1960s was free and without time limitation. This program failed because of many stolen and vandalized bicycles. Then, next generation of BSS introduced the coin-deposit systems. Unfortunately, this program was also unsuccessful because of the lack of time constraints and the issue of bicycle theft due to user anonymity (Shaheen et al., 2010). Adding the transaction kiosks to docking stations and limiting bicycle rental periods have helped these systems become quite successful around the world. In our literature review, we focus on research exploring the use of the latest generation of bicycle-sharing systems. The research is broadly based on two perspectives: (1) systems perspective and (2) user perspective.

Under the systems perspective, earlier quantitative studies employed actual bicycle usage data to capture the determinants of BSS usage (Rixey, 2013; Faghih-Imani et al., 2014; Zhao et al., 2014). In these studies, usage is usually characterized as arrivals (depositing bicycles) and departures (removal of bicycles). These studies examine the influence of BSS infrastructure (such as number of BSS stations and stations’ capacity), transportation network infrastructure (such as length of bicycle facilities, streets and major roads), land use and urban form (such as presence of metro and bus stations, restaurants, businesses and universities), meteorological data (such as temperature and humidity), and temporal characteristics (such as time of day, day of the week and month) on BSS usage. Several studies demonstrate that increasing BSS infrastructure (number of stations and capacity) increases BSS usage (Wang et al., 2013; Faghih-Imani et al., 2014). Land use and urban form variables such as higher job or population density also contribute to BSS usage (Rixey, 2013; Faghih-Imani et al., 2014). Studies that examined usage at a fine time resolution (within a day) highlighted that temporal characteristics affect BSS usage – with the peak usage observed during the evening peak hours (Faghih-Imani et al., 2014). These studies have also found that BSS usage is higher for weekdays compared to weekends indicating that BSS is used on weekdays for commuting purposes. The studies examining the impact of point of interests (such as restaurants, retail stores and universities) near BSS stations found evidence that BSS usage was higher for stations with higher number of point of interests in the vicinity (Rixey, 2013; Faghih-Imani et al., 2014). More recently, Faghih-Imani and Eluru, 2014 considered the self-selection of bicycle-sharing system infrastructure installation in high bicycle usage areas. In their analysis, the authors found evidence for the self-selection hypothesis indicating that ignoring the installation decision process in modeling usage tends to over-estimate the impact of bicycle-sharing system infrastructure and under-estimate the impact of land use, bicycle facilities and built environment attributes. To be sure, even after accounting for self-selection bias, increasing BSS infrastructure contributed to increased usage.
The second set of studies focussed on the user perspective contributes to the literature by studying user behavior in response to bicycle-sharing systems. Examining Montreal’s bicycle-sharing system using survey data, Bachand-Marleau et al. (2012) and Fuller et al. (2011) found that convenience of BSS as well as having a BSS station closer to home location significantly encouraged individuals to use the system. Fishman et al. (2014) investigated ridership and mode substitution data from BSS in 5 cities around the world. The authors examined if the reduction in vehicle kilometers travelled due to bicycle-sharing system usage was offset by the motor vehicle use for fleet redistribution and maintenance by program operators. They highlighted the importance of encouraging people to shift from car to BSS to reduce total vehicle kilometers traveled. Buck et al. (2013) studied the differences between regular cyclists, BSS short-term users and BSS annual members in Washington, D.C. and concluded that BSS’s implementation in the city could motivate new segments of the society to cycle and thus increase the overall bicycling mode share. Schoner and Levinson (2014) modeled the origin’s station choice of Nice Ride Minnesota bicycle-sharing system using survey data to study how people use bicycle-sharing system and underscored the difference between preference of workers and non-workers.
2.1. Current Study in Context
As is evident from the literature review, the bicycle-sharing system literature is still in its infancy and there are several dimensions that are unexplored in earlier research. In our research, we focus on user based decision processes with a particular focus on destination station choice

behavior. Specifically, we employ destination choice data from Chicago Divvy bicycle-sharing system to examine the factors that influence individuals’ destination choice behavior. The analysis process considers that an individual who picks a bicycle at one of the stations makes destination station choice based on a host of attributes including individual’s age and gender, time period of the day, and destination attributes such as distance from the origin station, points of interest, bicycle infrastructure, land use and built environment variables. While destination choice models are prevalent in transportation literature, we believe our study is the first attempt to accommodate for bicycle-sharing system destination choice behavior. While Schoner and Levinson (2014) research effort studies origin station choice, their analysis was based on survey data and not on revealed usage data. Furthermore, while using the system wide data, we need to examine a larger destination choice set. In summary, the current study contributes to bicycle literature in the following ways. First, we develop a model to quantify the impact of various attributes on bicycle-sharing system destination choice. Second, using the estimated model we generate utility profiles as a function of distance and various other attributes allowing us to visually represent the trade-offs that individuals make in their decision process. Finally, the model developed is employed to generate probability functions of trips originating at an origin station to various destinations – a very useful representation for understanding system wide usage patterns.
3. Data
3.1. Data Source
Chicago’s Divvy system belongs to the latest generation of bicycle-sharing systems which has benefited from the recent advances in technology such as solar powered docking stations. Chicago is the third most populous city in the US and a host to millions of visitors every year. The Chicago downtown area is the second largest commercial business district in the US. According to NHTS 2009, bicycle trips accounts for 1.7% of total trips in Chicago while 80.6% of trips are pursued by private vehicles. About 44.8% of trips are less than 2 miles; within the trips less than 2 miles, share of private vehicles reduces to 66.3% while the share for bicycle mode increases to 2.9%. The statistics clearly indicate the scope for shifting some of the urban core trips from private vehicle to shared bicycling.
The data used in our research was obtained from Divvy website (https://www.divvybikes.com/datachallenge). The dataset consists of more than 750,000 trips with trip related information including origin and destination stations, start time and end time of trips, user types i.e. whether the user was a subscriber of system with annual membership or a customer with a 24hr pass, and the age and gender for members’ trips only. In addition, the dataset has the coordinates of Divvy system stations as well as the capacity of stations. The land use and urban form attributes such as road network, and bicycle routes are derived from City of Chicago data portal (https://data.cityofchicago.org/) while the socio-demographic characteristics are gathered from US 2010 census.
3.2. Sample Formation
The sample formation exercise involved a series of steps. First, trips with missing or inconsistent information were removed. Second, trips longer than 90 minutes in duration (only 1.8% of all the

trips) were deleted considering that only the first 30 minutes of Divvy system is free and the users are encouraged to use bicycle-sharing systems for short trips. The trips longer than 90 minutes are not typical bicycle-sharing rides and could also be a result of misplacing the bicycle when returning it to the station. At the same time, trips that had the same origin and destination were also eliminated. In most of these trips, it is very likely that the bicycle was not functioning well and the users returned them to the origin station. Therefore, we focus on trips that were destined outward. Further, we expected that the behavior of users with annual membership will differ from the behavior of customers with daily passes. Thus, we separated trips made by members and daily customers; about 53% of all the trips were made by members. To obtain a reasonable sample size for model estimation, 6000 trips by members and 6000 trips by daily customers were randomly selected.
Divvy system has 300 stations across the city. From each origin station, individuals have 299 other stations to choose to return the bicycle to. However, considering all the stations in the universal choice set will result in substantial computational burden. Hence, for the purpose of our modeling effort we resort to a sampled choice set. Specifically, for every destination choice record, we sample 30 alternatives from the universal choice set including the chosen alternative. The process of random sampling does not affect the parameter estimates in multinomial logit models (see McFadden, 1987). With the sampled choice set, information for the 30 stations is augmented with the individual trip records.
3.3. Independent Variable Generation
Several independent variables were generated to examine the users’ destination station choice process. These variables can be grouped into: 1) Trip attributes 2) Station attributes. Trip attributes include the street network distance between the origin and destination of every trip. This distance was computed using the shortest path between origin and destination stations to investigate the travel distance influence along with other attributes. While the actual trip might involve a different route, the shortest distance would be an appropriate indicator of the distance traveled. Moreover, for the users with annual membership, the gender and age information were available and were considered in our analysis. Also, considering the start time of the trips, five time periods were created: AM (6:00-10:00), Midday (10:00-16:00), PM (16:00-20:00), Evening (20:00-24:00), and Night (0:00-6:00) to capture the time of the day effect on trips.
Destination station attributes considered in our analysis are: 1) Bicycle infrastructure variables 2) Land use and built environment attributes. The spatial variables included are at both the census track level and the buffer level. A 300 meter buffer around each station was found to be an appropriate walking distance considering the distances between Divvy stations (Shaheen et al., 2013). The length of bicycle facilities (bicycle lanes and bicycle paths) within the buffer was calculated to examine the effect of cycling facilities on the destination station preference. The length of minor roads (local streets and collectors) and major roads (arterials and highways) within 300 meter of stations were calculated to identify cyclist preference of routes. In addition to the destination station capacity, the number and capacity of Divvy stations in the 300 meter buffer (excluding the destination station) were computed to capture the influence of neighbouring stations.
Land-use and built environment characteristics considered include distance from central business district (CBD), presence of transit in the 300 meter buffer, various points of interest, job

and population density. To study the influence of the central business district (CBD), the distance from each station to the CBD was computed. Moreover, a categorical variable indicating the presence of station in the CBD was created. The presence of stations of bus and train system near a Divvy station and the length of train lines in the 300 meter buffer were generated to examine the influence of public transit on people preference of destination station. We included the rapid train system in city of Chicago, the L system, the regional train system in Chicago Metropolitan Area, Metra system, and Chicago Transit Authority (CTA) bus system in generation of public transit variables. We also considered three types of points of interest near each station: (1) the number of restaurants (including coffee shops and bars), (2) the number of grocery stores and (3) the area of parks in the buffer around the station. The elevation of stations was another characteristic taken into account. Population density and job density associated with each Divvy station was considered at the census track level.
3.4. Descriptive Analysis
To provide an illustration of the dataset, a descriptive summary of the sample is presented in Table 1. The average duration of trips is about 20.66 minutes and the average network distance between origins and destinations is about 2.54 km. Daily customers use Divvy system for longer trips compared to annual members. Within members, the median age is 34 years old and 79% of trips are made by males. However, while number of female members is less than their male counterparts, we observe that they pursue longer trips both in terms of duration and distance.
In order to better understand the variation of destination choices from each origin in the Divvy system, we demonstrate the number of trips destined to every station from specific origins visually using a geographic information system. Since illustrating all trips for all the origins and destinations is quite undesirable in the context of this paper, we focus only on three types of stations; i.e. stations with number of trips originated equals to the 25, 50, 75 percentile of total trips (Figure 1). For this purpose, we identified three stations for trips made by members and three stations for trips made by daily customers (Figure 1). This way we present six stations that have different usage patterns and serve as a representation of the entire system. In Figure 1, we categorized the number of trips destined to each station in quartiles: Low (trips destined are less than 25% of total originated trips), Medium (trips destined are between 25-50% of total originated trips), High (trips destined are between 50-75% of total originated trips) and Very High (trips destined are more than 75% of total originated trips). Overall, the visualization provides a brief overview of bicycle flows in Chicago using the Divvy system. As can be seen in this figure, the chosen destination clearly depends on the distance from the origin station. Furthermore, we can observe that a subset of stations is typically chosen for trips originated from a station. However, stations in CBD area attract reasonable number of trips from farther origin stations from CBD. Further, we used the same stations to show the prediction applicability of the estimated MNL model (in Section 5).
4. Analysis and Discussion
4.1. Multinomial Logit Model
The most common methodology employed to study location choice such as BSS’s destination station choice is the McFadden’s Multinomial Logit Model (MNL). The use of MNL model is
common in such cases since the location choice can be hypothesized as a utility-maximization problem where BSS’s users choose the stations with the highest utility. A brief description of the MNL model is provided below.
Let s = 1, 2, …, 30 be an index to represent each station, q = 1, 2, …, Q be an index to represent the BSS users. Then, the random utility formulation takes the following form:
uqs=β ' X qs+εqs (1)
Where uqs is the utility obtained by user q by selecting station s from the choice set of 30 stations. Xqs is the vector of attributes and β is the model coefficients to be estimated. The random error term, ε, is assumed to be independent and identically Gumbel-distributed across the dataset. The BSS user q will choose the station as destination that offers the highest utility. With this notation, the probability expression takes the typical multinomial logit form given by:
Pqs=exp (β ' Xqs)
∑s=1
30
exp (β ' Xqs) (2)
The log-likelihood function can be defined as:
L=∑q
ln (Pqs ) (3)
By maximizing this log-likelihood function, the model parameters β are estimated. The maximum likelihood model estimation is programmed in GAUSS matrix programming language.
4.2. Results
In this section, we discuss the results of multinomial logit model estimation to understand the different factors influencing users’ choice of destination in the Chicago’s Divvy bicycle-sharing system. The final Log-likelihood values for the station destination choice’s multinomial logit model for the annual member and daily customer samples are -15740.44 and -15491.61, respectively. The corresponding value for equal probability model is -20407.18. The improvement in the data fit clearly illustrates the superiority of the MNL destination choice models (the log-likelihood ratio test-statistic value is 9333.48 and 9831.14, significantly higher than the corresponding chi-square value for 21 and 17 additional degrees of freedom for the annual member and daily customer, respectively). The reader would note that we considered several specifications but only the statistically significant results for members’ and daily customers’ destination choice models are presented in Table 2. As expected, there are distinct impacts of several contributing factors in decision making of customers and members towards destination station choice.
4.2.1. Bicycle infrastructure variables
People tend to choose stations with longer bicycle paths nearby as highlighted by the positive coefficient of the bicycle facility variable in both members’ and daily customers’ model. On the

contrary, as the length of major roads increases around the station, it is less likely that Divvy users choose that station as destination of their trip. The number of stations and the capacity of stations within the buffer variables take into account the impact of neighbouring stations on destination choice; the results are different for daily customers and members models. The number of stations in the buffer has positive impact and the capacity of stations in the buffer has negative impact on the destination choice utility for members. The impact is opposite for daily customers; the number of stations in the buffer has negative impact and the capacity of stations in the buffer has positive impact. It is possible that daily customers are likely to be unfamiliar with the Divvy system and the presence of multiple stations close by serves as competition while on the other hand, for members, the presence of multiple stations reflects access to multiple opportunities thus encouraging them to use these parts of the system. This clearly shows the distinct behaviour of annual members and daily customers. It must be noted that the coefficients of number and capacity of stations in the buffer should be examined as a combination recognizing that as the number of stations in the buffer increases we simultaneously increase the capacity in the buffer. For members, the positive impact associated with the number of Divvy stations on likelihood of choosing a station as destination is about 20 times larger than the negative impact of capacity of stations in the buffer while for daily customers the negative impact of the number of stations in the buffer is about 80 times larger than the positive effect of buffer capacity. The results imply that from members standpoint, more stations with smaller capacity is preferable while from daily customers’ point of view, fewer stations with larger capacity is more desirable. Faghih-Imani et al. (2014), by examining the station level arrivals and departures at Montreal’s BIXI system, concluded that adding additional stations (either by relocating existing capacity from large stations or adding new bicycle slots) is more beneficial in terms of usage compared to adding capacity to existing stations. However, their study did not distinguish between annual members and daily customers. The Faghih-Imani et al. (2014) and current study differ in the bicycle-sharing system studied and dependent variable analyzed; hence, further investigation on the influence of number of stations and capacity of stations is required considering different bicycle-sharing systems and user types. In terms of the destination station, the stations with higher capacity are more likely to be chosen as they are likely to have more available docking stations. Moreover, people tend to easily remember larger stations.
4.2.2. Land-use and built environment characteristics
In this section, the results for parameters related to land-use and built environment characteristics are discussed. The Divvy stations near metro system and regional train system tend to be chosen as destination by members highlighting the support of BSS on use of public transport. However, the results is opposite for daily customers. Since the purpose of daily customers’ trips are more likely to be for recreational activities, the Divvy stations in the vicinity of parks are also more likely to be chosen by daily customers as highlighted by area of parks in the buffer variable. Interestingly, the parks variable for annual members has contrasting effect for trips during weekdays and weekends. During weekdays, there is a negative impact on choosing a destination near parks while during weekends, the Divvy stations near parks are more likely to be chosen. As expected, both short-term users and annual members incline towards Divvy stations with higher number of restaurants in the vicinity.
Members choose stations that bring them closer to CBD as highlighted by negative coefficient of destination station distance to CBD. This negative impact is about 3 times higher

in the AM period while its effect becomes positive during the PM period, indicating the use of Divvy system for daily commute to/from work in downtown area. Daily customers are inclined towards the stations in CBD area as highlighted by the positive coefficient of destination in CBD variable. Daily customers use the system to get closer to CBD in the AM period and farther from CBD in the PM period. Population density variable has positive impact on likelihood of choosing a Divvy station by members in general. However, for both short-term users and annual members, during AM period, the Divvy stations with lower population density are more likely to be chosen since trips in AM period are mostly originated from home. During AM period, stations with higher job density are more likely to be chosen. The coefficients of population density, job density and station distance from CBD variables in AM and PM periods clearly demonstrate the use of Divvy system for daily commute to work in the morning and back to home in the evening especially for annual member users.
Further, the results show that there is clear distinction in the use of Divvy system by daily customers and annual members. This provides further support to our hypothesis that separate behavior models are appropriate for daily customers and annual members.
4.2.3. Trip level attributes
The most important variable in destination station decision making process in a bicycle-sharing system is expected to be the distance of trip between origin and destination. For members we examined the distance of trips as well as age and gender effects while for daily customers we were limited to only trip distance variable due to lack of users’ information. In general, it is expected that the likelihood of choosing a station very close to origin station or very far from origin station is lower than stations in between. In order to better model the distance impact on the utility of choosing a station, we distinguish the very short distance and very far distance by dummy variables and a continuous variable for distance in between. We tried several different distance combinations determining thresholds for distance to define close and far stations from the origin. Dummy variables indicating stations within 500m or farther than 3000m of origin and a continuous form of distance for stations within 500m to 3000m from origin provided better results for members’ final model specifications. For daily customers’ model, stations within 500m dummy and a continuous form for after 500m distance from origin yielded better results. As expected, the network distance variables have negative impact on likelihood of choosing a station as destination for both annual members and short-term users.
Moreover, gender and age effects were also considered in members’ model estimation. It is important to note that since the user attribute remains the same for all the destination station alternatives, these effects were captured by multiplying gender and age variables with distance variables. The age influence does not become statistically significant – this is intuitive given that annual members self-select themselves from the pool of active bicyclists. The gender impact, on the other hand, offers interesting results. The results show that male members are more likely to have shorter trips. This might be due the fact that in Chicago Divvy system, only about 21% of members are female. It is possible that women who join are actually regular bicyclists and are more likely to be fit and pursue longer trips. However, this result might be different in other bicycle-sharing systems especially in bicycle-friendlier cities.

5. Validation and Elasticity Analysis
5.1. Model Validation
The model estimated is validated using the hold-out samples set aside i.e. 2000 trips for annual members and 2000 trips for daily customers. The same approach of choice set generation for estimation sample is exercised for validation sample. The utility and the probability of choosing a station are computed for 30 stations of choice set for each of the 2000 trips. The predictive LL for members’ model is -5275.76 and for daily customers’ model is -5249.32 while the corresponding value for equal probability model is -6802.39 clearly indicating that the proposed model provides an improved fit. Subsequently, the predicted probability is compared with the actual observed destination station. We compute two metrics for this analysis: (1) percentage of correct prediction (correct prediction is defined as assigning the highest probability to the chosen alternative) and (2) average probability of the chosen station. For member and customers models, we observe that the probability of correct prediction is 21.7% and 22.0% respectively. The average of predicted probability of observed destination station is 11.52% and 11.72% which is about 4 times the 3.33% chance of the probability of prediction without any model (i.e. choosing a station among 30 stations). The two proposed measures highlight the improved fidelity of prediction with our proposed model as opposed to an equal likelihood prediction.
To further highlight the applicability of estimated models, we illustrate the probability of choosing destination stations from the entire sample for the same stations discussed in Section 3.4 in Figure 2. Again to better compare the results, we categorized the stations into 4 types considering the likelihood of station to be chosen: low probability stations (first quartile), medium probability stations (second quartile), high probability stations (third quartile), and very high probability stations (fourth quartile). The computed probability is for off-peak period on weekdays for male members and daily customers. Comparison of Figure 1 and Figure 2 clearly show the applicability of estimated results. The zero arrival trips in Figure 1 are mostly in lower predicted probability categories in Figure 2 while higher arrivals are mainly in higher predicted probability categories.
5.2. Elasticity analysis
In order to better understand the magnitude of the effects of variables on destination choice, Figure 3 illustrates the utility function trade-offs between origin and destination network distance and other attributes such as length of bicycle facilities in the buffer and destination station capacity. As is indicated from the model estimates, the utility decreases when the trips’ distance between origin and destination increases; while it increases with increase in the length of bicycle facilities near a station and station capacity. We can observe from the three dimensional relationship that the negative impact of distance is compensated to some degree by positive impact of bicycle facilities and station capacity. This is illustrated by how the utility for various distances remains the same with appropriate increase in the other two attributes. For example, moving a destination station from 1 km to 2 km farther from origin without changing other variables would result in about 0.65 and 0.45 unit reduction in utility for members and non-members, respectively. Now if we want to keep the attraction of that station constant (i.e. keep the utility constant), we can compensate that reduction in utility by adding to existing bicycle routes or adding more capacity. To offset the utility reduction caused by increased distance of 1 km we will need to increase bicycle facility length by about 2.6 km and 3.5 km for members and

non-members, respectively. In terms of capacity, the 1 km increase in distance can be offset by increasing the capacity by 22 and 10 for members and non-members, respectively. Hence, one could argue that adding to bicycle capacity is an easier proposition. Of course, if the changes were made simultaneously only a 1 km increase in bicycle route length in conjunction with a capacity increase of 14 and 7 for members and customers can offset the 1 km increase in distance. The figures and the subsequent analysis illustrate the applicability of the proposed model for system operators in reallocating capacity or installing new capacity while regional planners can adopt the model to enhance land-use to encourage shared bicycling usage.
.
6. Conclusion
Despite the growing installation of bicycle-sharing systems around the world, there is very little research exploring how people consider these systems within the existing transportation alternatives. This study examines the individuals’ decision processes in adoption and usage of bicycle-sharing systems. The current study contributes to growing literature on bicycle-sharing systems by examining bicycle-sharing system behavior at a trip level to analyze bicyclists’ destination preferences. The decision process is studied using a Multinomial Logit Model where the destination station utility is affected by individual bicyclist attributes (such as age and gender), trip attributes (such as time period of the day) and destination attributes (such as distance from the origin station, bicycle infrastructure variables and land use and built environment attributes). In our analysis, we distinguish between BSS annual users and daily customers.
The proposed quantitative analysis is conducted employing trip data for Chicago’s Divvy bicycle-sharing system from July to December 2013. The model estimation results provide intuitive findings for both members and daily customers. It is observed that people tend to choose stations with longer bicycle paths nearby. In terms of the destination station, the stations with higher capacity are more likely to be chosen. The network distance between origin and destination station has negative impact on likelihood of choosing a station as destination for Divvy users. During AM period, stations with higher job density and stations with lower population density are more likely to be chosen. The coefficients of population density, job density and station distance from CBD variables in AM and PM periods clearly demonstrate the use of Divvy system for daily commute to work in the morning and back to home in the evening especially for annual member users. It is demonstrated that there is clear distinction in the use of Divvy system by daily customers and annual members. Specifically, the effects of number and capacity of neighbouring stations are opposite for daily customers and annual members.
The model estimated is validated using hold-out samples. The validation exercise highlights the improved fidelity of prediction with our proposed model as opposed to an equal likelihood prediction. To further demonstrate the applicability of estimated models, we compute the probability of choosing destination stations from the entire sample. The zero arrival trips from the observed data are mostly in lower predicted probability categories while higher arrival trips from the observed data are mainly in higher predicted probability categories. In order to better understand the magnitude of the effects of variables on destination choice, the utility function trade-offs between network distance between origin and destination and other attributes such as length of bicycle facilities in the buffer and destination station capacity are also computed. It is observed that the negative impact of distance is compensated to some degree by

positive impact of bicycle facilities and station capacity. Overall, our analysis provides a framework for planners and BSS operators a framework to examine the impact of changes to the system (BSS and land use) on user destination choice preferences.
The model estimates generated have several applications. For example, the quantitative framework developed will allow bicycle-sharing system operators to examine the impact of travel distance, land use, built environment and access to public transportation infrastructure on users’ destination preferences. The model results will also be useful in determining time of day based bicycle demand profiles so as to better plan the bicycle availability (or empty slot availability) and rebalancing operations at bicycle stations. The model will also provide guidance on how the expansion of the existing bicycle-sharing system will affect the current station demand by providing potential destination locations to be used from the newly proposed bicycle stations.
To be sure, the study is not without limitations. This paper does not account for the trips’ origin effects; the trips originating from one station might have common characteristics. We do intend to capture the origin’s common unobserved heterogeneity in our future research. In future research attempts a more comprehensive analysis considering the decision to make a trip by bicycle-sharing system, the origin station choice and the destination station choice simultaneously could be undertaken. Of course, to undertake such analysis, the bicycle-sharing trip data needs to be augmented with much more detailed information (such as home and work location) on BSS users.
ACKNOWLEDGEMENTS
The authors would like to acknowledge financial support from Natural Sciences and Engineering Research Council (NSERC) of Canada under the Discovery Grants program. The authors would like to extend their sincere appreciation to Prof. Ahmed M. El-Geneidy for pointing us toward the Divvy trips data and many subsequent discussions about the research.

References
Bachand-Marleau, J., B. Lee, and A. El-Geneidy. Better Understanding of Factors Influencing Likelihood of Using Shared Bicycle Systems and Frequency of Use. Transportation Research Record: Journal of the Transportation Research Board, No. 2314, 2012, pp. 66-71.
Buck, D., D. Buehler, P. Happ, B. Rawls, P. Chung, and N. Borecki. Are Bikeshare Users Different from Regular Cyclists? A First Look at Short-Term Users, Annual Members, and Area Cyclists in the Washington, D.C., Region. Transportation Research Record: Journal of the Transportation Research Board, No. 2387, 2013, pp. 112–119.
Chakour V. and N. Eluru, "Analyzing Commuter Train User Behavior: A Decision Framework for Access Mode and Station Choice, Transportation, Vol. 41 (1), 2014, pp. 211-228.
City of Chicago Data portal, https://data.cityofchicago.org
Davis, B., T. Dutzik and P. Baxandall. Transportation and the new generation: Why young people are driving less and what it means for transportation policy, Frontier Group. 2012.
DeMaio, P. Bike-sharing: History, Impacts, Models of Provision, and Future. Journal of Public Transportation. Vol. 12, 2009, pp. 41-56.
Divvy Bikes, https://www.divvybikes.com/datachallenge
Dutzik, T. and P. Baxandall. A new direction: Our changing relationship with driving and the implications for America’s future. U.S. PIRG Education Fund and Frontier Group. 2013.
Faghih-Imani A. and N. Eluru, Role of Bicycle Sharing System Infrastructure on Usage: Evidence from Montreal, Presented at the 5th Innovations in Travel Modeling Conference, Baltimore, MD, 2014.
Faghih-Imani A., N. Eluru, A. El-Geneidy, M. Rabbat, and U. Haq. How does land-use and urban form impact bicycle flows: Evidence from the bicycle-sharing system (BIXI) in Montreal, forthcoming Journal of Transport Geography http://dx.doi.org/10.1016/j.jtrangeo.2014.01.013, 2014.
Fishman, E., S. Washington and N. Haworth. Bike share’s impact on car use: Evidence from the United States, Great Britain, and Australia, Transportation Research Part D: Transport and Environment, Vol. 31, 2014, pp. 13-20.
Fishman, E., S. Washington, N. Haworth. Bike Share: A Synthesis of the Literature. Transport Review Vol. 33, 2013, pp. 148-165.
Fuller, D., L. Gauvin, Y. Kestens, M. Daniel, M. Fournier, P. Morency, and L. Drouin. Use of a new public bicycle share program in Montreal, Canada. American journal of preventive medicine, Vol. 41, No. 1, 2011, pp. 80-83.
McFadden, D. Modeling the Choice of Residential Location. In Spatial Interaction Theory and Planning Models (A. Karlqvist et al., eds.), North Holland Publishers, Amsterdam, Netherlands,1978.
NHTS, U.S. Department of Transportation, Federal Highway Administration, National Household Travel Survey 2009. URL: http://nhts.ornl.gov.
Rietveld, P. and V. Daniel, Determinants of bicycle use: do municipal policies matter? Transportation Research Part A: Policy and Practice Vol. 38, 2004, pp. 531-550.
Rixey, R. Station-Level Forecasting of Bikesharing Ridership: Station Network Effects in Three U.S. Systems. Transportation Research Record: Journal of the Transportation Research Board, No. 2387, 2013, pp. 46-55.
Schoner, J. E. and D. M. Levinson. Which Station? Access Trips and Bike Share Route Choice. Presented at 93rd Annual Meeting of the Transportation Research Board, Washington, D.C., 2014.
Shaheen, S., A. Adam, P. Cohen and E. W. Martin. Public Bikesharing in North America. Transportation Research Record: Journal of the Transportation Research Board, No. 2387, 2013, pp. 83-92.
Shaheen, S., S. Guzman and H. Zhang. Bikesharing in Europe, the Americas, and Asia Past, Present, and Future. Transportation Research Record: Journal of the Transportation Research Board, No. 2143, 2010, pp. 159-167.
Sivakumar, A., and C.R. Bhat. A Comprehensive, Unified, Framework for Analyzing Spatial Location Choice," Transportation Research Record: Journal of the Transportation Research Board, No. 2003, 2007, pp. 103-111
van Lierop, D., M. Grimsrud, and A. El-Geneidy. Breaking into bicycle theft: Insights from Montreal, Canada. Forthcoming International Journal of Sustainable Transportation, 2013.
Waddell, P., C.R. Bhat, N. Eluru, L. Wang and R.M. Pendyala. Modeling the Interdependence in Household Residence and Workplace Choices, Transportation Research Record: Journal of the Transportation Research Board, No. 2003, 2007, pp. 84-92
Wang, X., G. Lindsey, J. Schoner and A. Harrison. Modeling Bike Share Station Activity: the Effects of Nearby Businesses and Jobs on Trips to and from Stations. Paper presented at the 92nd Transportation Research Board Annual Meeting, Washington, DC, 2013.
Zhao, J., W. Deng and Y. Song. Ridership and effectiveness of bikesharing: The effects of urban features and system characteristics on daily use and turnover rate of public bikes in China. Transport Policy, Vol. 35, 2014, pp. 253-264.

Figure 1: Bicycle-Sharing Trips in Chicago’s Divvy System
Annual Subscriber Trips
Daily Customer Trips

Figure 2: Probablity of Choosing a Station in Chicago’s Divvy System
Annual Subscriber Probability
Daily Customers Probability

-3.50-3.00-2.50-2.00-1.50-1.00-0.500.000.501.00
0.05 0.20.4 0.60.8 11.2 1.41.6 1.82 2.22.4 2.62.8 3
Distance (km)
Utilit
y M
ale
Mem
bers
-1.60-1.40-1.20-1.00-0.80-0.60-0.40-0.200.000.200.40
0.05 0.20.4 0.60.8 11.2 1.41.6 1.82 2.22.4 2.62.8 3
Distance (km)
Utilit
y Da
ily C
usto
mer
s
0.05
0.5 11.5 2
2.5 33.5
-3.00-2.50-2.00-1.50-1.00-0.500.000.501.001.50
10 22 34 46
10 1316 1922 2528 3134 3740 4346 4952 55
Distance (km)
Utilit
y M
ale
Mem
bers
Station Cap
acity
0.050.5 1
1.5 22.5 3
3.5
-1.00
-0.50
0.00
0.50
1.00
1.50
2.00
2.50
10 22 34 46
10 1316 1922 2528 3134 3740 4346 4952 55
Distance (km)
Utilit
y Da
ily C
usto
mer
s
Station Cap
acity
Figure 3: The Variation of Utility with respect to Distance, Bike Route Length and Station Capacity

Table 1: Descriptive Summary of Sample Characteristics
Trip Attributes
Members and Daily Customers Members Daily Customers
Mean Std. Deviation Mean Std.
Deviation Mean Std. Deviation
Annual Membership 53% -Male 79% -Age 36.15 10.44Network Distance (km) 2.54 1.99 2.40 1.72 3.02 2.12
Network Distance (male only) 2.31 1.73Network Distance (female only) 2.52 1.77
Duration (min) 20.66 45.96 11.19 7.11 22.70 14.04Duration (male only) 11.53 23.66Duration (female only) 13.94 26.71
Station Attributes Mean Std. DeviationElevation (m) 185.16 5.68Station Distance to CBD (km) 5.27 2.99Length of Bicycle Facility in 300m Buffer (km) 1.00 0.63Length of Major Roads in 300m Buffer (km) 1.31 0.95Length of Minor Roads in 300m Buffer (km) 4.79 1.35Length of Metra Lines in 300m Buffer (km) 0.11 0.25Length of L Lines in 300m Buffer (km) 0.31 0.43Number of Bus Stops in 300m Buffer 11.67 7.40Area of Parks in 300m Buffer (km2) 0.017 0.037Number of Restaurants in 300m Buffer 21.17 27.82Number of Grocery Stores in 300m Buffer 0.44 0.70Number of Divvy stations in 300m Buffer 0.54 0.95Capacity of Divvy stations in 300m Buffer 11.29 22.82Station Capacity 16.7 4.67Population Density (people per m2 ×1000) 6.89 4.55Job Density (jobs per m2 ×1000) 13.76 32.21Station in CBD area 20.7% -Presence of Metra Station in 300m Buffer 7.7% -Presence of L Station in 300m Buffer 28.3% -

Table 2: Model Estimation Results
ParameterMembers Customers
Coefficient t-statistic Coefficient t-statistic
Bicycle Infrastructure VariablesLength of Bicycle Facility in 300m Buffer 0.2491 10.465 0.1259 5.42Length of Major Roads in 300m Buffer -0.2243 -7.306 -0.0771 -2.313Number of Divvy Stations in 300m Buffer 0.1078 2.042 -0.344 -6.023Capacity of Divvy Stations in 300m Buffer -0.0053 -2.554 0.0042 1.82Destination Station Capacity 0.029 10.496 0.0456 18.204
Land-use and Built Environment CharacteristicsPresence of L System Station in 300m Buffer 0.16 4.631 -0.0937 -2.067Length of L System Lines in 300m Buffer - - -0.2585 -5.908Presence of Metra System Station in 300m Buffer 0.2965 6.363 -0.2833 -5.354Area of Parks in 300m Buffer -0.1129 -2.178 1.04 37.736Area of Parks in 300m Buffer *Weekend 0.4635 5.105 - -Number of Restaurants in 300m Buffer 0.2721 5.017 0.6583 12.087Destination Station in CBD - - 0.6548 14.206Destination Station Distance to CBD -0.055 -5.145 - -Destination Station Distance to CBD*AM -0.164 -8.336 -0.0901 -2.998Destination Station Distance to CBD*PM 0.0612 4.653 0.0263 2.046Population Density 0.015 4.623 - -Population Density*AM -0.0188 -2.929 -0.0287 -2.742Job Density -0.0067 -11.286 - -Job Density*AM 0.0096 12.087 0.0029 2.212
Trip AttributesDummy Network Distance to Destination < 500m -0.6868 -6.706 -0.3793 -3.507Network Distance (500m< &<3000m) -0.6503 -25.415 - -Dummy Network Distance to Destination > 3000m -2.9221 -38.702 - -Network Distance (500m<) - - -0.4472 -57.153Male* Dummy Network Distance to Destination > 3000m -0.1623 -2.096 - -