Introduction to WRDS and Using the Web-Interface to ...€¦ · Introduction to WRDS and Using the...
23
Introduction to WRDS and Using the Web-Interface to Extract Data and Run an EVENTUS Query Vivek Nawosah Xfi Centre for Finance & Investment University of Exeter January 10, 2007
Transcript of Introduction to WRDS and Using the Web-Interface to ...€¦ · Introduction to WRDS and Using the...
Introduction to WRDS and Using the Web-Interface to Extract Data and Run an EVENTUS Query
Vivek Nawosah
Xfi Centre for Finance & InvestmentUniversity of Exeter
January 10, 2007
2
Outline
• Introduction to WRDS
• Web-query Characteristics
• List of University of Exeter Subscriptions on WRDS (Including free access data sets available)
• Performing a Web Query to Extract Data
• Some General Data-Related Issues
• Some Web-Query Examples
• Some useful WRDS Tools and Applications
• WRDS Research Applications
• Performing an EVENTUS Web Query to Run an Event Study

3
Introduction to WRDS• WRDS (Wharton Research Data Services) is an internet-based business
data service provided by Wharton School, University of Pennsylvania (http://wrds.wharton.upenn.edu/)
• WRDS holds a compilation of (up-to-date) historical data from some of the most comprehensive sources of financial, accounting, economic, management, marketing, banking, and insurance data for research.
• Both US and International data coverage
• A consistent data format for all databases: SAS (Statistical Analysis Software System) data format.
- You need to convert the data into proper format required by the system you are using for your data analysis
• Three ways of working with WRDS: – Web Query– Unix environment via SSH client (SAS programming; binary data format CRSP datasets
also accessible via FORTRAN or C programming)– PC/SAS (SAS programming; Remote access)
• You can download the same exact data using any of three methods, but UNIX and PC/SAS offer greater flexibility and strengths, and are more efficient. In addition, you can do much more!
• Focus of this lecture: Web Query. o WRDS-UNIX and UNIX-based EVENTUS will be covered in Lecture 12 Part II, hand-outs will be posted on WebCT.
4
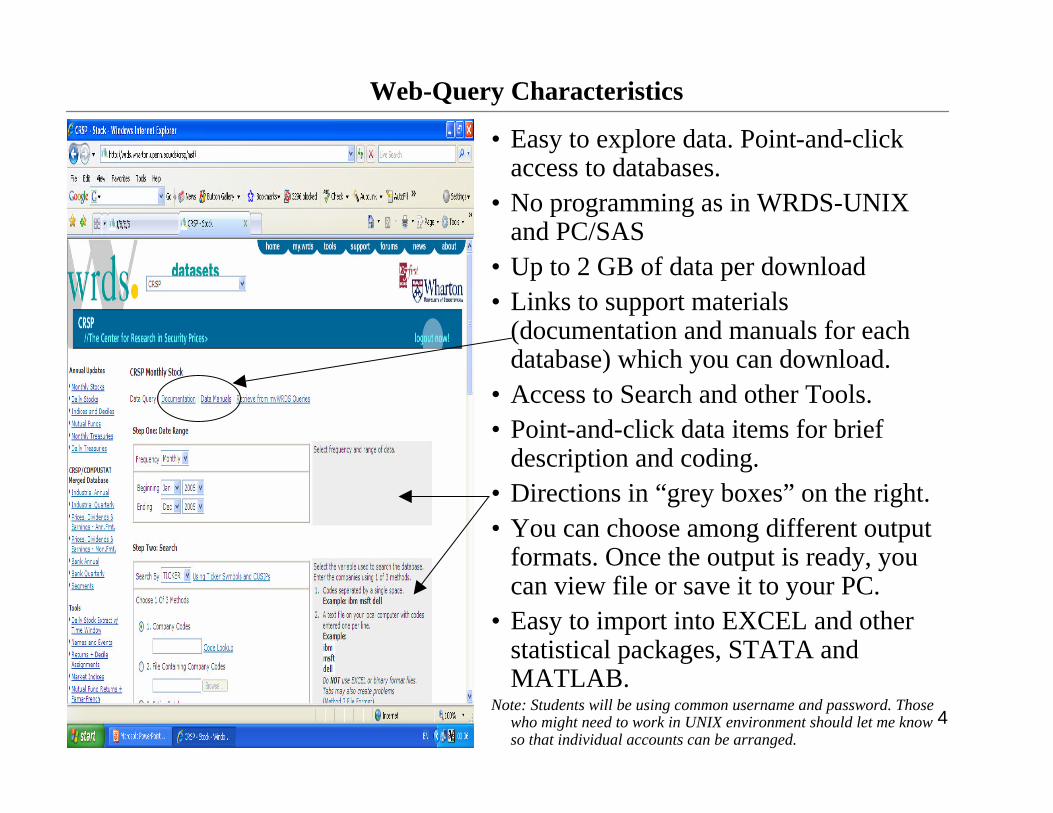
Web-Query Characteristics
•Easy to explore data. Point-and-click access to databases.
•No programming as in WRDS-UNIX and PC/SAS
•Up to 2 GB of data per download•Links to support materials
(documentation and manuals for each database) which you can download.
•Access to Search and other Tools.•Point-and-click data items for brief
description and coding. •Directions in “grey boxes”on the right.•You can choose among different output
formats. Once the output is ready, you can view file or save it to your PC.
•Easy to import into EXCEL and other statistical packages, STATA and MATLAB.
Note: Students will be using common username and password. Thosewho might need to work in UNIX environment should let me know so that individual accounts can be arranged.

5
List of University of Exeter Subscriptions on WRDS (Including free access data sets available)
Subscriptions on WRDS
• COMPUSTAT North America • COMPUSTAT Global Vantage• CRSP –Daily/Monthly Stocks only• I/B/E/S
• EVENTUS (Software)
Free Access on WRDS
• Bank Regulatory –Financial and history data on commercial/savings banks, bank holding companies, deposits, etc.
• Blockholders• CBOE Indexes –Volatility indices (VIX) on
stock index options• CISDM –Hedge funds
• DMEF –Consumer buying history
• Dow Jones –DJI, DJT, DJU, Dow 10, Dow 5
• Fama-French, Momentum, and Liquidity • FDIC –Deposits, Bank data
• Federal Reserve Bank Reports –FOREX, Interest rates (term structure) data, Coincident indexes
• PHLX –Currency options and Implied volatility
• Penn World Tables –National accounts data
• SEC Disclosure of Order Execution • TRACE –Corporate bond data
v See Appendix A1 for details on each database, description, data sets within each database, date coverage, frequency of data, and some of the main data items included. See Appendix A2 for a description of EVENTUS software.
6
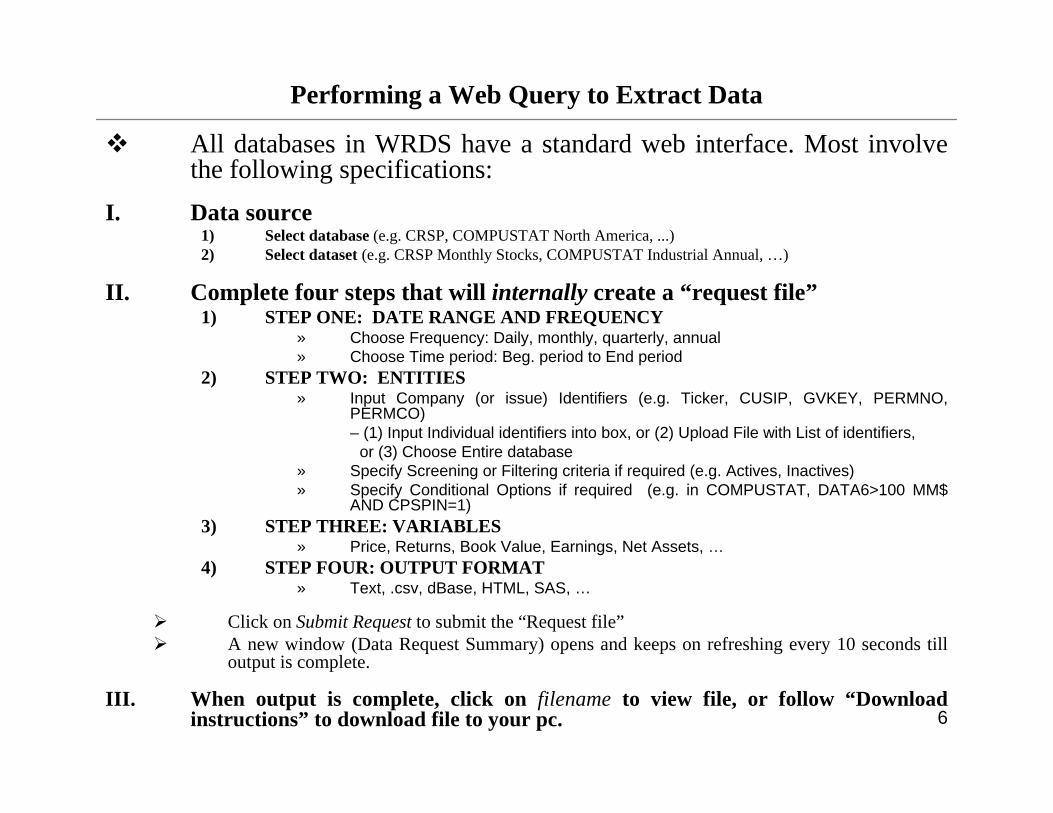
Performing a Web Query to Extract Data
v All databases in WRDS have a standard web interface. Most involve the following specifications:
I. Data source1) Select database (e.g. CRSP, COMPUSTAT North America, ...)2) Select dataset (e.g. CRSP Monthly Stocks, COMPUSTAT Industrial Annual, … )
II. Complete four steps that will internally create a “request file”1) STEP ONE: DATE RANGE AND FREQUENCY
» Choose Frequency: Daily, monthly, quarterly, annual » Choose Time period: Beg. period to End period
2) STEP TWO: ENTITIES» Input Company (or issue) Identifiers (e.g. Ticker, CUSIP, GVKEY, PERMNO,
PERMCO) –(1) Input Individual identifiers into box, or (2) Upload File with List of identifiers,
or (3) Choose Entire database» Specify Screening or Filtering criteria if required (e.g. Actives, Inactives)» Specify Conditional Options if required (e.g. in COMPUSTAT, DATA6>100 MM$
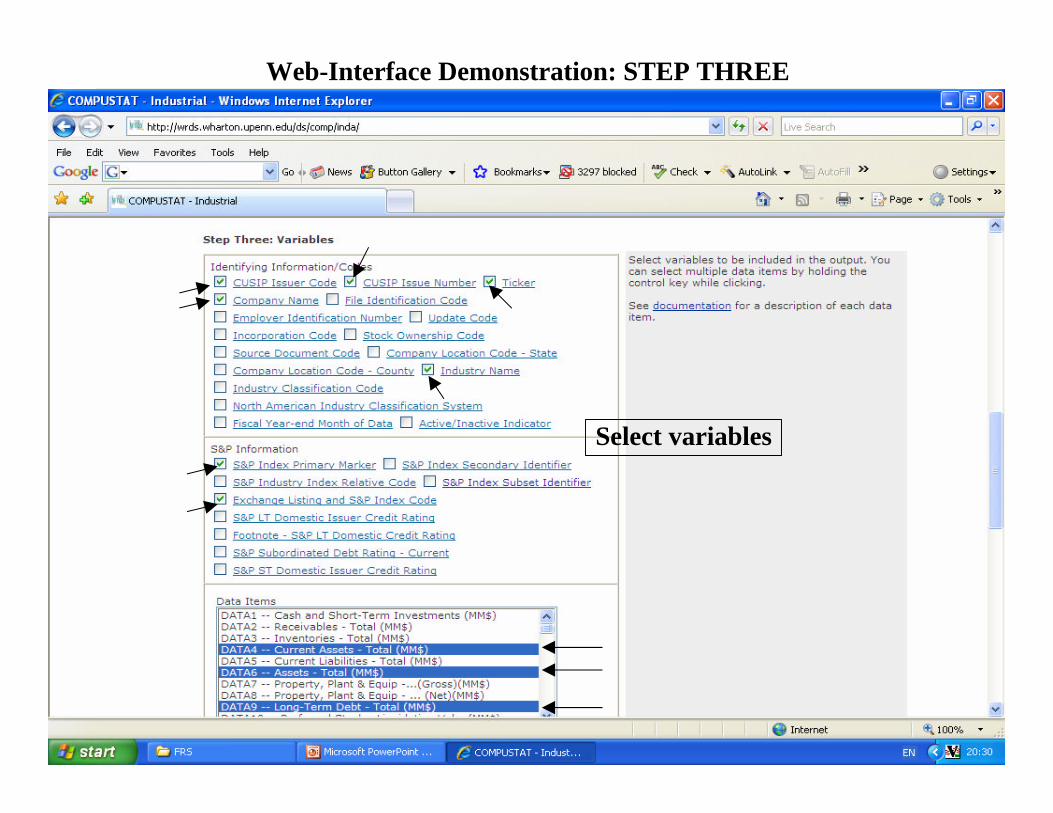
AND CPSPIN=1)3) STEP THREE: VARIABLES
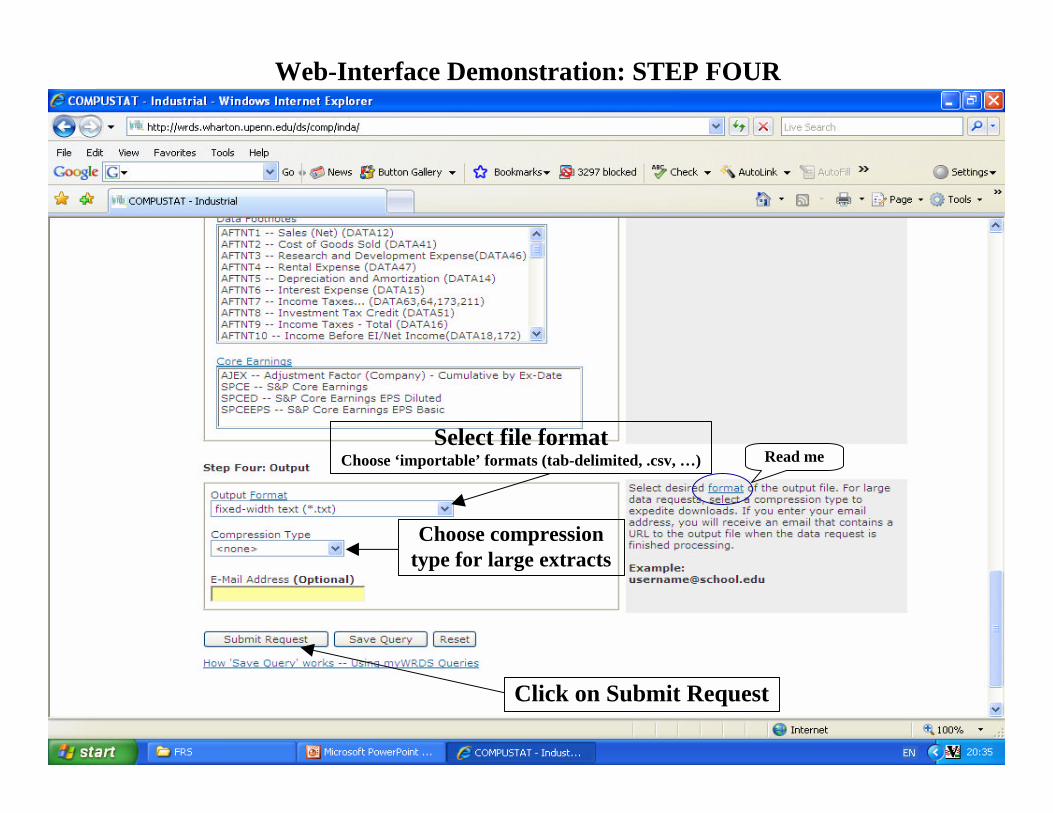
» Price, Returns, Book Value, Earnings, Net Assets, …4) STEP FOUR: OUTPUT FORMAT
» Text, .csv, dBase, HTML, SAS, …
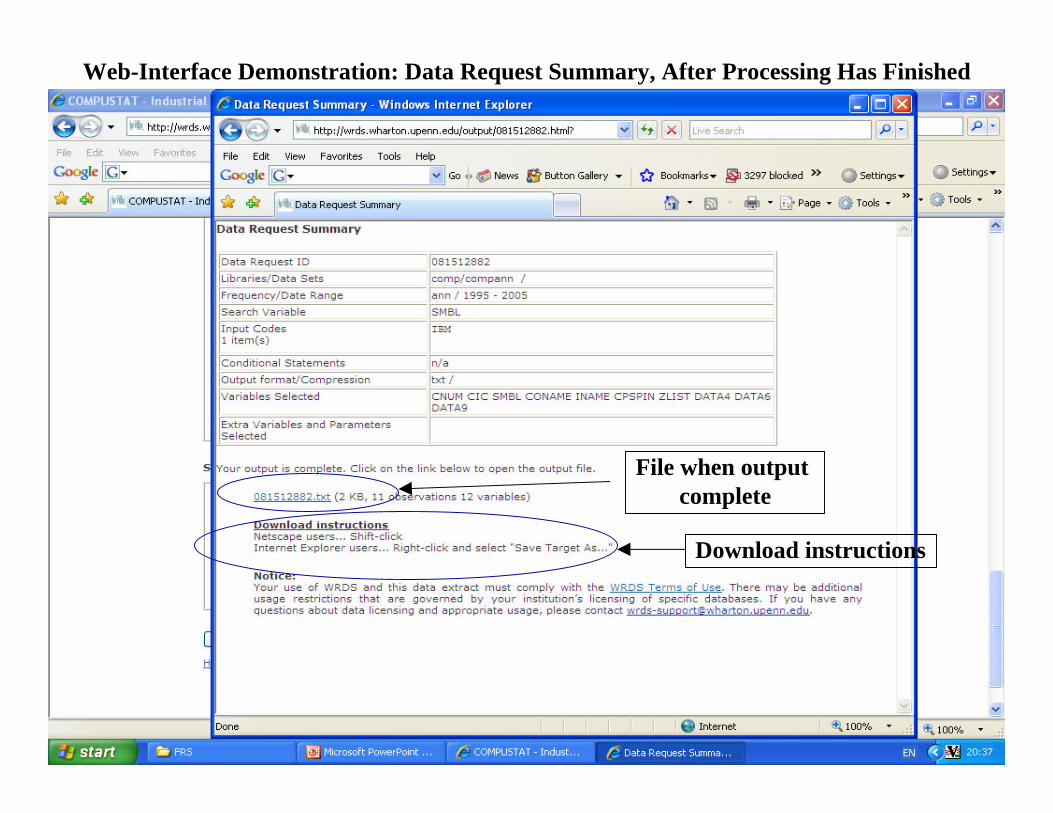
Ø Click on Submit Request to submit the “Request file”Ø A new window (Data Request Summary) opens and keeps on refreshing every 10 seconds till
output is complete.
III. When output is complete, click on filename to view file, or follow “Download instructions”to download file to your pc.
7
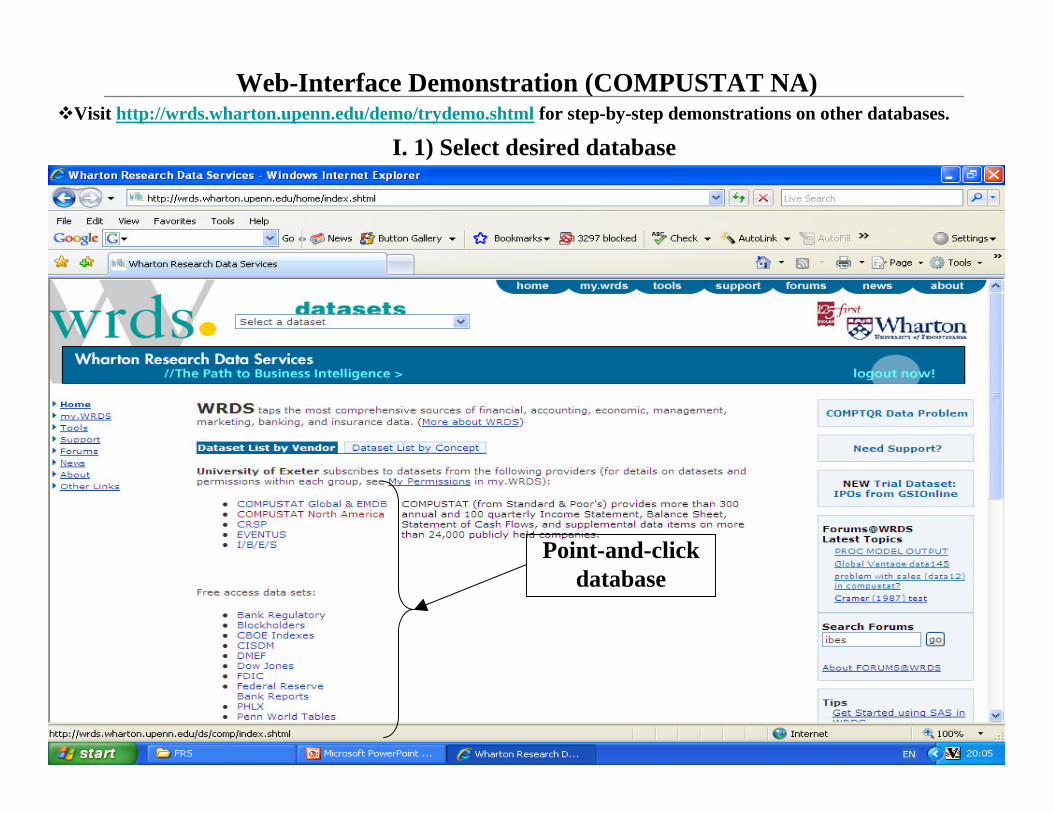
Web-Interface Demonstration (COMPUSTAT NA)
I. 1) Select desired database
Point-and-click database
vVisit http://wrds.wharton.upenn.edu/demo/trydemo.shtml for step-by-step demonstrations on other databases.

8
Web-Interface DemonstrationI. 2) Select desired dataset
Point-and-click data set

9
Web-Interface Demonstration: STEP ONE
Choose frequency
Set time period

10
Web-Interface Demonstration: STEP TWO
Search by Ticker, CUSIP, GVKEY, etc.
Or browse and upload filewith list of identifiers
Either enter identifier(use code lookup if
identifier not known)
Or search entire database
Specify filter
Specify conditionalcriteria, e.g.
11
Web-Interface Demonstration: STEP THREE
Select variables
12
Web-Interface Demonstration: STEP FOUR
Select file formatChoose ‘importable’formats (tab-delimited, .csv, … )
Click on Submit Request
Choose compression type for large extracts
Read me
13
Web-Interface Demonstration: Data Request Summary, After Processing Has Finished
File when output complete
Download instructions
14
Some General Data-Related Issues
• Common company identifiers (CUSIP, SEDOL, Ticker) versus database-specific identifiers (PERMNO, PERMCO, GVKEY, … )
- Each database has its own permanent identifier. A permanent identifier is assigned to a unique company or security and does not change over time, nor re-used. e.g. In CRSP, PERMNO and PERMCO are permanent identifiers for securities and companies, respectively. COMPUSTAT uses GVKEY as the permanent identifier for companies, I/B/E/S uses “TICKER”, …
• Units of measurement, date formats, etc.
• Missing data value codes- Different databases have their own coding system for representing missing values, but
WRDS uses a consistent system (the SAS convention) in coding missing values. See documentation under each ‘dataset’for a translation from original codes to SAS codes. Regular SAS missing value is a “.”, see documentation for “special”missing values.
• Some observations of a particular data series might be recorded in a different format to reflect ‘measurement’differences!
- e.g. PRC in CRSP, if the closing price is not available for any given period, the number in the price field is replaced with a bid/ask average and a 'negative’sign placed in front. If neither price nor bid/ask average is available, Price or Bid/Ask Average is set to zero.
• Some data series (prices, returns, dividends, shares outstanding, etc.) need to be adjusted for capital reorganisations (stock dividends and splits, share repurchases, M&A, etc.). Some data series might still be recorded on an unadjusted basis, in which case you will need to transform the series into 'standardised' series
- e.g. CRSP provide correction factors, FACPR and FACSHR
15
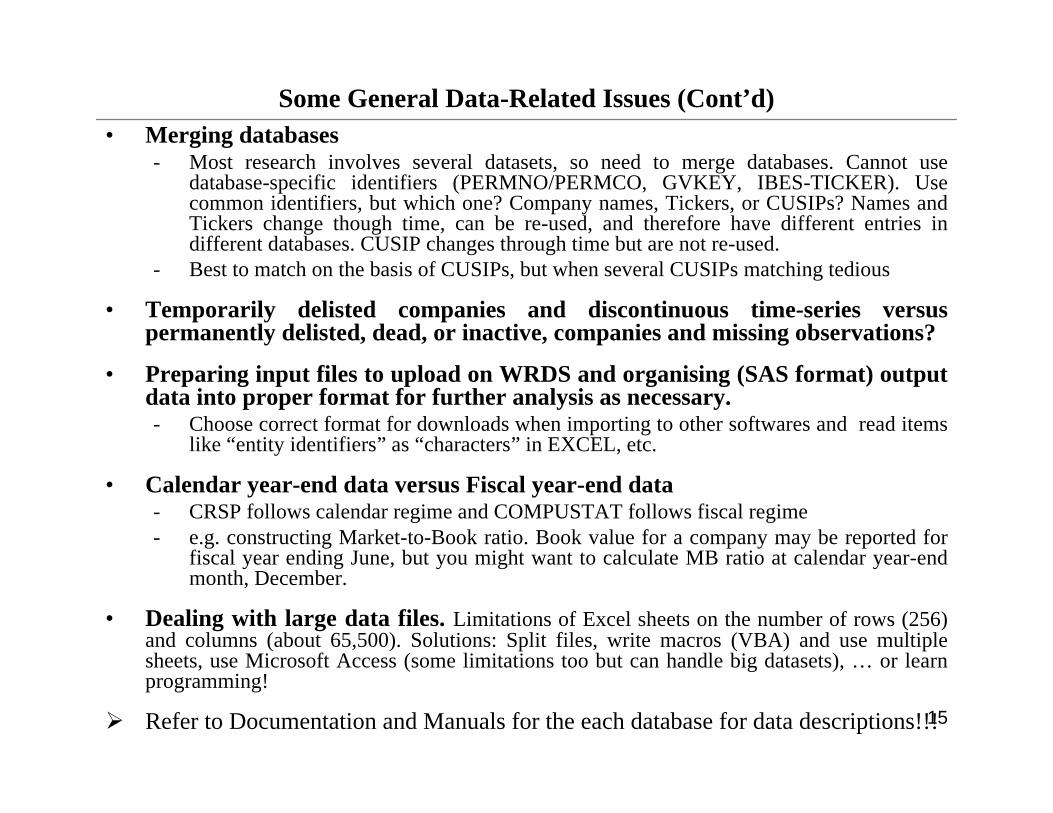
Some General Data-Related Issues (Cont’d)• Merging databases
- Most research involves several datasets, so need to merge databases. Cannot use database-specific identifiers (PERMNO/PERMCO, GVKEY, IBES-TICKER). Use common identifiers, but which one? Company names, Tickers, or CUSIPs? Names and Tickers change though time, can be re-used, and therefore have different entries in different databases. CUSIP changes through time but are not re-used.
- Best to match on the basis of CUSIPs, but when several CUSIPs matching tedious
• Temporarily delisted companies and discontinuous time-series versus permanently delisted, dead, or inactive, companies and missing observations?
• Preparing input files to upload on WRDS and organising (SAS format) output data into proper format for further analysis as necessary. - Choose correct format for downloads when importing to other softwares and read items
like “entity identifiers”as “characters”in EXCEL, etc.
• Calendar year-end data versus Fiscal year-end data- CRSP follows calendar regime and COMPUSTAT follows fiscal regime- e.g. constructing Market-to-Book ratio. Book value for a company may be reported for
fiscal year ending June, but you might want to calculate MB ratio at calendar year-end month, December.
• Dealing with large data files. Limitations of Excel sheets on the number of rows (256) and columns (about 65,500). Solutions: Split files, write macros (VBA) and use multiple sheets, use Microsoft Access (some limitations too but can handle big datasets), … or learn programming!
Ø Refer to Documentation and Manuals for the each database for data descriptions!!!

16
Some Web-Query Examples
• Create dataset of stock returns for a day, month, year, one firm or all firms from CRSP.
• Determine if more than one stock has used the ticker symbol ABC on the NYSE over the last 40 years and find the historical CUSIPs for each, as well as current CRSP and COMPUSTAT ID codes. (Hints: Use Search Company and Identification Search Tool)
• Find all companies (actives and inactives) with sales greater than 1 billion and total assets greater than 5 billions in 1997 and more than 30 years of publicly reported financial statements from COMPUSTAT. (Hints: use Conditional Statements)
• Find the current constituents of the S&P500 and get the price and earnings data (Hints: COMPUSTAT, use CPSPIN)
• Find the constituents of the S&P small-cap index from 2000 to 2006 and get their accounting data (Hint: use COMPUSTAT PDE Monthly format, CPSPIN)
• Get financial statement extracts for one or multiple companies (COMPUSTAT Search Tool)
• Get financial statement data and Ratios for a company (ValuationTool/COMPUSTAT Tool)
17
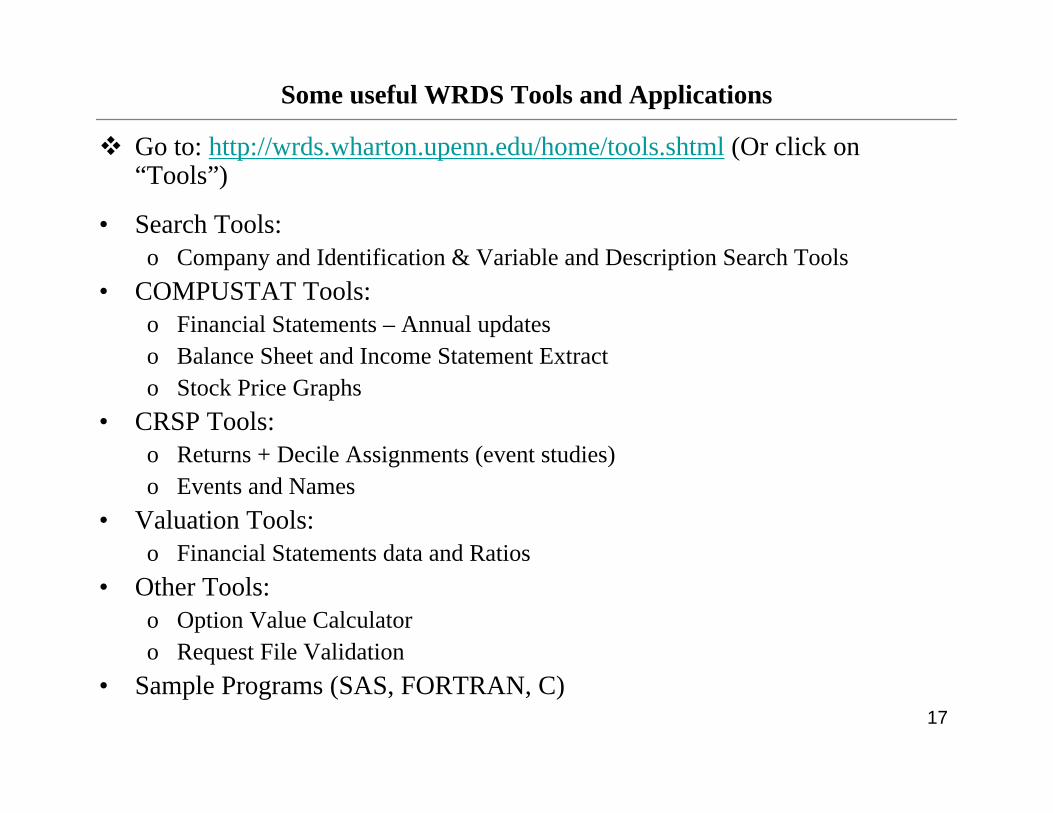
Some useful WRDS Tools and Applications
v Go to: http://wrds.wharton.upenn.edu/home/tools.shtml (Or click on “Tools”)
• Search Tools:o Company and Identification & Variable and Description Search Tools
• COMPUSTAT Tools:o Financial Statements –Annual updateso Balance Sheet and Income Statement Extract o Stock Price Graphs
• CRSP Tools:o Returns + Decile Assignments (event studies) o Events and Names
• Valuation Tools:o Financial Statements data and Ratios
• Other Tools:o Option Value Calculatoro Request File Validation
• Sample Programs (SAS, FORTRAN, C)

18
WRDS Research Applications
v Note: Sample programs and codes require WRDS-UNIX (or PC/SAS) environment.
v Go to: http://wrds.wharton.upenn.edu/support/researchapp.shtml (Or click on “Support”)
I. Portfolio Construction and Benchmarks:• Momentum Strategies/Portfolios (Jegadeesh and Titman, Journal of Finance,
1993)
• Portfolios by Size and Book-to-Market• The Size/Book To Market/Momentum Benchmarks (Daniel, Grinblatt,
Titman, and Wermers, Journal of Finance, 1997)
II. Programming Examples:• Beta Estimation• Calculate Compounded Returns• Calculate Compounded Return 3 Months After Fiscal Year Ends• Compounded Returns Accounting for Delisting Events• Dynamic Conditional Correlation-GARCH models (Engle, Journal of
Business and Economic Statistics, 2002)
• Heteroscedasticity-Consistent (HC) Standard Errors• Linking I/B/E/S and CRSP Data • Run an Event Study (Compare EVENTUS Software)

19
WRDS Research Applications (Cont’d)
III. Guides and codes on Other Topics:• Database Biases and Errors • SIC, International, Industry Classification Schemes: Effects on
Research• Guide to ADRs• Guide to Closed-End Funds• Guide to IPO Databases and Research• Guide to M&A Databases and Research• Guide to Option Pricing Models• Different ways to obtain Market-to-Book ratios using COMPUSTAT
files• How to obtain S&P500 information?• Calculating Tobins’s Q

20
Performing an EVENTUS Web Query to Run an Event Study• EVENTUS Software performs event studies using data directly from CRSP
stock databases or pre-extracted from any source. • Refer to Appendix A2 for a description.• EVENTUS web query run only when data taken directly from CRSP.
v An EVENTUS web query requires the following specifications:I. Most important is to create a REQUEST FILE that contains:
1) the input codes (PERMNO or CUSIP) that identify the stocks and2) the associated event dates.Ø File Format? In general, a simple text file (.txt) with one space between the
identifier and the date will work. Click on “Sample Request files”for some examples and details on formats. You can use “Request File Validation”tool to check whether your file has the right format.
Ø EVENTUS automatically calls all other files from CRSP for your given identifers.
Ø A sample Request File with PERMNOs and event dates (Text format):
21
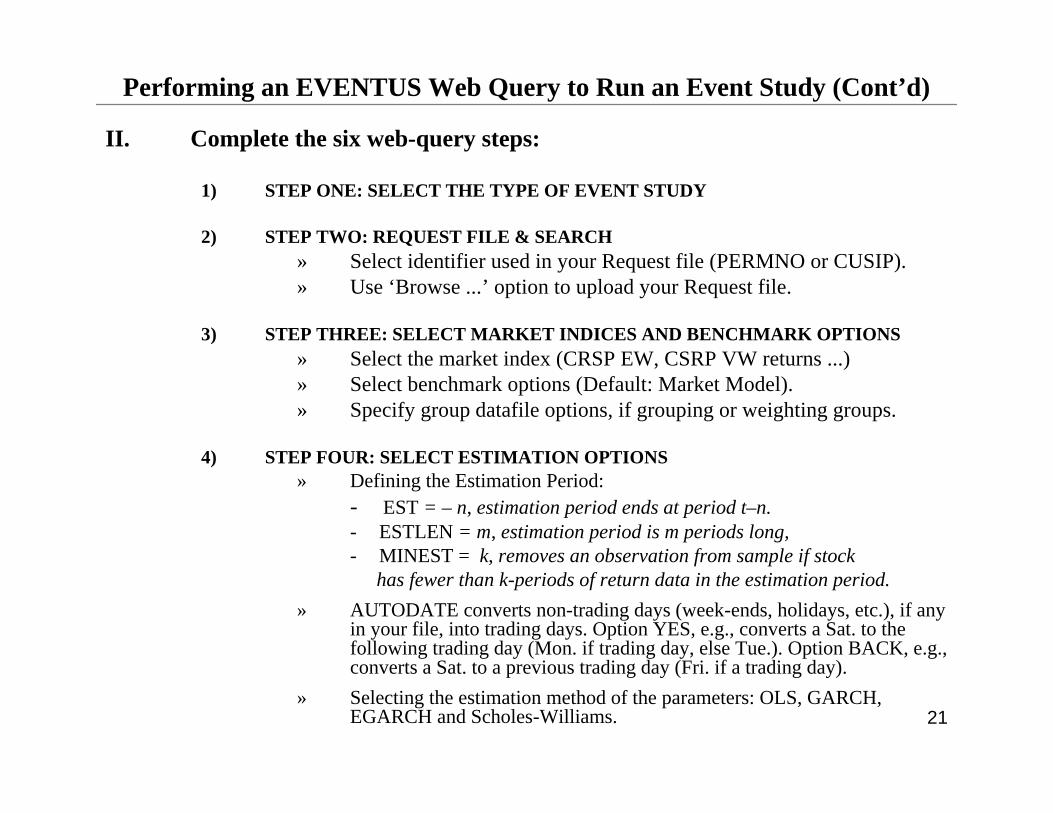
Performing an EVENTUS Web Query to Run an Event Study (Cont’d)
II. Complete the six web-query steps:
1) STEP ONE: SELECT THE TYPE OF EVENT STUDY
2) STEP TWO: REQUEST FILE & SEARCH» Select identifier used in your Request file (PERMNO or CUSIP).» Use ‘Browse ...’option to upload your Request file.
3) STEP THREE: SELECT MARKET INDICES AND BENCHMARK OPTIONS» Select the market index (CRSP EW, CSRP VW returns ...)» Select benchmark options (Default: Market Model).» Specify group datafile options, if grouping or weighting groups.
4) STEP FOUR: SELECT ESTIMATION OPTIONS» Defining the Estimation Period:
- EST = –n, estimation period ends at period t–n.- ESTLEN = m, estimation period is m periods long, - MINEST = k, removes an observation from sample if stock
has fewer than k-periods of return data in the estimation period.» AUTODATE converts non-trading days (week-ends, holidays, etc.), if any
in your file, into trading days. Option YES, e.g., converts a Sat. to the following trading day (Mon. if trading day, else Tue.). Option BACK, e.g., converts a Sat. to a previous trading day (Fri. if a trading day).
» Selecting the estimation method of the parameters: OLS, GARCH, EGARCH and Scholes-Williams.

22
Performing an EVENTUS Web Query to Run an Event Study (Cont’d)
5) STEP FIVE: EVENT WINDOWS SPECIFICATIONS» PRE and POST define the length of the Event period for which you will
obtain CARs or BHARs.» The Alternative Windows specifications will define the event windows
for which EVENTUS will compute the CARs or BHARs.
6) STEP SIX: EVENT TESTS
» Select from different options of Statistical Tests» Select to add or suppress some output details from Output file
Ø Click on Submit Request to submit the “Request file”Ø A new window (Data Request Summary) opens and keeps on refreshing
every 10 seconds till output is complete.
III. When output is complete, click on filename to view file, or follow “Download instructions”to download file to your pc.
• Refer to EVENTUS manual for descriptions of all the options used.• When using Non-CRSP data, can run customised SAS programs on WRDS-
UNIX and PC/SAS. Can also do Plots and Graphics, not available in web-query.• You will get exactly the same results as the web query if you run an EVENTUS
SAS program (specifying the same options) on WRDS-UNIX or PC/SAS.

23
Students who need to use WRDS-UNIX and UNIX-basedEVENTUS:
To get you started, instructions and some sample programs will be published into WebCT, Lecture 12 Part II.
A demonstration session will be arranged depending on the number of users.
Good luck!