
Introduction to Wireless Local Loop, Second Edition
421
Introduction to Wireless Local Loop, Second Edition: Broadband and Narrowband Systems
Transcript of Introduction to Wireless Local Loop, Second Edition
Introduction to Wireless Local Loop,Second Edition:
Broadband and Narrowband Systems

Introduction to Wireless Local Loop,Second Edition:
Broadband and Narrowband Systems
William Webb
Artech HouseBoston � London
www.artechhouse.com
Library of Congress Cataloging-in-Publication DataWebb, William, 1967�
Introduction to wireless local loop : broadband and narrowbandsystems / William Webb. � 2nd ed.
p. cm. � (Artech House mobile communications series)Includes bibliographical references and index.ISBN 1-58053-071-0 (alk. paper)1. Wireless communication systems. 2. Telecommunication�Switchingsystems. 3. Local loop (Telephony). I. Title. II. Artech Housemobile communications library.
TK5103.2.W43 2000384.5�36�dc21 00-29990
CIP
British Library Cataloguing in Publication DataWebb, William, 1967�
Introduction to wireless local loop : broadband andnarrowband systems. � 2nd ed. � (Artech House mobilecommunications library)1. Wireless communication systems 2. Telecommunication�Switching systemsI. Title384.5�35
ISBN 1-58053-071-0
Cover design by Igor Valdman
© 2000 ARTECH HOUSE, INC.685 Canton StreetNorwood, MA 02062
All rights reserved. Printed and bound in the United States of America. No part ofthis book may be reproduced or utilized in any form or by any means, electronic ormechanical, including photocopying, recording, or by any information storage andretrieval system, without permission in writing from the publisher.
All terms mentioned in this book that are known to be trademarks or servicemarks have been appropriately capitalized. Artech House cannot attest to the accu-racy of this information. Use of a term in this book should not be regarded asaffecting the validity of any trademark or service mark.
International Standard Book Number: 1-58053-071-0Library of Congress Catalog Card Number: 00-29990
10 9 8 7 6 5 4 3 2 1
Contents
Preface xvii
Acknowledgments xix
Part I Setting the scene 1
1 Introduction 3
1.1 What is wireless local loop? 3
1.2 Why a book on wireless local loop? 5
1.3 Acronyms and terminology 6
1.4 How to read this book 7
2 The converging world of telephony, TV,and computers 9
2.1 A very confused global marketplace 9
2.2 Telecommunications 11
2.3 Broadcasting 13
2.4 Computing 15
2.5 The impact of IP on convergence 16
v
2.6 The new competing environment 17
2.7 Predicting what the user will require 19
Reference 22
3 Access technologies 23
3.1 Access 23
3.2 Access via twisted pair 25
3.2.1 Voiceband modems 25
3.2.2 ISDN 26
3.2.3 xDSL technologies 27
3.3 Access via coax 32
3.4 Access via TV broadcast 34
3.5 Access via mobile radio 35
3.5.1 Cellular systems 35
3.5.2 Cordless systems 37
3.6 Access via WLL 37
3.6.1 Narrowband systems 38
3.6.2 Broadband systems 38
3.7 Access via power-line technology 39
3.8 Summary of access technologies 39
References 40
Part II Why wireless? 43
4 Telecommunications environments worldwide 45
4.1 The world telecommunications environment 45
4.2 Developing countries 47
4.3 Eastern Europe 50
4.4 First World countries 53
vi Introduction to Wireless Local Loop
4.4.1 High penetration, limited competition 54
4.4.2 High penetration, high competition 56
4.4.3 The U.K. marketplace 57
4.5 History of WLL 60
4.6 The business of subsidization 64
Reference 65
5 The economics of wireless versus fixed 67
5.1 The economics of telecommunications systems 67
5.2 The cost of wired systems 68
5.3 The cost of wireless systems 71
5.4 Hybrid systems 74
5.5 Market forecasts 75
5.5.1 Forecasting methodology 78
Reference 79
6 Wireless local loop markets 81
6.1 Introduction 81
6.2 What went wrong? 82
6.3 How the market will change in the future 84
Part III Technical information about wireless 87
7 Radio propagation 89
7.1 Introduction 89
7.1.1 Distance-related attenuation 90
7.1.2 Slow fading 91
7.1.3 Fast fading 91
7.2 The line-of-sight channel 94
Contents vii
7.2.1 Diffraction 94
7.2.2 Reflection 97
7.3 Time variation in channels 98
7.3.1 Fast fading 98
7.3.2 New obstructions 99
7.3.3 Rainfall 99
7.4 Wideband channels 100
7.5 Frequencies for WLL 101
7.6 Predicting WLL coverage 103
References 105
8 Radio systems 107
8.1 Speech coding 107
8.2 Error-correction coding and interleaving 112
8.3 Ciphering 116
8.4 Modulation 117
8.5 Multiple access 118
8.5.1 FDMA 120
8.5.2 TDMA 122
8.5.3 CDMA 124
8.6 The use of spreading codes in a CDMA system 128
8.7 Orthogonal frequency division multiplexing 134
8.8 Packet and circuit switching 138
8.9 Time division duplex transmission 139
References 140
9 TDMA or CDMA? 141
9.1 Introduction to the debate 141
viii Introduction to Wireless Local Loop
9.2 Capacity comparison 142
9.2.1 TDMA capacity 142
9.2.2 CDMA capacity 142
9.2.3 Why the higher capacity with CDMA? 144
9.2.4 Is CDMA capacity really higher? 146
9.2.5 Should all WLL operators use CDMA? 146
9.3 Comparison of other factors 146
9.3.1 Range 146
9.3.2 Sectorization 147
9.3.3 Frequency planning 148
9.3.4 Operation in unlicensed bands 148
9.3.5 Macrocells versus microcells 149
9.3.6 Cost 149
9.3.7 Bandwidth flexibility 149
9.3.8 FH-CDMA versus DS-CDMA 150
9.3.9 CDMA for broadband applications 150
9.4 Summary 151
Reference 152
Part IV Wireless radio technologies 153
10 Overview of technologies 155
10.1 Introduction 155
10.1.1 Standards 157
10.1.2 Adapting equipment 157
10.1.3 Differing needs 158
10.2 Standardization activities 158
10.3 Segmenting the technologies 160
10.4 Matching the technology to the requirement 161
10.5 The important information 162
Contents ix
11 The cordless technologies 165
11.1 Introduction 165
11.2 DECT 167
11.3 PHS 172
11.4 CT-2 173
11.5 Summary of cordless systems 174
References 177
12 The cellular technologies 179
12.1 Introduction 179
12.2 Analog cellular 180
12.3 Digital cellular 181
12.3.1 GSM 182
12.3.2 cdmaOne 184
12.4 Future cellular systems 186
12.5 Summary of cellular systems 190
Reference 191
13 The proprietary technologies 193
13.1 Introduction 193
13.2 The TDMA technologies 194
13.2.1 Nortel Proximity I 194
13.2.2 Innowave Multigain 195
13.3 The CDMA technologies 196
13.3.1 Airspan Communications 196
13.3.2 Lucent AirLoop 197
13.3.3 Interdigital Broadband CDMA 200
13.3.4 Granger CD2000 201
x Introduction to Wireless Local Loop
13.4 Other technologies 201
13.5 Summary 202
14 The broadband technologies 205
14.1 Introduction 205
14.2 Can WLL provide broadband services? 210
14.2.1 Technical constraints on broadband WLL systems 210
14.2.2 Practical and economic constraints onbroadband systems 214
14.3 MMDS 219
14.3.1 Upbanded cable modems 221
14.4 LMDS 222
14.5 MVDS and other TV distribution systems 226
14.5.1 CABSINET 228
14.6 Wireless LAN systems 229
14.7 HiperAccess 230
14.8 Broadband proprietary products 231
14.8.1 Floware 232
14.8.2 Telescicom 232
14.8.3 Adaptive Broadband and Ensemble 232
14.9 Mesh networks 233
References 236
15 Choosing the right technology 239
15.1 Introduction 239
15.2 Capacity comparison 240
15.3 Cost comparison 241
15.4 Functionality comparison 242
Contents xi
15.5 Summary 242
15.5.1 The available frequency bands 243
15.5.2 The subscriber density 244
15.5.3 The competitive situation 244
16 Looking at a technology in detail: cdmaOne 247
16.1 Introduction 247
16.2 System architecture 247
16.3 PSTN to WAM interconnection 249
16.3.1 Physical interface 249
16.3.2 V5.2 digital interface 249
16.3.3 V5.2 protocol flow 250
16.3.4 System configuration using a network interface unit 250
16.4 Wireless access manager 252
16.4.1 Wireless system controller (WiSC) 252
16.4.2 Transcoder (XCDR) 253
16.4.3 Interworking unit (IWU) 253
16.5 Base stations 253
16.5.1 SC2450 CDMA BTS 253
16.5.2 SC614 CDMA BTS 253
16.6 Fixed wireless terminal 254
Part V Deploying wireless local loop systems 259
17 Getting a license 261
17.1 Spotting the opportunity 261
17.1.1 Developing countries 262
17.1.2 Eastern European countries 263
17.1.3 First World countries 265
17.2 Writing the license application 266
xii Introduction to Wireless Local Loop
17.3 Radio spectrum for WLL 267
17.3.1 Finding radio spectrum for WLL 268
17.3.2 Regulatory matters 270
17.3.3 Fixed and mobile applications 272
17.3.4 Manufacturing WLL equipment for the world market 273
17.4 Radio spectrum issues 274
17.4.1 Radio spectrum management 274
17.4.2 Modern allocation and assignment methods 282
17.4.3 Implications of new spectrum management techniquesfor the WLL operator 288
References 289
18 Choosing a service offering 291
18.1 Introduction 291
18.2 Possible components of the service offering 292
18.2.1 Plain old telephony service (POTS) 293
18.2.2 ISDN 293
18.2.3 Fax 293
18.2.4 Data 293
18.2.5 Videophone 293
18.2.6 Supplementary services 294
18.2.7 Centrex 294
18.2.8 Operator services 295
18.2.9 Multiple lines 295
18.2.10 Leased lines 295
18.2.11 Internet service provision 297
18.2.12 Long-distance and international services 297
18.3 Mobility in the local loop 298
Reference 303
Contents xiii

19 Developing the business case 305
19.1 The overall structure of the business case 305
19.2 The network build costs 307
19.2.1 Subscriber equipment costs 307
19.2.2 Network costs 309
19.2.3 Combining the cost elements 311
19.3 The ongoing costs 311
19.4 Predicting revenue 313
19.5 Financing arrangements 317
19.6 Summary financial statistics 319
19.7 Tariffing policies 322
19.8 Analyzing the business case 323
Reference 326
20 Rolling out the network 327
20.1 Introduction 327
20.2 Selecting the number of cells 329
20.3 Selecting the cell sites 333
20.4 Connecting the cells to the switch 337
20.4.1 Leased link 337
20.4.2 Microwave links 338
20.4.3 Satellite links 342
20.4.4 Protocols used for the interconnection 343
20.5 Installing the subscriber units 345
20.6 Billing, customer care, and related issues 346
20.7 Summary 346
References 347
xiv Introduction to Wireless Local Loop

21 Case study 349
21.1 Introduction 349
21.2 Market demand forecast 349
21.2.1 Provision of lines 350
21.2.2 Determining the service offering 351
21.2.3 Traffic routing 352
21.3 System grade of service 353
21.4 Vendor selection 355
21.5 Radio spectrum requirements 355
21.5.1 Spectrum efficiency 355
21.5.2 Spectrum requirements 356
21.6 Numbering requirements 358
21.7 Network build plan 359
21.8 Network configuration 359
21.8.1 Interswitch links 360
21.8.2 Interswitch signaling system 361
21.8.3 Interswitch synchronization 361
21.8.4 Base station to switch links 361
21.9 Traffic matrix and routing 362
21.10 Summary 363
22 The future 365
22.1 Introduction 365
22.2 Technical advances in WLL 366
22.3 Technical advances in other access techniques 367
22.4 Changing user demand 369
22.4.1 Voice is mobile, data is fixed 371
22.4.2 Where will the broadband revolution end? 371
Contents xv

22.5 The future for WLL 372
List of acronyms and abbreviations 375
About the author 383
Index 385
xvi Introduction to Wireless Local Loop

Preface
L ike many in the field of wireless local loop, I gained my expertise inthe area of cellular and cordless radio. On moving into the wireless
local loop environment, my first reaction was to seek a good referencework that would help me understand the concepts and issues behind it.No such work appeared to exist, although many colleagues acknowl-edged the urgent need for one. This book is an attempt to integratethe knowledge I have gained through a wide range of sources into anintroductory text on wireless local loop.
The intention here is to provide a reference that those new to the areaof wireless local loop can consult to understand what it is all about and tobe able to differentiate the issues that will be key to their needs. The aimalso is to provide sufficient background information that the book hasvalue as a reference when particular parameters or methods are required.
The intention has not been to produce a scholarly tome, replete withcomplex equations and exhaustive reference lists. Those coming to thisarea are unlikely to have the time or inclination to consult such a text.Further, most of the theory is identical to that already widely publishedfor mobile radio systems, and it seems unnecessary to repeat it here.Instead, the book deliberately has been kept to a length that allows busyexecutives to read it quickly and easily. Key issues are explained intui-tively, rather than mathematically, allowing this book to be of use outsidescholarly environments. Indeed, the focus on pragmatic and practical
xvii
issues rather than on theoretical understanding makes the book appro-priate for those who have to work with real deployments of wireless localloop networks.
The first edition of this book was completed during the latter part of1997, at a time when the first wireless local loop networks were only justbeing deployed. The industry was still very much in its infancy and therewere many lessons still to be learned. During 1998 and the first part of1999, the first edition lived up to its promise to provide a text for thoseworking with real WLL networks. However, as expected, much changedin the world of WLL during 1998 and 1999. Key changes included:
◗ The market for WLL did not materialize at the speed predictedearlier;
◗ New broadband technologies emerged much more rapidly than hadpreviously been forecast;
◗ Alternative means of providing WLL systems based on wirelesslocal area networks and cable modems were developed by anumber of organizations;
◗ The number of different WLL technologies available continued toincrease with little sign of a de facto standard emerging.
My personal circumstances also changed�I moved from NetCom Con-sultants, where I completed the first edition of this book, to working forMotorola, one of the largest manufacturers of WLL equipment in theworld. This change provided me with a broader outlook on the issues inthe WLL industry, which I have sought to encapsulate in this secondedition.
I have taken the opportunity to write a second edition to bring thebook up to date and to take all of these trends into account. New chaptershave been added looking at WLL deployments to date, the current WLLmarket, and broadband technologies. Substantial sections have beenadded on predictions of user requirements and on the emerging UMTSmobile standard and its potential role within a WLL deployment. Manyother sections have been substantially updated with more materialadded. As a result, the second edition is around 25% longer than the first,reflecting the increased body of knowledge available within the WLLindustry.
xviii Introduction to Wireless Local Loop
As before, this book is divided into five parts. The first sets out thecompetitive scene including the role of wireless local loop among fixed,cable, cellular, and cordless networks. The second details the role of wire-less local loop in a range of environments and the economics relative tofixed networks. Part III provides a short technical background includingpropagation and access techniques for those who are interested, andPart IV looks in detail at the different technologies available and themeans of selecting between them. Finally, Part V details the experiencegained to date in deploying wireless local loop systems.
Acknowledgments
A book is never the work of a single individual. Some of the experiencereported here was gained while working at NetCom Consultants, along-side Mark Cornish, David De Silva, Robert Lesser, Don Pearce, and SteveWoodhouse. At Motorola, Raghu Rau, John Thode, Bill Gorden, SergePequeux, and many in the WASD team provided valuable input. I havealso gained much from previous colleagues, and in particular ProfessorRaymond Steele who taught me the principles of radio communicationsand how to write. Finally, thanks to my wife, Alison, who has not com-plained as I have written one book after another, taking up the valuabletime that we have together, and who even greeted the proposal that Iupdate this book with good humor and encouragement.
Preface xix

Setting the scene
IP A R T

Introduction
1.1 What is wirelesslocal loop?
In principle, wireless local loop (WLL) is asimple concept to grasp: It is the use of radioto provide a telephone connection to thehome. In practice, it is more complex toexplain because wireless comes in a range ofguises, including mobility; because WLL isproposed for a range of environments; andbecause the range of possible telecommuni-cations delivery is widening.
Figure 1.1 is a simplistic diagram of therole of WLL in the world. In a simple world, ahouse is connected to a switch first via a localloop, then through a distribution node onto atrunked cable going back to the switch. His-torically, the local loop was copper cable bur-ied in the ground or carried on overheadpylons, and the trunked cable was composedof multiple copper pairs. WLL replaces thelocal loop section with a radio path ratherthan a copper cable. It is concerned only with
3
Contents
1.1 What is wirelesslocal loop?
1.2 Why a book onwireless local loop?
1.3 Acronyms andterminology
1.4 How to read thisbook
1C H A P T E R

the connection from the distribution point to the house; all other parts ofthe network are left unaffected. In a WLL system, the distribution point isconnected to a base station; a transmit/receive radio device is mounted onthe side of the house, in much the same manner as a satellite receiverdish; and a cable is run down the side of the house to a socket inside thehouse. The socket is identical to the one into which users currently plugtheir home telephones. Hence, apart from a small transceiver on the sideof their house, the home subscriber does not notice any difference.
Using radio rather than copper cable has a number of advantages. It isless expensive to install a radio than to dig up the road, it takes less time,and radio units are installed only when the subscribers want the service,unlike copper, which is installed when the houses are built. That begs thequestion as to why copper was ever used. As will be seen, it is only in thelast six years that advances in radio technology have brought the cost ofradio equipment below the cost of copper cabling. Hence, since around1994, WLL has steadily become the most appropriate way to connectsubscribers.
4 Introduction to Wireless Local Loop
Switch
Distributionpoint
Distributionpoint
Distributionpoint
Home
Home
Home
Home
TraditionalWLL
ReplacementWLL
Figure 1.1 The role of WLL.
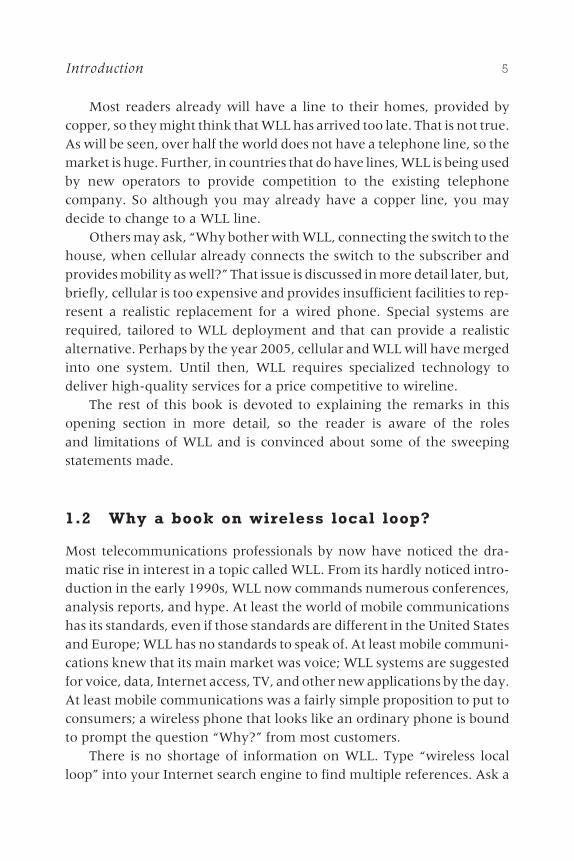
Most readers already will have a line to their homes, provided bycopper, so they might think that WLL has arrived too late. That is not true.As will be seen, over half the world does not have a telephone line, so themarket is huge. Further, in countries that do have lines, WLL is being usedby new operators to provide competition to the existing telephonecompany. So although you may already have a copper line, you maydecide to change to a WLL line.
Others may ask, �Why bother with WLL, connecting the switch to thehouse, when cellular already connects the switch to the subscriber andprovides mobility as well?� That issue is discussed in more detail later, but,briefly, cellular is too expensive and provides insufficient facilities to rep-resent a realistic replacement for a wired phone. Special systems arerequired, tailored to WLL deployment and that can provide a realisticalternative. Perhaps by the year 2005, cellular and WLL will have mergedinto one system. Until then, WLL requires specialized technology todeliver high-quality services for a price competitive to wireline.
The rest of this book is devoted to explaining the remarks in thisopening section in more detail, so the reader is aware of the rolesand limitations of WLL and is convinced about some of the sweepingstatements made.
1.2 Why a book on wireless local loop?
Most telecommunications professionals by now have noticed the dra-matic rise in interest in a topic called WLL. From its hardly noticed intro-duction in the early 1990s, WLL now commands numerous conferences,analysis reports, and hype. At least the world of mobile communicationshas its standards, even if those standards are different in the United Statesand Europe; WLL has no standards to speak of. At least mobile communi-cations knew that its main market was voice; WLL systems are suggestedfor voice, data, Internet access, TV, and other new applications by the day.At least mobile communications was a fairly simple proposition to put toconsumers; a wireless phone that looks like an ordinary phone is boundto prompt the question �Why?� from most customers.
There is no shortage of information on WLL. Type �wireless localloop� into your Internet search engine to find multiple references. Ask a
Introduction 5

conference organizer for documentation from WLL conferences, andyou will need several helpers to carry it all away. Why, then, even moreinformation on WLL?
The problem with the information currently available is that it all isessentially promotional material. As you will see later in the book, manylarge industrial concerns are vying for a share of a market that could be asizable fraction of that of the global cellular industry. The success ofeach competitor depends on its convincing the world telecommunica-tions community that its product or service is the best. The claims andcounterclaims are confusing, often misleading, and sometimes com-pletely incorrect. It is against that background that the need for anobjective assessment becomes apparent.
There are many things a book can do. It is a good opportunity to put atopic into context, to provide background information, and to analyzeimportant issues in detail. There also are things a book cannot do. Thetime taken to write, edit, print, and distribute a book means that, at best, itwill be at least six months out of date by the time of publication. Hence, inthis book, there is no attempt to analyze comprehensively all the offeringsfrom different manufacturers; such information would be out of datebefore the book was even in print. Instead, the different techniques andapproaches adopted are analyzed to provide general guidelines withinwhich each technology can be considered.
It also is worth remembering even with this second edition thatWLL is still in its infancy. Hence, this book cannot provide authoritativeand final answers based upon exhaustive experience. The informationgathered from a range of sources will be proved in some cases; in othercases, it will be provisional.
1.3 Acronyms and terminology
Like most other technical fields, WLL abounds in acronyms. A full list ofacronyms is provided at the end of this book, but before venturing intosuch a list, the issue of what WLL actually is needs to be addressed.
The term wireless local loop is the concatenation of the terms wirelessand local loop. Few readers will have any problems understanding wire-less; it is, of course, the transfer of information without the use of wires,which implicitly means using the electromagnetic spectrum and typically
6 Introduction to Wireless Local Loop
the part of that spectrum known as radio. Local loop is the part of the tele-communications network that connects homes to the nearest local switchor distribution point. Thus, wireless local loop is the use of radio to make aconnection from some local switching or distribution point in the fixednetwork to a number of houses. The reason why anyone would want todo that is introduced in Chapters 2 and 3.
The abbreviation WiLL, used by the major manufacturer Motorola,means the same thing. The U.K. government decided to rename the termradio fixed access (RFA). Other similar terms in widespread use include fixedradio access (FRA) and radio in the local loop (RLL). WLL, however, appearsto be the most widely used acronym; hence, that is the term usedthroughout this book. (WiLL is used only to indicate Motorola�s WLLradio technology.)
WLL is assumed to be a generic category covering all fixed systems,including MMDS and LMDS. This will be explained in more detail insubsequent chapters.
1.4 How to read this book
Few professionals have the time or the inclination to read an entire book.Many readers will come to this book with substantial prior knowledgeand their particular agendas as to what they want to gain from the timeand effort involved in reading it. With that in mind, this book has beenassembled on a compartmentalized basis, allowing readers to read onlythe parts that are of interest to them. Further, the book has been kept rela-tively short. It is tempting to fill a book with all the background informa-tion that might be relevant, but here a conscious effort has been made tokeep the information presented to a minimum and to provide a fewchoice, widely available references, to allow readers to gain the maxi-mum from their efforts to read the book.
The book is divided into five discrete parts, as follows:
◗ Part I provides some background information to the telecommuni-cations environment and introduces the concepts of convergenceand access technologies. Part I places WLL in a wider and rapidlychanging telecommunications environment. It should be of interestto all readers, except perhaps corporate strategists who are alreadywell versed in its concepts.
Introduction 7

◗ Part II explains why in the last 10 years the concept of using wirelessin the local loop has emerged to challenge the traditional approachof laying copper cable. It first looks at the needs of the different partsof the world and then discusses, in general terms, the relative eco-nomics of wired and wireless interconnection. It finishes with somemarket forecasts for WLL. Part II will be of most interest to readersnew to the world of WLL. Those who have visited a few WLLconferences will be familiar with the material and can pass it over.
◗ Part III provides some technical information on wireless. A goodunderstanding of many of the key parameters, such as range andcapacity, both of which have a critical effect on network economics,can be reached only with a little technical background. Part III looksat radio propagation and radio systems and considers a key debate:whether code division multiple access (CDMA) or time divisionmultiple access (TDMA) forms the most appropriate access tech-nique. Readers prepared to take on trust later claims relating totechnology can skip the chapters in this section.
◗ Part IV is concerned with selection of the most appropriate technol-ogy. In a world where there are no standards and over 30 compet-ing systems, such a choice is both complex and critically important.The different technologies available are introduced and impartiallyevaluated. Chapter 15 provides guidance on the process of making aselection. Everyone involved in technology selection should readthe chapters in this section.
◗ Part V moves away from theory and technology and looks at thedeployment of a WLL system. It describes license application,examines selection of a service offering, and develops the businesscase. It finishes by looking at network deployment and customercare issues. Part V will be of interest to all those involved in manag-ing the deployment and operation of a WLL network.
Part I now continues with two more chapters: Chapter 2 introducesthe converging world of telephony, TV, and computing, a convergencethat is dramatically shaping WLL offerings. Chapter 3 looks at thedifferent access technologies with which WLL will be competing for amarket share.
8 Introduction to Wireless Local Loop
The convergingworld of telephony,TV, and computers
2.1 A very confused globalmarketplace
The world of telecommunications used tobe much simpler. For most of its 100-yearhistory, the only option was getting a fixedline from the national (monopoly) operator.A variable was introduced in the mid-1980s, when mobile phones became a viableservice but only as an addition to a fixedphone�quality was too poor and cost toohigh to use a mobile phone when a fixedphone was an option.
The world of broadcasting also was sim-ple. TV signals were broadcast terrestriallyin the UHF frequency band (typically 400to 800 MHz), and anyone with a rooftopantenna and a TV receiver could receivethem. Then along came cable and satellite,both offering a much higher number of
9
Contents
2.1 A very confusedglobal marketplace
2.2 Telecommunications
2.3 Broadcasting
2.4 Computing
2.5 The impact of IP onconvergence
2.6 The newcompeting environment
2.7 Predicting what theuser will require
2C H A P T E R

channels. For our purposes, satellite systems can be considered similar toterrestrial systems: Both use radio spectrum to broadcast their signals.Cable, however, is different. High-bandwidth wired connections to cus-tomers opened new opportunities.
The world of computing also was happily doing its own thing. Fewcomputers were connected to anything other than internal networks,and all computer connections were by wire, not by radio. Corporatenetworks were connected with dedicated connections, and home userswere not connected into anything.
Then a number of developments started to blur the boundariesbetween those different areas:
◗ Telecommunications operators started to look at how to sendmore information to users, opening the door to the possibility ofproviding TV and computing information via telecommunicationschannels.
◗ Broadcast providers started to provide telecommunications in addi-tion to broadcasting, for example, cable operators began providingtelephony services.
◗ Connecting a computer to the Internet via a telecommunicationsmedium rapidly gained popularity.
Today, almost every delivery medium aims at providing telephony,broadcast entertainment, and computer services. That is the convergencethat many in the field have talked about for so long. To labor a point andfor those for whom �convergence� is nothing more than a useful term touse in conversations with clients, consider this: Your local cable operatorwill offer you broadcast TV, telephony, and Internet access all through thesame line. By clicking an icon on an Internet Web page, you can auto-matically call the company whose Web page you are viewing. Based onyour questions, the company can change the Web page you are viewingor help you download a video clip, which you can then view on yourpersonal computer (PC) or as a short program on your TV set. Suchservice is available today and is gaining rapidly in capability and ubiquity.
The effect is that the traditional boundaries are lost. Phone calls nowlink computers. Broadcast TV now provides Internet data. Internet linksprovide voice conversation. A WLL operator in all but the least developed
10 Introduction to Wireless Local Loop

countries that ignores the evolution of convergence is unlikely to survive.This chapter examines those trends and summarizes the new competingforces.
2.2 Telecommunications
In the major countries in the world, most households are linked via a cop-per line into the public switched telephone network (PSTN), the world�slargest man-made network, which allows anyone to phone anywhere ina few seconds�anyone, that is, connected to the PSTN and anywherethat is also connected to the PSTN. For those for whom wired telephonesare an integral part of everyday life, it is easy to forget that much of theworld does not have telephone access. According to statistics fromthe International Telecommunications Union (ITU), more than half theworld�s population has never made a telephone call. Telephone penetra-tion varies from 60% of the population in developed countries to 2% orless in undeveloped countries. The penetration figure is the total numberof installed phone lines divided by the total population. In developedcountries, some phones are shared among households, so although thepenetration might be only 60%, access to telephones is close to 100%.The dramatic difference in access to telephones is one of the key driversfor WLL and a topic that is discussed in detail in Chapter 4.
The copper wire used typically is referred to as twisted-pair copper,two thin copper wires surrounded by insulation and twisted together.Such wiring has the advantage of being inexpensive but the disadvantagethat it tends to act as an aerial, radiating high-frequency signals, poten-tially into other twisted pairs lying nearby and causing the phenomenonknown as cross-talk. However, because voice does not contain much inthe way of high-frequency components, limiting the signal that the linecarries to around 3 kHz using filters placed along the line prevents cross-talk. (Chapter 3 provides more technical information about twisted-paircopper; the point here is to emphasize the difficulty in sending high-frequency signals through twisted-pair copper.)
Despite its limitations, twisted-pair copper has one important charac-teristic: It links almost every house in the developed world to the PSTN.Not only that, it is the only link for most houses. As will be shown later,putting in more copper is extremely expensive. Those factors combine to
The converging world of telephony, TV, and computers 11
ensure that researchers will concentrate on the means to get the mostpossible out of the existing twisted-pair copper.
The owners of twisted-pair connections also have a great interest inexpanding the uses of those connections. The owners are the largestate telecommunications companies (e.g., BT, France Telecom, and theso-called baby Bells in the United States) and normally are referred toas post and telecommunications organizations (PTOs). In the post-Thatcher and post-Reagan world of market economics, the PTOs are aprime target for government action. The PTOs typically have a monop-oly of access to the customer, but governments prefer to see a competi-tive marketplace, one in which abuse of monopolistic power is lesslikely to occur. To encourage such a marketplace, governments typicallyboth prevent the PTOs from entering new marketplaces and encourageother operators, often on preferential terms, to compete with the PTOs.The latter strategy�yet another key driver for WLL�is examined inChapter 4. The former tactic is a key driver for convergence and isdiscussed below.
PTOs, while eager to grow, are restricted by government legislationfrom entering areas such as broadcasting and computing. They are not,however, restricted from using their existing cabling to enhance con-sumer choice. Hence, PTOs are keen to find ways to send video downtwisted-pair copper to provide services such as video on demand (VoD).VoD allows a user to view a film at home without having to go to the videostore to rent a tape.
PTOs also want to use their twisted pairs to provide connections to theInternet, maximizing the time that the cabling is used. If that provides theincentive for users to request a second twisted-pair connection, so muchthe better for the PTO, especially because in most countries, two lines arelaid into most houses at the time of installation. This is because the cost oflaying cable is almost entirely in the digging and not in the cable itself.Hence, it makes sense to deploy an extra cable while the road is dug up incase the first fails or the user requests a second line.
So, from being a means whereby people can talk with each other, thetwisted-pair connection rapidly is becoming a channel where a range ofdifferent media types is transmitted, including voice, video, and computerdata, that is, the much vaunted multimedia world. With all the differenttypes of information passing through the same channel, it is relativelysimple to link them so that a film can be ordered through the Internet and
12 Introduction to Wireless Local Loop
the Internet and voice calls can work together, thus, the emergence of thePTOs and twisted-pair copper as major factors in the convergence ofaudio, video, and computing.
Telecommunications has a more recent addition to its transmissionmeans: mobile communications. Cellular communications has been oneof the major growth industries of the last decade; already, only 10 yearsafter launch, cellular revenues are some 15% of total telephony revenuesin most developed countries. That percentage can be expected to increaserapidly, perhaps to 50% and more over the next decade. Mobile commu-nications cannot be ignored as a key force in telephony. The advent ofmobile communications and the development of the technology andmanufacturing required to deliver mobiles at low cost are key enablersthat make WLL possible and economic. But more about that in laterchapters.
In terms of convergence, mobile telephony is not a key driver. Onlyabout 2% of mobile calls are data. The scarcity of mobile spectrum meansthat high-bandwidth applications such as video and computing willremain expensive for some time, as well as slow and of poor quality.Perhaps by 2005, video might become more normal on a mobile, but thatwill be a long time after convergence has taken place. For that reason,mobile is mentioned here only for completeness.
2.3 Broadcasting
Since the widespread advent of TV broadcasting in the 1940s, the deliveryof TV signals by terrestrial transmitters that provide around four channelshas been prevalent. This is known as terrestrial TV. More recently, twoalternatives have appeared. Satellite TV offers 30 or more channels toanyone who installs a satellite dish. Cable TV offers 50 or more channelsto anyone able to access the cable. Cable has one big advantage over theother two delivery mechanisms in that each subscriber has a dedicatedlink into the cable network and is thus able to transmit into the networkas well as receive from it. It did not take cable operators long to realize thatthey could increase their revenues by offering viewers a telephone serviceas well as the broadcast TV service. Once a telephony service wasprovided, Internet access became possible, and cable operators are nowlooking at ways to provide higher speed Internet access.
The converging world of telephony, TV, and computers 13
Unlike twisted-pair copper, cable operators typically use coaxial cable(coax) to connect subscribers to the network. Coax consists of a coppercentral conductor surrounded by insulation and then an earth shield. Theshield dramatically reduces radiation compared to twisted pair and allowscable operators to provide much higher bandwidths, typically 750 MHz,compared with the 3 kHz that twisted pair is limited to by the insertion offilters as mentioned earlier. With such bandwidth capabilities, cable canoffer Internet access speeds of 40 Mbps compared to the typical 33 Kbps orso available on the twisted-pair access network.
Like PTOs, cable operators are considering converging voice, TV, andcomputing to allow Internet voice, Internet selection of films, and voiceguidance through Internet pages.
It is not possible to venture into the world of broadcasting withouthearing the word digital. Digital broadcasting is a hot topic in broadcastingand will affect most TV viewers by around the year 2005. Digital broad-casting works by converting the picture to a stream of binary digits andthen exploiting the fact that in most cases the current frame transmitted isnearly identical to the previous frame. Hence, instead of each frame beingsent, only the difference between the previous and the current frameneeds to be transmitted. Coupled with plenty of other intelligent codingtechniques, this results in a digital TV picture being transmitted in sub-stantially less bandwidth than current analog pictures. The differencevaries between a factor of around 4 to 40, depending on a range of factorsoutside the scope of this book; suffice it to say that digital will enable manymore channels to be broadcast than analog. Digital broadcasting appearedon satellite, cable, and terrestrial transmitters during 1997 and 1998.
A digital broadcast channel has a relatively fixed capacity. However,the resources required for video transmission vary dynamically, from vir-tually none (e.g., during a news broadcast, when only the newsreader�slips move) to high levels (e.g., during a football game, when almost every-thing moves). The channel is sized for the latter situation, so transmissionof the newscast has significant spare capacity. There is much talk aboutusing that spare capacity for data download of non-time-critical informa-tion, for example, newspapers and local information. Such informationwill, of course, need to be processed at the TV set. Many industry observ-ers think that TV then will offer the ability to display, edit, and requestmore information; in short, it will have many of the characteristicsof an Internet-connected PC. Indeed, Microsoft recently announced a
14 Introduction to Wireless Local Loop
significant investment in providing operating systems for such a device. ATV set would almost certainly also contain a socket to plug in a telephone,allowing voice, video, and computer access through the set, in directcompetition to the telecommunications provider.
Cable operators are best placed to take advantage of this trendbecause they already possess the return channel whereby informationfrom the subscriber can be passed back into the network. Terrestrial andsatellite broadcast may have to rely on twisted-pair connections to returninformation to the network, further increasing the complexity of theconvergence that is taking place.
2.4 Computing
It hardly seems necessary to discuss the Internet, a topic so prevalent ineverything from specialized journals to national newspapers and maga-zines that it is unlikely that any reader will not have a good workingknowledge of this phenomenon. Instead, this section focuses on what theInternet means for convergence.
Suddenly, computers are no longer stand-alone devices. Many arenow networked and able to draw on massive resources of information. Atthe simplest level, you can communicate through e-mail rather thanusing the telephone, an example of voice-computing integration. Atanother level, you can retrieve information, read advertisements, and getthe news. Finally, well-specified machines can receive video clips forreplay on the computer. But of course, all those activities are possible onlyif you are connected via a twisted pair or coax cable into the PSTN. Herewe have a highly integrated scenario in which the Internet is replacingthe traditional traffic over the local loop with a wider range of traffic in adifferent form.
Any Internet user is familiar with the slow delivery time of the Inter-net; files can take hours to download, and connections fail to get made.That is because the existing telecommunications networks, over whichthe Internet is delivered, were not designed to cope with the volumes oftraffic that the Internet is increasingly generating. The convergenceof computing, in which disk sizes are measured in gigabits, and telecom-munications, in which even the best modems manage only kilobits persecond, has caused some major problems and will prove key drivers for
The converging world of telephony, TV, and computers 15

the future. New telecommunications systems need much more band-width but are restricted by the limits of twisted-pair connections. Wirelessaccess may be one means to ameliorate the situation.
2.5 The impact of IP on convergence
By the end of 1998, one easy way to send your share price rocketing wasto make a press announcement stating that you had some new IP-basedInternet technology. Indeed, there have been a few cases where compa-nies completely unrelated to telecommunications have used the term IPas an abbreviation for something completely different and have seen theirshares double as a result. Amid all this hype, it is worth assessing just whatthe impact of transmissions using the Internet Protocol (IP) will be.
First it is important to understand what IP is. IP is a framing formatused for the transmission of packets across a network. It is a connection-less protocol that treats each packet separately, ignoring the fact that apacket may be part of a stream of packets being transmitted from one userto another. It was developed initially as a means of transmitting messagesfrom one computer to another across an unknown and potentially high-error environment. As a result, packet headers are large to providedetailed address information and error detection capabilities and packetsare retransmitted if not received within a certain time. In summary, it is aprotocol well suited to the Internet environment. However, there aremany other protocols in the telecommunications environment includingAsynchronous Transfer Mode (ATM), frame relay, X.25, and SignalingSystem Number 7 (SS7) [1] that are better suited for the particularnetworks on which they run.
The seemingly unstoppable rise of the Internet has meant that manyof today�s data transmissions are carried out in IP protocol. Although pro-tocol conversion is relatively straightforward, if it can be avoided and onesingle protocol can be used, then simpler and faster networks can be built.Because of the leadership position of IP, most suggest that IP shouldbecome the ubiquitous protocol for communications networks of thefuture. If all networks used IP, then the transmission of voice, data, andvideo down a single communications medium and using a single switchwould be viable.
This vision, however, has plenty of problems. With a legacy of 500 mil-lion copper lines worldwide, changing over to IP will be far from simple. IP
16 Introduction to Wireless Local Loop
is ill suited to voice transmission because of its variable delays. IP is illsuited to transmission over mobile radio networks due to the large headersize, which means it uses scarce radio spectrum inefficiently. New versions ofthe IP protocol may start to overcome some of these problems, but otherswill remain more fundamental. Nevertheless, many manufacturers aremoving ahead toward a world where all transmissions are sent using IP.
To the end user, this world should not be any different from the worldof today since users can already receive all the services on offer. The tele-communications operator will be able to deliver a converged service at amuch lower cost. IP will make convergence simpler and as a result maymake it happen faster, but it is more of an enabler than a driver, and all thehype surrounding it should not obscure the fact that it is simply a protocolfor the transmission of packet data.
2.6 The new competing environment
This section looks at the implications of convergence for a prospectiveWLL provider. In a fully convergent and well-developed country, all theentities shown in Table 2.1 might compete to provide a more or lessencompassing service to users. Each entity is shown with details of thedelivery mechanism it will use and whether it will provide telephony,broadcast, or computing services.
Some of the terms in Table 2.1 have yet to be introduced. Inte-grated Service Digital Network (ISDN) and generic digital subscriber lines(xDSL) are discussed in Chapter 3. For the purposes of this chapter, sufficeit here to consider them as technologies capable of delivering the serviceslisted.
Reading down the columns, it can be seen that telephony could nowbe provided by PTOs, WLL operators, cellular/cordless operators, andcable operators. Because of the additional services they offer, the eco-nomics of the different operators are quite different. For example, a PTOoperator makes most of its money via telephony, whereas a cable opera-tor bases its network on TV subscriptions and can provide telephony atalmost no additional cost.1
The converging world of telephony, TV, and computers 17
1. Assuming, that is, that the cable network was engineered to provide voice telephony.Some earlier cable networks require substantial reengineering to allow voice traffic to becarried.
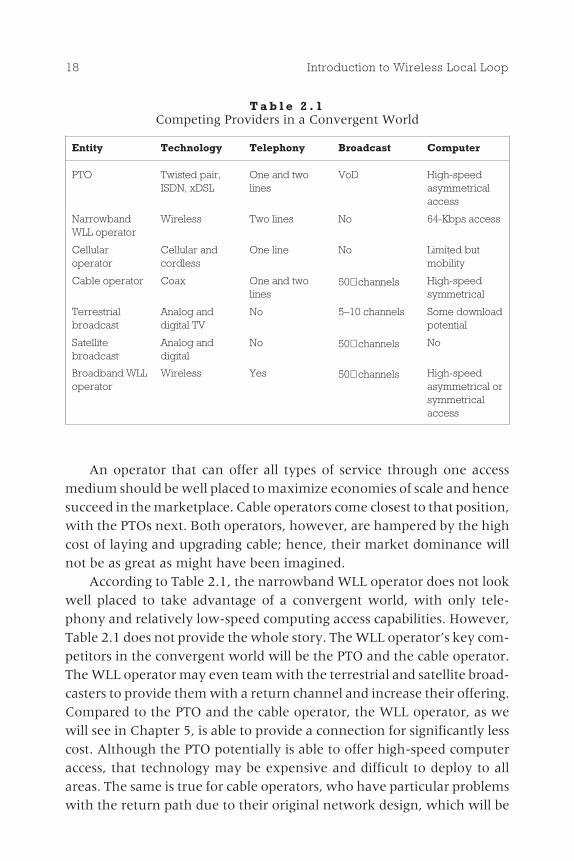
An operator that can offer all types of service through one accessmedium should be well placed to maximize economies of scale and hencesucceed in the marketplace. Cable operators come closest to that position,with the PTOs next. Both operators, however, are hampered by the highcost of laying and upgrading cable; hence, their market dominance willnot be as great as might have been imagined.
According to Table 2.1, the narrowband WLL operator does not lookwell placed to take advantage of a convergent world, with only tele-phony and relatively low-speed computing access capabilities. However,Table 2.1 does not provide the whole story. The WLL operator�s key com-petitors in the convergent world will be the PTO and the cable operator.The WLL operator may even team with the terrestrial and satellite broad-casters to provide them with a return channel and increase their offering.Compared to the PTO and the cable operator, the WLL operator, as wewill see in Chapter 5, is able to provide a connection for significantly lesscost. Although the PTO potentially is able to offer high-speed computeraccess, that technology may be expensive and difficult to deploy to allareas. The same is true for cable operators, who have particular problemswith the return path due to their original network design, which will be
18 Introduction to Wireless Local Loop
T a b l e 2 . 1Competing Providers in a Convergent World
Entity Technology Telephony Broadcast Computer
PTO Twisted pair,ISDN, xDSL
One and twolines
VoD High-speedasymmetricalaccess
NarrowbandWLL operator
Wireless Two lines No 64-Kbps access
Cellularoperator
Cellular andcordless
One line No Limited butmobility
Cable operator Coax One and twolines
50+ channels High-speedsymmetrical
Terrestrialbroadcast
Analog anddigital TV
No 5�10 channels Some downloadpotential
Satellitebroadcast
Analog anddigital
No 50+ channels No
Broadband WLLoperator
Wireless Yes 50+ channels High-speedasymmetrical orsymmetricalaccess

expensive to overcome. A WLL operator providing relatively good voiceand Internet access on a relatively low-cost base might provide a well-targeted service for many customers.
Even better, in any particular country, not all types of operators willbe present, and there may not be a demand for all services. Regardless,WLL operators must remember that they are operating in a world whereconvergence is a key driver, and failure to provide Internet access, voice,and (potentially) video is likely to undermine significantly their businesscase. WLL operators also are operating in a world where competitors arenot just the PTOs but also the terrestrial and satellite broadcasters andthe cellular operators, against which appropriate strategies must bedeveloped.
Finally, broadband WLL technologies started to become availableduring 1999. These provide the WLL operator with higher bit rates,allowing them to compete more directly against the other telecommuni-cations providers.
2.7 Predicting what the user will require
With voice-only systems, dimensioning the system is relatively simple.The average traffic per user, in terms of call minutes during the busy hour,is calculated based on current usage or national averages. By estimatingthe total number of users in a given area, the total traffic requirements caneasily be determined.
In the new converged environment, users will access a range of differ-ent services, some of which do not even exist to date. Understanding theaverage traffic per user becomes a much more difficult task and one thatcan only be performed based on predictions of the future. Typically, thesepredictions are derived from a combination of extrapolation of today�strends, logical deductions as to the level of services that users might want,and basic guesswork. Their accuracy is decidedly suspect, but in theabsence of any other information they allow network design and plan-ning to occur.
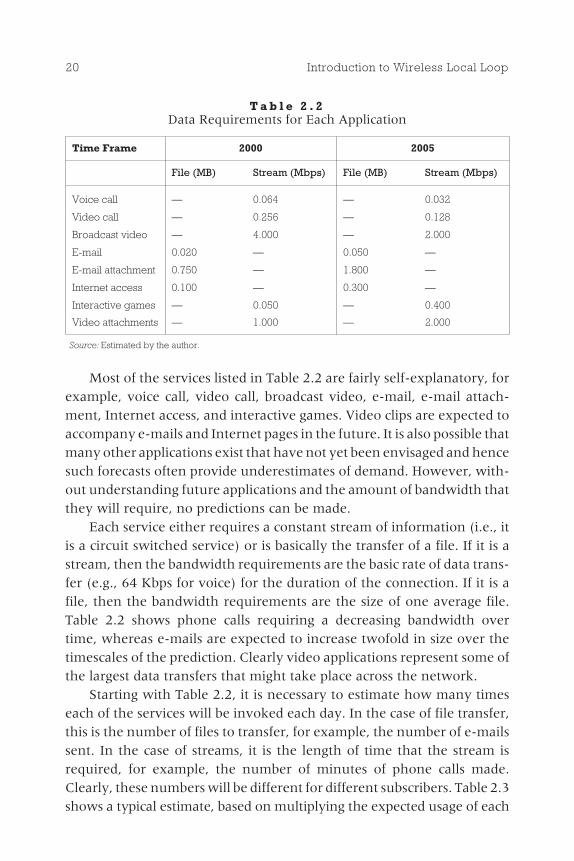
Table 2.2 shows a range of applications along with estimates of howthe data requirements for each application are expected to change overtime. These are based on estimates made by the author and should not betaken as solid predictions of future needs.
The converging world of telephony, TV, and computers 19
T a b l e 2 . 2Data Requirements for Each Application
Time Frame 2000 2005
File (MB) Stream (Mbps) File (MB) Stream (Mbps)
Voice call � 0.064 � 0.032
Video call � 0.256 � 0.128
Broadcast video � 4.000 � 2.000
E-mail 0.020 � 0.050 �
E-mail attachment 0.750 � 1.800 �
Internet access 0.100 � 0.300 �
Interactive games � 0.050 � 0.400
Video attachments � 1.000 � 2.000
Source: Estimated by the author.
Most of the services listed in Table 2.2 are fairly self-explanatory, forexample, voice call, video call, broadcast video, e-mail, e-mail attach-ment, Internet access, and interactive games. Video clips are expected toaccompany e-mails and Internet pages in the future. It is also possible thatmany other applications exist that have not yet been envisaged and hencesuch forecasts often provide underestimates of demand. However, with-out understanding future applications and the amount of bandwidth thatthey will require, no predictions can be made.
Each service either requires a constant stream of information (i.e., itis a circuit switched service) or is basically the transfer of a file. If it is astream, then the bandwidth requirements are the basic rate of data trans-fer (e.g., 64 Kbps for voice) for the duration of the connection. If it is afile, then the bandwidth requirements are the size of one average file.Table 2.2 shows phone calls requiring a decreasing bandwidth overtime, whereas e-mails are expected to increase twofold in size over thetimescales of the prediction. Clearly video applications represent some ofthe largest data transfers that might take place across the network.
Starting with Table 2.2, it is necessary to estimate how many timeseach of the services will be invoked each day. In the case of file transfer,this is the number of files to transfer, for example, the number of e-mailssent. In the case of streams, it is the length of time that the stream isrequired, for example, the number of minutes of phone calls made.Clearly, these numbers will be different for different subscribers. Table 2.3shows a typical estimate, based on multiplying the expected usage of each
20 Introduction to Wireless Local Loop
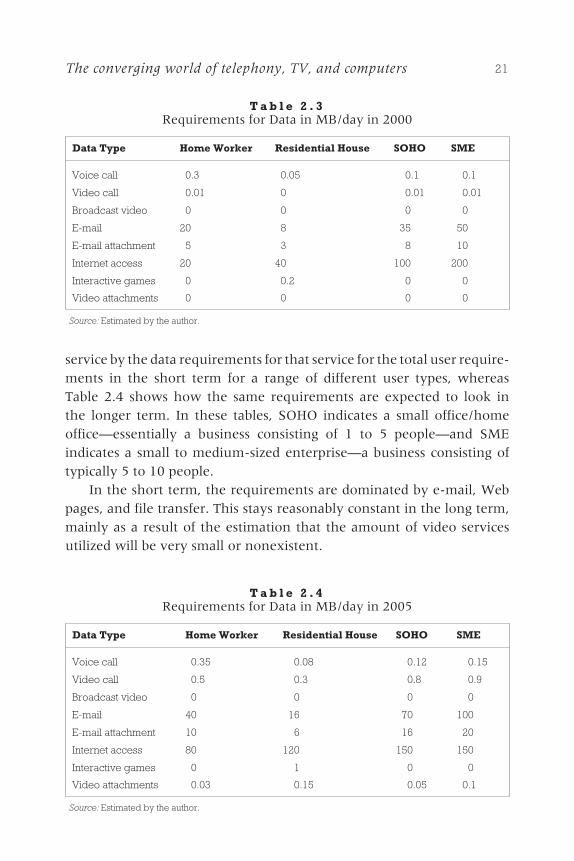
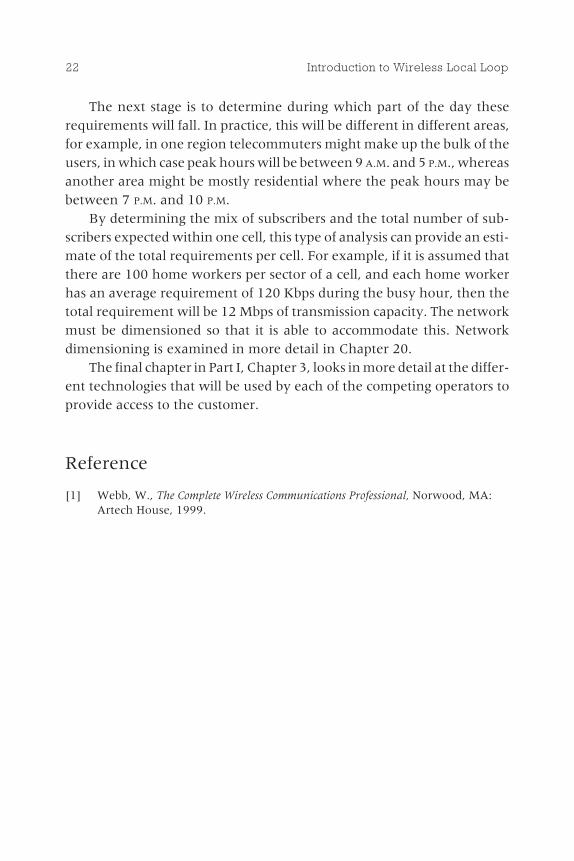
service by the data requirements for that service for the total user require-ments in the short term for a range of different user types, whereasTable 2.4 shows how the same requirements are expected to look inthe longer term. In these tables, SOHO indicates a small office/homeoffice�essentially a business consisting of 1 to 5 people�and SMEindicates a small to medium-sized enterprise�a business consisting oftypically 5 to 10 people.
In the short term, the requirements are dominated by e-mail, Webpages, and file transfer. This stays reasonably constant in the long term,mainly as a result of the estimation that the amount of video servicesutilized will be very small or nonexistent.
The converging world of telephony, TV, and computers 21
T a b l e 2 . 3Requirements for Data in MB/day in 2000
Data Type Home Worker Residential House SOHO SME
Voice call 0.3 0.05 0.1 0.1
Video call 0.01 0 0.01 0.01
Broadcast video 0 0 0 0
E-mail 20 8 35 50
E-mail attachment 5 3 8 10
Internet access 20 40 100 200
Interactive games 0 0.2 0 0
Video attachments 0 0 0 0
Source: Estimated by the author.
T a b l e 2 . 4Requirements for Data in MB/day in 2005
Data Type Home Worker Residential House SOHO SME
Voice call 0.35 0.08 0.12 0.15
Video call 0.5 0.3 0.8 0.9
Broadcast video 0 0 0 0
E-mail 40 16 70 100
E-mail attachment 10 6 16 20
Internet access 80 120 150 150
Interactive games 0 1 0 0
Video attachments 0.03 0.15 0.05 0.1
Source: Estimated by the author.
The next stage is to determine during which part of the day theserequirements will fall. In practice, this will be different in different areas,for example, in one region telecommuters might make up the bulk of theusers, in which case peak hours will be between 9 A.M. and 5 P.M., whereasanother area might be mostly residential where the peak hours may bebetween 7 P.M. and 10 P.M.
By determining the mix of subscribers and the total number of sub-scribers expected within one cell, this type of analysis can provide an esti-mate of the total requirements per cell. For example, if it is assumed thatthere are 100 home workers per sector of a cell, and each home workerhas an average requirement of 120 Kbps during the busy hour, then thetotal requirement will be 12 Mbps of transmission capacity. The networkmust be dimensioned so that it is able to accommodate this. Networkdimensioning is examined in more detail in Chapter 20.
The final chapter in Part I, Chapter 3, looks in more detail at the differ-ent technologies that will be used by each of the competing operators toprovide access to the customer.
Reference
[1] Webb, W., The Complete Wireless Communications Professional, Norwood, MA:Artech House, 1999.
22 Introduction to Wireless Local Loop

Access technologies
3.1 Access
WLL is all about providing access from thehome into the switched network. As dis-cussed in Chapter 2, WLL is only one of anumber of competing technologies that canbe used to provide access. In this chapter, allthe existing and proposed technologies thatare, or might be, used to provide local loopaccess are introduced, along with a shortdescription of their key strengths, shortcom-ings, and likely costs. Most access technolo-gies merit a book in their own right; indeed,books are available on many of the topics.This chapter is intended only to provide suffi-cient information that WLL operators will beable to better understand the competitionthey face.
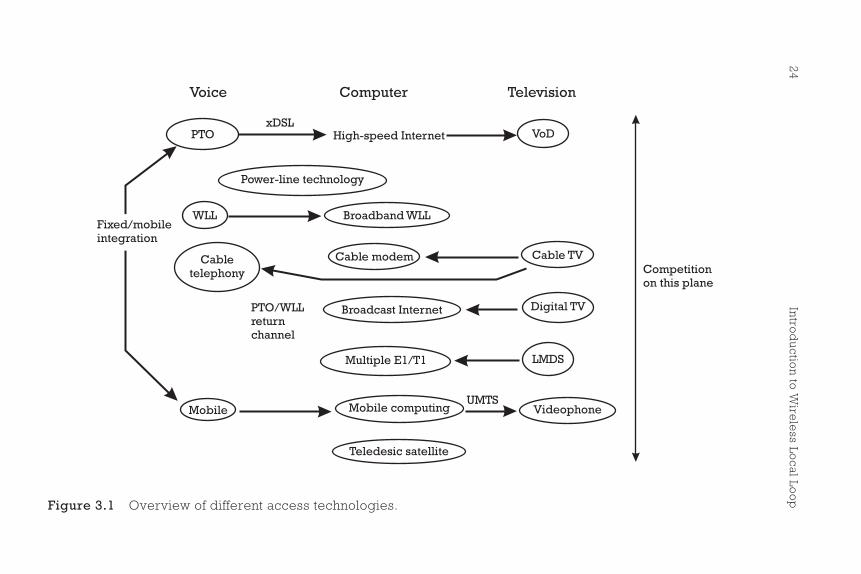
An overview of the different access tech-nologies is provided in Figure 3.1. The keytechnologies are explained in more detailthroughout this chapter.
23
Contents
3.1 Access
3.2 Access via twistedpair
3.3 Access via coax
3.4 Access via TVbroadcast
3.5 Access via mobileradio
3.6 Access via WLL
3.7 Access viapower-line technology
3.8 Summary ofaccess technologies
3C H A P T E R
24
Intro
du
ction
toW
irele
ssLo
calLo
op
Voice Computer Television
PTO High-speed Internet VoDxDSL
WLL Broadband WLL
Cable TVCable modemCabletelephony
Digital TVBroadcast InternetPTO/WLLreturnchannel
LMDSMultiple E1/T1
Mobile Mobile computing VideophoneUMTS
Teledesic satellite
Power-line technology
Competitionon this plane
Fixed/mobileintegration
Figure 3.1 Overview of different access technologies.
3.2 Access via twisted pair
3.2.1 Voiceband modems
The twisted pair can be used directly to provide voice communications. Toprovide data communications, it is necessary to make use of a device thatconverts the data signal into a format suitable for the telephone channel.Such a device is known as a modem, a shortened form of the termmodulator-demodulator. A modulator takes the digital waveform and mapsit onto an analog signal that looks to the telephone system somewhat likea voice signal. The demodulator reconverts the signal into a digital signal.A detailed description of telephone modems can be found in [1].
The telephone channel has a bandwidth of about 3 kHz. It also has arelatively good signal-to-noise ratio (SNR) of some 30 to 40 dB. Thatmeans that although only some 3,000 symbols per second can be trans-mitted, each symbol can contain a relatively large amount of information.Instead of representing just two different levels, as is normal in digitalmodulation, it could represent, say, 16 or 32 different levels. The modula-tion used to achieve this is termed quadrature amplitude modulation(QAM).
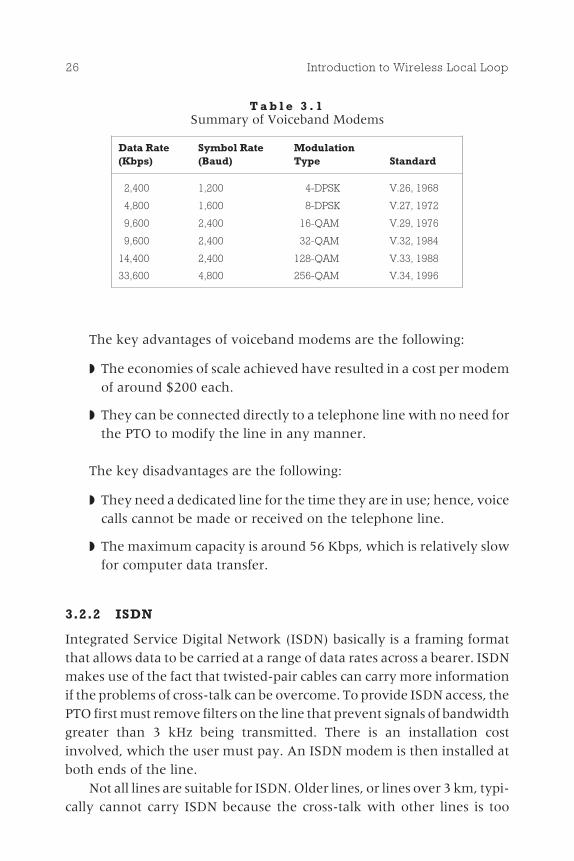
Voiceband modem standards are developed by the ITU. Standards areimportant in this area because the modulator and the demodulator areinstalled in different premises, often in different countries, and they needto know how to work with each other. The standards are updated as tech-nical progress allows. Each is known by a number, such as V.33. The letterV is common to all modems, while the number that follows tends toincrease as each new modem is introduced. However, there are otherentities that the ITU standardizes within the V series, such as interconnec-tion arrangements. Therefore, not all V.xx numbers represent modems,and the modem numbers do not necessarily rise consecutively. Anexample of how the standards have progressed is shown in Table 3.1.
The most recent standards allow data rates of up to 33.6 Kbps, withthe latest modem to be announced capable of rates up to 56 Kbps,depending on the quality of the channel. This recent progression reachesthe theoretical maximum rate of information transfer on the band-limited twisted wire; hence, no further improvement in speed can beexpected. (Subsequent sections discuss techniques that achieve muchhigher data transfer rates, but such techniques work only when the 3-kHzband-limiting filters are removed by the PTO.)
Access technologies 25
The key advantages of voiceband modems are the following:
◗ The economies of scale achieved have resulted in a cost per modemof around $200 each.
◗ They can be connected directly to a telephone line with no need forthe PTO to modify the line in any manner.
The key disadvantages are the following:
◗ They need a dedicated line for the time they are in use; hence, voicecalls cannot be made or received on the telephone line.
◗ The maximum capacity is around 56 Kbps, which is relatively slowfor computer data transfer.
3.2.2 ISDN
Integrated Service Digital Network (ISDN) basically is a framing formatthat allows data to be carried at a range of data rates across a bearer. ISDNmakes use of the fact that twisted-pair cables can carry more informationif the problems of cross-talk can be overcome. To provide ISDN access, thePTO first must remove filters on the line that prevent signals of bandwidthgreater than 3 kHz being transmitted. There is an installation costinvolved, which the user must pay. An ISDN modem is then installed atboth ends of the line.
Not all lines are suitable for ISDN. Older lines, or lines over 3 km, typi-cally cannot carry ISDN because the cross-talk with other lines is too
26 Introduction to Wireless Local Loop
T a b l e 3 . 1Summary of Voiceband Modems
Data Rate(Kbps)
Symbol Rate(Baud)
ModulationType Standard
2,400 1,200 4-DPSK V.26, 1968
4,800 1,600 8-DPSK V.27, 1972
9,600 2,400 16-QAM V.29, 1976
9,600 2,400 32-QAM V.32, 1984
14,400 2,400 128-QAM V.33, 1988
33,600 4,800 256-QAM V.34, 1996
severe or the signal attenuation too great. A test on the line is requiredbefore ISDN service can be provisioned.
ISDN is an international standard that provides a range of data rates.The lowest rate ISDN channel is 64 Kbps, with a typical ISDN deploymentproviding a so-called 2B + D arrangement (known as basic rate ISDNaccess, or BRA). There are two basic (B) 64-Kbps channels and one data(D) channel of 16 Kbps. The data channel can be used to provide signalinginformation, while both basic channels are in use. Hence, a 2B + D chan-nel provides 144 Kbps. Primary rate ISDN offers 30B + 2D channels, atotal of nearly 2 Mbps, but cannot be provided over twisted-pair copper;instead, new coax cable is required. Basic rate modems cost around $300each, although prices are expected to fall significantly in the comingyears. More information on ISDN can be found in [2] and [3].
The advantages of ISDN include the following:
◗ It is a long-established standard and a proven technology.
◗ It is relatively cheap and widespread in some countries.
The disadvantages include the following:
◗ Only a small increase in the rate is offered by voiceband modems.
◗ ISDN may be rapidly outdated by xDSL technology.
3.2.3 xDSL technologies
The area of digital subscriber line technologies is a relatively new one (theabbreviation xDSL refers to all the approaches to digital subscriber lines).The concept, like ISDN, is to use existing twisted pair, less any filters thatmay be in place, to provide significantly greater data rates through com-plex intelligent modems capable of adapting to the channel and removingany cross-talk that might be experienced. The term xDSL has come aboutto encompass a host of proposed different approaches, such as asym-metric digital subscriber line (ADSL), high-speed digital subscriber line(HDSL), very high-speed digital subscriber line (VDSL), and doubtlessmore to come.
Research has shown that these technologies can offer up to 8 Mbps,perhaps more, depending on the quality of the existing twisted pair.Readers at this point may be asking themselves why on the one hand thetwisted pair can provide only 56 Kbps and on the other hand the same
Access technologies 27
twisted pair can achieve 8 Mbps. The reason has to do with the manner inwhich cross-talk is treated. Voiceband modems overcome the problem ofcross-talk by ensuring that none is generated. The xDSL technologiesgenerate significant cross-talk but employ advanced technology to cancelits effects. It is that difference in approach, enabled by advances in digitalsignal processing, that has allowed xDSL to make such dramatic improve-ments in the data rates that can be achieved.
The first of the xDSLs to appear was HDSL, which provides up toaround 768 Kbps on a single twisted pair. It also can make use of anumber of twisted pairs to deliver higher rate services by, for example,sending every even bit down one cable and every odd bit down another.Using up to a maximum of three twisted pairs, a maximum data rate ofaround 2 Mbps in both directions can be achieved with only modestlycomplex equipment. A major difficulty associated with HDSL is theremoval of echoes from the signal, which can cause intersymbol interfer-ence. The echoes are removed by equalizers. Equalizer design is acomplex topic that attempts to balance complexity and delay against per-formance. In HDSL, a combination of preequalization at the transmitterand equalization at the receiver is used. The preequalization attempts totransmit a signal that when received has no echoes, while postequaliza-tion removes any residual error effects.
HDSL is intended for business applications. HDSL signals can propa-gate only a few kilometers along twisted pairs. Most businesses, however,are relatively close to their nearest exchange, so that is not a signifi-cant limitation. HDSL typically is less suitable for residential applica-tions because homes may be at much greater distances from the localexchange.
After HDSL came ADSL, which provides more data in the down-stream direction than in the return path. This asymmetry meets therequirements of Internet access well, where more information is passedto the home than is sent into the network from the home. By restrictingthe return path to lower rates, less near-end cross-talk (NEXT) is gener-ated. NEXT is interference from the return signal that contaminates thereceived signal. Because the return signal is at a lower rate, the effect ofNEXT is reduced and higher downstream rates achieved. ADSL promisesto provide up to 8 Mbps downstream but only tens of kilobits per secondupstream. Current trails are achieving around 1.5 Mbps downstream and9.6 Kbps on the return path.
28 Introduction to Wireless Local Loop
ADSL works by dividing the transmitted data into a number ofstreams and transmitting the streams separately at different frequencies.This approach is known as discrete multitone (DMT) in the fixed-linecommunity; however, the technique has been used for many years inmobile radio, normally known as frequency division multiplexing (FDM)or orthogonal frequency division multiplexing (OFDM). Indeed, this isthe technique proposed for digital audio broadcasting and digital terres-trial TV broadcasting. For a detailed discussion of this approach, see [1].This approach has the advantage that each transmitted data stream is nar-rowband and does not require equalization. The capacity of each streamcan be adjusted according to the frequency response of the channel at thatparticular point. It also tends to improve error performance againstimpulsive interference because an impulse now damages a fraction of onebit on all the channels instead of a number of sequential bits on a higherrate channel. However, additional complexity results from the need tohave an echo canceler for each channel and to modulate the multiplechannels onto the single telephone line.
ADSL is more appropriate for residential applications than the otherxDSL technologies. By reducing NEXT, the range achieved is greater thanthat for HDSL, allowing long residential lines to carry ADSL successfully.Also, the asymmetrical signal typically is suitable for residential applica-tions such as VoD, in which more signal is sent to the home than receivedfrom it. It is estimated that up to 70% of all residential lines in the UnitedStates could be suitable for ADSL operation.
Finally, VDSL has been proposed where fiber to the curb (FTTC) hasbeen deployed. In that case, the copper run to the subscriber�s premises isvery short, typically less than 500m; hence, higher data rates can be sup-ported. Using the most advanced technology proposed yet, it is suggestedthat VDSL could achieve data rates of up to around 50 Mbps, althoughthat is still far from being proved. Current plans suggest 10 Mbps down-stream and 64 Kbps on the return path. VDSL cannot be used in networksin which FTTC has not been implemented.
xDSL will be expensive to implement, even though the local loop willstay relatively unchanged. The PTO will need to install new optical cablefrom the switch to a new cabinet in the street, as shown in Figure 3.2.Modems for xDSL are predicted to cost around $500 each, althoughthe price in the coming years will depend heavily on the success of thetechnology and the economies of scale achieved.
Access technologies 29

A problem with all the xDSL technologies is that the data rate that canbe achieved depends on the length and the age of the twisted pair. Asthe length gets longer, the data rate falls. As yet, it is not clear whatpercentage of lines will be of sufficient quality to accept xDSL signals.Figures quoted in the industry vary from around 60% to 90%. Due to thetechnology�s relative newness, texts on xDSL are hard to find and tendto be limited to chapters in books such as [4]. Readers who want toknow more about this topic should refer to academic journals such as[5] and [6].
During 1998 there was a change of direction from the ADSL forum. Inthe light of many potential problems associated with very high speedtransmission, the forum decided to work on a new version of ADSL calledADSL Lite, or Universal ADSL (U-ADSL). The concept was that by reduc-ing the maximum transmission rate, the distance over which ADSLsignals could be transmitted would increase as would the tolerance to oldor poorly maintained copper. Further, once the signal reached the user�shome, there would be no need for expensive internal decoders and for thehome wiring to be upgraded to handle the data rates of up to 8 Mbps. Thiswould save substantial cost since engineers would not need to be sent tousers� homes to install the wiring. Most ADSL Lite manufacturers areworking with maximum data rates of 500 Kbps. While this data rateallows much more cost-effective installation of the service, it does notoffer the quantum leap that �normal� ADSL offered. At around threetimes the ISDN rate, ADSL Lite is an improvement but not necessarily one
30 Introduction to Wireless Local Loop
PTO building
Copperdistributionframe
New opticalheadend
Home
Home
Existingdistribution point(street cabinet)
New broadbandstreet cabinet
Typically 1 km
New opticalcable
Existing coppercable POTS connection
ADSL connection
Figure 3.2 Modifications required to install xDSL technologies.
that all will view as sufficient to justify the expense of changing to adifferent technology.
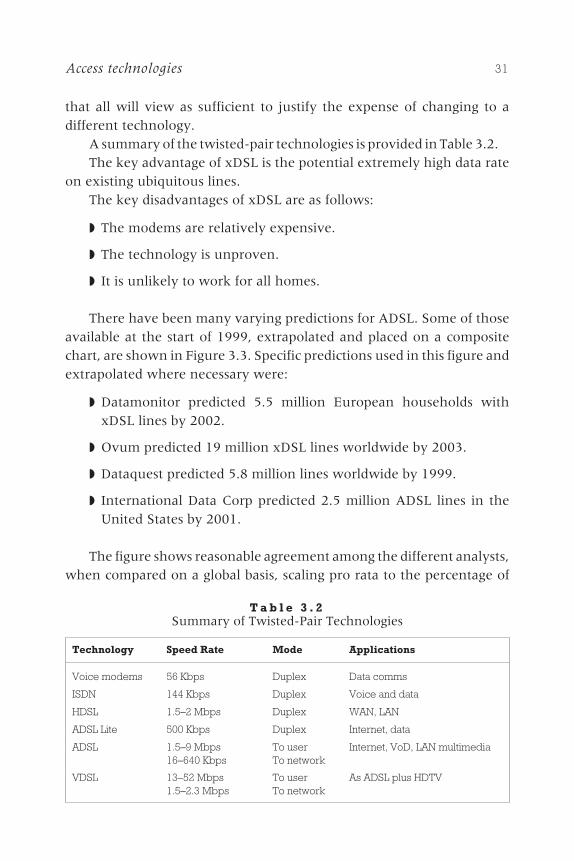
A summary of the twisted-pair technologies is provided in Table 3.2.The key advantage of xDSL is the potential extremely high data rate
on existing ubiquitous lines.The key disadvantages of xDSL are as follows:
◗ The modems are relatively expensive.
◗ The technology is unproven.
◗ It is unlikely to work for all homes.
There have been many varying predictions for ADSL. Some of thoseavailable at the start of 1999, extrapolated and placed on a compositechart, are shown in Figure 3.3. Specific predictions used in this figure andextrapolated where necessary were:
◗ Datamonitor predicted 5.5 million European households withxDSL lines by 2002.
◗ Ovum predicted 19 million xDSL lines worldwide by 2003.
◗ Dataquest predicted 5.8 million lines worldwide by 1999.
◗ International Data Corp predicted 2.5 million ADSL lines in theUnited States by 2001.
The figure shows reasonable agreement among the different analysts,when compared on a global basis, scaling pro rata to the percentage of
Access technologies 31
T a b l e 3 . 2Summary of Twisted-Pair Technologies
Technology Speed Rate Mode Applications
Voice modems 56 Kbps Duplex Data comms
ISDN 144 Kbps Duplex Voice and data
HDSL 1.5�2 Mbps Duplex WAN, LAN
ADSL Lite 500 Kbps Duplex Internet, data
ADSL 1.5�9 Mbps16�640 Kbps
To userTo network
Internet, VoD, LAN multimedia
VDSL 13�52 Mbps1.5�2.3 Mbps
To userTo network
As ADSL plus HDTV
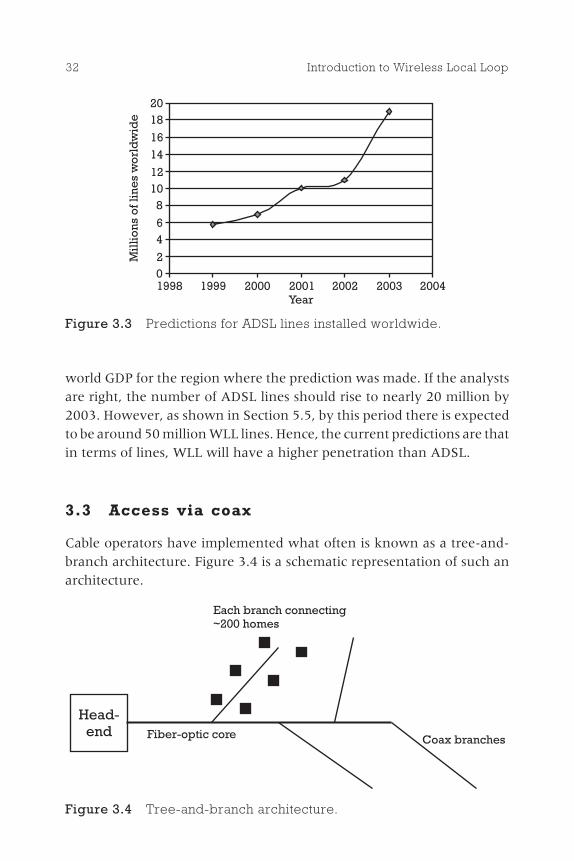
world GDP for the region where the prediction was made. If the analystsare right, the number of ADSL lines should rise to nearly 20 million by2003. However, as shown in Section 5.5, by this period there is expectedto be around 50 million WLL lines. Hence, the current predictions are thatin terms of lines, WLL will have a higher penetration than ADSL.
3.3 Access via coax
Cable operators have implemented what often is known as a tree-and-branch architecture. Figure 3.4 is a schematic representation of such anarchitecture.
32 Introduction to Wireless Local Loop
02
46
81012
14
16
1820
1998 1999 2000 2001 2002 2003 2004
Mil
lio
ns
ofl
ine
sw
orl
dw
ide
Year
Figure 3.3 Predictions for ADSL lines installed worldwide.
Head-end Fiber-optic core Coax branches
Each branch connecting~200 homes
Figure 3.4 Tree-and-branch architecture.
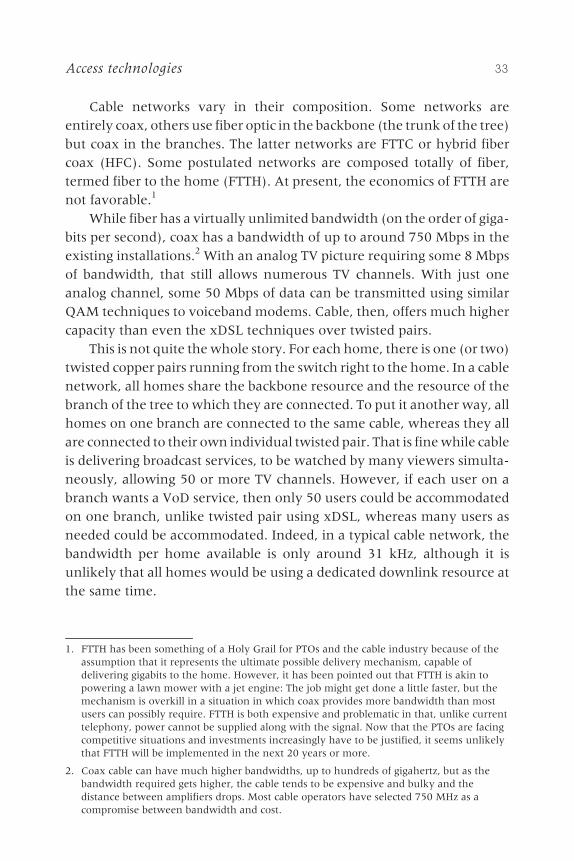
Cable networks vary in their composition. Some networks areentirely coax, others use fiber optic in the backbone (the trunk of the tree)but coax in the branches. The latter networks are FTTC or hybrid fibercoax (HFC). Some postulated networks are composed totally of fiber,termed fiber to the home (FTTH). At present, the economics of FTTH arenot favorable.1
While fiber has a virtually unlimited bandwidth (on the order of giga-bits per second), coax has a bandwidth of up to around 750 Mbps in theexisting installations.2 With an analog TV picture requiring some 8 Mbpsof bandwidth, that still allows numerous TV channels. With just oneanalog channel, some 50 Mbps of data can be transmitted using similarQAM techniques to voiceband modems. Cable, then, offers much highercapacity than even the xDSL techniques over twisted pairs.
This is not quite the whole story. For each home, there is one (or two)twisted copper pairs running from the switch right to the home. In a cablenetwork, all homes share the backbone resource and the resource of thebranch of the tree to which they are connected. To put it another way, allhomes on one branch are connected to the same cable, whereas they allare connected to their own individual twisted pair. That is fine while cableis delivering broadcast services, to be watched by many viewers simulta-neously, allowing 50 or more TV channels. However, if each user on abranch wants a VoD service, then only 50 users could be accommodatedon one branch, unlike twisted pair using xDSL, whereas many users asneeded could be accommodated. Indeed, in a typical cable network, thebandwidth per home available is only around 31 kHz, although it isunlikely that all homes would be using a dedicated downlink resource atthe same time.
Access technologies 33
1. FTTH has been something of a Holy Grail for PTOs and the cable industry because of theassumption that it represents the ultimate possible delivery mechanism, capable ofdelivering gigabits to the home. However, it has been pointed out that FTTH is akin topowering a lawn mower with a jet engine: The job might get done a little faster, but themechanism is overkill in a situation in which coax provides more bandwidth than mostusers can possibly require. FTTH is both expensive and problematic in that, unlike currenttelephony, power cannot be supplied along with the signal. Now that the PTOs are facingcompetitive situations and investments increasingly have to be justified, it seems unlikelythat FTTH will be implemented in the next 20 years or more.
2. Coax cable can have much higher bandwidths, up to hundreds of gigahertz, but as thebandwidth required gets higher, the cable tends to be expensive and bulky and thedistance between amplifiers drops. Most cable operators have selected 750 MHz as acompromise between bandwidth and cost.

Such a sharing of resources causes even more problems in the returndirection. Not only is the return path shared among all the users whorequire it, significantly reducing the capacity, but further, each user intro-duces noise onto the return path. The switch sees noise from across theentire network, significantly reducing the SNR and hence informationcontent that can be received. The noise is particularly severe at lowfrequencies, where it often is known as ingress.
Despite all those problems, cable modems are being installed with adownstream capability of 30 Mbps and an upstream capability of 10 Mbpsfor a price of around $200. In summary, the advantages of cable are asfollows:
◗ It has relatively high speed capabilities while requiring little modifi-cation to the network.
◗ Revenues from telephony, broadcasting, and Internet access allowthe network costs to be divided across more users.
The disadvantages include the following:
◗ Cable penetration varies from near zero in some countries to anaverage of around 30% (there is near-full penetration in a fewcountries).
◗ The tree-and-branch structure may mean that twisted-pair systemsstart to surpass cable networks in five years or so with higher band-width capabilities.
The Strategis Group predicted that there would be 4.5 million cablemodems worldwide by the year 2000. Others predict cable modem salesapproximately in line with ADSL modem sales. This would suggest that,like ADSL, cable will provide a serious challenge to WLL, but will remain aless popular means of connection.
3.4 Access via TV broadcast
TV signals currently are broadcast via terrestrial transmission, satellite,and cable. Cable access was discussed in Section 3.3. This section looksbriefly at terrestrial and satellite broadcasting.
34 Introduction to Wireless Local Loop
Terrestrial broadcasting uses about 400 MHz of radio spectrum in theUHF frequency band (typically 400 to 800 MHz in most countries). How-ever, the same spectrum cannot be used in adjacent cells because interfer-ence would occur. The spectrum typically needs to be divided into clustersof 11 cells to avoid interference, that is, each cell has around 36 MHz ofspectrum. Some cells cover millions of users, with the result that eachsubscriber has only a few tens of hertz. Thus, providing individual servicesfor each subscriber, such as VoD, clearly is not going to be possible.
Satellite is in a similar situation. It has more spectrum, around 1 GHzin total, and does not need to divide that spectrum among different cellsin the same manner as terrestrial. However, compared to terrestrial, itscells are even larger, covering over 100 million users, so again individualservices for subscribers are not possible.
Neither delivery mechanism can offer a return path. Service provid-ers for both mechanisms postulate that they might use the twisted copperof the PTOs for the return paths, but they would get limited revenue andwould have difficulty truly integrating their services. So, as an accessmethod, both leave a lot to be desired. Their main role, with the advent ofdigital TV, will be the delivery of broadcast data in relatively large vol-umes. That could speed Internet access to some of the most popular pagesand provide information, such as newspapers, online. The key advantageof TV broadcasting is that large amounts of data can be downloaded tolarge volumes of subscribers.
The key disadvantages are as follows:
◗ It lacks a return path.
◗ It cannot deliver signals on a per-subscriber basis.
3.5 Access via mobile radio
3.5.1 Cellular systems
Cellular systems are now available in most countries in the world. Com-pared to the other delivery mechanisms discussed earlier in this chapter,the key difference for cellular is that it provides access to a mobile termi-nal as opposed to a fixed terminal. The key strength of cellular is the pro-vision of voice calls when mobile. Although cellular has some data
Access technologies 35
capabilities, with most second-generation solutions providing 9.6 Kbps in1999 with enhancements up to around 100 Kbps by 2001, cellular sys-tems do not have the capacity for widespread usage of high-rate data.Hence, it seems likely that cellular systems will be used for a subset of dataapplications including location-specific information (e.g., the address ofthe nearest hotel) and restricted Internet and intranet access while mobile.
A key question is the extent to which cellular operators can attack thefixed marketplace. Many analysts predict that by around 2005, more thanhalf of all voice calls will be made from cellular phones, and given thatmany voice calls today are made from within the home, this impliesthat cellular phones will rapidly penetrate the home market.
Cellular operators have made many attempts to enter this home mar-ketplace. Some cellular operators have attempted to attack the fixedaccess market using initiatives such as cut-price evening calls and highlevels of indoor coverage. To date they have generally discovered thatthey cannot match the PTO on price and that the cost of providing excel-lent indoor coverage is extremely high. However, the cost of cellular callsis continually falling and the coverage and capacity is continually improv-ing, and it is only a matter of time before cellular makes significant inroadson voice calls within the building.
In the long term it seems likely that, at a high level of simplification,most voice calls will transfer across to mobile phones. However, mobilephones are unlikely to have high data rate capabilities in the foreseeablefuture. Hence, residential users may well keep their fixed line for dataapplications such as Internet usage and use their cellular phones forvoice calls. This suggests that the long-term future (perhaps from around2003) for WLL in developed countries is to provide high-speed data appli-cations, possibly with some voice backup capabilities. In the interim, ascellular prices remain higher than fixed-line costs, there will be a require-ment for voice-centric WLL solutions for many years to come.
The most successful cellular system, the global system for mobilecommunications (GSM), offers voice or data, with maximum data rates ofup to 9.6 Kbps. Future enhancements to GSM might raise the maximumdata rates as high as 300 Kbps and improve the voice quality, but that rateis slow compared to the other access technologies and is expensive incall charges.
Other successful cellular systems include the cdmaOne standardand the IS-136, or �TDMA� cellular standard. Both have been used for
36 Introduction to Wireless Local Loop
WLL, as discussed later, both in cellular frequency bands and otheravailable bands. For example, IS-136 systems have been deployed inSouth America in the 400-MHz band as WLL solutions.
Cellular systems have many disadvantages as an access technology,particularly low capacity and high cost. In developed countries, it can beexpected that for some time they will continue to fulfill the role of provid-ing mobility but will not present significant competition to the otheraccess methods. That is not as true in developing countries, where cellularoperators can use the same system to provide mobile systems and WLLsystems and thus realize economies in equipment supply, operation, andmaintenance.
The roles that cellular-based systems have to play in WLL networks isdiscussed in more detail in subsequent chapters. Fixed mobile integrationalso may affect the selection of an access method and is considered inmore detail in Chapter 22.
3.5.2 Cordless systems
Cordless systems are similar to cellular but typically are designed for officeand local area use. The differences between cellular and cordless tech-nologies are explained in more detail in Chapters 11 and 12. The key dif-ference in their application as an access technology is that cordlesstechnologies such as the digital enhanced cordless telephone (DECT)offer a higher data rate than cellular, up to some 500 Kbps, with fewerlimitations on spectrum and hence expense associated with the call. How-ever, because cordless technologies typically provide coverage only inbuildings and high-density areas, they will be unlikely to have coveragefor most access requirements. It is that lack of coverage that makes theminappropriate as an access technology. However, as we will see, whendeployed as a WLL technology, cordless becomes viable as an accesstechnology.
3.6 Access via WLL
At this point, a simple categorization of WLL into narrowband and broad-band is used. As we will see in later chapters, there is considerably morecomplexity than this.
Access technologies 37
3.6.1 Narrowband systems
Because the remainder of this book discusses WLL as an access technol-ogy, it is inappropriate to provide too much detail at this point. Instead,the key statistics, advantages, and disadvantages are provided to allow acomparison to be made at the end of the chapter. A wide range of WLLsystems provides access rates of 9.6 Kbps through to around 20 Mbps.WLL systems have the following advantages:
◗ There is an economic provision of service in a wide range ofenvironments.
◗ Moderate bit rates allow simultaneous voice and data in some cases.
They have the following disadvantages:
◗ Bit rates will not allow multiple simultaneous high-speedconnections.
◗ A lack of existing infrastructure means new networks need to bebuilt from scratch.
3.6.2 Broadband systems
As will be discussed in Chapter 14, an enhanced form of WLL technologythat is on trial uses local transmitters to deliver TV signals and broadbanddata. Those trial systems are called local multipoint distribution systems(LMDS) and transmit in the 28-GHz band, where around 2 GHz ofspectrum has been allocated. They typically provide multiple 2-Mbps E1or T1 links. LMDS systems have the following advantages:
◗ Relatively high data rates;
◗ Capable of providing video, telephony, and computer data thusmaximizing the revenue;
◗ Relatively low cost in comparison with cable alternatives.
They have the following disadvantages:
◗ Relatively high cost;
◗ Short range from the base station, requiring a relatively largenumber of base stations.
38 Introduction to Wireless Local Loop
3.7 Access via power-line technology
This is an area still very much in its infancy. The idea is to send relativelyhigh data rate signals along the existing electricity cables that connectmost homes, placing the signal on top of the power supply signal. Toenable this, a number of problems must be overcome, including thefollowing:
◗ Power lines are generally not well insulated from loss of high-frequency signals and as a result high power levels and low rangescan be a problem.
◗ Signal leakage results in electromagnetic interference, which can beproblematic to users of the radio spectrum.
◗ High levels of noise can be experienced on power supply lines as aresult of switching and operation of commercial appliances.
◗ Like cable systems, the bandwidth is shared among all the usersconnected to the same electricity substation.
Despite these disadvantages, there are some clear advantages. The mainone is the use of an existing resource providing a direct connection tosubscribers. Another is the avoidance of the need to use radio spectrum.At present, those working in this area estimate that they may be able toproduce a maximum data rate of around 1 Mbps, shared between upto 200 users, which, if used for activities such as Internet access, could, ina typical usage scenario, give each user the impression that he or she hadaccess to a data rate of some hundreds of kilobits per second.
It is likely that the first commercial systems will become availableduring the year 2000 at which point it will be possible to assess the reallevel of opportunity posed by power-line technology.
3.8 Summary of access technologies
Table 3.3 provides a summary of all the access technologies discussed inthis chapter.
The next part of the book examines in more detail the environmentsand economics of WLL and shows why predictions for WLL networks arecurrently showing rapid growth.
Access technologies 39
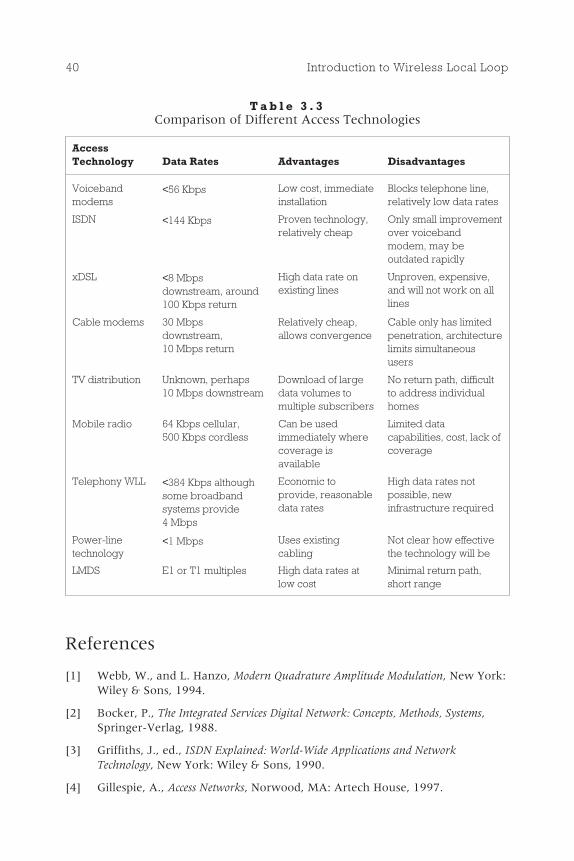
T a b l e 3 . 3Comparison of Different Access Technologies
AccessTechnology Data Rates Advantages Disadvantages
Voicebandmodems
<56 Kbps Low cost, immediateinstallation
Blocks telephone line,relatively low data rates
ISDN <144 Kbps Proven technology,relatively cheap
Only small improvementover voicebandmodem, may beoutdated rapidly
xDSL <8 Mbpsdownstream, around100 Kbps return
High data rate onexisting lines
Unproven, expensive,and will not work on alllines
Cable modems 30 Mbpsdownstream,10 Mbps return
Relatively cheap,allows convergence
Cable only has limitedpenetration, architecturelimits simultaneoususers
TV distribution Unknown, perhaps10 Mbps downstream
Download of largedata volumes tomultiple subscribers
No return path, difficultto address individualhomes
Mobile radio 64 Kbps cellular,500 Kbps cordless
Can be usedimmediately wherecoverage isavailable
Limited datacapabilities, cost, lack ofcoverage
Telephony WLL <384 Kbps althoughsome broadbandsystems provide4 Mbps
Economic toprovide, reasonabledata rates
High data rates notpossible, newinfrastructure required
Power-linetechnology
<1 Mbps Uses existingcabling
Not clear how effectivethe technology will be
LMDS E1 or T1 multiples High data rates atlow cost
Minimal return path,short range
References
[1] Webb, W., and L. Hanzo, Modern Quadrature Amplitude Modulation, New York:Wiley & Sons, 1994.
[2] Bocker, P., The Integrated Services Digital Network: Concepts, Methods, Systems,Springer-Verlag, 1988.
[3] Griffiths, J., ed., ISDN Explained: World-Wide Applications and NetworkTechnology, New York: Wiley & Sons, 1990.
[4] Gillespie, A., Access Networks, Norwood, MA: Artech House, 1997.
40 Introduction to Wireless Local Loop
[5] Kyees, P., et al., �ADSL: A New Twisted Pair Access to the InformationHighway,� IEEE Commun., April 1995, pp. 52�60.
[6] Kerpez, K., and K. Sistanizadeh, �High-Bit Rate Asymmetric DigitalCommunications Over Telephone Loops,� IEEE Trans. Commun., Vol. 43,No. 6, June 1995, pp. 2038�2049.
Access technologies 41


Why wireless?
Part I introduced the key trends inthe global information industry and the
plethora of access methods able to meet thosetrends. WLL was mentioned only as one of arange of possible access techniques; in com-parison to the other techniques, WLL mayappear to be lacking in bandwidth and withfew obvious advantages to offset that poten-tial problem.
However, between 1994 and 1998, over130 WLL networks were launched aroundthe world, with some of the more optimisticsuggestions indicating that by 2005 over halfof the lines being installed will be WLL. Thechapters in Part II explain why, despite itsshortcomings, WLL has attracted such signifi-cant interest. The answer is in the details. Notall users want 10 Mbps, and not all PTOs areinterested in providing that rate. When mov-ing from sweeping generalizations of accesstechnologies on a worldwide basis to a seg-mented analysis of different environments,the need for WLL in certain environmentsbecomes clear.
The three chapters in this section developthe background information provided inthe first part to show exactly where and
IIP A R T
why WLL is appropriate and where it has been to date. Chapter 4 consid-ers the different telecommunications environments in the world andanalyzes the need for WLL in each of these environments. This analysisis complemented by a short history of WLL, illustrating where its keymarket areas lie. Chapter 5 builds on the qualitative analysis of differentmarkets by considering the general economics of WLL and demonstratingits superiority in a range of situations. Chapter 6 looks at WLL marketsto date and assesses why the take-up has been slower than initiallypredicted. The aim of Part II is to demonstrate clearly where WLL can bedeployed advantageously.
44 Introduction to Wireless Local Loop

Telecommunicationsenvironmentsworldwide
4.1 The worldtelecommunicationsenvironment
The world telecommunications environmentis a highly eclectic place. Most, if not all, read-ers of this book have a phone at home, aphone at work, and a mobile phone. Theyhave access to fax machines, possibly both athome and at work. They have e-mail facilitiesand occasionally surf the Net. Their mainproblem is redirecting calls so that the callsreach them wherever they are. It might comeas a surprise to the readers of this book thatover half the world�s population has nevermade a phone call. The world average tele-density (the number of telephone lines in theworld divided by the world�s population) isonly 2%. Even in Europe, teledensity variesfrom 60% in Sweden to 2% in Albania. Theprovision of lines to those who currently
45
Contents
4.1 The worldtelecommunicationsenvironment
4.2 Developingcountries
4.3 Eastern Europe
4.4 First Worldcountries
4.5 History of WLL
4.6 The business ofsubsidization
4C H A P T E R
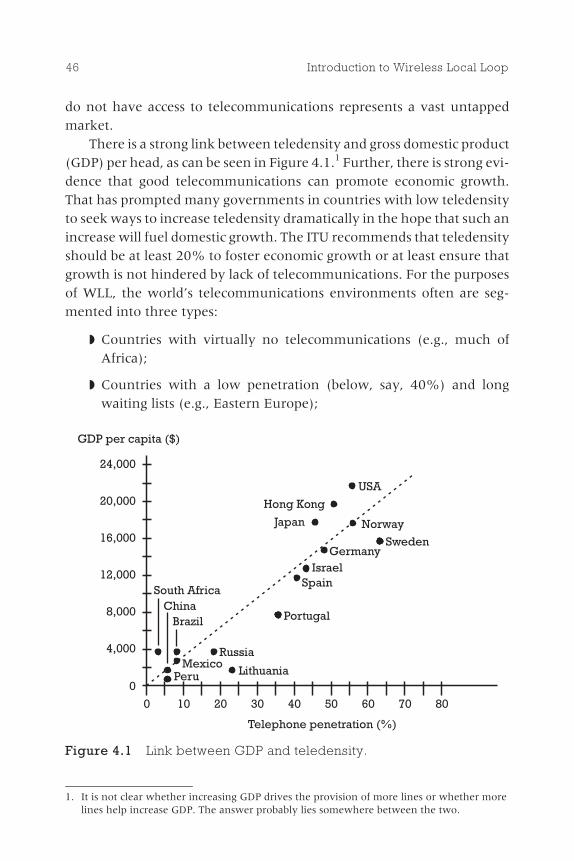
do not have access to telecommunications represents a vast untappedmarket.
There is a strong link between teledensity and gross domestic product(GDP) per head, as can be seen in Figure 4.1.1 Further, there is strong evi-dence that good telecommunications can promote economic growth.That has prompted many governments in countries with low teledensityto seek ways to increase teledensity dramatically in the hope that such anincrease will fuel domestic growth. The ITU recommends that teledensityshould be at least 20% to foster economic growth or at least ensure thatgrowth is not hindered by lack of telecommunications. For the purposesof WLL, the world�s telecommunications environments often are seg-mented into three types:
◗ Countries with virtually no telecommunications (e.g., much ofAfrica);
◗ Countries with a low penetration (below, say, 40%) and longwaiting lists (e.g., Eastern Europe);
46 Introduction to Wireless Local Loop
USA
Hong Kong
Japan Norway
SwedenGermany
IsraelSpain
Portugal
PeruMexico
Lithuania
Russia
South AfricaChina
Brazil
GDP per capita ($)
24,000
20,000
16,000
12,000
8,000
4,000
0
0 10 20 30 40 50 60 70 80
Telephone penetration (%)
Figure 4.1 Link between GDP and teledensity.
1. It is not clear whether increasing GDP drives the provision of more lines or whether morelines help increase GDP. The answer probably lies somewhere between the two.
◗ Countries with high penetration (above, say, 40%), includingcountries where there is limited competition (e.g., France and Ger-many) and where there is high competition (e.g., the United King-dom).
In regard to the potential for WLL, the three types of countries differin a number of important ways:
◗ The functionality required by the users varies from simpletelephony to high-speed multimedia.
◗ The ability of consumers to pay for the service varies fromnonexistent to ample.
◗ The local telecommunications infrastructure varies from nonexist-ent to comprehensive.
◗ The competition in the access network varies from none to intense.
The differences are crucial to all aspects of the WLL network. As willbecome clear in Part IV, a key strength of WLL is its ability to adapt to eachof those different environments through the selection of appropriatetechnologies and network plans in a manner no other access technologycan emulate.
The remainder of this chapter considers each of the different environ-ments in more detail before finally looking at how they have affected thehistory of WLL.
4.2 Developing countries
Any definition of developing countries is certain to be incomplete or toinclude some inappropriate entries because of the breadth of countriesthat are described as such. That is not problematic in this chapter, whichseeks to improve on the global generalizations of Chapter 3. It may, how-ever, be a problem for a WLL operator considering a particular countrybecause the variations found in each country will ensure that off-the-shelf solutions are applicable only to a limited degree.
This section examines countries where the teledensity is below theITU-recommended minimum of 20%. Another typical trait consideredhere is that there is a small or nonexistent waiting list for a telephone line
Telecommunications environments worldwide 47
because those without telephone access either cannot afford it or simplyare unaware of the advantages it could bring. Countries included in thiscategory are much of Latin America; most, if not all, of Africa; parts of theMiddle East; India; much of China; remote parts of Russia; and some ofthe least developed countries in the Far East.
These countries typically have limited teledensity because the eco-nomics of the countries are such that they cannot afford the cost of build-ing a wired infrastructure. Much of the population lives in self-containedcommunities needing little interaction with other communities; hence,the need for telephony is limited.
These countries may have great difficulties in installing telephonysystems. With limited expertise in the country, expensive foreign workersare required to install and maintain the system. Climatic conditions suchas tornadoes and flooding may regularly destroy any installed infrastruc-ture. Even where climatic conditions are more favorable, the popula-tions themselves may destroy the infrastructure through war or forcommercial gain. In South Africa, for example, new copper cables stayburied only for a few weeks, after which the copper miraculouslyreappears on the local market in the form of bracelets and similar arti-facts. Even fiber-optic cable seems to have some second-hand value.
Although the population may not be able to afford telephony, theremay be forces at hand trying to introduce it. International aid agencies,such as the World Bank, recognize the pivotal role of telecommunicationsin leveraging a country out of Third World status. Governments areequally aware of the importance of a good telecommunications system.Therefore, there may be funding for the installation and operation of thesystem even when the country apparently is too poor to afford it. As anexample, again from South Africa, the government used the revenuefrom cellular operators to finance a project to install a million phone linesover the period 1998�2000. Unfortunately, not all countries have thewealth from a minority in the populace to draw on in financing moreuniversal telecommunications provision.
In such situations, clearly the key attribute of an access technologyis low capital and through-life costs. Rapid installation also is importantto avoid the need to borrow capital over long periods of time. Highbandwidths and multiple lines per house would be unnecessary, and thecomplexity they entail needs to be avoided. The example of South Africaand the climatic problems mentioned previously demonstrate that cabled
48 Introduction to Wireless Local Loop

solutions simply are not viable in many of these countries. Wireless pro-vides the only solution, offering the advantages of considerable through-lifecost savings over twisted-pair installation, relatively low maintenance, andrapid rollout. Even the requirement for radio spectrum, often WLL�sAchilles� heel, as will be seen in later chapters, is only a minor difficulty incountries where much of the spectrum lies fallow in any case.
An example of such a country is India. Figure 4.2 shows the annualsupply and waiting list for telephone lines in India in the last few years. Itis clear that while the supply rate of lines is increasing significantly, it ishaving little effect on curbing the waiting list. Other interesting statisticsconcerning India include the following:
◗ Total area is 3.3 million km2.
◗ Total population is 930 million.
◗ Average teledensity is 1.45%.
◗ Rural teledensity is 0.2%.
◗ Number of villages without a telephone number is 400,000.
The Indian government has decided that the best way to increase theteledensity is to introduce competition to the incumbent PTO and to
Telecommunications environments worldwide 49
Waiting85 8789 91
9395Year
3
2.5
2
1.5
1
0.5
0
Lin
es
(mil
lio
ns)
Supply
Figure 4.2 Supply of lines per year and average waiting list in India.
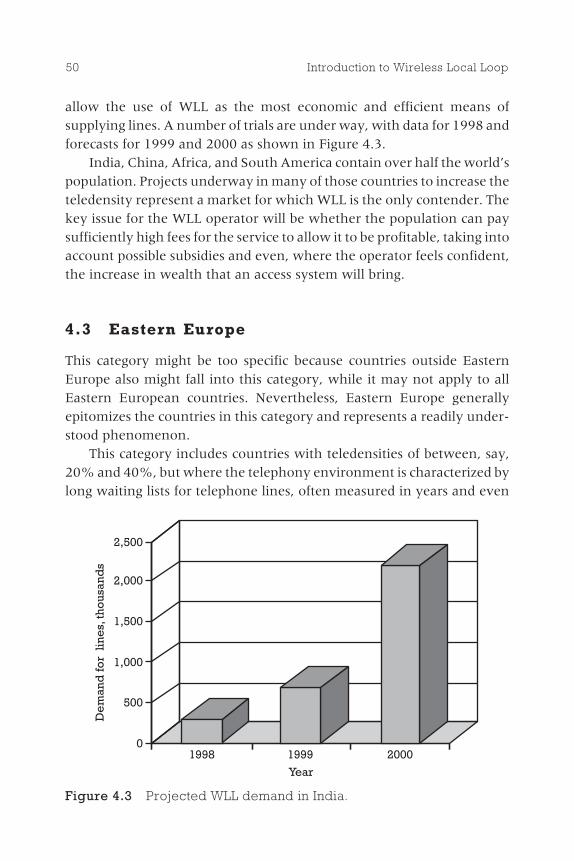
allow the use of WLL as the most economic and efficient means ofsupplying lines. A number of trials are under way, with data for 1998 andforecasts for 1999 and 2000 as shown in Figure 4.3.
India, China, Africa, and South America contain over half the world�spopulation. Projects underway in many of those countries to increase theteledensity represent a market for which WLL is the only contender. Thekey issue for the WLL operator will be whether the population can paysufficiently high fees for the service to allow it to be profitable, taking intoaccount possible subsidies and even, where the operator feels confident,the increase in wealth that an access system will bring.
4.3 Eastern Europe
This category might be too specific because countries outside EasternEurope also might fall into this category, while it may not apply to allEastern European countries. Nevertheless, Eastern Europe generallyepitomizes the countries in this category and represents a readily under-stood phenomenon.
This category includes countries with teledensities of between, say,20% and 40%, but where the telephony environment is characterized bylong waiting lists for telephone lines, often measured in years and even
50 Introduction to Wireless Local Loop
De
man
dfo
rli
ne
s,th
ous
and
s
2,500
2,000
1,500
1,000
500
01998 1999 2000
Year
Figure 4.3 Projected WLL demand in India.
tens of years. In these countries, being able to afford the telecommunica-tions service is not particularly problematic; the key issue simply is gain-ing access to it. Typically, the PTO has not been able to match demand,and no action has been taken to overcome that problem. This was the casein many previously communist countries where central planning failedto provide sufficient resources to developing telecommunications andwhere telecommunications often was viewed with suspicion by dictatorswho had concerns that it would permit subversive conversations. Manyof these countries have moved to a more market-driven economy andrecognize that rapid provision of telecommunications could significantlyenhance their growth rates.
An example of a country in this category is Hungary. In 1997,Hungary had 10.4 million inhabitants, a teledensity of 25%, and a mobilepenetration of 6%. The government imposed obligations on the fixed-line providers that the number of subscribers should increase by a mini-mum of 15% annually. To do that, WLL systems were installed during1995 and 1996 based on analog cellular technology. There are now260 base stations serving 120,000 subscribers. The system has beenjudged a partial success, and much has been learned from it.
Other countries falling into this category include some of the Asia-Pacificcountries, such as Indonesia and Malaysia, where recent high growth rateshave resulted in a massive increase in demand for telecommunications,which the PTO has neither the resources nor the experience to meet.
In some cases, the demand has been met through the use of mobilecommunications, which has the advantage of rapid rollout and no wait-ing list. Such substitution, however, typically is expensive and only forthose able to offset the costs against significantly enhanced business reve-nue. Mobile telephony helps ease the problem but does not provide anoptimal solution for a country that requires an inexpensive, ubiquitous,and high-quality access network capable of future upgrade.
The key issue for all these countries is to rapidly provide telecommu-nications so that high growth rates can be achieved and waiting listsreduced to the months or days typical of First World countries. Currently,most of the population would be happy with voice-only capability, butas a country rapidly gains in wealth, it seems likely that additional serv-ices such as limited data capabilities, Internet access, and similar serviceswould be required. A forward-thinking operator would provision at leasttwo 64-Kbps channels per user.
Telecommunications environments worldwide 51

Unlike the developing countries, twisted pair and other cable solu-tions do provide possible alternatives in Eastern European�type coun-tries. However, for whatever reasons, those solutions cannot be deployedwith sufficient speed to meet the needs of the country. Solutions thatprovide more rapid connection include the following:
◗ Mobile radio, which typically is too expensive to meet the needs ofeveryone on the waiting lists;
◗ Satellite access, which has either no uplink access or is not suitablefor deployment on millions of houses due to a lack of capacity andradio spectrum;
◗ WLL, which provides the most appropriate solution.
The suitability of WLL for these applications has been shown innumerous Eastern European countries. Table 4.1 lists some statisticsrelating to 1998 (these figures most likely will be understated by the timethis book is in print).
Eastern European countries will provide many WLL operators withenvironments the operators feel more comfortable with than they do inthe developing world. There is a relatively stable and growing economy, aclear demand for the product, the means to pay for it, and sufficientexpertise to help install and maintain the system. Competition is limited,with a single PTO (which largely has proved to be ineffectual at combating
52 Introduction to Wireless Local Loop
T a b l e 4 . 1WLL Networks in Eastern Europe at the End of 1998
CountryNumber ofWLL Networks Technologies Adopted
Czech Republic 5 Various including DECT and proprietary
Estonia 1 Analog cellular
Hungary 9 Mostly analog cellular, some DECT
Poland 7 Some DECT but mostly proprietary
Romania 5 Mostly DECT
Slovak Republic 1 DECT
Turkey 1 Proprietary
Uzbekistan 2 Proprietary
competition), few cable operators, and mobile operators charging highprices to the high-value market but not attacking the residential market.The requirements for services typically fall within the capability of WLL,ensuring the operator that its network will not be quickly outdated.
Eastern Europe then represents an assured market. In comparison tothe developed countries, the size of the market is small, but in absoluteterms it probably exceeds 100 million lines, a substantial market by anyestimate.
4.4 First World countries
By elimination, this category contains all the countries not included in thetwo preceding categories. To be more specific, this category includescountries with penetrations in excess of 40% and with waiting lists of lessthan one year. It includes Europe, North America, Canada, the PacificRim �Tigers,� Australia, New Zealand, the rich Middle Eastern countries,and other similarly economically situated countries. The First Worldcountries deliver the vast majority of the world�s wealth and representhigh-spending, high-value markets. In these countries, telecommunica-tions operators have been able to match demand for the installation ofnew lines, typically have installed digital exchanges, and frequentlyincrease their service offerings. California represents an interestingextreme, where demand has recently outstripped supply due to rapidgrowth in Internet access.
For the purposes of this analysis, it is instructive to split this categoryfurther into countries where the telecommunications environment hasbeen liberalized and those where it has not. By �liberalized� we mean thatthe PTO is no longer protected from competition and that, with fewrestrictions, any operator wishing to provide telecommunications serv-ices may enter the market in competition with the PTO. One of the mostliberalized environments is the United Kingdom, followed closely by theUnited States. Countries with limited liberalization include France andGermany, although since the European Community directives in 1998,full liberalization has increasingly been taking place in these countries.
Both environments contain sophisticated consumers with multiplephone lines, high expectations, and increasing requirements for newservices and increased bandwidth.
Telecommunications environments worldwide 53
4.4.1 High penetration, limited competition
The countries in this category can be viewed as a progression of theEastern European category. The PTO remains in a monopoly position,often heavily influenced by government, and, as with many monopolies,typically is not as lean and mean as it might be. However, it at least hasbeen able to meet demand, unlike the PTOs in the Eastern European cate-gory. Its service is disliked by many, and its charges are somewhat higherthan could be achieved by a competing operator.
The main way in which the government can change this situation isto introduce competition. Two forms of competition have been identified:competition in the trunk network and competition in the access network.
Competition in the trunk network often is the means whereby com-petition is introduced first. To compete in the trunk network, an operatormerely has to interconnect key cities with high-bandwidth links. That canbe achieved using buried cable, cables run along power lines, or cablessunk in places like canals and rivers. However, it does not take the PTOmuch to overcome such competition. By charging a high fee for accessfrom the trunk network to the customers via the local network, a PTO canensure that the effects of competition are minimal. Even despite strict regu-lation in the United Kingdom, trunk network competition from Mercury toBT failed to make any significant difference in prices and services. Trunknetwork competition, then, is unlikely to achieve governmental aims.
Competition in the local loop can provide significant stimulus to thePTO. It allows competitors to remove customers entirely from the PTO, aprospect that will stimulate most PTOs or simply result in competitorsbeing able to take over the majority of their marketplace.
The government is likely to be eager to introduce competition into thelocal loop, and that represents an opportunity for the WLL operator. Withonly the inefficient PTO for competition, attracting consumers should berelatively easy.
Competition could come from a second wireline network or a wire-less network. For the government, a wireless network is more attractive.New wireline networks cause massive disruption as streets are dug up,traffic disrupted, and environmental damage caused (e.g., the cutting oftree roots). Wireline networks take many tens of years to develop for thewhole country, so the competitive pressures are slow to emerge. Govern-ments, therefore, will want to encourage WLL operators by providing
54 Introduction to Wireless Local Loop

spectrum and licenses on favorable terms and generally helping whenand where possible.
Although the government may be keen to encourage WLL operators,there is one key concern for the prospective operator, namely, that thecompetitive pressure will result in significant improvements to the PTO.That will allow the PTO to reduce prices and increase services, attractingcustomers back from the wireless operator to the PTO. The PTO may beable to introduce ISDN or xDSL services where needed, thus providing abetter service than the WLL operator can. The WLL operator will want torecoup its investment costs over a relatively short period to reduce therisk that its network may become obsolete in the medium term. Giventhe high spending on telecommunications in these countries, that maybe possible.
An example of such a market is Germany, where the government isonly just starting to introduce competition. In Germany, the main threatto the PTO, Deutsche Telekom, comes from alliances between Germanindustrial giants and outside telecom operators, the operators oftenhaving experience of competing in liberalized environments. AlthoughGermany has a relatively high cable penetration, most of the cable net-work is owned by Deutsche Telekom; hence, there will not be competi-tion between cable and twisted-pair operators in the same manner thereis in other countries (e.g., the United Kingdom). The German trunkednetwork market already is relatively competitive, so the government isconcentrating on the provision of competition in the access network.
The first step toward such competition was taken in 1995, when theGerman government said it would grant 28 regional licenses to operateWLL networks using DECT technology. Governments generally get itwrong when they specify technologies, and this was no exception.Although DECT had the advantage that the frequencies were alreadyavailable, and hence no long migration of the existing users of the radiofrequency band was required, prospective operators were concerned thatDECT might not be able to provide sufficient capacity, especially wherethere was more than one operator in the same area. Some of the highercapacity proprietary technologies were preferred. The government is nowin the process of reconsidering how to issue the licenses, but the net resulthas been a significant delay in the introduction of competition.
Concern also still exists over the regulatory environment. Newoperators are concerned that the regulator will not be sufficiently
Telecommunications environments worldwide 55
aggressive to prevent anticompetitive behavior by Deutsche Telekom.Already, Deutsche Telekom has provided discounts to some businessesthat appear to be subsidized by other customers and designed to prevent�cream-skimming� by the new operators.
Overall, this represents a fertile area for new operators with only onemain competitor. However, strategies need to be designed that will notallow cross-subsidization to work. For example, if the majority of residen-tial subscribers are targeted, there will be nowhere for Deutsche Telekomto look for subsidy.
4.4.2 High penetration, high competition
In some countries, the telecommunications environment was liberalizedsome time ago and the competition for telecommunications has becomeintense. A good example is the United Kingdom, where there is competi-tion in the trunk routes from BT, Mercury, Energis (which uses electricitypylons to carry fiber-optic cables), and other emergent operators. In thelocal loop, there is already competition between BT and over 150 cablefranchises. In total, eight WLL licenses have been issued. There also iscompetition from mobile operators, some of which offer unlimited freecalls in the evening and on weekends in an attempt to persuade custom-ers to use mobile rather than fixed calls.
Competing in such an environment is extremely difficult. The PTOhas responded to commercial pressure and is likely to continue bothreducing call costs (by around 7% per year in the United Kingdom)and introducing new services such as call-back-when-free, voicemail,and caller ID. Moving into direct competition with the PTO is possible, butit is complicated by the need to continually reduce costs and increasefunctionality. The WLL operator also is likely to offer a relatively low datarate compared to the cable operators, ISDN lines, and, in the next fiveyears, xDSL access technology.
Potential WLL operators must find particular niches in the marketthat they can penetrate. For example, in the United Kingdom, ISDN con-nection charges and annual rental fees are relatively high. It would bepossible to offer ISDN to small businesses and individual homes thatrequire Internet access at a lower price and hence gain substantial busi-ness. However, such a business move is predicated on the PTO not lower-ing its ISDN price to match those of the WLL operator, a likely response
56 Introduction to Wireless Local Loop
for a PTO that sees an important part of its market migrating to a differentoperator.
An alternative approach might be to couple telephony with broadcastthrough the use of LMDS, thus offering a differentiated proposition to thePTO (although not to the cable operator). By concentrating on areaswhere cable is uneconomic because the density of homes is too low, apotential market niche that cannot be attacked might be discovered.
Whatever approach is adopted in markets in the First World, theWLL operator must remember the key advantages and disadvantages.Advantages include the following:
◗ WLL is low cost, relative to deploying twisted pair or cable (note,however, that the PTO will have depreciated the deployment costmany years previously).
◗ It offers high-speed deployment compared to twisted pair or cable,allowing customers to be attracted before the other operators canoffer them service (once attracted, customers hopefully can beretained through loyalty schemes).
The disadvantages include the following:
◗ WLL cannot provide the access speed of other media and hence maybe outdone in the services it can offer.
◗ The WLL operator cannot subsidize local loop access from otheractivities (such as international calls) in the same manner thePTO can.
In the market of high penetration and high competition, there ispotential for WLL, but competitive pressures may be intense compared tothe other categories. This market is illustrated next with a detailed look atthe United Kingdom.
4.4.3 The U.K. marketplace
The United Kingdom is one of the most open and competitive markets inthe world. Many other countries look to the United Kingdom for leader-ship on policies relating to telecommunications, and some large compa-nies compete in the U.K. market, not primarily to make profit but to cut
Telecommunications environments worldwide 57
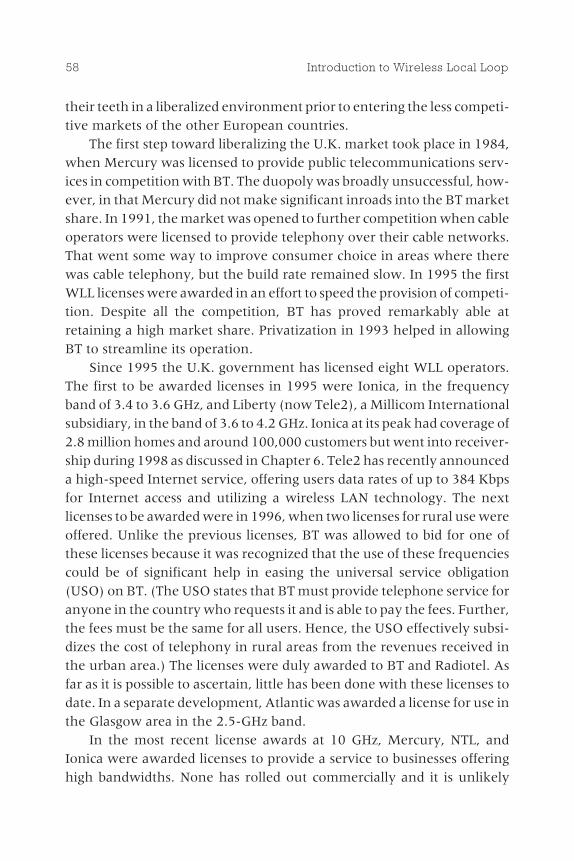
their teeth in a liberalized environment prior to entering the less competi-tive markets of the other European countries.
The first step toward liberalizing the U.K. market took place in 1984,when Mercury was licensed to provide public telecommunications serv-ices in competition with BT. The duopoly was broadly unsuccessful, how-ever, in that Mercury did not make significant inroads into the BT marketshare. In 1991, the market was opened to further competition when cableoperators were licensed to provide telephony over their cable networks.That went some way to improve consumer choice in areas where therewas cable telephony, but the build rate remained slow. In 1995 the firstWLL licenses were awarded in an effort to speed the provision of competi-tion. Despite all the competition, BT has proved remarkably able atretaining a high market share. Privatization in 1993 helped in allowingBT to streamline its operation.
Since 1995 the U.K. government has licensed eight WLL operators.The first to be awarded licenses in 1995 were Ionica, in the frequencyband of 3.4 to 3.6 GHz, and Liberty (now Tele2), a Millicom Internationalsubsidiary, in the band of 3.6 to 4.2 GHz. Ionica at its peak had coverage of2.8 million homes and around 100,000 customers but went into receiver-ship during 1998 as discussed in Chapter 6. Tele2 has recently announceda high-speed Internet service, offering users data rates of up to 384 Kbpsfor Internet access and utilizing a wireless LAN technology. The nextlicenses to be awarded were in 1996, when two licenses for rural use wereoffered. Unlike the previous licenses, BT was allowed to bid for one ofthese licenses because it was recognized that the use of these frequenciescould be of significant help in easing the universal service obligation(USO) on BT. (The USO states that BT must provide telephone service foranyone in the country who requests it and is able to pay the fees. Further,the fees must be the same for all users. Hence, the USO effectively subsi-dizes the cost of telephony in rural areas from the revenues received inthe urban area.) The licenses were duly awarded to BT and Radiotel. Asfar as it is possible to ascertain, little has been done with these licenses todate. In a separate development, Atlantic was awarded a license for use inthe Glasgow area in the 2.5-GHz band.
In the most recent license awards at 10 GHz, Mercury, NTL, andIonica were awarded licenses to provide a service to businesses offeringhigh bandwidths. None has rolled out commercially and it is unlikely
58 Introduction to Wireless Local Loop

that Ionica will be able to utilize its license because it has passed intoreceivership.
It is still too early to understand the effect of the WLL operators on theU.K. market because, to date, only Ionica and Atlantic have marketeda service. They have had mixed fortunes, with Ionica going into receiver-ship while Atlantic is slowly expanding its service to a number of Scottishcities. The current verdict is that WLL can probably be profitable in theUnited Kingdom but that achieving profitability is not an easy task.
There have been recent changes in the regulatory philosophyimposed by the U.K. regulator of telecommunications, Oftel. (Oftel is ashortened version of Office of Telecommunication and it regulates opera-tors within the United Kingdom.) From the time that BT was privatized,in 1993, until 1996, Oftel relied heavily on a regime in which BT�s priceswere forced to fall in real terms each year (the so-called RPI-x regime,where RPI stands for retail price index). Oftel argues that that regulationwas one of the key reasons why BT�s prices fell by 40% between 1993 and1997, in real terms. New entrants disliked such regulation because theytypically were forced to undercut BT to entice users to change to a differ-ent service. The RPI-x formula also affected the prices they could charge,making their competitive environment difficult.
Because of the fact that the regulatory regime did not significantlyreduce BT�s share and because of competitors� dislike of it, in 1997Oftel changed its regulatory stance to one in which prices are no longerfixed. However, Oftel increased its powers to deal with anticompetitivebehavior.
Analysts have questioned whether BT�s market share is really underthreat from most of the new operators. Some new operators prefer tocream-skim by competing only for the highest value customers in theeasiest-to-serve locations and thus maximize their profits. That impliesthat BT would retain the bulk of the market but lose the most profitablecustomers. Cream-skimming cannot continue indefinitely, however. Asincreasingly more WLL operators compete for market share, competitionin the residential marketplace can be expected to become more intense.Figure 4.4 shows predictions from SBC Warburg of the BT market sharein the coming years.
It remains to be seen whether the WLL operators will be more effec-tive at reducing the BT market share than the cable operators have been.
Telecommunications environments worldwide 59
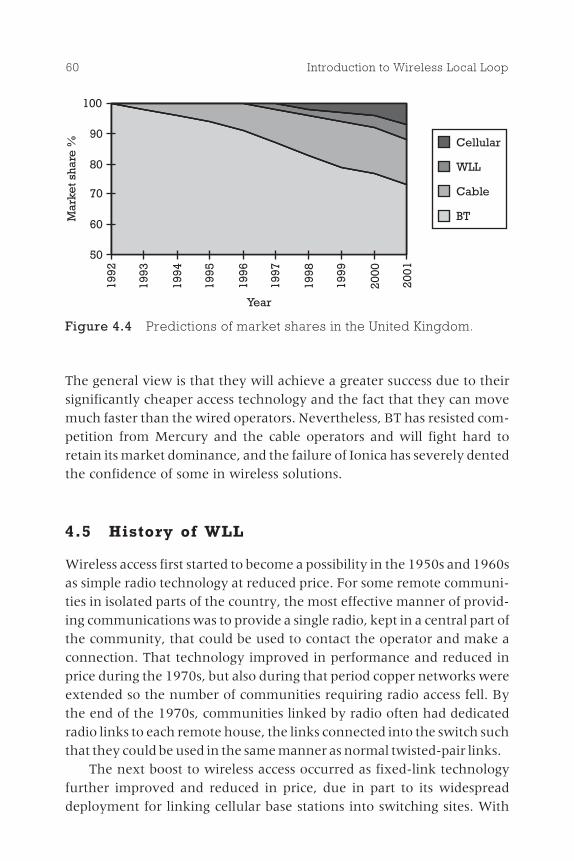
The general view is that they will achieve a greater success due to theirsignificantly cheaper access technology and the fact that they can movemuch faster than the wired operators. Nevertheless, BT has resisted com-petition from Mercury and the cable operators and will fight hard toretain its market dominance, and the failure of Ionica has severely dentedthe confidence of some in wireless solutions.
4.5 History of WLL
Wireless access first started to become a possibility in the 1950s and 1960sas simple radio technology at reduced price. For some remote communi-ties in isolated parts of the country, the most effective manner of provid-ing communications was to provide a single radio, kept in a central part ofthe community, that could be used to contact the operator and make aconnection. That technology improved in performance and reduced inprice during the 1970s, but also during that period copper networks wereextended so the number of communities requiring radio access fell. Bythe end of the 1970s, communities linked by radio often had dedicatedradio links to each remote house, the links connected into the switch suchthat they could be used in the same manner as normal twisted-pair links.
The next boost to wireless access occurred as fixed-link technologyfurther improved and reduced in price, due in part to its widespreaddeployment for linking cellular base stations into switching sites. With
60 Introduction to Wireless Local Loop
1992
1993
1994
1995
1996
1997
1998
1999
2000
2001
Year
100
90
80
70
60
50
Mar
kets
har
e% Cellular
WLL
Cable
BT
Figure 4.4 Predictions of market shares in the United Kingdom.

the cost reduction, it became economic to link medium-size businessesusing radio, even where access via twisted pair was straightforward.Competition often hastened this use of radio. For example, in the UnitedKingdom, the second operator, Mercury, started using fixed links in the13- and 22-GHz bands to interconnect businesses directly to their trunknetwork and thus avoid having to pay BT access charges. Such a use offixed links gave Mercury the following advantages:
◗ Cheaper access. Cable did not have to be installed to the businesscustomer.
◗ Faster access. Service could be provided within days of when thebusiness requested it.
◗ Few sunken costs. If a business decided to move back to the PTO,Mercury could relocate the radio equipment to a different business;it would not have been able to relocate buried cable.
Such access, using point-to-point microwaves links, continues to bewidespread to date. Operators using the technique still are recordinggrowth in the number of links deployed.
WLL as a concept was established many years ago, if not recognizedas an entire access network in its own right. That changed with thereintegration of East Germany and West Germany into a single unifiedGermany. Germany was not the only driver for WLL, and WLL certainlywould have happened without unification. Indeed, there were develop-ments prior to German reunification in which WLL networks wereplanned or deployed, but from the point of view of understanding WLL,Germany remains a good example.
When reunification of East and West Germany occurred, there waspressure to increase the standard of living in East Germany to that of WestGermany in the shortest time possible. A key difference between thetwo parts of the country was teledensity, which was First World in WestGermany and Eastern European in the East Germany. West Germanycould provide the funding and the expertise to install twisted-pair accessthroughout East Germany, but that would be a slow process. In theinterim, cellular radio seemed to offer a stop-gap measure to providerapid telecommunications capability. So in East Germany, a number ofcellular networks, based on the analog Nordic Mobile Telephone (NMT)standard, were deployed in the 800-MHz frequency band. The key
Telecommunications environments worldwide 61
difference was that subscribers had fixed units mounted to the sides oftheir houses to increase the signal strength and hence allow the networksto be constructed with larger cells and for lower costs. Thus, the first WLLnetwork, as they are known today, was born.
From that point, interest in WLL grew at an incredible pace. Manufac-turers of cellular radio and cordless radio technologies, quickly recogniz-ing an additional market for their products over and above their initialdesign for mobile access, were quick to rename slightly modified productsas �wireless local loop ready.� The availability of equipment spurred gov-ernments into providing licenses and emerging operators to apply forthem. In the First World countries, cellular systems were not appropriatebecause the spectrum for their operation was already in use, so manufac-turers quickly started working on proprietary technologies. The numberof announced WLL networks, which included trials and networks underconstruction, leapt from a handful in 1994, to double digits in 1995, up toaround 50 in 1996, 130 in 1997, and over 200 by mid-1999. The numberof different technologies offered and different manufacturers providingequipment grew commensurably.
Compared to cellular, WLL still is in its infancy. Few, if any, networksare actually profitable yet. No consensus has been reached on the mostappropriate technology, means of deployment, or countries suitable forWLL. Confusion continues to grow as microwave distribution systems areadded to the wide range of WLL products. The history of WLL will con-tinue to be written during the coming decade.
An interesting history of WLL developments from 1950 to 1990 canbe found in a paper written by Claude Buster, the chief of the Transmis-sion Branch of the U.S. Rural Electrification Administration (REA). Asummary of Buster�s historical version of WLL, which has been reprintedin [1], follows.
◗ Early 1950s. Single-channel VHF subscriber equipment was pur-chased from Motorola, but the maintenance costs were too high asa result of the valve technology used and the power consumptiontoo high. The trial was discontinued and the subscribers wereconnected by wire.
◗ Mid-1950s. Raytheon was given seed funds to develop 6-GHz bandequipment, which would have a better reliability and a lower
62 Introduction to Wireless Local Loop
power consumption. The designers failed to achieve those goals,and the system still proved too expensive.
◗ Late 1950s. Some equipment capable of providing mobile service torural communities was put on trial. Users were prepared to pay apremium for mobile use, but the system still proved too expensivein a fixed application for which users were not prepared to paya premium.
◗ Early 1960s. Systems able to operate on a number of radio channelswere developed, eliminating the need for each user to share aspecific channel and thus increasing capacity. The general lack ofchannels and high cost, however, made these systems unattractive.
◗ Early 1970s. A Canadian manufacturer developed equipment oper-ating at 150 MHz that proved successful in serving fixed subscriberson an island in Lake Superior. The lack of frequencies in the band,however, precluded its widespread use.
◗ Late 1970s. The radio equipment from several U.S. manufacturerswas linked to provide service to isolated Puerto Rican villages. Theservice was possible only because the geographical location allowedthe use of additional channels, providing greater capacity thanwould have been possible elsewhere.
◗ Early 1980s. Communications satellites were examined for ruralapplications but were rejected as being too expensive.
◗ 1985. Trials of a point-to-multipoint radio system using digitalmodulation promised sufficient capacity and reliability to makeWLL look promising.
Indeed, the book by Calhoun is itself an interesting reference [1].Calhoun used the book, written in 1991, as a vehicle to state his view thataccess methods would change from copper to radio in the future. Hence,even in 1991, it was far from universally accepted that WLL wouldbecome the predominant access method. Calhoun generally focused onthe use of radio as a mechanism for rural access but looked further intothe future to postulate that WLL might be the best way to provide ISDNaccess to fixed subscribers. Calhoun typically concentrated on the PTO
Telecommunications environments worldwide 63
switching from copper to wireless, and already the competitive environ-ment has changed significantly.
4.6 The business of subsidization
Some customers cost more to interconnect to the network than others,yet all customers pay the same rental and call charges. The issue ofsubsidization is important for two reasons: first, the social implicationsof limited access into the telephone network and, second, the marketopportunities it opens to incumbents. This section examines those issuesin more detail.
Chapter 5 shows that the cost of connecting a subscriber with coppercable is almost entirely associated with the cable itself; the switching andinterconnection costs are virtually insignificant. In principle, users closestto the local exchange should pay a lower fee for their calls than users far-ther away. With the exception of communities so isolated that satellitelinks are required, such differential costing never has occurred. That deci-sion was made by both the PTO and the governments in their mutualinterests. Governments always have been keen to achieve universal serv-ice provision, at least as far as possible, without having to fund the PTOexplicitly. In return, the PTOs have been keen to retain their monopolies.PTOs have pointed out to governments that if they lost a monopoly overthe customers who subsidize rural access, either they would no longer beable to afford to supply rural access or they would need rural bills to be anorder of magnitude higher than urban bills. Neither of those optionssuited the government, so the status quo was preserved for many years.
The situation started to change when private operators were allowedto run their own microwave links. From there, it was a small step to askwhy, once those links were installed, they could not offer capacity to oth-ers. In a number of landmark cases, courts ruled that such provision waslegal, and in the 1970s competition was opened up in the U.S. backbonenetwork, removing a key source of subsidization from the PTO. Nolonger was the PTO able to justify charging high rates for long-distancecalls when the additional resources required for the backhaul link costvirtually nothing. If the PTO did try to charge higher rates, it lost the busi-ness to competitors. However, subsidization in the local loop remainsto this day. By analogy with the backhaul, it will be the imminent
64 Introduction to Wireless Local Loop

introduction of wireless local loop systems provided by competitors thatwill make such subsidization difficult to prolong. For more discussion ofthis topic, see [1].
The reason subsidization will become unsustainable is because com-petitors will be able to offer service to those who are doing the subsidizingat a much lower cost than they are currently paying. The PTO then losesthe revenue it requires for subsidization, and the rural prices need to riseto overcome the loss of revenue. That is exactly what the cable companieshave been doing in the United Kingdom, and it is likely to be a strategyadopted by WLL operators.
One important effect of WLL is that it reduces the relative cost differ-ence between rural and urban provision. So, while rural access stillremains more costly, the subsidization required is not so great. Even so,some WLL operators are actively targeting urban customers in preferenceto rural customers.
So what will be the effect of all these upheavals? It seems inevitablethat subsidization gradually will be removed. Even if the PTO does notexplicitly have different rates for urban and rural areas, those in urbanareas will have the option of switching to a different telecommunicationsprovider offering a cheaper tariff, and, in effect, rural customers will pay ahigher rate. The societal implications concerning universal access willexercise politicians and courts in the coming years.
Chapter 5 looks at the fundamental economics underlying WLL sys-tems. Previous chapters stated that an advantage of WLL systems is thatthey can be deployed more economically than wired systems. The nextchapter explains why that is the case and shows how the cost advantagecan be calculated.
Reference
[1] Calhoun, C., Wireless Access and the Local Telephone Network, Norwood, MA:Artech House, 1992.
Telecommunications environments worldwide 65
The economics ofwireless versus fixed
5.1 The economics oftelecommunications systems
Telecommunications systems, like manyforms of business, require a significantupfront investment followed by a period overwhich the investment can be recouped in theform of revenue from customers. The basiceconomics of a telecommunications systemlook somewhat like this:
◗ An initial capital outflow to build a suffi-ciently large part of the network to make itviable;
◗ Interest payments on the capital sum untilsuch period as the network becomesprofitable;
◗ Revenue from customers increasing asmore customers are signed to the network;
◗ Ongoing maintenance, upgrade, and mar-keting costs.
67
Contents
5.1 The economics oftelecommunicationssystems
5.2 The cost of wiredsystems
5.3 The cost ofwireless systems
5.4 Hybrid systems
5.5 Market forecasts
5C H A P T E R
Fundamentally, over the investment period, which typically could beanything from 5 to 15 years, depending on the risks the operator isprepared to take, the cumulative revenue from the customers must offsetall the costs associated with the network.
In terms of that economic model, the greatest difference between thedifferent access technologies discussed in Chapter 3 is the initial capitalcost, which naturally affects the interest payments. For the differentaccess technologies, the revenue from the customers will be broadly simi-lar, unless a particular access technology is able to offer some additionalservice (such as TV) for which the consumers will be prepared to payadditional fees. Many of the ongoing costs will be the same for all thedifferent access technologies, particularly marketing, billing, and generalcustomer-care issues. Some access methods, however, will have lowermaintenance costs than others.
The key concern of WLL operators will be their cost base in compari-son to operators using twisted-pair or cable access. Alternatively, WLLoperators may be interested in whether they should install cable orthemselves use wire. This chapter explains the key economic variablesfor wired and wireless access.
This chapter is concerned only with the access costs. All networksrequire backhaul connections and switches, which will be broadly similarfor all access technologies. For that reason, those costs are not shown indetail here. Simplistically, a core network with switching and transmis-sion equipment able to handle half a million users typically will costaround $15 to $30 million, at a cost per user of $30 to $60. As will be seen,that cost is relatively insignificant compared to the cost of the accesscomponent.
Once the total network cost has been calculated, it must be factoredinto a complete business case, considering the borrowing requirements,costs relative to the competitors, sensitivity to change of key variables,and so on. Chapter 19 explains the key economic variables for wired andwireless access.
5.2 The cost of wired systems
To provide wired access, it is necessary to provide a cable from a centraldistribution point, perhaps in the center of a city, to each house. To do
68 Introduction to Wireless Local Loop
that, it is necessary to dig up the road, lay cable, and then repair the road.Alternatively, particularly in rural areas, telegraph poles must be installedand wire strung between them. The cost of such an operation dependsheavily on the environment: Laying cable in a metropolitan area isconsiderably more difficult than laying cable across an open field. Thecosts also depend heavily on the local labor costs and productivity. As aguide, laying a cable in a city is likely to cost around $30 to $40/m, whilelaying a cable across a field might cost around $15 to $25/m. The cost toconnect a house is given by its distance from the last house connectedmultiplied by the cost per meter of laying the cable. There also may be thecost of installing a suitable termination in the home. In the case of simpletelephony, such cost is minimal. On the other hand, decoding boxesfor cable TV typically cost around $300 to $400 each, depending on thefunctionality required. That cost will be borne by the network in someway, either in subsidy or in the need to charge lower prices so the totalcost faced by the consumer falls below the cost of using a competitor.
The key variables in determining the cost are as follows:
◗ The distance between houses;
◗ Penetration (i.e., the percentage of homes passed by the cable thatdecide to pay for its use);
◗ The environment through which the cable must be routed.
For example, suppose that houses in a particular area are 10m apart andhave front yards that are 5m long. The cost of cabling in the street is$30/m, while in gardens it is $20/m. Further, suppose that terminationcosts are $50 per home. The cost per home in the case of 100% penetra-tion, then, would be as follows: (10m × $30/m = $300) + (5m × $20/m =$100) + $50 = $450.
Now imagine that the penetration drops to 20% (a figure typicallyachieved by cable operators), so it is necessary to pass four other housesbefore installing cable in a house. The cost to get the cable to the road out-side a house is now 5 × (10m × $30/m) = $1,500. The other costs remainthe same, resulting in a total cost of $1,650 per house.
Figure 5.1 illustrates the variations of cost per house based on dis-tance between houses and penetration. Because most PTOs installed theirtwisted pair at a time when there was near-100% penetration, their costswill have been toward the lower end of those in Figure 5.1. Furthermore,
The economics of wireless versus fixed 69

the PTOs by now may have largely depreciated their installation costs.Hence, when a WLL operator is competing against a PTO, the differencein access costs between the two operators may be mostly academic.Instead, in this case, the comparison is between the maintenance costsof the wired system and the combination of the installation and main-tenance costs of the wireless system.
Maintenance costs of buried cables are surprisingly high. Althoughthe cables are underground, they suffer from flooding and from disrup-tion caused by other entities digging up the streets, for example, to installand maintain gas and water mains. When problems occur, they oftenrequire that a stretch of street be redug to locate the fault and replacethe cable. Maintenance costs on buried cable are typically some 5% of theinstallation cost per year, whereas maintenance costs on a wirelesssystem might be between 1% and 2.5% per year.1
As Calhoun points out, that approach to costing is simplistic [1]. Ittakes into account only the cost of the dedicated cabling required for aspecific house. However, each house also shares part of the trunked
70 Introduction to Wireless Local Loop
35,000
Co
st/h
om
e($
)
30,000
25,000
20,000
15,000
10,000
5,000
04 6 8 10 12 14 16 18 20
Distance between homes (m)
2%
5%
10%
20%
50%
Penetration
Figure 5.1 Variation of cost with penetration and distance.
1. Until WLL systems have been in deployment for a number of years, the typicalmaintenance cost will not be known. Perhaps the best comparison is with cellularsystems, which typically have a 1% maintenance cost. However, WLL networksalso need to maintain subscriber equipment, which may push the cost higher.
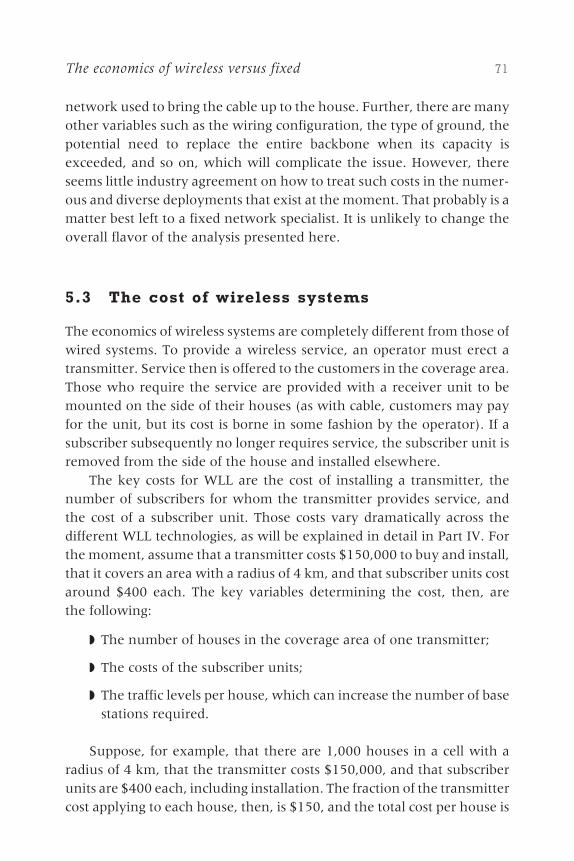
network used to bring the cable up to the house. Further, there are manyother variables such as the wiring configuration, the type of ground, thepotential need to replace the entire backbone when its capacity isexceeded, and so on, which will complicate the issue. However, thereseems little industry agreement on how to treat such costs in the numer-ous and diverse deployments that exist at the moment. That probably is amatter best left to a fixed network specialist. It is unlikely to change theoverall flavor of the analysis presented here.
5.3 The cost of wireless systems
The economics of wireless systems are completely different from those ofwired systems. To provide a wireless service, an operator must erect atransmitter. Service then is offered to the customers in the coverage area.Those who require the service are provided with a receiver unit to bemounted on the side of their houses (as with cable, customers may payfor the unit, but its cost is borne in some fashion by the operator). If asubscriber subsequently no longer requires service, the subscriber unit isremoved from the side of the house and installed elsewhere.
The key costs for WLL are the cost of installing a transmitter, thenumber of subscribers for whom the transmitter provides service, andthe cost of a subscriber unit. Those costs vary dramatically across thedifferent WLL technologies, as will be explained in detail in Part IV. Forthe moment, assume that a transmitter costs $150,000 to buy and install,that it covers an area with a radius of 4 km, and that subscriber units costaround $400 each. The key variables determining the cost, then, arethe following:
◗ The number of houses in the coverage area of one transmitter;
◗ The costs of the subscriber units;
◗ The traffic levels per house, which can increase the number of basestations required.
Suppose, for example, that there are 1,000 houses in a cell with aradius of 4 km, that the transmitter costs $150,000, and that subscriberunits are $400 each, including installation. The fraction of the transmittercost applying to each house, then, is $150, and the total cost per house is
The economics of wireless versus fixed 71
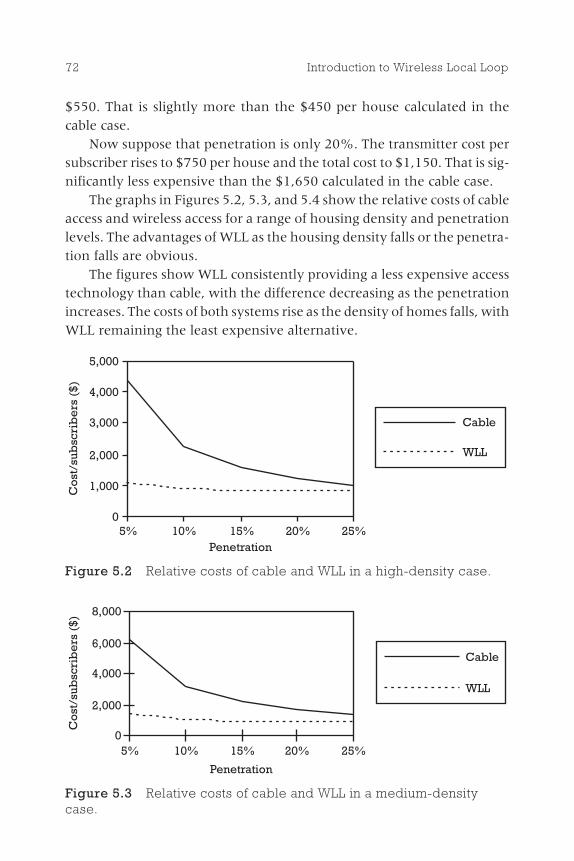
$550. That is slightly more than the $450 per house calculated in thecable case.
Now suppose that penetration is only 20%. The transmitter cost persubscriber rises to $750 per house and the total cost to $1,150. That is sig-nificantly less expensive than the $1,650 calculated in the cable case.
The graphs in Figures 5.2, 5.3, and 5.4 show the relative costs of cableaccess and wireless access for a range of housing density and penetrationlevels. The advantages of WLL as the housing density falls or the penetra-tion falls are obvious.
The figures show WLL consistently providing a less expensive accesstechnology than cable, with the difference decreasing as the penetrationincreases. The costs of both systems rise as the density of homes falls, withWLL remaining the least expensive alternative.
72 Introduction to Wireless Local Loop
5,000
4,000
3,000
2,000
1,000
05% 10% 15% 20% 25%
Penetration
Co
st/s
ubsc
rib
ers
($)
Cable
WLL
Figure 5.2 Relative costs of cable and WLL in a high-density case.
Co
st/s
ubsc
rib
ers
($) 8,000
6,000
4,000
2,000
05% 10% 15% 20% 25%
Penetration
Cable
WLL
Figure 5.3 Relative costs of cable and WLL in a medium-densitycase.
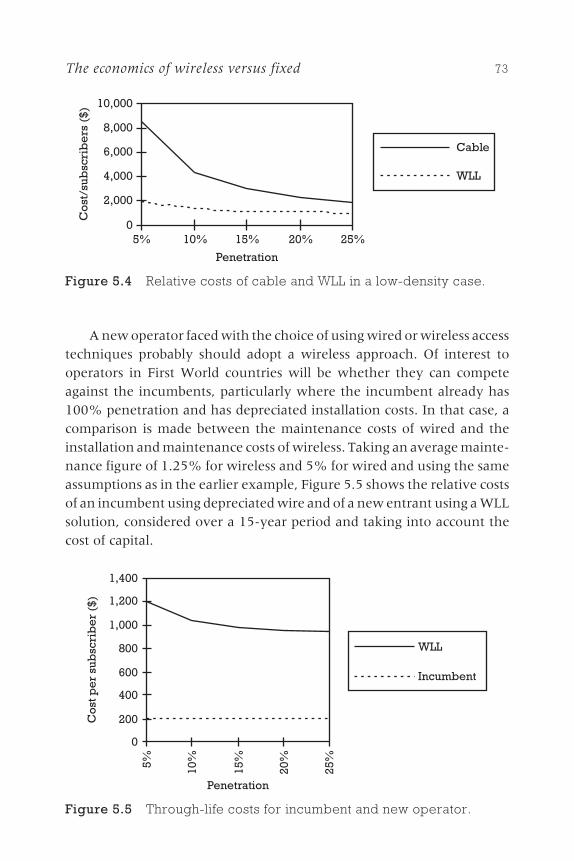
A new operator faced with the choice of using wired or wireless accesstechniques probably should adopt a wireless approach. Of interest tooperators in First World countries will be whether they can competeagainst the incumbents, particularly where the incumbent already has100% penetration and has depreciated installation costs. In that case, acomparison is made between the maintenance costs of wired and theinstallation and maintenance costs of wireless. Taking an average mainte-nance figure of 1.25% for wireless and 5% for wired and using the sameassumptions as in the earlier example, Figure 5.5 shows the relative costsof an incumbent using depreciated wire and of a new entrant using a WLLsolution, considered over a 15-year period and taking into account thecost of capital.
The economics of wireless versus fixed 73C
ost
/sub
scri
be
rs($
) 10,000
8,000
6,000
4,000
2,000
05% 10% 15% 20% 25%
Penetration
Cable
WLL
Figure 5.4 Relative costs of cable and WLL in a low-density case.
0
200
400
600
800
1,000
1,200
1,400
5% 10%
15%
20%
25%
WLL
Incumbent
Penetration
Co
stp
er
sub
scri
be
r($
)
Figure 5.5 Through-life costs for incumbent and new operator.
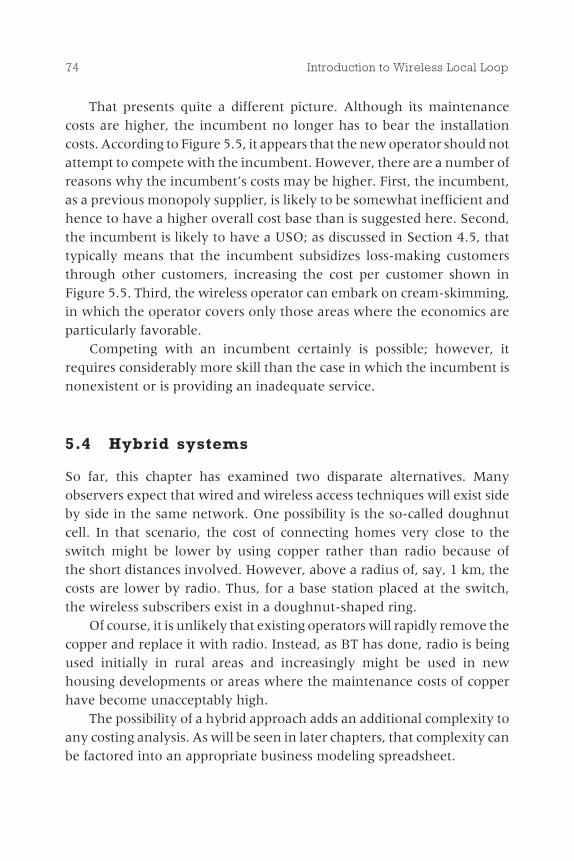
That presents quite a different picture. Although its maintenancecosts are higher, the incumbent no longer has to bear the installationcosts. According to Figure 5.5, it appears that the new operator should notattempt to compete with the incumbent. However, there are a number ofreasons why the incumbent�s costs may be higher. First, the incumbent,as a previous monopoly supplier, is likely to be somewhat inefficient andhence to have a higher overall cost base than is suggested here. Second,the incumbent is likely to have a USO; as discussed in Section 4.5, thattypically means that the incumbent subsidizes loss-making customersthrough other customers, increasing the cost per customer shown inFigure 5.5. Third, the wireless operator can embark on cream-skimming,in which the operator covers only those areas where the economics areparticularly favorable.
Competing with an incumbent certainly is possible; however, itrequires considerably more skill than the case in which the incumbent isnonexistent or is providing an inadequate service.
5.4 Hybrid systems
So far, this chapter has examined two disparate alternatives. Manyobservers expect that wired and wireless access techniques will exist sideby side in the same network. One possibility is the so-called doughnutcell. In that scenario, the cost of connecting homes very close to theswitch might be lower by using copper rather than radio because ofthe short distances involved. However, above a radius of, say, 1 km, thecosts are lower by radio. Thus, for a base station placed at the switch,the wireless subscribers exist in a doughnut-shaped ring.
Of course, it is unlikely that existing operators will rapidly remove thecopper and replace it with radio. Instead, as BT has done, radio is beingused initially in rural areas and increasingly might be used in newhousing developments or areas where the maintenance costs of copperhave become unacceptably high.
The possibility of a hybrid approach adds an additional complexity toany costing analysis. As will be seen in later chapters, that complexity canbe factored into an appropriate business modeling spreadsheet.
74 Introduction to Wireless Local Loop
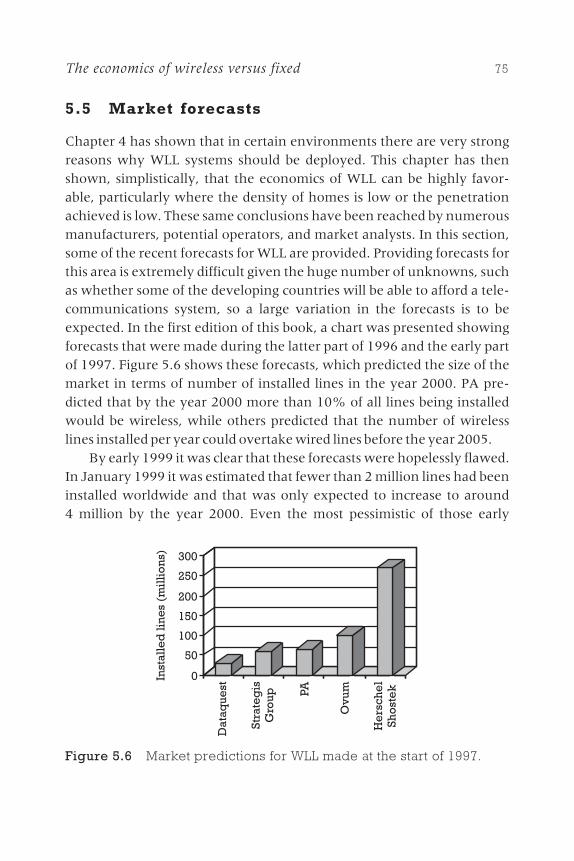
5.5 Market forecasts
Chapter 4 has shown that in certain environments there are very strongreasons why WLL systems should be deployed. This chapter has thenshown, simplistically, that the economics of WLL can be highly favor-able, particularly where the density of homes is low or the penetrationachieved is low. These same conclusions have been reached by numerousmanufacturers, potential operators, and market analysts. In this section,some of the recent forecasts for WLL are provided. Providing forecasts forthis area is extremely difficult given the huge number of unknowns, suchas whether some of the developing countries will be able to afford a tele-communications system, so a large variation in the forecasts is to beexpected. In the first edition of this book, a chart was presented showingforecasts that were made during the latter part of 1996 and the early partof 1997. Figure 5.6 shows these forecasts, which predicted the size of themarket in terms of number of installed lines in the year 2000. PA pre-dicted that by the year 2000 more than 10% of all lines being installedwould be wireless, while others predicted that the number of wirelesslines installed per year could overtake wired lines before the year 2005.
By early 1999 it was clear that these forecasts were hopelessly flawed.In January 1999 it was estimated that fewer than 2 million lines had beeninstalled worldwide and that was only expected to increase to around4 million by the year 2000. Even the most pessimistic of those early
The economics of wireless versus fixed 75
0
50
100
150
200
250
300
Inst
alle
dli
ne
s(m
illi
on
s)
Dat
aque
st
Stra
teg
isG
roup PA
Ovu
m
He
rsch
el
Sho
ste
k
Figure 5.6 Market predictions for WLL made at the start of 1997.

predictions looks as if it will be an order of magnitude too high. Thereasons for these errors are discussed in detail in Chapter 6, but they doraise an issue as to whether any subsequent WLL predictions should berelied on. Predicting is always difficult, but given the body of knowledgethat has now been accumulated about WLL, it seems likely that futurepredictions will be more accurate than previous ones.
During 1998 two key analysts, Ovum and the Strategis Group,released revised estimates for WLL sales, as shown in Figures 5.7 through5.10. These predictions show almost exact agreement of a total installedbase of around 18 million by 2002�a dramatic reduction in their previ-ous estimates of 60 million by the year 2000. Asia-Pacific and LatinAmerica dominate the deployments, suggesting that most WLL lines willbe deployed as a means to connect subscribers who currently do not havea telephone line. Interestingly, Strategis predicts that only 21% of sales
76 Introduction to Wireless Local Loop
Strategis WLL predictions
0
10
20
30
40
50
97 98 99 00 01 02 03 04 05Year
Inst
alle
dli
ne
s(m
illi
on
s)
Figure 5.7 Predictions for total installed lines. (Source: StrategisGroup.)
33%
24%18%
14%9%
1%
1%Asia-Pacific
Latin America
Eastern Europe
Western Europe
Africa
North America
Middle East
Figure 5.8 Predictions for geographical distribution of lines.(Source: Strategis Group.)
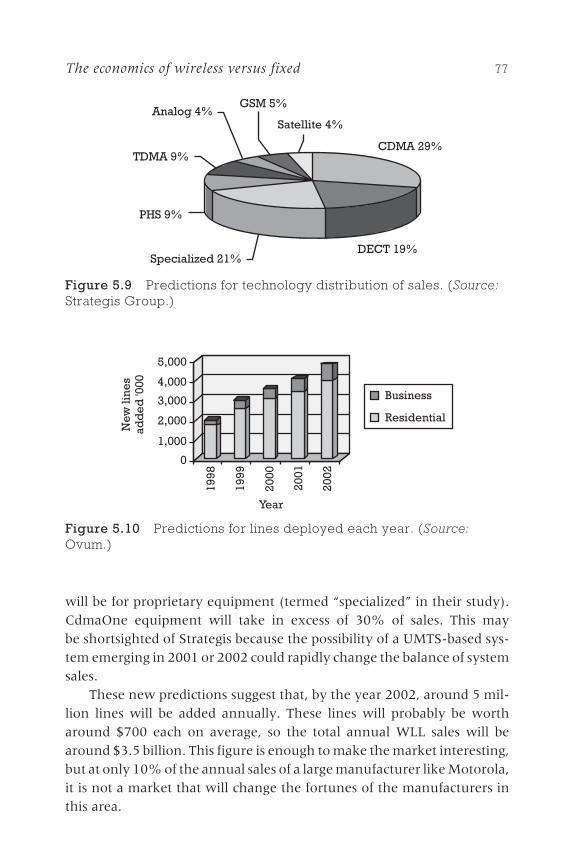
will be for proprietary equipment (termed �specialized� in their study).CdmaOne equipment will take in excess of 30% of sales. This maybe shortsighted of Strategis because the possibility of a UMTS-based sys-tem emerging in 2001 or 2002 could rapidly change the balance of systemsales.
These new predictions suggest that, by the year 2002, around 5 mil-lion lines will be added annually. These lines will probably be wortharound $700 each on average, so the total annual WLL sales will bearound $3.5 billion. This figure is enough to make the market interesting,but at only 10% of the annual sales of a large manufacturer like Motorola,it is not a market that will change the fortunes of the manufacturers inthis area.
The economics of wireless versus fixed 77
CDMA 29%
DECT 19%Specialized 21%
PHS 9%
GSM 5%
TDMA 9%
Satellite 4%Analog 4%
Figure 5.9 Predictions for technology distribution of sales. (Source:Strategis Group.)
0
1,000
2,000
3,000
4,000
5,000
New
lin
es
add
ed
'000
Business
Residential
1998
1999
2000
2001
2002
Year
Figure 5.10 Predictions for lines deployed each year. (Source:Ovum.)
5.5.1 Forecasting methodology
The art of forecasting is a complex one. This section provides an overviewof the manner in which companies like Ovum and Strategis have devel-oped the forecasts provided above.
In determining total demand, analysts typically concentrate on alimited number of key factors. For example, in their recent analysis,Strategis Group considered the following factors:
◗ Teledensity relative to income levels;
◗ Size of waiting lists for telephone lines;
◗ Government plans for teledensity targets;
◗ Potential for multiple lines per household;
◗ Regulatory environment.
For each of these areas, the impact on demand was assessed. For example,when plotting GDP against teledensity it becomes clear that in general,below a GDP per household of $8,000, teledensity tends to remain below20%. However, once GDP falls in the range of $10,000 to $15,000 perhousehold, penetration tends to grow rapidly to around 50%. Hence, byexamining each country, it is possible to estimate whether dramaticgrowth in the number of telephone lines is likely in the next few years.
The use of teledensity relative to income levels works well for fore-casting in developing countries, but once teledensities have exceeded50%, there is little further information that GDP can provide. In thesecountries, issues like the potential for more lines per household and theregulatory environment become increasingly important.
Once the total expected number of telephone lines has been deter-mined, it is necessary to predict the fraction of these that will be wireless.This is where aspects such as the regulatory and competitive environmentbecome important as new operators are more inclined to use WLLthan incumbent operators. Spectrum allocation is also another importantfactor since WLL cannot be deployed without a suitable assignment ofspectrum. By asking these questions for each of the major countries andnormalizing the results against known data, a forecast for the world canbe painstakingly constructed.
78 Introduction to Wireless Local Loop

Reference
[1] Calhoun, C., Wireless Access and the Local Telephone Network, Norwood, MA:Artech House, 1992.
The economics of wireless versus fixed 79
Wireless local loopmarkets
6.1 Introduction
As discussed at the end of the last chapter,during 1995 and 1996, analysts were verybullish about the progress that WLL wasgoing to make. Some predicted almost200 million lines would be installed by theyear 2000. As a result, a number of manufac-turers invested heavily in product develop-ment and manufacturing plants inpreparation for this large market. However,in 1999 it was clear that all the analysts gottheir predictions badly wrong. At the start of1999, Ovum estimated that fewer than 2 mil-lion lines had been installed around the worldand that this would only increase slowly dur-ing the next 2 years. One of the leading U.K.operators, Ionica, went into receivership andNortel shut down one of its key WLL facto-ries, which made its flagship �Proximity I�product, in Devon, United Kingdom. Thischapter looks at what went wrong and itsimplications for the long-term developmentof WLL.
81
Contents
6.1 Introduction
6.2 What went wrong?
6.3 How the marketwill change in thefuture
6C H A P T E R
6.2 What went wrong?
The analysts themselves have been forced to go back and look at theiroriginal forecasts in order to assess why they were so optimistic. In arecent paper Ovum suggests the following reasons for slower thanexpected sales of WLL equipment:
◗ Equipment prices need to fall to around the $500 per line level indeveloping markets, and the $1,000 per line level in developedmarkets.
◗ Financing needs to be in place.
◗ Operators are waiting for broadband technologies.
◗ Regulatory environments need to be favorable.
A number of other reasons have also been mentioned by analysts:
◗ Some of the largest potential markets, including Indonesia, Malaysia,and Russia, were so severely affected by the �Asian Flu� currencycrisis that swept the world during 1998 that equipment sold in U.S.dollars (which most WLL equipment is) has become temporarilyunaffordable.
◗ The rapid rise of the Internet has forced many to reappraise the typeof WLL system that they would want to buy.
◗ Despite apparently having a product for sale, most WLL systemscould not support plain-paper fax or data above 4.8 Kbps until nearthe end of 1998, and most operators were not prepared to install asystem that could not support fax.
It is worth examining each of these points in a little more detail. The pointabout pricing is straightforward enough. The difficulty is that equipmentpricing needs volume sales in order to fall�large-scale economies are notachieved until production surpasses the one million mark. However, witha fragmented and slow-moving market these economies are hard toachieve. The result is a vicious circle of falling sales because prices are toohigh and high prices because sales are too low. Perhaps the best wayout of this quandary is to utilize components from cellular or cordlesstechnologies where economies of scale have already been achieved.
82 Introduction to Wireless Local Loop
Financing has always been an issue for telecommunications projectsbut is particularly problematic for WLL. Most of the existing WLL projectsare in countries where the teledensity is very low, which typically meansthat the GDP is low and that the access to foreign capital is limited. As aresult, foreign financing, often from the vendor of the equipment,becomes essential. However, in countries such as the Ukraine, wherethere are a number of potential WLL opportunities, the risk of currencydevaluation, default on loans, or a change in regulatory environment isvery high. As a result, the risk of lending money is excessively high. Inother countries, civil unrest can lead to major problems�at the end of1998 some WLL engineers were tragically killed in Eastern Europe afterbeing taken hostage. This will always be a problem for WLL but one thatmight ease as WLL becomes more widely deployed and the risks becomebetter understood.
The point about broadband technologies is a key one. As discussed inChapter 14, many emerging technologies promise data rates of 2 Mbps orabove coupled to packet-based infrastructures that will provide great effi-ciencies when using Internet and e-mail services. Operators are left withthe choice of deploying a narrowband system today, but running the riskthat it will be outdated in just a few years, or waiting until broadbandsystems are available and making a choice at that point. Since manypotential operators are PTOs, who are generally cautious when makinginvestment decisions, most resolve this predicament by simply waiting.The result is that the potential of broadband technologies has stalled theWLL market, even if these technologies will only be suitable for a subsetof deployments, as is discussed in more detail in Chapter 14.
Regulatory environments are discussed in more detail in Chapter 17.Basically, many markets have not been liberalized, do not have spectrumavailable, and do not have a regulator who can ensure that competitionin areas such as interconnect agreements is fair. The net result is thatpotential new operators have not been able to enter the market.
At this point it is worth asking briefly what went wrong with Ionica.Even a year after its demise much remains unclear about exactly why itfailed. At conferences, a number of reasons have been suggested:
◗ Some software enhancements required by the base stations toincrease capacity were late arriving, with the result that customershad to be turned away.
Wireless local loop markets 83
◗ Because the bank lending criteria centered around the number ofcustomers signed up, this slowdown resulted in Ionica not meetingthe bank�s requirements.
◗ This resulted in uncertainty about Ionica, leading to a fall in theshare price, which further alarmed the financial institutions.
◗ This lead to a downward spiral from which it proved impossible torecover.
◗ In addition, BT proved a substantial competitor, cutting prices andadding features in order to make it progressively more difficult forIonica to compete.
Others have noted that Ionica took the approach that to be successfulthey needed to roll out quickly and with substantial publicity. As a result,their expenditure in the first year of operation was extremely high. OtherWLL operators tended to move more cautiously, covering a small areainitially and waiting until this area was generating revenue beforemoving on to the next area.
The author does not have any inside knowledge on what went wrongin the case of Ionica. Perhaps the biggest problem appears to be the factthat the market changed significantly from the point in time when theoperator was conceived to the point in time when service was rolled out,but neither the operator nor the investors appeared to realize this. By thetime Ionica was rolling out service, a high-speed Internet type of accesswas looking more desirable than a POTS-equivalent service. Having saidthat, many of Ionica�s subscribers were sad to lose service, and some offeredto pay bills in advance if that would help Ionica. It didn�t, and during 1998BT offered all the Ionica customers a free passage back to their network.Ionica has now been closed down and the equipment disposed of.
Within all of these reasons are many points from which operatorscould learn in the future. However, no issues fundamental to WLL havebeen suggested and it would appear that, although unfortunate, the demiseof Ionica is not necessarily an indication that other WLL operators will fail.
6.3 How the market will change in the future
Section 5.5 showed the latest analysts� forecasts. Although these are notpredicting the sales of 20 million lines per year that were predicted in
84 Introduction to Wireless Local Loop

1996, they still show a reasonable level of sales of around 5 to 10 millionlines a year by 2001 onward. It is worth asking whether these predictionsare reasonable in the light of the poor performance to date. This sectionlooks at how each of the problems outlined above is being tackled by themanufacturers and governments around the world.
Pricing information is often closely guarded by manufacturers. How-ever, a number of operators have recently revealed that they paid $500 aline or less for WLL equipment during 1998. In all cases this wascdmaOne-based WLL equipment from the key manufacturers, particu-larly Motorola. This sort of information needs to be treated carefullybecause, as Section 5.3 shows, the cost is highly dependent on the densityof population and the traffic requirements of each user. A 50% increase inusage could easily result in a 50% increase in cost per line. However, whatis clear is that prices have fallen steadily during the last few years andthat for basic WLL systems, the key pricing points can be met. Once thecurrency problems in developing countries have eased, cost should not bea major obstacle to deployment.
Financing remains a difficult area. In the aftermath of the failure ofIonica, bankers are very unwilling to lend to WLL projects, leaving all thefinancing to the manufacturers. These are already suffering reducedcredit ratings as a result of their exposure to high-risk loans around theworld. Particularly during the next 2 years, while the world is stillexposed to currency crises, financing is likely to remain a major obstacleto deployment.
Broadband technologies, and indeed the wide range of WLL tech-nologies, as discussed in more detail in Part IV, remain a problem. As therange of alternatives increases, it is getting more, not less, confusing toselect the most appropriate WLL technology. Such confusion tends toslow down decisions, sometimes to the point where they are never actu-ally made. What is required is a technology that can be both a narrowbandand a broadband system, with low costs for the former and higher costs forthe latter, with the potential for both types of user on the same sector. Thiswould overcome all the concerns about obsolescence and provide opera-tors with the flexibility that they need. Such a technology is described inChapter 14. There are many indications that manufacturers around theworld are working on such a technology for availability in 2000/2001. Theexpectation of this product is likely to stall sales before then, but oncethe product is available it is likely to overcome the �broadband problem.�
Wireless local loop markets 85
A last point is that regulatory environments are slowly improvingaround the world. As WLL starts to gather momentum there will beincreasing pressure on other countries to liberalize their markets. Againthis will take time.
So the picture is mixed. Although price may now be less of a problem,financing, the promise of broadband, and regulatory issues all remainstumbling blocks. These were starting to be resolved during 1999 and2000, with the result that WLL sales were slow during this period but willpick up after 2001, at which point there will be sufficient pent-up demandto ensure that sales rise quickly, thus meeting the expectations of theanalysts.
As a final verdict, it is worth saying that the slower than expectedtake-up has been a major blow to many in the industry. However, thereasons for failure, although severe, are not insoluble, and matters willimprove in the future. WLL may not be the rising star that it once was, butit is still likely to prove a profitable area for those who produce the righttechnology or deploy the right sort of network.
Having shown in Part II of this book why WLL is of interest, theremainder of the book concentrates on explaining WLL systems them-selves in considerably more detail. Part III provides some technicalbackground that will be useful for those wishing to understand moreabout the different technologies. For those not of a technical bent, Part IIIcan be skipped.
86 Introduction to Wireless Local Loop


Technicalinformation aboutwireless
Parts I and II introduced the general tele-communications scene and the potential
role of WLL in that scene. The remainder ofthis book focuses on describing WLL systemsin more detail.
WLL systems are radio systems, and tounderstand them fully it is necessary to knowsomething about radio. This part of the bookprovides some relevant background on tech-nical matters associated with radio propaga-tion, radio systems, and radio access methods.Propagation is critical in reaching the sub-scriber reliably. Radio system design is criticalin ensuring optimum performance for mini-mum cost, while the access method formsone of the key distinguishing factors betweenthe different technologies. For that reason,it is useful to understand radio systems indetail.
Numerous books describe these technicalsubjects in great detail. This text provides
IIIP A R T

detail sufficient only to understand the implications for WLL. For thosewishing more detail, a particularly good reference that fits well with thetopics presented here is Wireless Information Networks, by K. Pahlavan andA. Levesque (New York: Wiley & Sons, 1995).
88 Introduction to Wireless Local Loop
Radio propagation
7.1 Introduction
Radio propagation plays a key role in WLLsystems. It is the means whereby signals aretransmitted from both the transmitter and thesubscriber unit. The propagation that can beachieved limits the range of the base station,requiring more cell sites than might other-wise be required. Propagation phenomenamean that some subscribers in a cell areunable to obtain a satisfactory signal. Prop-agation causes some frequencies to bemore desirable than others. Understandingpropagation is key to understanding WLLtechnology.
Much work on propagation has been per-formed by those involved in cellular radio.Cellular propagation is complicated by themovement of the mobile, possibly into build-ings and areas shadowed from the radiosignal. WLL propagation is substantially lesscomplicated than that. However, some ofthe phenomena that cause such difficulty tomobile radio propagation have an impact onWLL systems and are discussed in this section.
89
Contents
7.1 Introduction
7.2 The line-of-sightchannel
7.3 Time variation inchannels
7.4 Widebandchannels
7.5 Frequencies forWLL
7.6 Predicting WLLcoverage
7C H A P T E R
Before examining WLL in more detail, it is worth reviewing brieflythe mobile radio propagation environment and the phenomena thataffect it. Mobile radio planners consider that the path loss experiencedwhen a signal is transmitted through the channel is composed of threedistinct phenomena:
1. Distance-related attenuation;
2. Slow fading;
3. Fast fading.
7.1.1 Distance-related attenuation
Distance-related attenuation simply expresses the fact that as the distancefrom the base station increases the signal strength decreases. That isentirely consistent with everyday experience: The farther one movesfrom someone who is talking, the weaker the signal. The drop in signalstrength is caused by the fact that the signal spreads out from the sourceon the surface of a sphere. The area of the surface is proportional to theradius squared; hence, the signal strength is proportional to 1/d2, where dis the distance from the transmitter.
Measurements of mobile radio channels have found that in practice,the signal strength decreases more quickly than 1/d2. Typical values oftenused in predicting mobile radio propagation are 1/d3.5 or 1/d4, dependingon the model used. The reasons for that more rapid reduction in signal arethe following:
1. The presence of the ground interferes with the expansion of aspherical surface, resulting in only a hemisphere. The conductiv-ity and reflectivity of the ground then determine to what extentpropagation is affected.
2. Signals are attenuated by vegetation and buildings, and the lossassociated with passing through or around those things tends toincrease the propagation exponent.
In the case of WLL, most of the propagation is via direct line-of-sight(LOS), as explained in Section 6.2. In this case, the second of the tworeasons for the exponent deviating from 2 no longer applies, and the first
90 Introduction to Wireless Local Loop
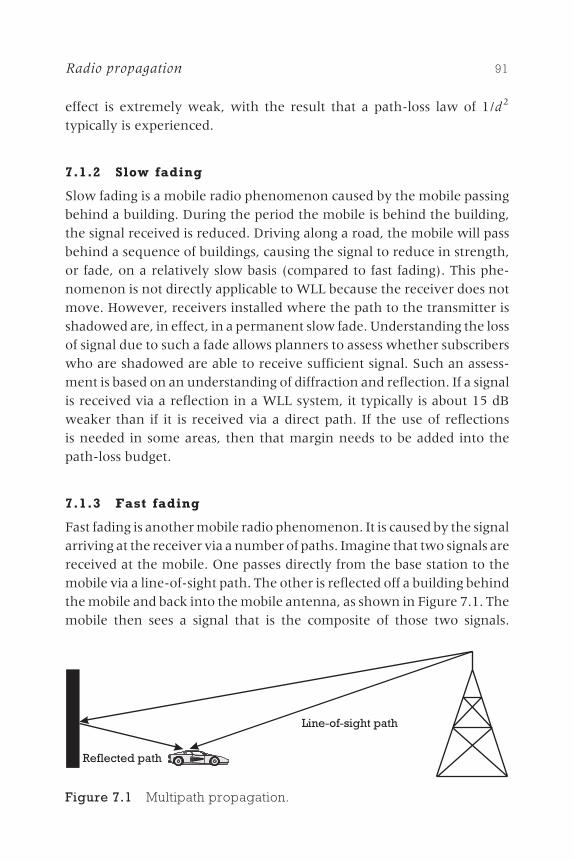
effect is extremely weak, with the result that a path-loss law of 1/d2
typically is experienced.
7.1.2 Slow fading
Slow fading is a mobile radio phenomenon caused by the mobile passingbehind a building. During the period the mobile is behind the building,the signal received is reduced. Driving along a road, the mobile will passbehind a sequence of buildings, causing the signal to reduce in strength,or fade, on a relatively slow basis (compared to fast fading). This phe-nomenon is not directly applicable to WLL because the receiver does notmove. However, receivers installed where the path to the transmitter isshadowed are, in effect, in a permanent slow fade. Understanding the lossof signal due to such a fade allows planners to assess whether subscriberswho are shadowed are able to receive sufficient signal. Such an assess-ment is based on an understanding of diffraction and reflection. If a signalis received via a reflection in a WLL system, it typically is about 15 dBweaker than if it is received via a direct path. If the use of reflectionsis needed in some areas, then that margin needs to be added into thepath-loss budget.
7.1.3 Fast fading
Fast fading is another mobile radio phenomenon. It is caused by the signalarriving at the receiver via a number of paths. Imagine that two signals arereceived at the mobile. One passes directly from the base station to themobile via a line-of-sight path. The other is reflected off a building behindthe mobile and back into the mobile antenna, as shown in Figure 7.1. Themobile then sees a signal that is the composite of those two signals.
Radio propagation 91
Line-of-sight path
Reflected path
Figure 7.1 Multipath propagation.

The reflected signal has traveled a slightly longer path than the directsignal and thus is delayed slightly compared to the direct signal. The resultof that delay is that the phase of the reflected signal differs from that of thetransmitted signal. The phase difference is related to the difference indistance multiplied by the speed of light (giving the delay on the signal)multiplied by the frequency of transmission.
Fast fading can be better understood by an example. Suppose thereflected signal travels an additional 10m before arriving at the mobile.Light travels at 3 × 10⁸ m/s, so the additional distance causes a delay ofaround 30 ps (30 × 10−9 sec). If the frequency of transmission is 3 GHz, onecycle of the carrier wave at that frequency takes 0.3 ps. Thus, the reflectedwave is delayed by 100 cycles of the carrier wave exactly. Every additional10-cm distance, in fact, delays the reflected wave by a further cycle of thecarrier wave.
When the reflected wave is delayed by an exact multiple of a cycle ofthe carrier wave, the two received signals are said to be in phase. The twosignals sum, such that the total received signal has twice the strength ofthe direct signal. When the reflected wave is delayed by an exact multipleplus exactly a further half-cycle, the two signals are said to be in antiphaseand cancel each other exactly. That is to say, at a certain point, the mobileloses all received signal. By moving a distance of only half a wavelengththen, some 5 cm, the mobile moves from a position where the signalstrength is doubled to one where there is no received signal. Thatphenomenon repeats continuously as the mobile moves, so the signalfades rapidly, giving the effect its name.
Of course, in real life, there are many more than just a single reflectedsignal path, and the reflected signals are not all equal in strength, so theprospect of an exact cancellation is somewhat reduced. Nevertheless, fad-ing is a severe problem. Figure 7.2 shows a typical fading waveform, oftentermed Rayleigh fading, after the mathematician who developed the sta-tistics that can be used to describe such a waveform. It can be seen that in aperiod of 1 sec a number of fades, some as deep as 40 dB, are experienced.This book is not the place to discuss the mathematics of Rayleigh fading;those interested in learning more can consult almost any book thatdiscusses mobile radio propagation, for example, [1].
A further difficulty may be caused by fast fading. Imagine that insteadof the reflection coming from a nearby building, it comes from some far-away mountain. The delay of the reflected signal may now be quite large.
92 Introduction to Wireless Local Loop
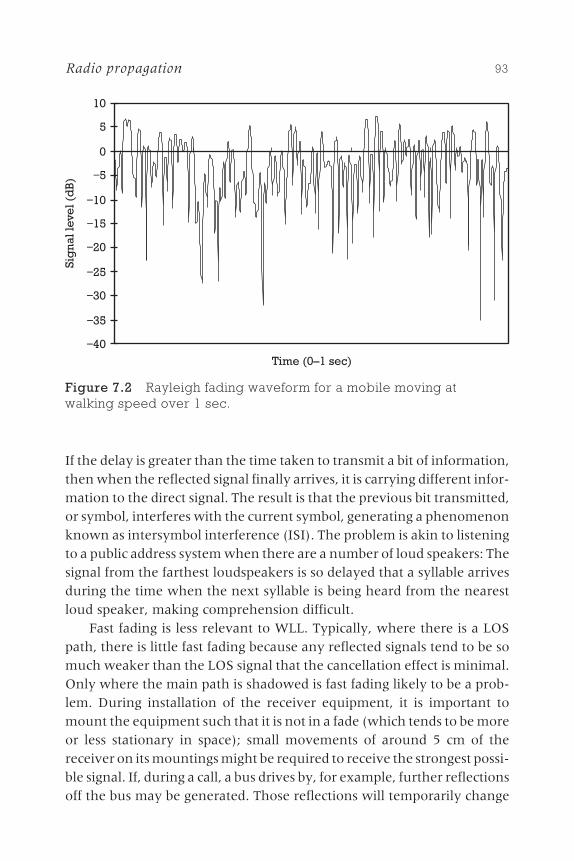
If the delay is greater than the time taken to transmit a bit of information,then when the reflected signal finally arrives, it is carrying different infor-mation to the direct signal. The result is that the previous bit transmitted,or symbol, interferes with the current symbol, generating a phenomenonknown as intersymbol interference (ISI). The problem is akin to listeningto a public address system when there are a number of loud speakers: Thesignal from the farthest loudspeakers is so delayed that a syllable arrivesduring the time when the next syllable is being heard from the nearestloud speaker, making comprehension difficult.
Fast fading is less relevant to WLL. Typically, where there is a LOSpath, there is little fast fading because any reflected signals tend to be somuch weaker than the LOS signal that the cancellation effect is minimal.Only where the main path is shadowed is fast fading likely to be a prob-lem. During installation of the receiver equipment, it is important tomount the equipment such that it is not in a fade (which tends to be moreor less stationary in space); small movements of around 5 cm of thereceiver on its mountings might be required to receive the strongest possi-ble signal. If, during a call, a bus drives by, for example, further reflectionsoff the bus may be generated. Those reflections will temporarily change
Radio propagation 93Si
gn
alle
vel(
dB
)
10
5
0
−5
−10
−15
−20
−25
−30
−35
−40Time (0�1 sec)
Figure 7.2 Rayleigh fading waveform for a mobile moving atwalking speed over 1 sec.
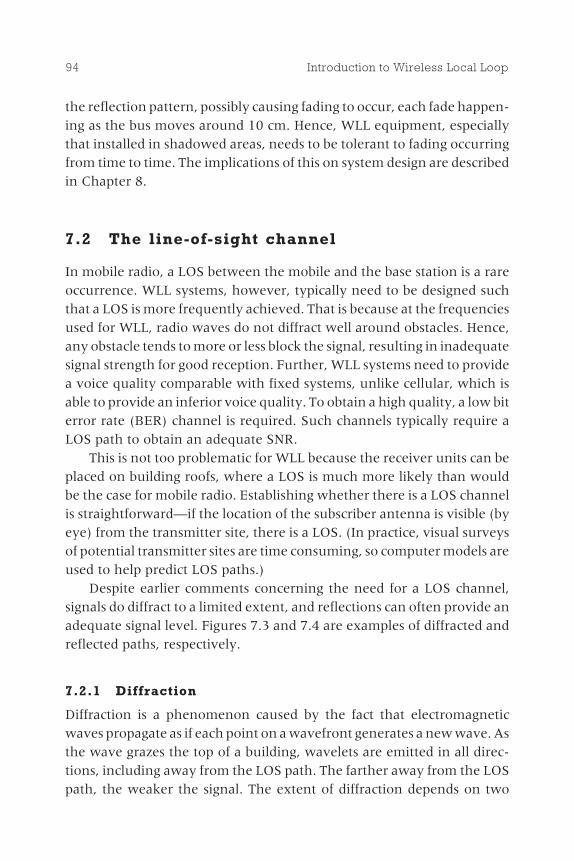
the reflection pattern, possibly causing fading to occur, each fade happen-ing as the bus moves around 10 cm. Hence, WLL equipment, especiallythat installed in shadowed areas, needs to be tolerant to fading occurringfrom time to time. The implications of this on system design are describedin Chapter 8.
7.2 The line-of-sight channel
In mobile radio, a LOS between the mobile and the base station is a rareoccurrence. WLL systems, however, typically need to be designed suchthat a LOS is more frequently achieved. That is because at the frequenciesused for WLL, radio waves do not diffract well around obstacles. Hence,any obstacle tends to more or less block the signal, resulting in inadequatesignal strength for good reception. Further, WLL systems need to providea voice quality comparable with fixed systems, unlike cellular, which isable to provide an inferior voice quality. To obtain a high quality, a low biterror rate (BER) channel is required. Such channels typically require aLOS path to obtain an adequate SNR.
This is not too problematic for WLL because the receiver units can beplaced on building roofs, where a LOS is much more likely than wouldbe the case for mobile radio. Establishing whether there is a LOS channelis straightforward�if the location of the subscriber antenna is visible (byeye) from the transmitter site, there is a LOS. (In practice, visual surveysof potential transmitter sites are time consuming, so computer models areused to help predict LOS paths.)
Despite earlier comments concerning the need for a LOS channel,signals do diffract to a limited extent, and reflections can often provide anadequate signal level. Figures 7.3 and 7.4 are examples of diffracted andreflected paths, respectively.
7.2.1 Diffraction
Diffraction is a phenomenon caused by the fact that electromagneticwaves propagate as if each point on a wavefront generates a new wave. Asthe wave grazes the top of a building, wavelets are emitted in all direc-tions, including away from the LOS path. The farther away from the LOSpath, the weaker the signal. The extent of diffraction depends on two
94 Introduction to Wireless Local Loop
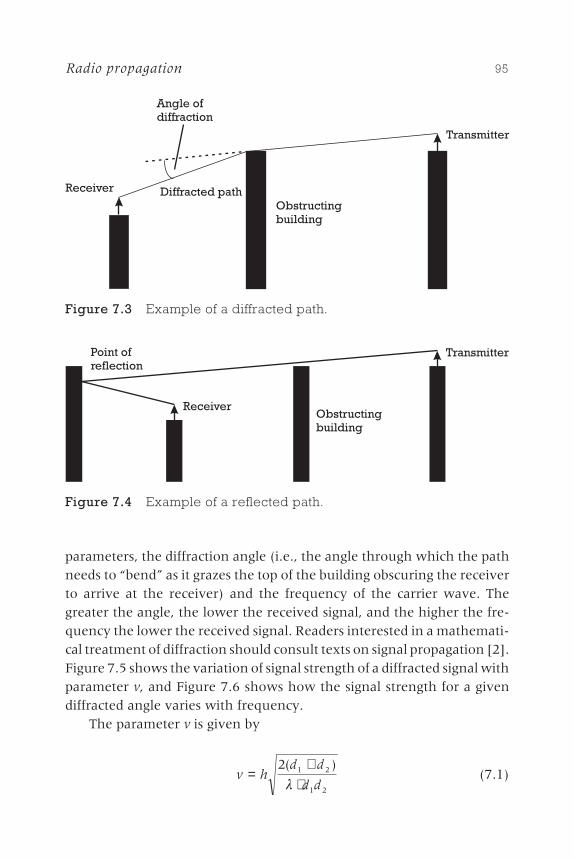
parameters, the diffraction angle (i.e., the angle through which the pathneeds to �bend� as it grazes the top of the building obscuring the receiverto arrive at the receiver) and the frequency of the carrier wave. Thegreater the angle, the lower the received signal, and the higher the fre-quency the lower the received signal. Readers interested in a mathemati-cal treatment of diffraction should consult texts on signal propagation [2].Figure 7.5 shows the variation of signal strength of a diffracted signal withparameter v, and Figure 7.6 shows how the signal strength for a givendiffracted angle varies with frequency.
The parameter v is given by
v hd d
d d=
+⋅
2 1 2
1 2
( )
l(7.1)
Radio propagation 95
Transmitter
Obstructingbuilding
Diffracted path
Angle ofdiffraction
Receiver
Figure 7.3 Example of a diffracted path.
Transmitter
Obstructingbuilding
Receiver
Point ofreflection
Figure 7.4 Example of a reflected path.
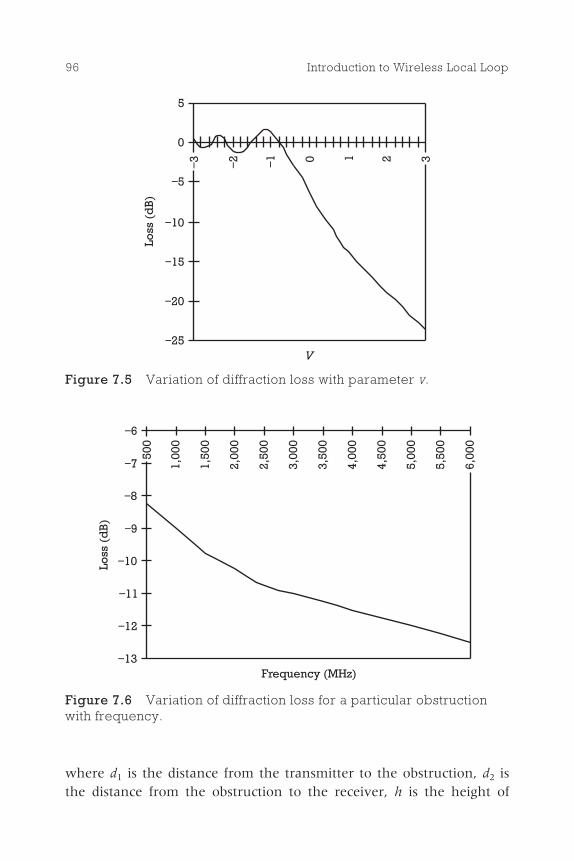
where d1 is the distance from the transmitter to the obstruction, d2 isthe distance from the obstruction to the receiver, h is the height of
96 Introduction to Wireless Local Loop
5
0
0
−5
−10
−15
−20
−25
Loss
(dB
)
V
−3 −2 −1 1 2 3
Figure 7.5 Variation of diffraction loss with parameter v.
Loss
(dB
)
Frequency (MHz)
−6
−8
−9
−10
−11
−12
−13
−7
500
1,00
0
1,50
0
2,00
0
2,50
0
3,00
0
3,50
0
4,00
0
4,50
0
5,00
0
5,50
0
6,00
0
Figure 7.6 Variation of diffraction loss for a particular obstructionwith frequency.
the obstruction, and l is the wavelength of the transmitted frequency. Asa guide, for a possible WLL deployment with d1 = d2 = 500m, at 900 MHzthe parameter v = 0.16h, whereas at 3 GHz, v = 0.28h. Using Figure 7.5, ifh = 0 (i.e., the LOS path grazes the top of a building), the diffraction losswill be around 6 dB, while if the height is 5m (corresponding to an angleof 1.14 degrees), the loss will be 12.5 dB at 900 MHz and 16 dB at 3 GHz.Thus, diffraction angles greater than 1 degree are likely to result in insuffi-cient signal strength at the frequencies of interest. As Figure 7.6 shows,the loss is frequency dependent, but because the loss already is severe, thefrequency variation is unlikely to be the overriding issue.
7.2.2 Reflection
Reflection is caused when a wave strikes an object and is reflected backfrom it. It is, of course, the phenomenon by which we see the worldaround us. Different materials reflect to a different extent, the amount ofabsorption by the material being a key parameter in determining whethera sufficient signal strength will be achieved. In practice, concrete and glassbuildings provide quite good reflections. Like light, the receiver needs tobe in just the right place to see a reflected image of the transmitter (com-pare that with needing to be in the right place to see yourself in a mirror).Many building surfaces, however, are �rough,� so the reflection is scat-tered on hitting the building. That makes the zone where the reflectionscan be received larger but the signal strength received weaker.
The key difficulty for WLL, with its directional antennas at thesubscriber equipment, is finding the reflections. An installer that is unableto obtain adequate signal strength when pointing the antenna toward thebase station may need to turn the antenna through up to 360 degreesin an attempt to find suitable reflected paths. In many cases those willnot exist.
Slightly more complexity is associated with the LOS path than hasbeen explained so far. Readers may have been perplexed to notice thateven when the diffraction angle is 0 degrees (i.e., the LOS path grazed anobstruction), there still is a significant loss. That is caused by a phenome-non known as the Fresnel effect. According to Huygens-Fresnel theory,the electromagnetic field at a receiver is due to the summation of thefields caused by reradiation from some small incremental areas overa closed surface about a point source at the transmitter. The field at a
Radio propagation 97
constant distance from the transmitter, that is, on a spherical surface, hasthe same phase over the entire surface. That surface is called a wavefront. Ifthe distances from the wavefront to the receiver are considered, thecontributions to the field at the receiver are seen to be made up of compo-nents that add vectorially in accordance with their relative phase dif-ference. Any object blocking part of the wavefront affects the signalreceived.
It is possible to draw ellipsoids from the transmitter to the receiver,where the distances from the transmitter and from the receiver differby multiples of a half wavelength. Each of those ellipsoids is known as aFresnel zone. Broadly, if there is any obstruction in the first half of the firstFresnel zone, there is a significant reduction in signal strength. The radiusof the first Fresnel zone can be approximated by
Rd d
d d=
⋅+
l 1 2
1 2(7.2)
where the terms are as defined in Section 7.2.1. To avoid any loss of signalthrough interference with the first Fresnel zone, the closest obstruction to a1-km path must come no closer than 4.3m to the LOS path for a 1-GHz link.Readers who want to know more about Fresnel effects are referred to [3].
Using LOS, diffraction, and reflection, subscriber units can beinstalled in such a manner that they receive sufficient signal strength.
7.3 Time variation in channels
Unfortunately, once installed, the signal will not remain static. Three keyeffects will result in the signal received varying over time:
1. Fast fading;
2. New obstructions;
3. Rainfall.
7.3.1 Fast fading
Fast fading was explained in Section 7.2. If there is not a LOS path, orthere are particularly strong reflections, then when large objects move in
98 Introduction to Wireless Local Loop
the vicinity of the receiver the fading pattern will change. If the carrierfrequency is 3 GHz, and a bus moves at 50 km/h, then fades will occurevery 10 ms. In the worst case, the signal might decay momentarily tozero during a fade before being restored to full strength. There is little thata planning engineer can do to overcome that problem. Instead, the radioequipment designer must ensure that the equipment is able to correct theerrors occurring from that phenomenon.
7.3.2 New obstructions
New obstructions occasionally arise. The most obvious example is theconstruction of a new building between the transmitter and the receiver,blocking a previous LOS path. Such blocking is often catastrophic in ren-dering the received signal too weak to be of use. Clearly, a radio planneror radio design engineer can do little about that problem. The extent ofthe problem will vary depending on the rate of build in the area. The WLLoperator should be aware of new buildings under construction and modelthe effects to look for possible solutions, such as using reflections, buildingan additional cell or repeater, or aligning the receiver toward the basestation in an adjacent cell.
7.3.3 Rainfall
Rainfall can be a problem. Radio signals are attenuated by moisture in theatmosphere. The level of attenuation varies with the carrier frequency,the quantity of rain falling, and the distance of the transmitter from thereceiver. The variation of attenuation with frequency is particularlystrong and highly nonlinear. At 3 GHz, the highest attenuation is around0.06 dB/km; for a typical WLL path of, say, 6 km, the attenuation is only0.36 dB. However, at 10 GHz, the attenuation could, in extreme cases, be ashigh as 5 dB/km, or up to 30 dB over a typical link. Such a loss of signalalmost certainly would make the link unusable. Above around 5 GHz incountries where heavy rainfall is normal, rain fading is a potential problem.
Broadly speaking, the heavier the rain, the higher the attenuation.Countries that experience extremely heavy rainfall from time to time,such as those with monsoon climates, are most affected by this problem.Rain fade results in an increased attenuation per meter, so the fartheraway the receiver, the greater the problem. Receivers on the edge of cellsare first to suffer during heavy rain.
Radio propagation 99
Where rainfall attenuation is problematic, it must be allowed for inthe link budget. Based on the frequency, the expected distribution of therainfall, and the outage time that can be tolerated (if any), the additionalpath loss that needs to be allowed for can be calculated and the result-ing reduction in propagation range determined. Cells then need to bedesigned taking this into account.
7.4 Wideband channels
As mentioned in Section 7.1.3, reflection can cause ISI. That is problem-atic in mobile radio systems having transmission bandwidths greater thanaround 100 kHz. It is far less a problem with WLL. To understand whetherthe problem might occur, consider the following example:
Assume that the symbol rate is 100 kHz (in a broad sense, that means
the bandwidth of the transmitted signal is around 100 kHz). The carrier
frequency is not a relevant factor in calculating ISI. (The symbol rate,
for the moment, can be assumed to be equal to the bit rate; the situa-
tions where that is not true are discussed in Chapter 8.) If the reflection
is delayed by 1/100 kHz, namely 10 ms, the reflected signal arrives
during the next symbol period causing ISI. In 10 ms, radio signals travel
3 km. Thus, if the reflection occurs from an obstacle 1.5 km past the
receiver, ISI occurs.
As the symbol rate increases, the distance required for ISI to occurreduces proportionally. With a bandwidth of 1 MHz, the distance falls to300m, and at 10 MHz the distance is down to only 30m. Some of the WLLsystems proposed (as discussed in Part IV) have bandwidths in excess of1 MHz; hence, ISI might be expected to be problematic.
Compared to mobile radio, WLL systems, even those with high band-widths, tend to avoid ISI. That is because long reflected paths typicallyresult in signals being reflected from behind the mobile back into themobile. The directional antennas typically used in WLL mean that suchreflected paths are highly attenuated by the radiation pattern of theantenna in the off-axis direction and thus fall below the receiver sensi-tivity threshold.
100 Introduction to Wireless Local Loop

Further, without preempting the discussion on access technologies inthe next two chapters, one particular technology known as code divisionmultiple access (CDMA) is broadly immune to ISI. Many of the WLL tech-nologies proposed with wide bandwidths utilize CDMA technology.
In summary, apart from a few exceptional cases, WLL radio plannersneed not be too concerned with ISI.
7.5 Frequencies for WLL
As has been mentioned, some propagation phenomena depend onthe frequency of transmission. If this were a book on mobile radio, thevariation with transmission frequency would be of little relevancebecause across the world the same frequency bands are used for mobileradio. Unfortunately, that is not the case for WLL. To understand why, itis necessary to know a little more about the background to radio spectrumallocation [4].
Radio spectrum is a scarce resource; as one American analyst noted,�Spectrum is like real estate�they just don�t make it any more.� Numer-ous applications require radio spectrum, including cellular, microwavelinks, satellites, radars, meteorology systems, government radio systems,defense equipment, garage door openers, and microwave ovens. Thelist is almost endless. As a result, new systems need to find parts of thespectrum that are little used and fit in with existing users. Those little usedparts tend to be at higher frequencies, where the propagation achieved ispoor compared to lower frequencies.
More recently, the scarcity of spectrum at different frequency bandshas been demonstrated in high valuations as spectrum has been auc-tioned in countries such as the United States. The value under auction, ofcourse, relates to the demand for spectrum, which in turn relates tothe profit that can be made by the organization that owns the spec-trum. Because users are prepared to pay a premium for mobile phones,spectrum generally is more valuable for mobile radio than WLL. WLLoperators then are forced to use higher frequencies than mobile radiooperators. Only in countries where mobile radio is not widely used canthe WLL operator gain access to the cellular frequencies.
The need for low frequencies (i.e., below 1 GHz) with their resultantlong propagation ranges also varies across different WLL deployments.
Radio propagation 101
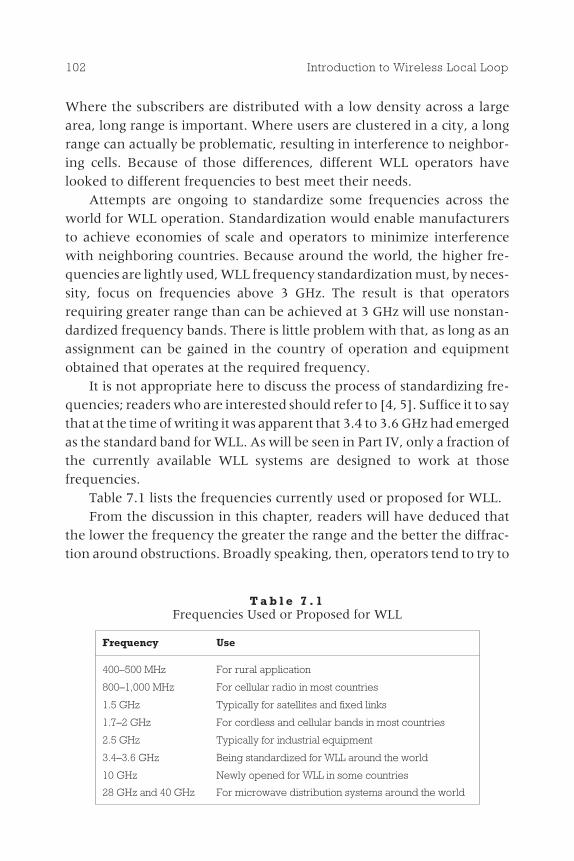
Where the subscribers are distributed with a low density across a largearea, long range is important. Where users are clustered in a city, a longrange can actually be problematic, resulting in interference to neighbor-ing cells. Because of those differences, different WLL operators havelooked to different frequencies to best meet their needs.
Attempts are ongoing to standardize some frequencies across theworld for WLL operation. Standardization would enable manufacturersto achieve economies of scale and operators to minimize interferencewith neighboring countries. Because around the world, the higher fre-quencies are lightly used, WLL frequency standardization must, by neces-sity, focus on frequencies above 3 GHz. The result is that operatorsrequiring greater range than can be achieved at 3 GHz will use nonstan-dardized frequency bands. There is little problem with that, as long as anassignment can be gained in the country of operation and equipmentobtained that operates at the required frequency.
It is not appropriate here to discuss the process of standardizing fre-quencies; readers who are interested should refer to [4, 5]. Suffice it to saythat at the time of writing it was apparent that 3.4 to 3.6 GHz had emergedas the standard band for WLL. As will be seen in Part IV, only a fraction ofthe currently available WLL systems are designed to work at thosefrequencies.
Table 7.1 lists the frequencies currently used or proposed for WLL.From the discussion in this chapter, readers will have deduced that
the lower the frequency the greater the range and the better the diffrac-tion around obstructions. Broadly speaking, then, operators tend to try to
102 Introduction to Wireless Local Loop
T a b l e 7 . 1Frequencies Used or Proposed for WLL
Frequency Use
400�500 MHz For rural application
800�1,000 MHz For cellular radio in most countries
1.5 GHz Typically for satellites and fixed links
1.7�2 GHz For cordless and cellular bands in most countries
2.5 GHz Typically for industrial equipment
3.4�3.6 GHz Being standardized for WLL around the world
10 GHz Newly opened for WLL in some countries
28 GHz and 40 GHz For microwave distribution systems around the world
obtain spectrum at as low a frequency as possible. A number of factorstend to put pressure on operators to agree to using spectrum at higherfrequencies, including the following:
◗ The higher cost of lower frequency spectrum where it is auctioned;
◗ The fact that more spectrum is available at higher frequency,providing a greater system capacity;
◗ The fact that the size of the cell may be limited not by the propa-gation distance but by the number of subscribers that can besupported in a cell; if there are more subscribers than the maximumin a cell, the size of the cell must be reduced.
These factors are discussed in more detail in Part V. Suffice it to sayhere that global variations cause all of these frequencies to be of use tosome operators. Thus, the wide variety of frequencies in use can beexpected to continue, and indeed increase, in the future.
7.6 Predicting WLL coverage
To minimize system cost and rollout time, WLL operators need to ensurethat they use as few cell sites as possible to provide the required coverage.The problems will be familiar to the cellular operators, who expend con-siderable time and effort planning their networks to use the minimumnumber of base stations for the required coverage. Cellular operatorsinvariably deploy planning tools to aid them in this task.
Planning tools basically are computer programs that use as an input adigital map of the area. Using algorithms derived from propagation rules,coverage areas for hypothetical base station sites can be predicted. Differ-ent base station locations can be tried rapidly until a near-optimal result isachieved. Planning tools are available for cellular planning from a widevariety of vendors covering different technologies and cell sizes.
WLL operators need to use planning tools in the same manner as cel-lular operators. However, as discussed in this chapter, the propagationmodes for WLL are significantly different from cellular, particularly dueto the high reliance on a LOS path in WLL systems. No cellular modelsprovide adequate prediction of LOS paths, considering shadowing fromhigh buildings as well as terrain. Therefore, new tools are required
Radio propagation 103
to plan WLL systems. A few tools of this form have now started toappear. For example, BellCore introduced a tool in 1998 aimed mainly atLMDS deployment that can take individual buildings into account anddetermine whether a LOS path would exist from the transmitter to thereceiver. Other manufacturers were known to be working on such toolsduring 1998, and many became available on the market in 1999.
With such tools available, the WLL operator need not overly concernthemselves with how they work. For those who are interested, thegeneral principles are as follows:
◗ The tool starts with a digital map of the target area. The map needsto show the outlines of every building and the building heights.Such maps are available from aerial photography and increas-ingly from satellite photography. Depending on the coverage arearequired, maps can be expected to cost around $200 to $300 persquare kilometer.
◗ The user then selects a particular building or mast on which to placea hypothetical base station. The program has an algorithm thatcompletes a 360 degree scan from the selected base station site. Foreach point on the scan, the program needs to consider azimuth
angles from, say, +20 to −70 degrees. For each azimuth point, a�ray� is sent from the base station. The buildings that the ray strikeshave a LOS path, and the path loss can be calculated based simplyon the distance and the path-loss law used by the model. When aray grazes the top or side edge of a building, diffracted rays are gen-erated, which are then followed until they strike further buildings.The path loss on those rays also needs to include the diffraction loss.
◗ A further enhancement also can allow for reflected signals by fol-lowing the path of a ray as it is reflected off a building. This enhance-ment provides a slight improvement in accuracy but at the expenseof a substantial increase in computing requirements. Such anenhancement typically is not necessary.
A WLL operator will need to select and purchase an appropriateplanning tool prior to deploying a network. Up-to-date informationabout planning tools can be obtained from information sources in tradejournals or from those working in the industry. Until such tools arereleased, no further guidance can be provided here.
104 Introduction to Wireless Local Loop
Chapter 8 looks at the design of a generic radio system, which willbe of use in understanding the advantages of particular radio systems. Italso will show how radio designers overcome some of the propagationproblems described in this chapter.
References
[1] Steele, R., ed., Mobile Radio Communications, New York: Wiley & Sons, 1992.
[2] Rappaport, Wireless Communications, Upper Saddle River, NJ: Prentice Hall,1996.
[3] Freeman, R., Radio System Design for Telecommunications (1�100 GHz),New York: Wiley & Sons, 1987.
[4] Withers, Radio Spectrum Management, London: IEE Press, 1987.
[5] Schwartz, Rachel E., Wireless Communications in Developing Countries,Norwood, MA: Artech House, 1996.
Radio propagation 105

Radio systems
This chapter explains the general design phi-losophies of radio systems, concentrating onthose parts of the radio system that are ofrelevance to WLL technology. Figure 8.1 isa block diagram of a stylized digital radiosystem. Note that the ordering of blocks isimportant: Speech coding must be performedfirst, modulation and medium access last, andciphering after error correction. Analog radiosystems, broadly speaking, do not have any ofthose steps and are sufficiently simple not toneed further discussion here.
Each of the stages is now described inmore detail.
8.1 Speech coding
In digital radio systems, it is necessary to turnvoice signals, which are analog, into a digitaldata stream. (If data rather than voice is tobe transmitted, this stage is not required.)Speech coding is a highly complex topic;thousands of researchers around the worldare working on it, and the area is evolving
107
Contents
8.1 Speech coding
8.2 Error-correctioncoding and interleaving
8.3 Ciphering
8.4 Modulation
8.5 Multiple access
8.6 The use ofspreading codes in aCDMA system
8.7 Orthogonalfrequency divisionmultiplexing
8.8 Packet and circuitswitching
8.9 Time divisionduplex transmission
8C H A P T E R
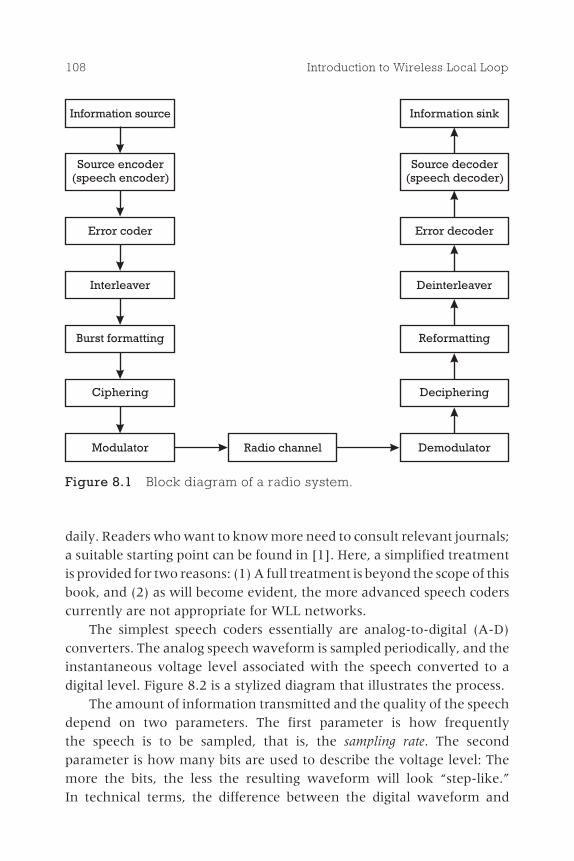
daily. Readers who want to know more need to consult relevant journals;a suitable starting point can be found in [1]. Here, a simplified treatmentis provided for two reasons: (1) A full treatment is beyond the scope of thisbook, and (2) as will become evident, the more advanced speech coderscurrently are not appropriate for WLL networks.
The simplest speech coders essentially are analog-to-digital (A-D)converters. The analog speech waveform is sampled periodically, and theinstantaneous voltage level associated with the speech converted to adigital level. Figure 8.2 is a stylized diagram that illustrates the process.
The amount of information transmitted and the quality of the speechdepend on two parameters. The first parameter is how frequentlythe speech is to be sampled, that is, the sampling rate. The secondparameter is how many bits are used to describe the voltage level: Themore the bits, the less the resulting waveform will look �step-like.�In technical terms, the difference between the digital waveform and
108 Introduction to Wireless Local Loop
Information source
Source encoder(speech encoder)
Error coder
Interleaver
Modulator Radio channel
Information sink
Source decoder(speech decoder)
Error decoder
Deinterleaver
Demodulator
Burst formatting
Ciphering
Reformatting
Deciphering
Figure 8.1 Block diagram of a radio system.
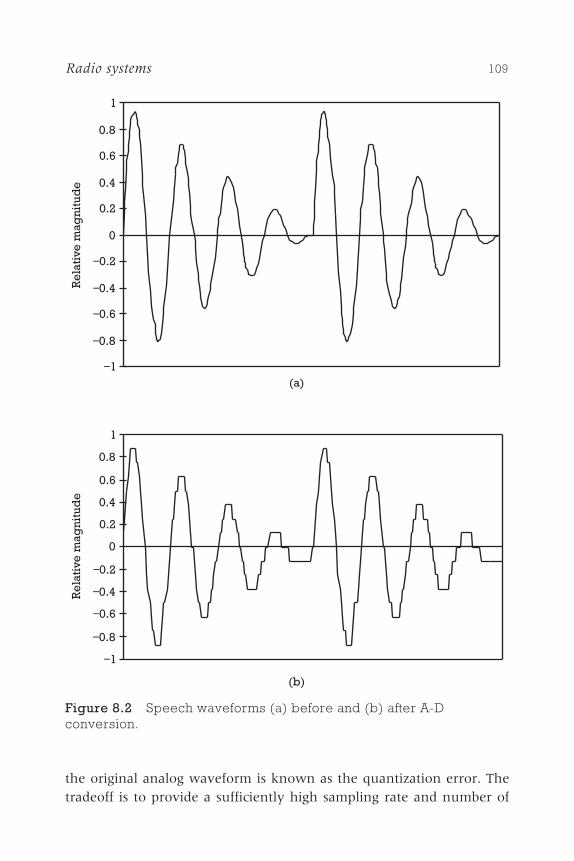
the original analog waveform is known as the quantization error. Thetradeoff is to provide a sufficiently high sampling rate and number of
Radio systems 109
1
1
0.8
0.8
0.6
0.6
0.4
0.4
0.2
0.2
0
0
−0.2
−0.2
−0.4
−0.4
−0.6
−0.6
−0.8
−0.8
−1
−1(a)
(b)
Re
lati
vem
agn
itud
eR
ela
tive
mag
nit
ude
Figure 8.2 Speech waveforms (a) before and (b) after A-Dconversion.
quantization bits to provide good voice quality while avoiding using somany that spectrum resources are wasted. In calculating the samplingrate, a theorem known as the Nyquist theorem can be used. The Nyquisttheorem states that if a waveform is sampled at twice the highest fre-quency in the waveform it can be correctly re-created. Voice generally isassumed not to contain any useful information above frequencies of4 kHz.1 Hence, a sampling rate of 8 kHz typically is sufficient for an accept-able voice quality (at least equivalent to existing telephone systems).
There is an internationally agreed standard for voice coding using8-kHz sampling, known as pulse code modulation (PCM). PCM utilizes8-bit sampling at 8 kHz, resulting in a bit rate of 64 Kbps. This voice-coding system currently is used in most network backhaul links anddigital switches. Its voice quality is considered to be near perfect.
From an information viewpoint, PCM is extremely inefficientbecause it does not take into account the periodicity and predictability inspeech. Typically, over the period of one syllable, lasting perhaps 20 ms,the speech is unchanging and can be represented better by a periodicityand a waveform. More generally, speech waveforms are smooth: changesto different syllables occur slowly. Those facts can be used to reduce thebandwidth of the digital signal.
The simplest system that starts to use the fact that much of thevoice waveform is predictable is known as adaptive differential PCM(ADPCM). Like PCM, ADPCM samples the speech waveform at 8 kHz.However, instead of quantifying the absolute signal level, ADPCM quan-tizes the difference between the signal level at the previous sample andthe current sample. Because speech changes slowly, that difference typi-cally is small and hence can be accurately represented by fewer bits thanthe absolute level. That is the differential part of ADPCM. A furtherenhancement is that when speech waveforms are slowly changing ittends to occur for some time, so during that time the size of the gapbetween each of the quantization levels can be reduced. That gap isincreased as the waveform changes more quickly. Hence, the quantiza-tion size becomes adaptive to the waveform.
110 Introduction to Wireless Local Loop
1. That is not strictly true. Some sounds like �s� contain substantial energy above 4 kHz. Theremoval of such frequencies in telephone systems can make some sounds difficult tounderstand, particularly isolated letters.
ADPCM generally works well. However, because the differential istransmitted, an error in receiving the differential makes the receiver rep-resent a different point on the received waveform than that transmitted.That difference continues while only differences are sent. Further, anerror in reception could lead to the receiver changing the adaptive levelsto different settings than the transmitter, resulting in further errors.Those errors propagate until the transmitter sends a reset-type signal,resynchronizing the receiver. That needs to be performed regularly toprevent error propagation from becoming severe. Even with regulartransmission, the effect of an error can be a short glitch in the speech.These types of error are the price paid for reducing the information usedto transmit the signal.
Because ADPCM systems use only 4 bits to quantize the difference inthe waveform, the bitstream generated is 32 Kbps, only half that of PCM.ADPCM generally is considered to provide quality virtually as good asPCM and is widely used for WLL systems.
Information theory shows that it is possible to go much further. Moreoptimal voice coders would model the vocal tract of the speaker based onthe first few syllables and then send information on how the vocal tract isbeing excited. The speech coders used by digital cellular systems followthat route to a greater or lesser extent. For example, GSM utilizes a codertype known as regular pulse excited�long-term prediction (RPE-LTP),where the LTP part sends some parameters showing what the vocal tractis doing, and the RPE shows how it is being excited. Such speech codersare extremely complex and beyond the scope of this book.
As far as the WLL operator is concerned, the key parameters are thebandwidth required, which has direct implications on the number ofsubscribers that can be supported, and the voice quality. Table 8.1 listssix voice coders and general perceptions about their quality.
For the WLL operator, voice quality can be particularly important.While users accept, unwillingly, that voice quality in a mobile radio sys-tem can be inferior to wireline quality, that typically is not the case for aWLL operator. Further, the WLL operator may be less constrained byspectrum than the mobile operator. The net result is that WLL operatorstend to use coders with better voice quality than those used by cellularoperators, by far the majority opting for the ADPCM coder.
Significant improvements have been made in speech coders in recentyears. A GSM-enhanced full-rate coder, operating at 13 Kbps but with
Radio systems 111
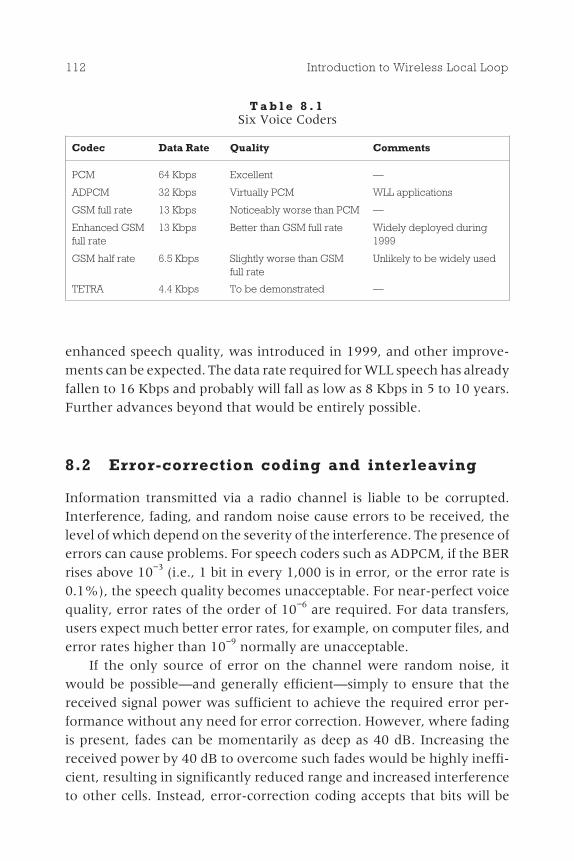
enhanced speech quality, was introduced in 1999, and other improve-ments can be expected. The data rate required for WLL speech has alreadyfallen to 16 Kbps and probably will fall as low as 8 Kbps in 5 to 10 years.Further advances beyond that would be entirely possible.
8.2 Error-correction coding and interleaving
Information transmitted via a radio channel is liable to be corrupted.Interference, fading, and random noise cause errors to be received, thelevel of which depend on the severity of the interference. The presence oferrors can cause problems. For speech coders such as ADPCM, if the BERrises above 10−3 (i.e., 1 bit in every 1,000 is in error, or the error rate is0.1%), the speech quality becomes unacceptable. For near-perfect voicequality, error rates of the order of 10−6 are required. For data transfers,users expect much better error rates, for example, on computer files, anderror rates higher than 10−9 normally are unacceptable.
If the only source of error on the channel were random noise, itwould be possible�and generally efficient�simply to ensure that thereceived signal power was sufficient to achieve the required error per-formance without any need for error correction. However, where fadingis present, fades can be momentarily as deep as 40 dB. Increasing thereceived power by 40 dB to overcome such fades would be highly ineffi-cient, resulting in significantly reduced range and increased interferenceto other cells. Instead, error-correction coding accepts that bits will be
112 Introduction to Wireless Local Loop
T a b l e 8 . 1Six Voice Coders
Codec Data Rate Quality Comments
PCM 64 Kbps Excellent �
ADPCM 32 Kbps Virtually PCM WLL applications
GSM full rate 13 Kbps Noticeably worse than PCM �
Enhanced GSMfull rate
13 Kbps Better than GSM full rate Widely deployed during1999
GSM half rate 6.5 Kbps Slightly worse than GSMfull rate
Unlikely to be widely used
TETRA 4.4 Kbps To be demonstrated �
received in error during fades but attempts to correct those errors usingredundancy added to the signal.
Error correction is widely deployed in mobile radio, where fast fadingis almost universally present. It is less critical in WLL, where the LOS pathand resultant amelioration in the fast fading cause less severe problems.Nevertheless, it is still necessary, especially for computer file transfer.Further, because many of the WLL technologies are based on cellularstandards, they tend to come with the error correction used for cellularalready inbuilt. Some WLL systems go so far as to use half-rate error-correction coding, that is, twice as much information as required istransmitted to introduce the required redundancy for the powerful errorcorrection specified.
Error-correction systems work by adding redundancy to the trans-mitted signal. The receiver checks that the redundant information is as itwould have expected; if it is not, the receiver can make error-correctiondecisions. An extremely simple error-correction scheme repeats the datathree times. The first bit in each of the three repetitions is compared; ifthere is any difference, the value that is present in two of the three repeti-tions is assumed to be correct. The procedure is repeated for all bits. Such asystem corrects one error in every three bits but triples the bandwidthrequired. Considerably more efficient schemes are available.
There are schemes that detect errors but do not correct them. In thesimple example in the preceding paragraph, if the message is repeatedonly twice and the repetition of a given bit is not the same as the originaltransmission, it is clear that an error has occurred, but it is not possible tosay which transmission is in error. In an error-detection scheme, thereceiver requests that the block that was detected to be in error is retrans-mitted. Such a scheme is called an automatic repeat request (ARQ). ARQshave the advantage of often reducing the transmission requirements(even accounting for the bandwidth needed for retransmission of erroredblocks) but add a variable delay to the transmission while blocks arerepeated. The variable delay is unsuitable for speech but typically accept-able on computer file transfer. Some of the more advanced codingsystems can perform error correction and also detect if there are toomany errors for it to be possible to correct them all and hence requestretransmission.
Error-correction methodologies broadly fall into two types, blockcoding or convolutional coding. Both are highly involved and
Radio systems 113
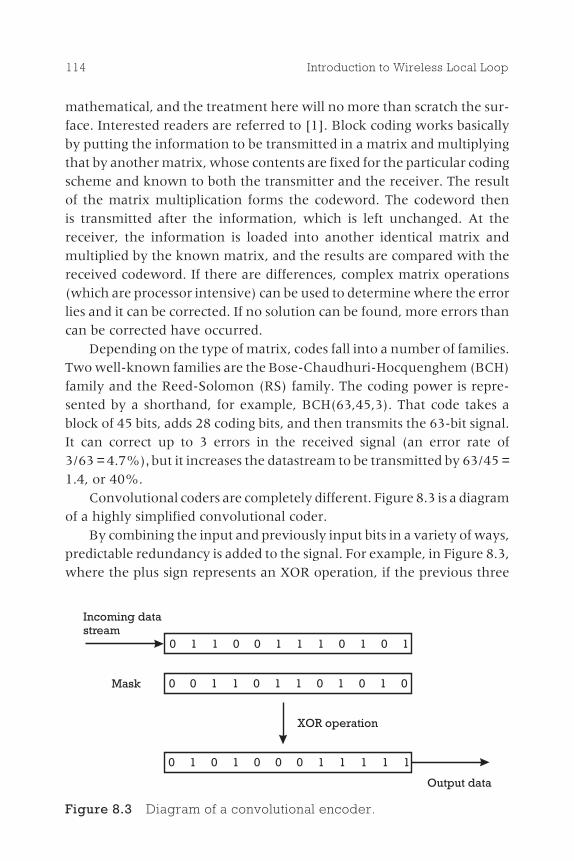
mathematical, and the treatment here will no more than scratch the sur-face. Interested readers are referred to [1]. Block coding works basicallyby putting the information to be transmitted in a matrix and multiplyingthat by another matrix, whose contents are fixed for the particular codingscheme and known to both the transmitter and the receiver. The resultof the matrix multiplication forms the codeword. The codeword thenis transmitted after the information, which is left unchanged. At thereceiver, the information is loaded into another identical matrix andmultiplied by the known matrix, and the results are compared with thereceived codeword. If there are differences, complex matrix operations(which are processor intensive) can be used to determine where the errorlies and it can be corrected. If no solution can be found, more errors thancan be corrected have occurred.
Depending on the type of matrix, codes fall into a number of families.Two well-known families are the Bose-Chaudhuri-Hocquenghem (BCH)family and the Reed-Solomon (RS) family. The coding power is repre-sented by a shorthand, for example, BCH(63,45,3). That code takes ablock of 45 bits, adds 28 coding bits, and then transmits the 63-bit signal.It can correct up to 3 errors in the received signal (an error rate of3/63 = 4.7%), but it increases the datastream to be transmitted by 63/45 =1.4, or 40%.
Convolutional coders are completely different. Figure 8.3 is a diagramof a highly simplified convolutional coder.
By combining the input and previously input bits in a variety of ways,predictable redundancy is added to the signal. For example, in Figure 8.3,where the plus sign represents an XOR operation, if the previous three
114 Introduction to Wireless Local Loop
0 1 1 0 0 1 1 1 0 1 0 1
0 0 1 1 0 1 1 0 1 0 1 0
0 1 0 1 0 0 0 1 1 1 1 1
XOR operation
Incoming datastream
Mask
Output data
Figure 8.3 Diagram of a convolutional encoder.
bits had been 010 and then a new bit arrived, the three bits in the encoderwould be either 101 or 001, depending on whether the new bit was a 1 ora 0, respectively, and the only possible outputs would be 01 for bits 1 and2, respectively, or 11 (if 00 or 10 was received, there would have been anerror). The decoder in the receiver can use that knowledge of the redun-dancy to correct errors. It does that by using an architecture known as aViterbi decoder.2 Such decoders are used widely in mobile radio, but theyare complex to describe and beyond the scope of this text. The referencesprovide a full description. Put briefly, a Viterbi decoder computes what itwould have received for all possible inputs (in the case of the example, atotal of 8 = 23 different inputs). It then compares the received signals witheach of those possible inputs and scores each possible input depending onhow close the input is to the received signal. When the next symbolarrives, it does the same thing. Also, for each of the inputs for the first bitthe decoder calculates which possible inputs could be expected if either a0 or a 1 was inserted as the next bit (as explained at the start of this para-graph). It then adds to the score of the first input the score of each of thenext two possible symbols, building a path through the received data.
Because the original data is never transmitted, unlike block codes,convolutional codes cannot perform error detection. Therefore, theycannot deploy ARQ. However, compared to block codes, they both aremore powerful and require less computing power. Often radio systemsuse both types of error-correction systems in a concatenated arrangementto get the best of both worlds.
All error-correction systems work best when the errors are randomlydistributed and worst when the errors arrive in blocks. That can be readilyseen with the BCH(63,45,3) example. Ideally, in each block of 63 bits,there would be three (or fewer errors). The system will not work if thereare no errors in the first 3 blocks and then 12 errors in the next block.Unfortunately, fading tends to result in errors occurring in blocks. Thesolution is to randomize the errors using a device known as an interleaver.Interleavers are quite simple devices. A typical interleaver would placethe input bits in a matrix, filling it from left to right and then movingdown a row. When the matrix is full, the data is read out in columns andtransmitted. At the receiver, the data fills up a matrix from top to bottom
Radio systems 115
2. The Viterbi decoder is named after Andrew Viterbi, one of the cofounders of Qualcomm, aWLL equipment manufacturer.
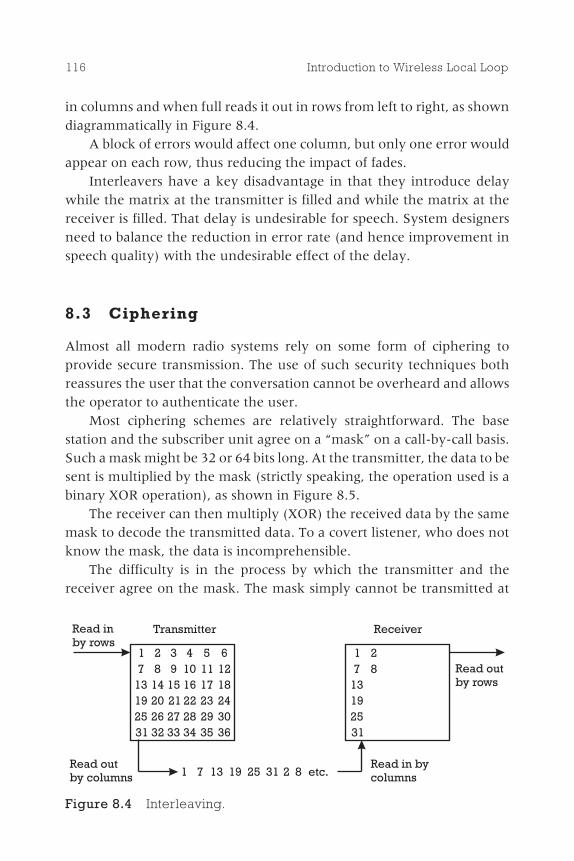
in columns and when full reads it out in rows from left to right, as showndiagrammatically in Figure 8.4.
A block of errors would affect one column, but only one error wouldappear on each row, thus reducing the impact of fades.
Interleavers have a key disadvantage in that they introduce delaywhile the matrix at the transmitter is filled and while the matrix at thereceiver is filled. That delay is undesirable for speech. System designersneed to balance the reduction in error rate (and hence improvement inspeech quality) with the undesirable effect of the delay.
8.3 Ciphering
Almost all modern radio systems rely on some form of ciphering toprovide secure transmission. The use of such security techniques bothreassures the user that the conversation cannot be overheard and allowsthe operator to authenticate the user.
Most ciphering schemes are relatively straightforward. The basestation and the subscriber unit agree on a �mask� on a call-by-call basis.Such a mask might be 32 or 64 bits long. At the transmitter, the data to besent is multiplied by the mask (strictly speaking, the operation used is abinary XOR operation), as shown in Figure 8.5.
The receiver can then multiply (XOR) the received data by the samemask to decode the transmitted data. To a covert listener, who does notknow the mask, the data is incomprehensible.
The difficulty is in the process by which the transmitter and thereceiver agree on the mask. The mask simply cannot be transmitted at
116 Introduction to Wireless Local Loop
1 2 3 4 5 67 8 9 10 11 12
13 14 15 16 17 1819 20 21 22 23 2425 26 27 28 29 3031 32 33 34 35 36
Read inby rows
Read outby columns 1 7 13 19 25 31 2 8 etc.
1 27 8
13192531
Read in bycolumns
Read outby rows
Transmitter Receiver
Figure 8.4 Interleaving.
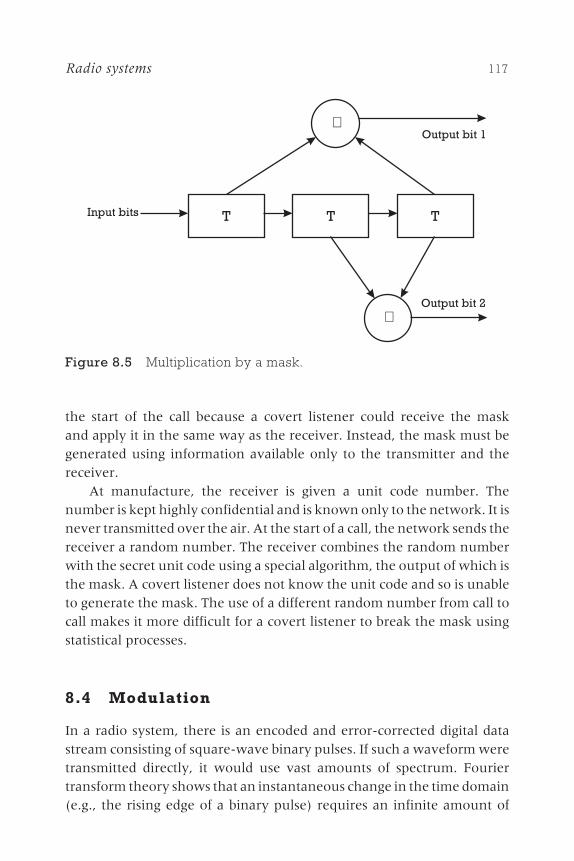
the start of the call because a covert listener could receive the maskand apply it in the same way as the receiver. Instead, the mask must begenerated using information available only to the transmitter and thereceiver.
At manufacture, the receiver is given a unit code number. Thenumber is kept highly confidential and is known only to the network. It isnever transmitted over the air. At the start of a call, the network sends thereceiver a random number. The receiver combines the random numberwith the secret unit code using a special algorithm, the output of which isthe mask. A covert listener does not know the unit code and so is unableto generate the mask. The use of a different random number from call tocall makes it more difficult for a covert listener to break the mask usingstatistical processes.
8.4 Modulation
In a radio system, there is an encoded and error-corrected digital datastream consisting of square-wave binary pulses. If such a waveform weretransmitted directly, it would use vast amounts of spectrum. Fouriertransform theory shows that an instantaneous change in the time domain(e.g., the rising edge of a binary pulse) requires an infinite amount of
Radio systems 117
T T T
+
+
Input bits
Output bit 1
Output bit 2
Figure 8.5 Multiplication by a mask.
bandwidth in the frequency domain. Something more needs to beperformed before the signal can be transmitted, and that somethingis modulation.
There are two different classes of modulation, phase modulation(PM) and amplitude modulation (AM). Frequency modulation is strictlya class of PM and is not discussed further. Broadly defined, PM changesthe phase of the transmitted signal in accordance with the information tobe transmitted, and AM changes the amplitude of the transmitted signal.Example waveforms for the two types of modulation are shown inFigure 8.6. Typically, PM is less susceptible to interference and is morewidely used.
It is possible to combine AM and PM; the result is QAM (quadratureamplitude modulation). It is worth noting that QAM is used widely ontwisted pair and cable along with complex derivatives such as trellis codemodulation (TCM). Those interested in finding out more about QAMshould refer to [2].
Before the square baseband pulses are used to modulate the carrier,the sharp changes must be removed. That is achieved with the use ofpulse shaping. The square pulses are passed through a filter, resulting inrounded pulses. The more severe the filter, the lower the bandwidth ofthe transmitted signal, but the more the difficulty in decoding the signal.Depending on the bandwidth scarcity, such tradeoffs need to be made bythe system designer.
8.5 Multiple access
For most of the topics in Part III, information is provided primarily asbackground knowledge. Multiple access, however, is of greater impor-tance because the available WLL technologies differ in the multiple-access method they use. Decisions about which technology to adopt willbe influenced significantly by the access medium required.
Each operator has a given amount of radio spectrum to divide amongits users. There are broadly three ways to do that:
◗ Frequency division multiple access (FDMA), in which the fre-quency is divided into a number of frequency channels and eachuser accesses a particular channel for the length of the call;
118 Introduction to Wireless Local Loop
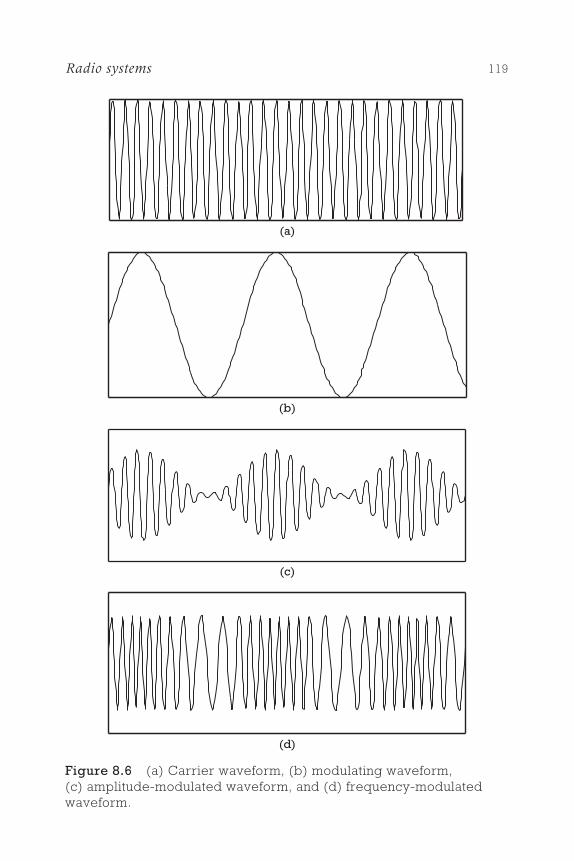
Radio systems 119
(d)
(a)
(b)
(c)
Figure 8.6 (a) Carrier waveform, (b) modulating waveform,(c) amplitude-modulated waveform, and (d) frequency-modulatedwaveform.
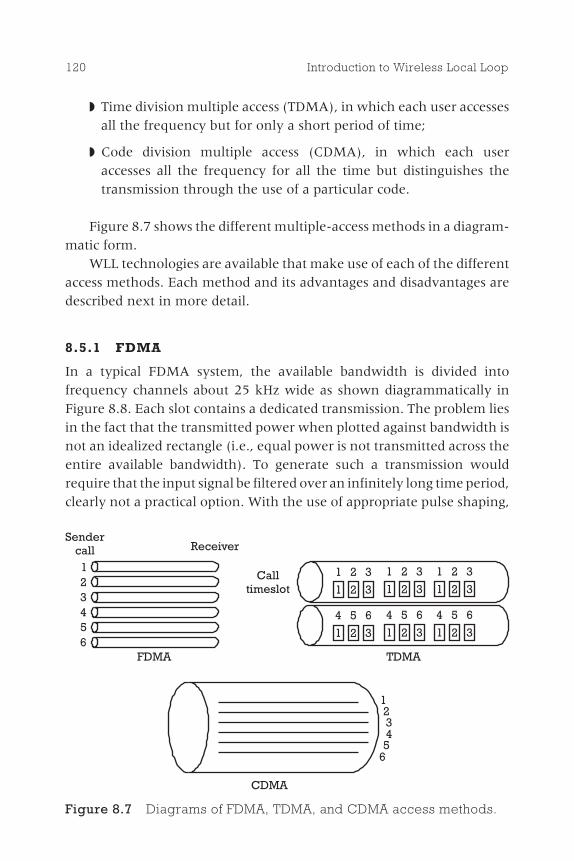
◗ Time division multiple access (TDMA), in which each user accessesall the frequency but for only a short period of time;
◗ Code division multiple access (CDMA), in which each useraccesses all the frequency for all the time but distinguishes thetransmission through the use of a particular code.
Figure 8.7 shows the different multiple-access methods in a diagram-matic form.
WLL technologies are available that make use of each of the differentaccess methods. Each method and its advantages and disadvantages aredescribed next in more detail.
8.5.1 FDMA
In a typical FDMA system, the available bandwidth is divided intofrequency channels about 25 kHz wide as shown diagrammatically inFigure 8.8. Each slot contains a dedicated transmission. The problem liesin the fact that the transmitted power when plotted against bandwidth isnot an idealized rectangle (i.e., equal power is not transmitted across theentire available bandwidth). To generate such a transmission wouldrequire that the input signal be filtered over an infinitely long time period,clearly not a practical option. With the use of appropriate pulse shaping,
120 Introduction to Wireless Local Loop
Sendercall Receiver
123456
FDMA
Calltimeslot 1 2 3
1 2 3
1 2 3
1 2 3
1 2 3
1 2 3
1 2 3
4 5 6
1 2 3
4 5 6
1 2 3
4 5 6
TDMA
12345
6
CDMA
Figure 8.7 Diagrams of FDMA, TDMA, and CDMA access methods.
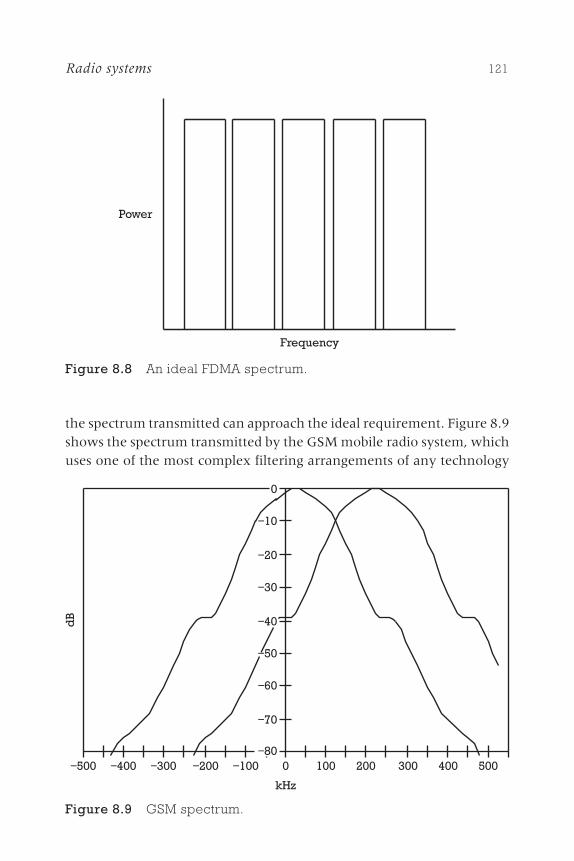
the spectrum transmitted can approach the ideal requirement. Figure 8.9shows the spectrum transmitted by the GSM mobile radio system, whichuses one of the most complex filtering arrangements of any technology
Radio systems 121
Frequency
Power
Figure 8.8 An ideal FDMA spectrum.
0
−10
−20
−30
−40
−50
−60
−70
−80−500 −400 −300 −200 −100 0 100 200 300 400 500
kHz
dB
Figure 8.9 GSM spectrum.
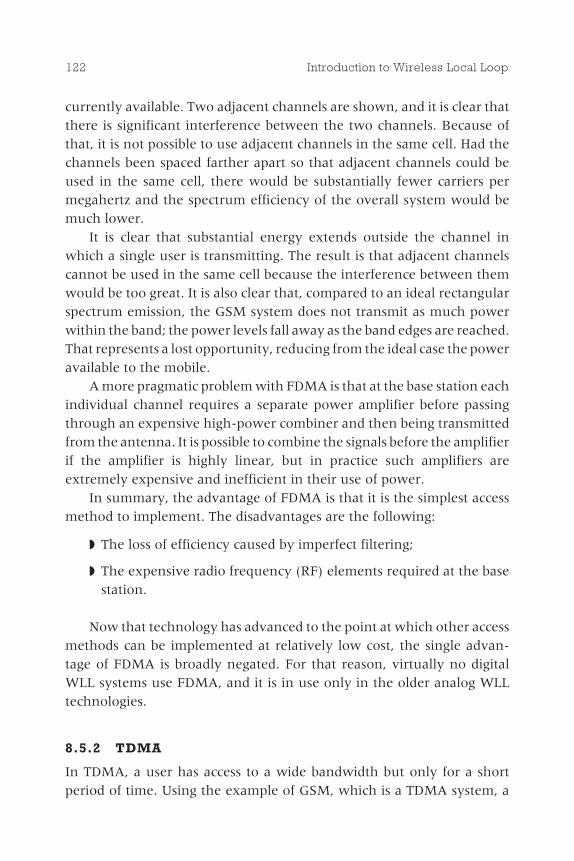
currently available. Two adjacent channels are shown, and it is clear thatthere is significant interference between the two channels. Because ofthat, it is not possible to use adjacent channels in the same cell. Had thechannels been spaced farther apart so that adjacent channels could beused in the same cell, there would be substantially fewer carriers permegahertz and the spectrum efficiency of the overall system would bemuch lower.
It is clear that substantial energy extends outside the channel inwhich a single user is transmitting. The result is that adjacent channelscannot be used in the same cell because the interference between themwould be too great. It is also clear that, compared to an ideal rectangularspectrum emission, the GSM system does not transmit as much powerwithin the band; the power levels fall away as the band edges are reached.That represents a lost opportunity, reducing from the ideal case the poweravailable to the mobile.
A more pragmatic problem with FDMA is that at the base station eachindividual channel requires a separate power amplifier before passingthrough an expensive high-power combiner and then being transmittedfrom the antenna. It is possible to combine the signals before the amplifierif the amplifier is highly linear, but in practice such amplifiers areextremely expensive and inefficient in their use of power.
In summary, the advantage of FDMA is that it is the simplest accessmethod to implement. The disadvantages are the following:
◗ The loss of efficiency caused by imperfect filtering;
◗ The expensive radio frequency (RF) elements required at the basestation.
Now that technology has advanced to the point at which other accessmethods can be implemented at relatively low cost, the single advan-tage of FDMA is broadly negated. For that reason, virtually no digitalWLL systems use FDMA, and it is in use only in the older analog WLLtechnologies.
8.5.2 TDMA
In TDMA, a user has access to a wide bandwidth but only for a shortperiod of time. Using the example of GSM, which is a TDMA system, a
122 Introduction to Wireless Local Loop
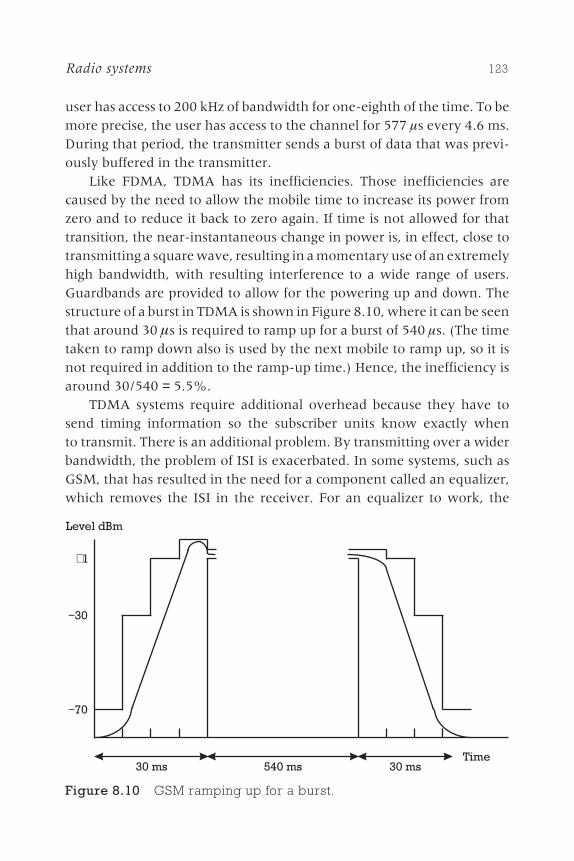
user has access to 200 kHz of bandwidth for one-eighth of the time. To bemore precise, the user has access to the channel for 577 ms every 4.6 ms.During that period, the transmitter sends a burst of data that was previ-ously buffered in the transmitter.
Like FDMA, TDMA has its inefficiencies. Those inefficiencies arecaused by the need to allow the mobile time to increase its power fromzero and to reduce it back to zero again. If time is not allowed for thattransition, the near-instantaneous change in power is, in effect, close totransmitting a square wave, resulting in a momentary use of an extremelyhigh bandwidth, with resulting interference to a wide range of users.Guardbands are provided to allow for the powering up and down. Thestructure of a burst in TDMA is shown in Figure 8.10, where it can be seenthat around 30 µs is required to ramp up for a burst of 540 ms. (The timetaken to ramp down also is used by the next mobile to ramp up, so it isnot required in addition to the ramp-up time.) Hence, the inefficiency isaround 30/540 = 5.5%.
TDMA systems require additional overhead because they have tosend timing information so the subscriber units know exactly whento transmit. There is an additional problem. By transmitting over a widerbandwidth, the problem of ISI is exacerbated. In some systems, such asGSM, that has resulted in the need for a component called an equalizer,which removes the ISI in the receiver. For an equalizer to work, the
Radio systems 123
30 ms 540 ms 30 ms
−70
Time
Level dBm
−30
+1
Figure 8.10 GSM ramping up for a burst.
channel impulse response needs to be measured periodically. The timingis performed by placement of a training sequence in the middle of eachburst. By correlating the received training sequence with a local copy ofthe training sequence, the channel impulse response can be measured.However, the sending of the training sequence represents a substantialinefficiency in the use of radio spectrum. Training sequences can beavoided for WLL because, as explained in Chapter 7, the ISI is reducedthrough the use of directional antennas at the subscriber units. Neverthe-less, care must be taken because it cannot be guaranteed that ISI will notbe problematic in wideband systems.
TDMA overcomes one key disadvantage of FDMA. Because only oneuser�s signal is transmitted at any one time, only a single amplifier isrequired at the base station and the need for combiners is removed.That provides a substantial cost saving in the base station. TDMA also is,generally, more spectrum efficient than FDMA because the size of theguardband relative to the size of a burst is much smaller than the size ofthe guardband effectively required for FDMA relative to the bandwidthof an FDMA channel.
In summary, TDMA has the following advantages over FDMA:
◗ It is more efficient.
◗ It is less expensive to implement.
The disadvantages of TDMA are the following:
◗ More complex subscriber units are required.
◗ ISI may become problematic.
TDMA is a widely used multiple-access method for many mobileand WLL systems. Strictly speaking, most TDMA systems actually areTDMA/FDMA. For example, GSM places eight users on a 200-kHzchannel using TDMA but then divides the assignment into 200-kHz slotsusing FDMA.
8.5.3 CDMA
This section goes into somewhat more detail because CDMA is more com-plex and less intuitive than the other access technologies. There is significant
124 Introduction to Wireless Local Loop
debate as to whether CDMA or TDMA is more appropriate, and an under-standing of that debate requires a good understanding of CDMA itself.
CDMA is the process of data transmission using a code. In thatprocess, each user is allocated a particular codeword. The user first gener-ates data, which could be, for example, the output of a speech coder. Thedata is generated at a rate known as the bit rate, or Rb. Each bit is multi-plied by the code to achieve the final output stream. The output stream isat a data rate equal to Rb multiplied by the length of the codeword, G; thatrate is the chip rate, or Rc. The process of multiplication by a codewordis known as spreading and is shown for an example datastream andcodeword in Figure 8.11.
The length of the codeword, and hence the chip rate, is a fundamentaldesign parameter of a CDMA system. Spreading with a large codewordresults in a large transmitted bandwidth, which, if there are only asmall number of users, will prove inefficient. Spreading with a smallercodeword yields a smaller transmitted bandwidth, which may not be ableto accommodate sufficient users. The spreading factor also is influencedby the size of the frequency assignment available to the operator.
The choice of the code is critically important. The code should havegood autocorrelation properties such that when correlated with offsetversions of itself it exhibits a large impulse-like peak at zero offset anda small residual signal at other offsets. Such a property maximizes theprobability of reception. Many families of such sequences are known.
At the receiver a process of despreading is required to recover thedata. The process involves the multiplication of the received signal withthe codeword. Such multiplication results in the original binary informa-tion being decoded but with an enhancement of the signal level by a fac-tor of G. The enhancement allows interference to be tolerated on the link.For example, if the speech coder required an SNR of 9 dB (a factor of 8)and the code length G was 64 bits, then a signal of 8/64 = 0.12 = −9 dBcould be tolerated. In that instance, the wanted signal is at a lower levelthan the interference, but it can be decoded because of the wider band-width it occupies.
In CDMA WLL systems, the ability to tolerate interference is used toallow other users to send their transmissions on the same channel. Eachof the other users also has a spreading code. It is important that each userhave a different code and that the codes are orthogonal, or nearly so, witheach other. If two users had the same code, the receiver would not be able
Radio systems 125
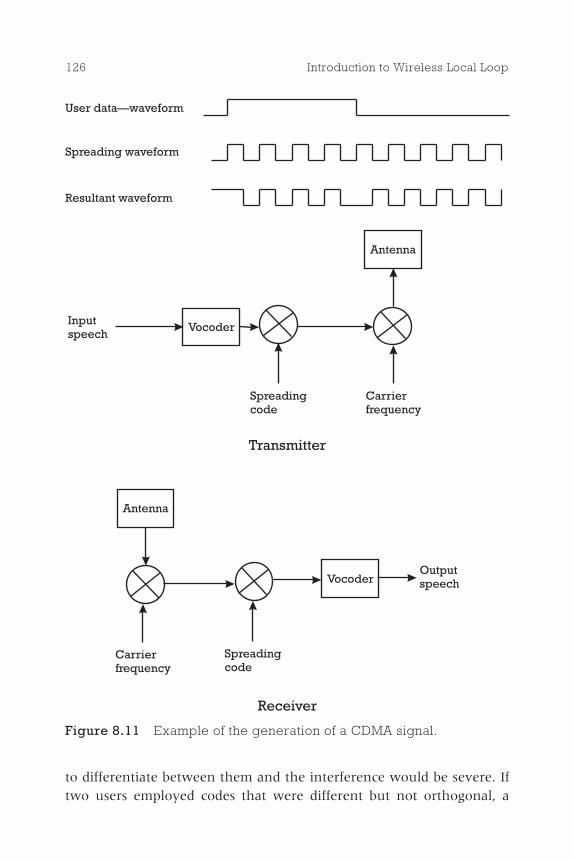
to differentiate between them and the interference would be severe. Iftwo users employed codes that were different but not orthogonal, a
126 Introduction to Wireless Local Loop
User data�waveform
Spreading waveform
Resultant waveform
Inputspeech
Vocoder
Spreadingcode
Carrierfrequency
Antenna
Transmitter
Receiver
OutputspeechVocoder
Spreadingcode
Carrierfrequency
Antenna
Figure 8.11 Example of the generation of a CDMA signal.
certain component of the second user�s signal would be decoded by thefirst user, negating some of the advantages of the decoding process. Anumber of code families are orthogonal; the best known probably is theWalsh family. In any one family, there can be only as many orthogonalcodewords as there are bits in the codeword, that is, G.
The shortage of codewords can be a problem in some systems, par-ticularly cellular, where interference from adjacent cells can be expected.It is overcome by using nearly orthogonal code families. In such families,there is no shortage of codes, but the interference from other usersbecomes slightly more problematic. It is worth going into this topic ina little more detail because the allocation of codewords has become aparameter that an operator needs to define in some CDMA WLL systems.Codewords are explained further in Section 8.6.
Based on the discussion so far, it is apparent that the capacity of aCDMA system is limited by the amount of interference generated byother users employing the same frequency. As such, it often is statedthat CDMA is interference limited. While in a WLL system, all accessschemes ultimately are interference limited, the link between CDMAcapacity and interference is more direct and apparent than in other accesstechniques.
One of the advantages of CDMA is that by reducing the spreading fac-tor G, a user can increase the transmitted data rate without changing thebandwidth of the signal being transmitted. That allows a form of dynamicbandwidth-on-demand allocation. However, for the user who reducesthe spreading factor, the interference that can be tolerated reduces,and the overall system capacity in terms of number of users falls. Never-theless, such flexibility is extremely useful in the WLL environment.
One of the main concerns with CDMA is power control. In the exam-ple given above, where G = 64 and an SNR of −9 dB could be tolerated, ifthe signal from the wanted mobile is at a level S, the total received signalpower, including interference, would be 8S (8 being equivalent to 9 dB).Therefore, seven other users transmitting the same signal level S could besupported. If, however, one user transmits at a level 4S, then only fourother users could be supported. In a WLL environment, some subscriberterminals are closer to the base station than others. To maximize thesystem capacity, it is important that those terminals closer to the basestation transmit with a lower power so that all signal levels are receivedwith the same signal strength.
Radio systems 127
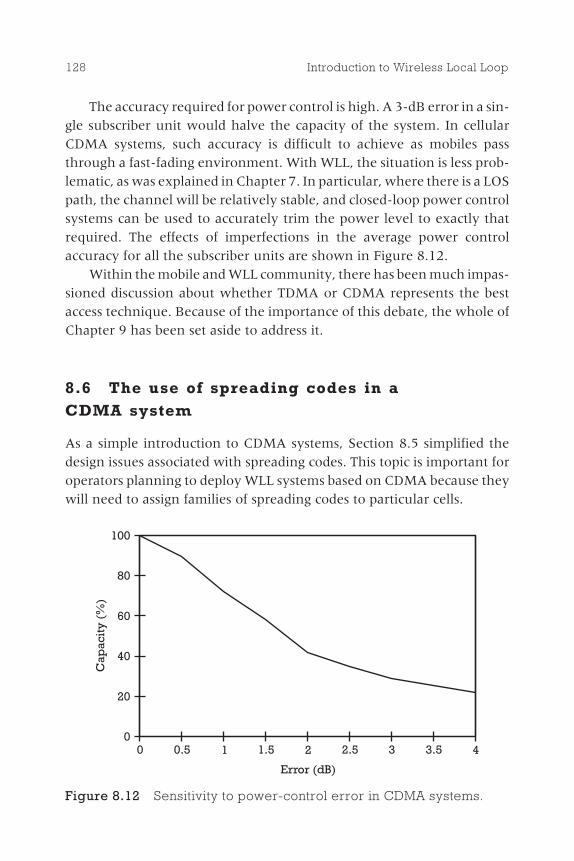
The accuracy required for power control is high. A 3-dB error in a sin-gle subscriber unit would halve the capacity of the system. In cellularCDMA systems, such accuracy is difficult to achieve as mobiles passthrough a fast-fading environment. With WLL, the situation is less prob-lematic, as was explained in Chapter 7. In particular, where there is a LOSpath, the channel will be relatively stable, and closed-loop power controlsystems can be used to accurately trim the power level to exactly thatrequired. The effects of imperfections in the average power controlaccuracy for all the subscriber units are shown in Figure 8.12.
Within the mobile and WLL community, there has been much impas-sioned discussion about whether TDMA or CDMA represents the bestaccess technique. Because of the importance of this debate, the whole ofChapter 9 has been set aside to address it.
8.6 The use of spreading codes in aCDMA system
As a simple introduction to CDMA systems, Section 8.5 simplified thedesign issues associated with spreading codes. This topic is important foroperators planning to deploy WLL systems based on CDMA because theywill need to assign families of spreading codes to particular cells.
128 Introduction to Wireless Local Loop
Cap
acit
y(%
)
100
80
60
40
20
0
Error (dB)
0 0.5 1 1.5 2 2.5 3 3.5 4
Figure 8.12 Sensitivity to power-control error in CDMA systems.
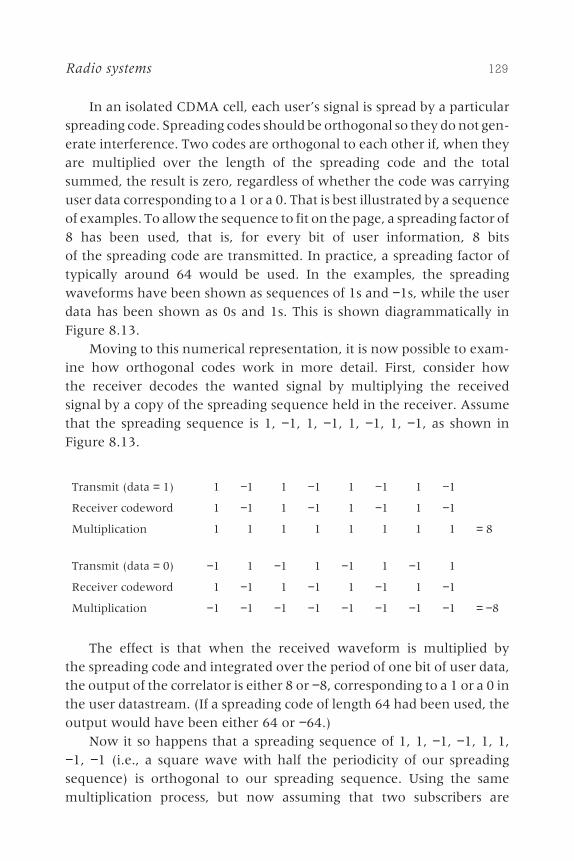
In an isolated CDMA cell, each user�s signal is spread by a particularspreading code. Spreading codes should be orthogonal so they do not gen-erate interference. Two codes are orthogonal to each other if, when theyare multiplied over the length of the spreading code and the totalsummed, the result is zero, regardless of whether the code was carryinguser data corresponding to a 1 or a 0. That is best illustrated by a sequenceof examples. To allow the sequence to fit on the page, a spreading factor of8 has been used, that is, for every bit of user information, 8 bitsof the spreading code are transmitted. In practice, a spreading factor oftypically around 64 would be used. In the examples, the spreadingwaveforms have been shown as sequences of 1s and −1s, while the userdata has been shown as 0s and 1s. This is shown diagrammatically inFigure 8.13.
Moving to this numerical representation, it is now possible to exam-ine how orthogonal codes work in more detail. First, consider howthe receiver decodes the wanted signal by multiplying the receivedsignal by a copy of the spreading sequence held in the receiver. Assumethat the spreading sequence is 1, −1, 1, −1, 1, −1, 1, −1, as shown inFigure 8.13.
Transmit (data = 1) −1 −1 −1 −1 −1 −1 −1 −1 −
Receiver codeword− −1 −1 −1 −1 −1 −1 −1 −1 −
Multiplication− −1 −1 −1 −1 −1 −1 −1 −1 = 8
Transmit (data = 0) −1 −1 −1 −1 −1 −1 −1 −1 −
Receiver codeword− −1 −1 −1 −1 −1 −1 −1 −1 −
Multiplication− −1 −1 −1 −1 −1 −1 −1 −1 = −8
The effect is that when the received waveform is multiplied bythe spreading code and integrated over the period of one bit of user data,the output of the correlator is either 8 or −8, corresponding to a 1 or a 0 inthe user datastream. (If a spreading code of length 64 had been used, theoutput would have been either 64 or −64.)
Now it so happens that a spreading sequence of 1, 1, −1, −1, 1, 1,−1, −1 (i.e., a square wave with half the periodicity of our spreadingsequence) is orthogonal to our spreading sequence. Using the samemultiplication process, but now assuming that two subscribers are
Radio systems 129
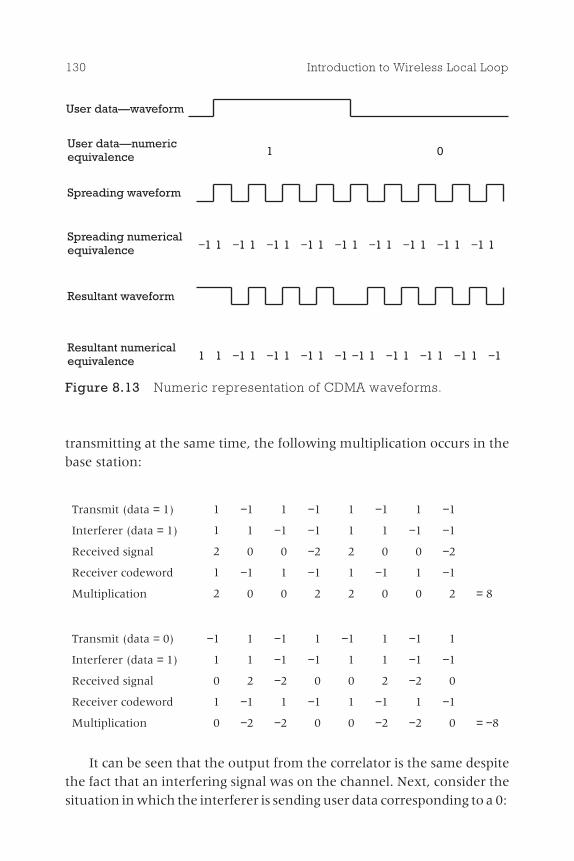
transmitting at the same time, the following multiplication occurs in thebase station:
Transmit (data = 1) −1 −1 −1 −1 −1 −1 −1 −1
Interferer (data = 1) −1 −1 −1 −1 −1 −1 −1 −1
Received signal− −2 −0 −0 −2 −2 −0 −0 −2
Receiver codeword− −1 −1 −1 −1 −1 −1 −1 −1
Multiplication− −2 −0 −0 −2 −2 −0 −0 −2 = 8
Transmit (data = 0) −1 −1 −1 −1 −1 −1 −1 −1
Interferer (data = 1) −1 −1 −1 −1 −1 −1 −1 −1
Received signal− −0 −2 −2 −0 −0 −2 −2 −0
Receiver codeword− −1 −1 −1 −1 −1 −1 −1 −1
Multiplication− −0 −2 −2 −0 −0 −2 −2 −0 = −8
It can be seen that the output from the correlator is the same despitethe fact that an interfering signal was on the channel. Next, consider thesituation in which the interferer is sending user data corresponding to a 0:
130 Introduction to Wireless Local Loop
User data�waveform
User data�numericequivalence
Spreading waveform
Spreading numericalequivalence
Resultant waveform
Resultant numericalequivalence
−1 1 −1 1 −1 1 −1 1 −1 1 −1 1 −1 1 −1 1 −1 1
1 1 −1 1 −1 1 −1 1 −1 −1 1 −1 1 −1 1 −1 1 −1
1 0
Figure 8.13 Numeric representation of CDMA waveforms.
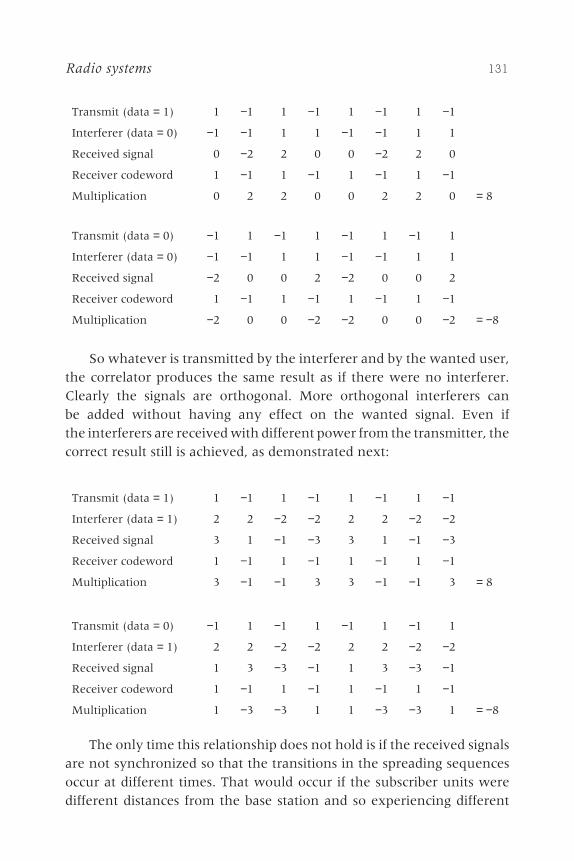
Transmit (data = 1) −1 −1 −1 −1 −1 −1 −1 −1
Interferer (data = 0) −1 −1 −1 −1 −1 −1 −1 −1
Received signal− −0 −2 −2 −0 −0 −2 −2 −0
Receiver codeword− −1 −1 −1 −1 −1 −1 −1 −1
Multiplication− −0 −2 −2 −0 −0 −2 −2 −0 = 8
Transmit (data = 0) −1 −1 −1 −1 −1 −1 −1 −1 −
Interferer (data = 0) −1 −1 −1 −1 −1 −1 −1 −1 −
Received signal− −2 −0 −0 −2 −2 −0 −0 −2 −
Receiver codeword− −1 −1 −1 −1 −1 −1 −1 −1 −
Multiplication− −2 −0 −0 −2 −2 −0 −0 −2 = −8
So whatever is transmitted by the interferer and by the wanted user,the correlator produces the same result as if there were no interferer.Clearly the signals are orthogonal. More orthogonal interferers canbe added without having any effect on the wanted signal. Even ifthe interferers are received with different power from the transmitter, thecorrect result still is achieved, as demonstrated next:
Transmit (data = 1) −1 −1 −1 −1 −1 −1 −1 −1
Interferer (data = 1) −2 −2 −2 −2 −2 −2 −2 −2
Received signal− −3 −1 −1 −3 −3 −1 −1 −3
Receiver codeword− −1 −1 −1 −1 −1 −1 −1 −1
Multiplication− −3 −1 −1 −3 −3 −1 −1 −3 = 8
Transmit (data = 0) −1 −1 −1 −1 −1 −1 −1 −1 −
Interferer (data = 1) −2 −2 −2 −2 −2 −2 −2 −2 −
Received signal− −1 −3 −3 −1 −1 −3 −3 −1 −
Receiver codeword− −1 −1 −1 −1 −1 −1 −1 −1 −
Multiplication− −1 −3 −3 −1 −1 −3 −3 −1 = −8
The only time this relationship does not hold is if the received signalsare not synchronized so that the transitions in the spreading sequencesoccur at different times. That would occur if the subscriber units weredifferent distances from the base station and so experiencing different
Radio systems 131
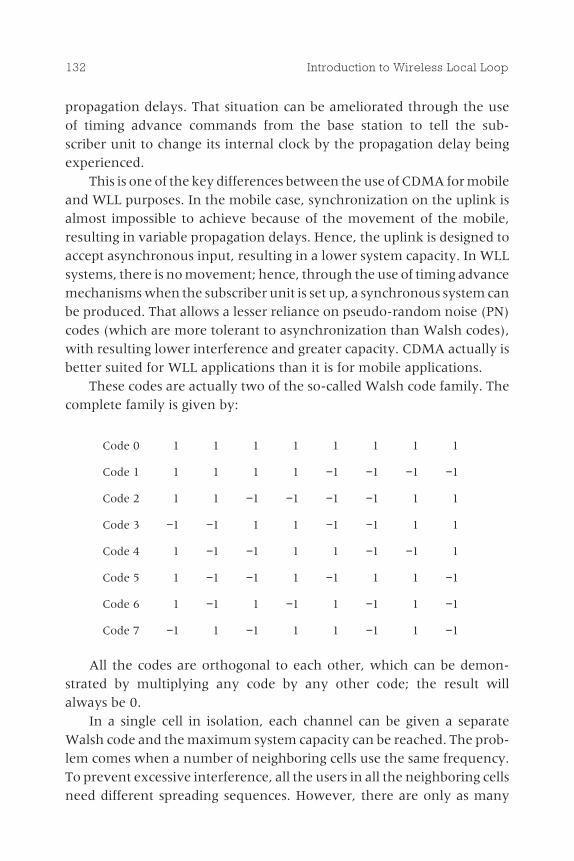
propagation delays. That situation can be ameliorated through the useof timing advance commands from the base station to tell the sub-scriber unit to change its internal clock by the propagation delay beingexperienced.
This is one of the key differences between the use of CDMA for mobileand WLL purposes. In the mobile case, synchronization on the uplink isalmost impossible to achieve because of the movement of the mobile,resulting in variable propagation delays. Hence, the uplink is designed toaccept asynchronous input, resulting in a lower system capacity. In WLLsystems, there is no movement; hence, through the use of timing advancemechanisms when the subscriber unit is set up, a synchronous system canbe produced. That allows a lesser reliance on pseudo-random noise (PN)codes (which are more tolerant to asynchronization than Walsh codes),with resulting lower interference and greater capacity. CDMA actually isbetter suited for WLL applications than it is for mobile applications.
These codes are actually two of the so-called Walsh code family. Thecomplete family is given by:
Code 0− −1 −1 −1 −1 −1 −1 −1 −1
Code 1− −1 −1 −1 −1 −1 −1 −1 −1
Code 2− −1 −1 −1 −1 −1 −1 −1 −1
Code 3− −1 −1 −1 −1 −1 −1 −1 −1
Code 4− −1 −1 −1 −1 −1 −1 −1 −1
Code 5− −1 −1 −1 −1 −1 −1 −1 −1
Code 6− −1 −1 −1 −1 −1 −1 −1 −1
Code 7− −1 −1 −1 −1 −1 −1 −1 −1
All the codes are orthogonal to each other, which can be demon-strated by multiplying any code by any other code; the result willalways be 0.
In a single cell in isolation, each channel can be given a separateWalsh code and the maximum system capacity can be reached. The prob-lem comes when a number of neighboring cells use the same frequency.To prevent excessive interference, all the users in all the neighboring cellsneed different spreading sequences. However, there are only as many
132 Introduction to Wireless Local Loop
sequences as the code length, whereas there will be many more interfer-ing users than that. Of course, one solution would be not to let neighbor-ing cells use the same frequency, but the result of that would be a muchlower system capacity than could otherwise be the case.
For a long time, researchers thought that the problem meant thatCDMA could not be used for commercial applications. The breakthroughcame with the realization that if nearly orthogonal codes were usedrather than fully orthogonal codes the interference between differentusers would not be too severe, although greater than for the orthogonalcase. A family of near-orthogonal codes is PN codes. The good thingabout PN codes is that there literally are millions of them, overcoming thelimitations of Walsh codes.
A PN code is a sequence of 1s and 0s that repeats periodically. PN codesequences have the property that if multiplied by themselves the resulthas the same magnitude as the length of the sequence (in the same waythat the orthogonal codes resulted in +8 or −8). If multiplied by the samesequence but shifted in time by any number of bits, the result is −1 (unlikeorthogonal codes, where the result was 0).
A number of different approaches have been taken to the use ofWalsh and PN codes in commercial mobile CDMA systems and in WLLsystems. In the mobile systems, there is a tendency to give users separatePN codes, since they could roam into any cell and there is a need to ensurethat they do not generate interference wherever they are. In WLL sys-tems, a simpler approach can be adopted, since a subscriber unit alwaysuses a particular cell.
The approach adopted for WLL systems in one particular cell has beento use the Walsh sequences to spread the signals but then to multiply thesignal by a PN code at the same rate as the Walsh code. That does notresult in any further spreading, because the data rates are the same.Indeed, multiplying all the transmitted sequences by the same PN codedoes not affect their orthogonality (although multiplying each by a differ-ent PN code would). Hence, within a particular cell, the performance isunchanged. In a neighboring cell, the same approach is adopted but witha different PN code. Thus, users in neighboring cells might be using thesame Walsh code but different PN codes. The result is that the users donot interfere severely, as would be the case if PN codes were not used.However, because the PN codes are not orthogonal, there is limitedinterference between the different users.
Radio systems 133
In one of the most advanced CDMA WLL systems currently available,the AirLoop system from Lucent (described in detail in Chapter 13),16 different PN codes are allowed. The network planner must make surethat the PN codes are assigned to neighboring cells in much the sameway that frequencies are assigned in a cluster pattern in a FDMA/TDMAsystem. That is, there should be at least one cell between two cells that usethe same frequency and the same PN code. In practice, that is simple toachieve because sixteen codes are more than adequate. However, it doesprovide an extra planning stage, of which the network designer mustbe aware.
8.7 Orthogonal frequency division multiplexing
Recently, a number of manufacturers have proposed solutions for WLLusing orthogonal frequency division multiplexing (OFDM). The keyadvantage of OFDM, as explained in more detail in this section, is itscapability to overcome ISI. As increasingly high data rates are proposedfor broadband WLL solutions, ISI is beginning to be seen as a key problemand hence it seems likely that OFDM will be used in some future WLLsolutions.
The fundamental principle of orthogonal multiplexing originatesfrom the early 1960s although OFDM has been slow to find commercialapplication: At the time of this writing, none of the commercial two-waysystems utilized OFDM in operation. Military OFDM solutions havebeen developed and the digital radio and television systems now beingdeployed utilize OFDM for one-way transmission, but the complexity ofrealizing OFDM for two-way consumer applications has so far pre-vented its mass deployment. With increasingly powerful digital signalprocessing (DSP) chips, OFDM is now becoming feasible for commercialdeployment.
The basic principles of FDM are that the serial datastream of a trafficchannel is passed through a serial-to-parallel converter, which splits thedata into a number of parallel channels. The data in each channel isapplied to a modulator, such that for N channels there are N modulatorswhose carrier frequencies are f1, f2, …, fN. The difference betweenadjacent channels is f and the overall bandwidth W of the N modulatedcarriers Nf.
134 Introduction to Wireless Local Loop

These N modulated carriers are then combined to give an FDM signal.At the receiver the incoming FDM signal is demultiplexed into N fre-quency bands, and the N modulated signals are demodulated. The base-band signals are then recombined using a parallel-to-serial converter. Thebasic system arrangement is shown in Figure 8.14.
In the non-OFDM approaches the traffic data is applied directly to themodulator operating with a carrier frequency of (fN − f1)/2, and the modu-lated signal occupies the entire bandwidth W, the key difference betweenconventional and OFDM solutions. In conventional solutions a singlewaveform is transmitted at the incoming symbol rate, S. In OFDM multi-ple waveforms are transmitted, each at a fraction, N, of the symbol rate. IfS/N results in a narrowband channel where the symbol period is longerthan the ISI duration, then the effect is to transform ISI into multipathfading affecting individual symbols only. This is a key point, and the resultof doing this deserves further attention.
The transformation of the problem of ISI into multipath brings onekey advantage and one key disadvantage. The advantage is that once ISIhas become multipath it is not necessary to deploy equalizers, which arecomplex devices whose complexity increases with the number of symbolsover which ISI is present. However, OFDM itself requires some complex-ity, as discussed further below. The key disadvantage is that if ISI isresolved using an equalizer then the information in the different radiopaths can be combined, resulting in a stronger received signal and onewith �multipath diversity� in that if one of the ISI paths is in a fade, it ispossible that another is not and a satisfactory signal can still be received.However, once the ISI has been transformed to multipath, there is nopossibility of recovering the multiple signals. All that can be done is toadd redundancy to the signal in order to try to correct the errors thatwill occur. Hence, in an ISI environment, OFDM will result in a lowerquality received signal than a conventional solution with an effectiveequalizer.
The key question becomes one of whether the reduction in complex-ity that OFDM potentially provides over a highly complex equalizer issufficient recompense to offset the loss of signal quality. In very severeISI conditions, it may be that an equalizer is unrealizable and henceOFDM is the only way to receive the signal. However, typically withdirectional antennas, WLL signals do not experience such severe ISI, asdiscussed in Section 8.4, and hence this latter issue is unlikely to arise.
Radio systems 135
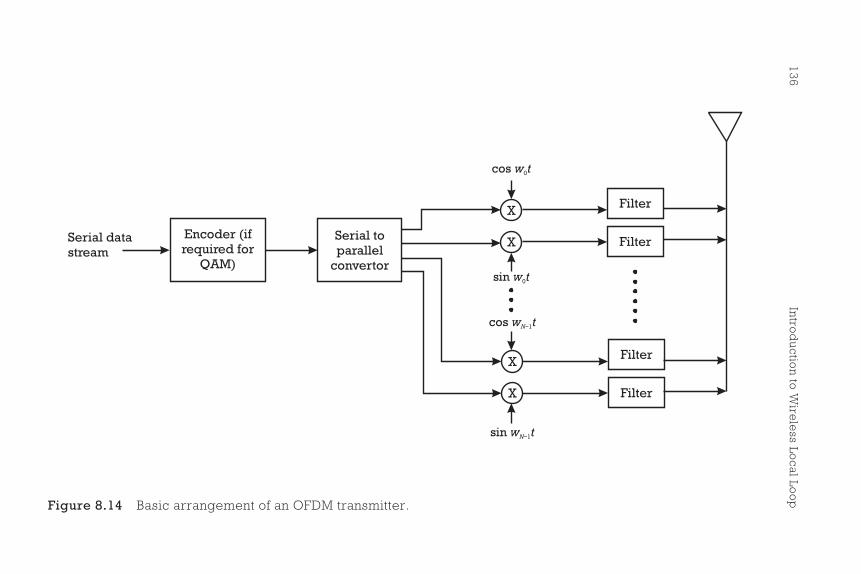
13
6In
trod
uctio
nto
Wire
less
Local
Loo
p
Serial datastream
Encoder (ifrequired for
QAM)
Serial toparallel
convertor
X
X
Filter
Filter
X
X
Filter
Filter
cos w t0
sin w t0
cos w tN−1
sin w tN−1
Figure 8.14 Basic arrangement of an OFDM transmitter.
A disadvantage of the FDM approach shown in Figure 8.14 is theincreased complexity over the conventional system caused by employingN modulators and filters at the transmitter and N demodulators and filtersat the receiver. It transpires that the approach shown in Figure 8.14 canbe achieved in a simpler manner by using a discrete inverse Fourier trans-form (DIFT), normally implemented as an inverse fast Fourier transform(IFFT). This transforms the input signal from the time domain to the fre-quency domain and then the resulting waveform can be directly trans-mitted using a single modulator and filter. Because it is simpler to performan FFT than implement a bank of filters, this approach is always usedwhen implementing OFDM solutions.
However, this brings further complexity. Because each �subchannel�suffers a different attenuation and phase change, it is necessary to correctfor these factors at the receiver before performing the fast Fourier trans-form (FFT). This means that it is necessary to sound the channel at thestart of each burst with a sequence similar to an equalizer trainingsequence, and to remove the attenuation and phase transformation at thereceiver. Other implementational difficulties of OFDM include the needfor frequency stability and the difficulty in shaping and transmitting thewaveform so as to avoid significant out-of-band interference.
So primarily, for WLL, the issue of OFDM becomes one of whether itis better to utilize an equalizer with normal modulation or whether it isbetter to use OFDM. Because equalizer complexity rises with data rate,important parameters in this debate are the data rate of transmission andthe ISI present in the channel. The calculations are complex, but somehave suggested that at around a data rate of 5 to 10 Mbps, depending onthe radio channel, OFDM starts to become simpler than ordinary modula-tion. Others have noted that if there is a requirement to use the WLL sys-tem to provide access to �nomadic� users, that is, users who can move, butremain still for the duration of a call, then the ISI will be substantiallymore severe and OFDM will be a useful technique for overcoming thecomplexity.
At the time of writing, there was no clear consensus on the use ofOFDM for WLL. In general it would appear more appropriate to note thatwith directional antennas in a fixed environment, ISI is relatively mild andthat removal of ISI by equalization brings some key advantages and, hence,OFDM is probably not needed. However, there are many specific situationswhere ISI could become problematic and OFDM could play a key role.
Radio systems 137
8.8 Packet and circuit switching
The types of systems discussed thus far have implicitly assumed circuitswitching. That is, when a user starts to make a call, a circuit is establishedbetween the user and the network, which is maintained for the duration ofthe call. The circuit may be an FDMA channel, a timeslot on a TDMA chan-nel, or a CDMA orthogonal code. Whatever, the net effect is that nobodyelse is able to use that particular resource for the duration of the call.
An alternative to circuit switching is packet switching. In a packet-switched system, no permanent connection is established. Instead, thesubscriber unit collects data from the user until its buffer is full, then itrequests a short slot from the network to transmit the packet of data. Theunit then relinquishes the network resources and waits for the buffer tofill again. Packet switching comes in two guises, connection orientedand nonconnection oriented. In the case of connection-oriented packetswitching, a virtual circuit is established between the transmitter and thereceiver, passing through the switching nodes, when the first packet isreceived. All subsequent packets received for the same destination travelvia the same route. Further, they are received in the order in which theyare transmitted. In the case of nonconnection-oriented packet switching,each packet is treated as if no previous packet had been sent. Potentially, apacket could be sent via a different route from the previous packet and thepackets might not arrive at the receiver in the order they were sent. Thereceiver then requires a sufficient buffer so it can correctly order the dataprior to presenting it to the user.
In outline, circuit switching provides a low and known delay but usesresources inefficiently compared to packet switching. Broadly speaking,circuit switching is suitable for voice, while packet switching is suitable fordata. Packet switching is unsuitable for voice because the delays sufferedby each packet can be variable, resulting in significant and unwantedvoice delay. Packet switching is particularly suitable when the data to betransmitted arrives in short bursts and short delays can be tolerated. Thatis illustrated by the following example.
Imagine a data source that provided data at the rate of 200 bits every3 sec and required that the delay on transmission be less than 2 sec(e.g., vehicle location systems provide data in this manner). If the datawere transmitted via a circuit switched channel with, say, a data capacityof 9.6 Kbps, a call setup time of 1.5 sec, and a call clear-down time of 1 sec,
138 Introduction to Wireless Local Loop

it would be necessary to maintain the data channel dedicated to that use.If it were attempted to clear down the call between bursts, the signalingrequired to do so would take so long that the subscriber unit would needto reestablish immediately the channel once it had been cleared down.However, using a packet protocol, with an overhead of 20%, only 200/3 ×120% bps = 80 bps would be transmitted. That requires less than 1% ofthe available channel capacity. Packet-mode systems also are ideal forasymmetrical applications where more data is transmitted in one direc-tion than the other (e.g., Internet browsing). Because the uplink anddownlink need not be paired, uplink resources are freed for another userwho may want to send a large data file in the uplink direction but receivelittle in the downlink direction.
The ideal radio system probably would include both circuit andpacket switched capabilities. Indeed, some modern mobile radio systems,including GSM, are being developed with such dual capabilities. At thetime of this writing, all the available WLL systems are circuit switched,but some manufacturers are considering the development of a packetswitched capability.
8.9 Time division duplex transmission
The issue of time division duplex (TDD) is discussed in more detail inSection 11.2. TDD essentially involves transmitting both the uplink andthe downlink on the same frequency but at different times. TDD is typi-cally used with TDMA where a number of users receive downlink signalsin turn and then transmit uplink signals in turn on the same chan-nel. Some of the radio advantages of this approach are discussed inSection 11.2.
There are also some transmission efficiency advantages possible fromusing TDD. Many have postulated that as the traffic carried over WLLsystems becomes increasingly data-centric then there will be more trafficin the downlink than the uplink. This is because end users using theInternet tend to download around 10 times more information than theysend. The sources they download the information from tend to beconnected into the network via fiber optics. Hence, there is an imbalancein that those who tend to download more also tend to be connected intothe network via WLL systems.
Radio systems 139
If this imbalance occurs in conventional frequency division duplex(FDD) systems where the uplink and the downlink are both assigned aseparate channel, then resources will tend to be wasted on the uplinkchannel. If it occurs in a TDD system, it is possible for the systemto dynamically reconfigure the slot allocation so that more slots areavailable on the downlink and hence increase the system capacity. In anenvironment where little is known about future usage patterns, suchflexibility may provide an important attribute for a technology.
References
[1] Steele, R., ed., Mobile Radio Communications, New York: Wiley & Sons, 1992.
[2] Webb, W., and L. Hanzo, Modern Quadrature Amplitude Modulation, New York:Wiley & Sons, 1994.
140 Introduction to Wireless Local Loop
TDMA or CDMA?
9.1 Introduction to thedebate
Since about 1991, there has been substan-tial debate in the mobile radio journals andmore recently in publications addressing WLLabout whether CDMA or TDMA is the bestaccess technique. The debate has tended tobe distorted and acrimonious because theprotagonists are manufacturers of the differ-ent access technologies, who want to proveto operators that their equipment is supe-rior. This chapter introduces some of the keyaspects to the debate, focusing specificallyon WLL.
It should be noted that after almost tenyears and the application of most of the finestminds in mobile radio, the debate still has notbeen fully resolved. It would be optimistic toexpect this chapter to provide all the answers.What it can do is put the discussion on anindependent and rational footing and notethe key issues and implications for WLL.
The debate has focused mostly onwhether CDMA can provide greater capacity
141
Contents
9.1 Introduction to thedebate
9.2 Capacitycomparison
9.3 Comparison ofother factors
9.4 Summary
9C H A P T E R
for a given spectrum allocation than TDMA. That is clearly a key issue fora WLL operator and is explored in detail in Section 9.2. Other parts of thedebate have looked at factors such as ease of cell planning and signalquality and flexibility; each of those factors is addressed in Section 9.3.Finally, Section 9.4 summarizes the implications for WLL, which will bepicked up when the separate technologies are examined in Part IV.
9.2 Capacity comparison
9.2.1 TDMA capacity
The capacity of a TDMA system is relatively simple to calculate. Thenumber of channels per megahertz is given by
NK
B=1
(9.1)
where B is the bandwidth per channel in megahertz and K is the clustersize. For the purposes of an example, assume that the bandwidth is 8 Kbpsand that a cluster size of 3 is achieved through the use of directionalantennas. The number of users who can be accommodated, then, isaround 40 users/cell/MHz.
9.2.2 CDMA capacity
Direct calculation of the capacity of a CDMA system has proved beyondthe capabilities of all the learned scholars who have attempted it. In mostapproaches, a theoretical analysis is used up to the point where it becomesintractable and then simulation is adopted. When compared with thepractical results now being achieved, such an approach looks to havederived results that have proved to be somewhat inaccurate.
Basically, consider N mobiles communicating with a base station. Thesignal from a particular mobile arrives with a power S. The other mobileshave perfect power control, so their total signal strength is (N − 1)S. TheSIR experienced by the first mobile is
SIRN
=−1
1(9.2)
142 Introduction to Wireless Local Loop
The SNR is given by the processing gain, G, multiplied by the SIR.Substituting for the SNR and rearranging to determine the number ofusers, it can be seen that
NG
SNR= + 1 (9.3)
which is the basic CDMA capacity equation. It is enhanced as follows,approximating by removing the factor of 1:
NG
SIR af h p= ⋅ ⋅ ⋅ ⋅
1(9.4)
where a is the voice activity factor, f the intercell interference, h thehandover loss, and p a factor relating to power-control inefficiency. Thecalculation of those factors has exercised the cellular community formany years. Fortunately, there is now some practical experience allowingthe factors to be examined. What has transpired is that for an equivalentsystem, cellular CDMA has a capacity of approximately 30% more thancellular TDMA. In such a system, G is 125 and SIR around 5. Thus, (9.4)predicts 25 users/cell/MHz before the other factors, a, f, h, and p are takeninto account. In practice, the number of subscribers is around 30% morethan TDMA. Because TDMA predicts 40, that suggests that, after thefactors a, f, h, and p are taken into account, a capacity of 52 would beachieved; hence, the remaining factors total around 2. Mostly, that gain isachieved through the fact that when a user is speaking there is activity foronly 40% of the time.
As far as WLL is concerned, however, the issue is much simpler. Theintercell interference is minimal, because directional antennas are usedpointing back at the base. There is no handover loss because there is nohandover, and the power control is nearly precise. Calculation of theexact effects of those changes is nearly impossible; until systems arewidely deployed, the gain of CDMA in a WLL application will not beknown exactly. However, it seems likely that in a cellular system f = 0.66,h = 0.85, and p = 0.5; hence, f × h × p = 0.28. In a WLL system, f might riseto, say, 0.8, h = 1, and p might rise to 0.7; thus, f × h × p = 0.56, approxi-mately doubling the capacity of the cellular system. Overall, it might beexpected that a CDMA system would have around twice or even higher
TDMA or CDMA? 143
the capacity of an equivalent TDMA system when deployed in a WLLconfiguration. Only a comprehensive trial will demonstrate whether thatis correct.
9.2.3 Why the higher capacity with CDMA?
The treatment described in Section 9.2.2 is not particularly enlightening.In fact, the reason CDMA achieves a particularly high capacity gain inWLL deployments can be understood intuitively with relatively littleeffort. Broadly speaking, it has to do with the cluster size. As explainedalready, in a TDMA system it is not possible to use the same frequency inan adjacent cell because the interference between the two cells will be toohigh. For that reason, the total available spectrum has to be dividedamong the cells using different frequencies. That much is well knownto those in the cellular industry. CDMA uses the same frequencies inadjacent cells, accepts that interference will reduce the capacity in thefirst cell, but is able to deploy all the frequencies in all the cells.
The key difference between the WLL and the cellular environments isthat WLL subscriber units typically make use of directional antennas.That means they are far less susceptible to interference from other basestations. Similarly, because the antenna is pointing only at a singlebase station, the base station does not see much interference from sub-scriber units not in its area. Compared to the cellular environment, inwhich mobiles have omnidirectional antennas, the interference fromadjacent cells is markedly reduced. That is illustrated diagrammaticallyin Figure 9.1.
In fact, in a well-planned deployment, the interference is reduced tosuch a level that a TDMA system could, in theory, deploy a cluster size ofless than 3, although not as small as 1. In practice, only integral numbersof cluster size are possible, and cluster sizes of 2 cannot be realized well.Hence, TDMA is forced to a cluster size of 3, even though it does not reallyneed it. CDMA does not have that problem. Because the interferencefrom surrounding cells is reduced, the capacity of the main cell increasesin proportion. The system still is able to operate in a fully efficient man-ner. It is that ability to capitalize on the reduced interference from adja-cent cells that gives CDMA the edge in terms of capacity in a WLL system.
The story does not end there. TDMA has one technique that can over-come this disadvantage, known as dynamic channel allocation (DCA).
144 Introduction to Wireless Local Loop

Instead of dividing the frequencies between different cells, each cell hasaccess to all the frequencies. Before transmitting, a cell measures theinterference on each frequency and dynamically allocates the channelwith the lowest interference. That gives the TDMA system the possibilityof using some frequencies that are used in the next cell but for topog-raphical or instantaneous traffic loading reasons are not of a sufficientstrength to interrupt transmission. The gains from DCA can be computedtheoretically by
KK
KDCAFCA
FCA
=+2 1
2(9.5)
where KDCA and KFCA are the effective cluster sizes for dynamic and fixedchannel allocation strategies. Using a fixed cluster size of 3, the dynamiccluster size is 1.66, giving a capacity gain of around 1.8. That reduces thegain of the CDMA system from around 2.5 to a factor of around 1.4, or40%. Among the different TDMA systems, only DECT and personalhandiphone system (PHS)�based systems currently offer DCA.
TDMA or CDMA? 145
Mobile case, severeinterferenceexperienced
Wanted cell Interfering cell
WLL case,interference minimal
Wanted cell Interfering cell
Signal rejected bydirectional antenna
Figure 9.1 Difference in interference when directional antennas aredeployed.
9.2.4 Is CDMA capacity really higher?
Chapter 15 provides estimates for the capacity of a range of WLLsystems, using different access technologies. The chapter shows thatthere are some CDMA systems with a lower predicted capacity thanequivalent TDMA systems. Until there are widespread deployments, it isdifficult to perform a comprehensive comparison between the differentsystems.
9.2.5 Should all WLL operators use CDMA?
This section has looked at the capacity of equivalent CDMA and TDMAsystems, that is, systems that use the same speech coder, the same chan-nel coder, the same modulation, the same range, and so on. In practice,actual systems are not so similar. Thus, it cannot be guaranteed that aCDMA system will always provide greater capacity than a TDMA system.In particular, the capacity gain of CDMA over TDMA where DCA is usedon the TDMA system is relatively small. Also, a number of differencesother than capacity are associated with the different systems (those differ-ences are discussed in the next section). In summary, the CDMA systemsare not inevitably higher capacity for WLL deployments, but it is highlylikely that they will have a higher capacity. Of course, not all operatorswill need to maximize the system capacity; in rural areas particularly,capacity may be of little concern.
9.3 Comparison of other factors
Besides capacity, a number of other advantages are claimed for CDMAsystems. This section examines each of those claims to assess whetherthey can be supported.
9.3.1 Range
It is claimed that CDMA systems have a greater range than equivalentTDMA systems. Range is related to the path loss and the minimum signallevel that the receiver can decode reliably. Path loss is independent ofmultiple-access methods, so the claim is basically one that CDMA can
146 Introduction to Wireless Local Loop
work with a lower received signal strength than TDMA. Section 9.2showed that that is true, since the receiver applies a gain, G, to thereceived signal with a CDMA network but not with a TDMA network.However, to counteract that, TDMA systems need only operate at ahigher power level. Such an option is not possible with cellular systemsbecause high power levels rapidly drain mobile batteries; power, how-ever, is rarely a concern for a WLL operator. There seems little reason tosupport the claim that CDMA systems must have a greater range thanTDMA systems.
9.3.2 Sectorization
Sectorization is discussed in detail in Chapter 17. Here, suffice it to saythat it is the division of a circular cell into a number of wedge-shaped sec-tors. It is claimed that if sectorization is performed in a CDMA network,the same frequency can be used in each sector, increasing the capacity ofthe system by the number of sectors deployed. That claim is correct. It alsois claimed that using sectors in a TDMA arrangement does not increasecapacity. That also is broadly correct. Fundamentally, when a cell issectorized, the cell radius remains the same. Hence, the transmittedpower remains the same, and the distance required to the next cell usingthe same frequency also remains the same. However, because there arenow more cells within the sterilization radius, more frequencies need tobe found to avoid interference. So although the sector is smaller than thecell and thus has to support less traffic, it also has fewer frequencies onwhich to do that (because the total frequency assignment has beendivided by a larger cluster size). That is not the case with CDMA, whereusing the same frequency in adjacent sectors increases only slightly theinterference to neighboring cells and slightly reduces their capacity.
TDMA could achieve a real gain if, instead of making a cell into anumber of smaller cells by sectorization, the cell was divided into smallercircular cells, that is, the base stations were distributed around the cell andtransmitted on a lower power level. That approach results in similarequipment costs but much higher site rental and backhaul costs; thus, ittends to be avoided except where absolutely necessary.
In summary, the CDMA capacity can be increased by a factor of 2 to 3by sectorization with only a small increase in cost. The option is notavailable in TDMA and hence represents an advantage of CDMA.
TDMA or CDMA? 147
9.3.3 Frequency planning
When different frequencies need to be assigned to neighboring cells, thenetwork planners have to decide which frequencies to use in which cells.In a CDMA system, where each frequency is used in each cell, no suchdecision needs to be made. For that reason, it is true that, in general,CDMA does not require frequency planning, although it may require PNcode assignment planning. However, that is not a major advantage.Frequency planning can be readily accomplished with today�s planningtools and easily adjusted if problems occur. DCA systems do not requirefrequency planning in any case. Finally, some CDMA WLL systemssuggest that frequency planning is performed on a cluster size of 2, forvarious design reasons, so some frequency planning is required. Insummary, frequency planning is not a key issue in the selection processfor CDMA, but power planning and interface management is [1].
9.3.4 Operation in unlicensed bands
A number of frequency bands are unlicensed, that is, anyone can usethem without having to obtain a license from the regulator. Such bandstypically are used by industrial, scientific, and medical (ISM) applications,for example, ovens that use radio for heating purposes. Operating WLLsystems in those bands has the single attraction that the spectrum is freeand that the need to apply for a license is removed. However, the WLLsystem will suffer unknown and variable interference from uncontrolledsources.
These bands can be used only if the system can tolerate the interfer-ence. CDMA implicitly tolerates interference anyway, so in such an envi-ronment a CDMA system will work, but with reduced capacity. TDMAsystems cannot accommodate such interference implicitly, but there aretechniques that allow them to do so. DCA selects channels accordingto the interference present on them. Another technique, frequencyhopping, moves rapidly from channel to channel, so interference on onechannel causes errors only for a short period of time.
CDMA systems cope slightly better with interference because theystill use interfered channels but at a lower capacity, whereas TDMA sys-tems use techniques to avoid transmitting on the channels. The capacityof a CDMA system probably is higher, then, in such an environment.
148 Introduction to Wireless Local Loop
9.3.5 Macrocells versus microcells
The concept of using small cells in high-density areas is discussed in detailin Chapter 20. Suffice it to say here that there are situations where smallerWLL cells are deployed within the coverage area of larger WLL cells. Thatis a problem for CDMA systems. Subscriber units configured for the largercell will operate with much higher powers than those configured for thesmaller cells. If both cells operated on the same frequency, the capacity ofthe smaller cell would be near zero, so different frequencies must be used.Because of the wide bandwidth and hence high capacity of a CDMA sys-tem, that may be inefficient, in the worst case reducing the equivalentCDMA capacity by a factor of 2. Such reduction does not occur in TDMA,because the cells would be assigned different frequencies in any case.
The actual effect of microcells will vary from network to network, butwith good planning, capacity reductions of far less than 2 should be realiz-able. In summary, this is a problem that, although reducing CDMA�sadvantage slightly, is unlikely to change the decision to use a CDMA overa TDMA system.
9.3.6 Cost
Everything eventually comes down to cost. At the moment, CDMA sys-tem components cost more than TDMA system components. However,because of the higher capacity of CDMA systems, fewer base stations arerequired, resulting in lower equipment bills and lower site and line-rentalcosts. How the two facts balance depends on the actual difference inequipment costs and the extent to which the network is capacity limited.Certainly, in a highly capacity-limited situation, CDMA systems shouldprove less expensive. Other situations are less clear. Part IV looks atthe relative system costs when different systems are compared; Part Vcompares costs in the examination of business cases.
9.3.7 Bandwidth flexibility
CDMA systems can increase user bandwidth simply by reducing G. TDMAsystems also can be bandwidth flexible by assigning more than one TDMAslot per frame to a user. For example, DECT systems can assign between32 and 552 Kbps dynamically to one user, depending on the load. Thus,both access methods can be made to be approximately equally flexible
TDMA or CDMA? 149
although manufacturers may not have designed the capability intoindividual systems.
9.3.8 FH-CDMA versus DS-CDMA
CDMA systems come in many guises. According to textbooks, the typeof CDMA discussed so far in this book is known as direct-sequenceCDMA (DS-CDMA) because the input data is spread by a sequence or acodeword. According to textbooks, there is an alternative known asfrequency-hopped CDMA (FH-CDMA), in which the bandwidth of thesignal is not increased directly but the transmitter jumps from frequencyto frequency. Because more than one frequency is used, the effectappears to be to spread over the bandwidth. In practice, only onefrequency is being used at one time, so the transmitted bandwidth is notincreased, just the spectrum required. The FH is defined as fast when thejumps occur more than once in a bit period and slow otherwise. At themoment, fast FH is restricted to military applications and is not consideredfurther here.
FH has been introduced in the context of TDMA systems that movefrom channel to channel to avoid interference. By some quirk of historyor definition, FH-TDMA and FH-CDMA are identical. It seems far lessconfusing to use CDMA to mean only DS-CDMA and TDMA to meanTDMA, FH-TDMA, and FH-CDMA�that is the terminology used in thisbook. Unfortunately, some manufacturers are so keen to be able to placethe �CDMA seal of approval� on their equipment that FH-TDMA equip-ment is labeled as CDMA or, even worse, as FH-CDMA/TDMA. Readersshould assume anything labeled with FH is more akin to TDMA thanCDMA, although the manufacturer is strictly correct.
9.3.9 CDMA for broadband applications
CDMA is generally not appropriate for broadband applications. If a singleuser requires a radio channel of 2 Mbps and a typical spreading factor of64 is used, then the total bandwidth required is 128 Mbps. Typically,twice this will be needed for an uplink and a downlink, resulting in a totalspectrum requirement of around 256 MHz, depending on the modulationused. Few operators will have such a large amount of bandwidth, and inany case to dedicate all the bandwidth to one channel is inflexible. Hence,
150 Introduction to Wireless Local Loop
it tends to prove more practical to use FDMA or TDMA technologies forbroadband solutions.
There is a potential solution to this problem, which is to allow the userto have more than one code at the same time (multicode transmission).This is akin to concatenating timeslots in TDMA; however, for each codeto be received, a separate correlator and decoder is required in thereceiver, which tends to add complexity and cost in a manner that doesnot occur in TDMA.
9.4 Summary
If the CDMA-versus-TDMA debate were simple, it would have beenresolved long ago. In the WLL environment, resolving the debate appearsat least slightly simpler than for cellular, and early cellular results providea useful insight. In summary:
◗ CDMA systems are likely to have a higher capacity than TDMAsystems, ranging from around 1.4 where DCA is available on theTDMA system to as high as 2.5 in some cases. If sectorization isincluded, capacity can be higher.
◗ There is unlikely to be any significant range difference between thetwo systems.
◗ CDMA does not have an advantage associated with not having tofrequency-plan the system.
◗ CDMA systems perform better in unlicensed bands.
◗ CDMA systems perform less well where microcells are deployed.
◗ CDMA may be less costly, but it is more risky.
◗ CDMA does not have a significant advantage where bandwidthflexibility is concerned.
◗ CDMA is difficult to deploy, and probably inappropriate when peakdata rates exceed around 2 Mbps per user.
Where capacity is key, operators should examine CDMA systemsclosely because those systems are likely to provide the greatest capacityfor the lowest cost. Where high data rates are key, CDMA systems are
TDMA or CDMA? 151
probably inappropriate. Otherwise, an operator should select a systemaccording to whether it can provide the required services and otherfactors such as finance and local maintenance capability. Spending toomuch time on the CDMA-versus-TDMA debate is an inefficient way touse resources needed to plan and deploy a network.
Reference
[1] Yang, Samuel C., CDMA RF System Engineering, Norwood, MA: Artech House,1998, Chap. 9.
152 Introduction to Wireless Local Loop
Wireless radiotechnologies
Selecting the appropriate technology isoften seen as one of the key decisions fac-
ing a WLL operator. Indeed, many operatorsfocus on that decision to the exclusion of allothers. It is an extremely important decision,although Part V of this book places the deci-sion in the context of many other equallyimportant decisions that an operator needs tomake. There is much confusion in the mar-ketplace and little in the way of independentanalysis. This part of the book corrects thatsituation.
Chapter 10 provides an overview of thetechnologies. They are then divided intocordless, cellular, proprietary, and broadbandtechnologies and discussed in Chapters 11through 14, respectively. Chapter 15 thenprovides a summary and conclusions for thispart of the book, and Chapter 16 looks at oneparticular technology in more detail.
One important point should be madeclear about Part IV. No attempt has beenmade to list and describe all available tech-nologies. With the speed at which newtechnologies are being introduced, such an
IVP A R T

attempt would make the book outdated even before it is published.Instead�and more usefully�the chapters consider examples of eachgenre of technology and explain the key issues in each general area. Thatapproach will allow readers to understand relatively easily new technolo-gies that subsequently emerge. Also, as a result of the variable availabilityof information on different systems, some are described in significantlymore detail than others.
154 Introduction to Wireless Local Loop

Overview oftechnologies
10.1 Introduction
Attend a conference on WLL and typicallyyou will find tens of manufacturers, eachwith two or more WLL products, makingpresentations as to which technology youshould adopt. Analysts and consultantspresent single-page diagrams that attemptto summarize which technology is best.Operators state why they chose a particulartechnology, often contradicting the manufac-turers� presentations. Confusion reigns.
At the end of 1998 there were some 15 dif-ferent types of technologies, and some tech-nologies were supported by more than onemanufacturer resulting in around 30 differ-ent product offerings. The systems that hadachieved a significant degree of sales successare shown in Table 10.1. Such a choice isunprecedented in the world of radio!
It is worth understanding why there issuch a wide choice. The key reasons are asfollows:
155
Contents
10.1 Introduction
10.2 Standardizationactivities
10.3 Segmenting thetechnologies
10.4 Matching thetechnology to therequirement
10.5 The importantinformation
10C H A P T E R
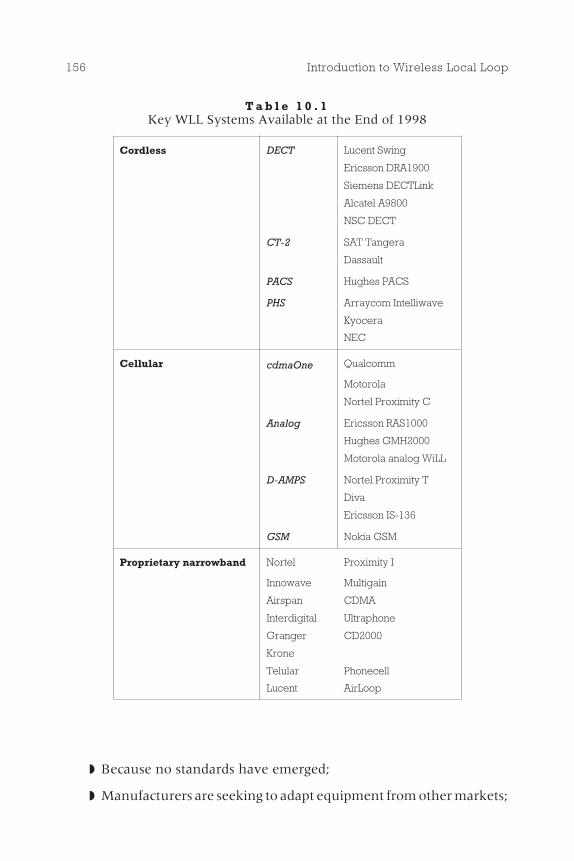
◗ Because no standards have emerged;
◗ Manufacturers are seeking to adapt equipment from other markets;
156 Introduction to Wireless Local Loop
T a b l e 1 0 . 1Key WLL Systems Available at the End of 1998
Cordless DECT Lucent Swing
Ericsson DRA1900
Siemens DECTLink
Alcatel A9800
NSC DECT
CT-2 SAT Tangera
Dassault
PACS Hughes PACS
PHS Arraycom Intelliwave
Kyocera
NEC
Cellular cdmaOne Qualcomm
Motorola
Nortel Proximity C
Analog Ericsson RAS1000
Hughes GMH2000
Motorola analog WiLL
D-AMPS Nortel Proximity T
Diva
Ericsson IS-136
GSM Nokia GSM
Proprietary narrowband Nortel Proximity I
Innowave Multigain
Airspan CDMA
Interdigital Ultraphone
Granger CD2000
Krone
Telular Phonecell
Lucent AirLoop
◗ WLL systems are deployed in a range of environments with con-flicting needs;
◗ Lack of mobility does not demand standards.
10.1.1 Standards
In the world of cellular radio, three key systems are currently beinginstalled (GSM and its derivatives, CDMA, and digital AMPS, orD-AMPS). It is hoped that in the future that number will fall to twoor even one. The cellular market is larger than the WLL market andhas the economies of scale to support more technologies. Only threehave emerged because those three have been declared open standards.Equipment from one manufacturer can interwork with equipment fromanother. That is important to the operators because they do not feel theyare being tied into a particular manufacturer.
Typically, open standards do not emerge by themselves. It rarely is inthe interest of a manufacturer to open its technology to other manufac-turers. Even when a manufacturer does that, other manufacturers oftenfind that key intellectual property rights are difficult and costly to obtain.Standards work best when a recognized standards committee developsthem in an open forum and all interested parties take part. That is whatoccurred with GSM, which was developed by the European Telecommu-nications Standards Institute (ETSI).1 As a result, most manufacturersproduced only a single technology, and operators were faced with astraightforward decision.
The reasons a standard has not emerged for WLL and the actions cur-rently being taken to address that situation are discussed in Section 10.2.
10.1.2 Adapting equipment
As explained in Chapter 4, WLL�s history is closely linked with the use ofcellular systems to provide telephone lines in some countries. At first,while it was still far from clear that WLL would be successful, manufactur-ers sought to reduce their risk by modifying existing equipment ratherthan developing new bespoke systems. Different manufacturers decided
Overview of technologies 157
1. It is fondly known to its members as the European Tourism and Sightseeing Institutebecause they have had meetings in most European cities.
to modify different systems, including their old cellular and cordlesssystems and their new cellular and cordless systems. Some then started todevelop bespoke equipment, leaving their other technologies in theproduct catalog. As can be imagined, that resulted in a wide range ofequipment being available.
10.1.3 Differing needs
It would seem that if one technology were significantly better thananother, the number of products on the market would fall rapidly asoperators selected the better technology. That clearly has not happened.What is clear, as explained in Chapter 4, is that WLL systems are deployedin a range of environments. Some systems require high range, others highcapacity, some certain features, others operation in particular frequencybands. No single technology can meet all of those needs. Particulartechnologies fill particular niches.
This part of the book shows why that is the case and the strengths andweaknesses of the different technologies.
10.2 Standardization activities
Standardization has failed WLL. In many ways, that should not besurprising. Standardization fails the first generation of most products, andWLL has been no exception. The reason is that standardization is timeconsuming. It takes much longer for a group of manufacturers to agree ona standard than it does for a single manufacturer to design a systemin-house. For example, GSM took around 8 years to standardize (notincluding the effort to correct the standard after the initial launch).Qualcomm, working alone, developed its CDMA technology in around3 years. So, to produce a standard it is necessary to start early so that thestandard is completed around the time demand for it arrives.
In the early 1980s, first-generation cellular radio (for which therewere few standards) was proving successful. It was clear that there wouldeventually be a demand for a second-generation digital system. ETSIstarted a standardization program long before the need appeared, result-ing in GSM arriving on time (more or less).
WLL just appeared one day, as was recounted in Chapter 4. Nobodyhad time to perform any standardization activity before the product was
158 Introduction to Wireless Local Loop
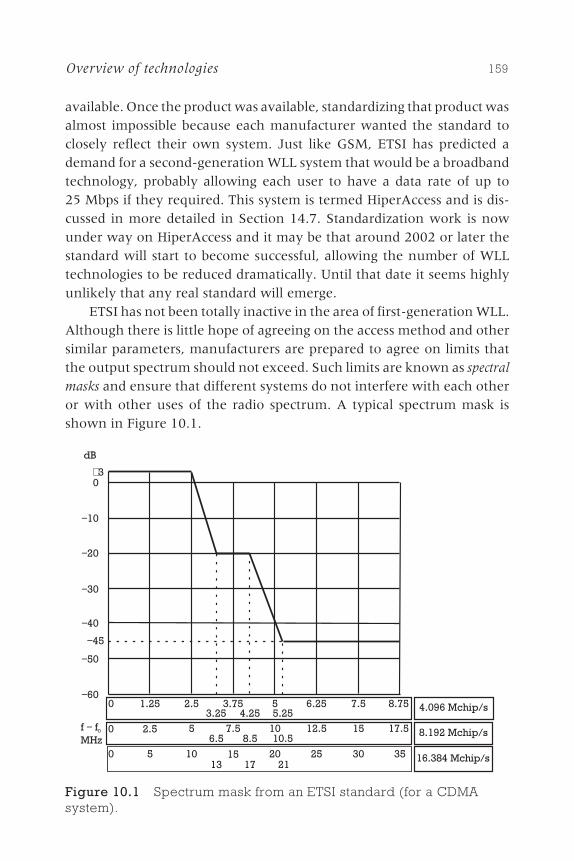
available. Once the product was available, standardizing that product wasalmost impossible because each manufacturer wanted the standard toclosely reflect their own system. Just like GSM, ETSI has predicted ademand for a second-generation WLL system that would be a broadbandtechnology, probably allowing each user to have a data rate of up to25 Mbps if they required. This system is termed HiperAccess and is dis-cussed in more detailed in Section 14.7. Standardization work is nowunder way on HiperAccess and it may be that around 2002 or later thestandard will start to become successful, allowing the number of WLLtechnologies to be reduced dramatically. Until that date it seems highlyunlikely that any real standard will emerge.
ETSI has not been totally inactive in the area of first-generation WLL.Although there is little hope of agreeing on the access method and othersimilar parameters, manufacturers are prepared to agree on limits thatthe output spectrum should not exceed. Such limits are known as spectralmasks and ensure that different systems do not interfere with each otheror with other uses of the radio spectrum. A typical spectrum mask isshown in Figure 10.1.
Overview of technologies 159
−60
−50
−40
−30
−20
−10
0
dB
−45
+3
8.192 Mchip/s0 2.5 5 7.5 10 12.5 15 17.56.5 8.5 10.5
0 5 10 15 20 25 30 3513 17 21
16.384 Mchip/s
0 2.5 3.75 5 6.25 7.5 8.751.253.25 4.25 5.25 4.096 Mchip/s
f fMHz
0−
Figure 10.1 Spectrum mask from an ETSI standard (for a CDMAsystem).
Because FDMA, TDMA, and CDMA systems differ markedly in theirspectrum characteristics, ETSI is working on different standards for eachtype of system. For most readers, those standards will be irrelevant. Somemanufacturers may need to change the output stages of their equipmentslightly to conform to the standards; otherwise, the standards will have noeffect on the market.
Perhaps it is not totally fair to say that there are no WLL standards.Many of the WLL technologies are based on cellular or cordless technolo-gies, which have been standardized. In some cases, the standards includesections that discuss how the equipment should be deployed for WLL(e.g., see the DECT standard). Having standards helps, in that were aWLL operator to select, for example, DECT, as its preferred technology,the fact that DECT is covered by a standard should allow them to multi-source equipment.2 However, because no WLL-specific standards coveran entire WLL system, there is no guidance from that direction to help anoperator make a technology selection.
The lack of standardization is unfortunate; standards undoubtedlyprovide a number of important benefits to operators and users. One ortwo standardized WLL systems would provide greater economies of scale,reduced equipment costs, and greater certainty for operators when theymust make a technology selection. The lack of standards certainly willslow the progress of WLL and reduce, particularly in early years, the totalsubscriber numbers. Unfortunately, the lack of standardization cannot beaddressed easily at a time when a number of proprietary products areavailable; it will need to wait for the next generation of WLL systems.Standardization, in the same manner that GSM was standardized, wouldbe highly beneficial to the future deployment of WLL systems.
10.3 Segmenting the technologies
Segmentation is an approach much loved by management consultants. Inthe area of WLL, segmentation is useful because WLL technologies arebased on one of four different schools of thought. Understanding that iskey to understanding the technologies. Unfortunately, understanding
160 Introduction to Wireless Local Loop
2. In practice, different manufacturers have slightly modified their DECT equipment toimprove performance in a WLL environment. The result is that currently even DECTequipment from different manufacturers will not interwork.
the technologies and determining which is most appropriate for a par-ticular deployment are not the same thing.
Different experts choose slightly different segmentation of thetechnology market. However, the general view is that it consists of fourdifferent segments as follows:
1. Technologies based on cordless mobile radio standards (e.g.,DECT, CT-2, PHS);
2. Technologies based on cellular mobile radio standards (e.g., GSM,NMT, IS-95);
3. Bespoke or proprietary WLL technologies (e.g., Nortel�s Proxim-ity I, Lucent�s AirLoop, Innowave�s Multigain);
4. Broadband technologies capable of providing 2 Mbps or higherdata rates per user (e.g., the LMDS systems).
An extra category could be added alongside broadband for systemsdesigned primarily for video distribution (e.g., MVDS, see Section 14.5).This is an important differentiation, but does not result in sufficientlysizable segments to merit further segmentation of the market.
At the end of 1999, information was limited to the size of the installedbase of each of the different technologies deployed to date. The evidencesuggested that almost all installed lines were either cellular, mostly usingcdmaOne, or cordless, using DECT. Although a number of trials of pro-prietary technologies have taken place, the number of deployments werelimited and happened in countries such as the United Kingdom andSri Lanka. There was also a relatively large base of installed analogcellular WLL systems that was slowly being replaced with higher qualitydigital.
Each of these segments is described in more detail in the followingchapters.
10.4 Matching the technology to the requirement
As mentioned at the start of this chapter, requirements differ to such adegree that no one technology is perfectly suited to all the requirements.For example:
Overview of technologies 161

◗ Where long range is required, the cordless and proprietary tech-nologies will tend to be inappropriate.
◗ Where good voice quality is essential, analog cellular technologiesand digital cellular systems without enhanced voice codecs shouldbe avoided.
◗ Where ISDN and higher rate services are required, only the proprie-tary technologies can be used.
◗ Where interference from existing users of the spectrum is aproblem, technologies using CDMA techniques will be mostappropriate.
◗ Where speed of deployment is of the essence, then cellular tech-nologies will be most appropriate.
◗ Where limited mobility is required, the cellular and cordlesstechnologies will perform best.
◗ Where users want a dual-mode cellular/WLL handset, proprietarytechnologies cannot be adopted.
◗ Where cost is key, cellular technologies are often most appropriate.
◗ For deployments in Europe, non-European cordless and cellulartechnologies cannot be used.
Other factors could be included. The point of the list is to show howthe particular circumstances of the user can have a significant effect onthe choice of technology. Before selecting a technology, operators shouldhave a clear understanding of the environment into which they are aboutto launch their system.
10.5 The important information
In the following chapters on each of the different technologies, it isimportant for readers to keep in mind the key parameters. When select-ing a WLL technology, an operator will look for the technology thatmeets its requirements in terms of services for the lowest possible cost.Hence, the key pieces of information are the services offered and thenetwork cost.
162 Introduction to Wireless Local Loop
Calculation of the network cost requires an understanding of therange of the technology (so the number of cells for coverage can be calcu-lated), the capacity of the technology (so the number of cells for capacitycan be calculated), the architecture of the technology (so the full list ofcomponents required can be developed), and the cost of each compo-nent. Those key parameters will be provided in Chapters 11 to 14 for eachtechnology, except for cost. Typically, cost is confidential, subject tonegotiation, and liable to decrease over time.
Calculating capacity is always difficult. For any system, claims oftendiffer as to the capacity that can be achieved, mostly because the capacitycan vary, depending on the manner in which the network is deployed.The approach taken here is to determine the bandwidth per channel andthe cluster size and then simply divide the bandwidth by the cluster size toarrive at a figure relating to the capacity of each cell. The bandwidth perchannel is typically specified by the manufacturer and is not contentious.However, the cluster size is difficult to calculate. Even for a technologysuch as GSM, where over 200 networks are deployed around the world,estimates of cluster size vary from 3 to 16, a factor of over 500%. With fewof the WLL technologies having been deployed in large scales, clustersizes are likely to be even less well-defined.
At this point, many readers might feel that calculation of capacity is apointless exercise if results can vary by 500%. There is some truth to that.Here, best estimates have been made of the cluster size, using reports ofnetworks deployed, manufacturers� guidelines, and some cluster sizetheory. That should make the results reasonably comparable, but thecapacity figures quoted here should be treated as estimates rather thanhard facts.
The following chapters examine each of the technology segmentsin detail.
Overview of technologies 163

The cordlesstechnologies
11.1 Introduction
Cordless systems are designed to replacewired phones and to provide mobility. In theoriginal concept of a cordless system, the userwould disconnect a standard wired telephonefrom the wall jack and replace the phone witha combined cordless home base station andportable handset. The user then could takecalls coming into the fixed line using a mobilephone.
A number of important design decisionsarose from such origins. First, the range of thephone from the base station needed to beonly around 200m, so low-power designswere used. Second, the phone and the basestation needed to be inexpensive, so thephone design was simple, avoiding compli-cated speech coders, channel equalizers, andso on. Third, frequency planning was not pos-sible since the users owned the base station aswell as the mobile, so the phones needed toseek a low-interference channel wheneverthey were used. All the technologies detailed
165
Contents
11.1 Introduction
11.2 DECT
11.3 PHS
11.4 CT-2
11.5 Summary ofcordless systems
11C H A P T E R
in this chapter have those fundamentals very much as a part of theirdesign.
Other applications for cordless phones soon were developed. A keyapplication is the replacement of an office private access branch exchange(PABX) and wired phones with a central cordless phone system able toprovide mobility and appropriate exchange functions. Systems designedfor that application typically use TDMA to allow the central PABX to useas few amplifiers as possible. DECT is an example of such a system.
The final application for which cordless has been adopted is knownunder a wide variety of names, most often telepoint. Telepoint is thedeployment of cordless base stations in streets and public areas to providea service that, at first, appears similar to cellular. The key difference is thatthe base station range is so low that coverage can be provided only inhigh-density areas, unlike cellular, which provides more ubiquitouscoverage. Telepoint systems in general have failed. The United Kingdomlaunched four networks, all of which failed, as did networks in France,Germany, and several other countries. Typically, the lack of coveragecompared to cellular makes the service unattractive. Telepoint has beensuccessful in a limited number of places, namely Singapore, Hong Kong,and more recently Tokyo, all high-density cities where the populacerarely leaves the city areas. In such cities, widespread deployment of cord-less base stations can be worthwhile because of the high user density andbecause relatively good coverage can be provided. The resulting highcapacity allows call charges to be lower than cellular, making the servicean attractive proposition. It is unlikely that there are many other cities inthe world where cordless would be successful in a telepoint application;its main sales will remain as home and office phones.
More recently, cordless technologies have been offered for WLL.From the description given here, it is apparent that the key characteristicsof cordless will be low range and low capacity. Some attempts havebeen made to extend the range using directional antennas, but cordlesssystems still remain relatively low range. However, the technology isrelatively inexpensive, and the need to deploy additional base stationsneed not incur a cost penalty over other radio systems.
It is worth dwelling in a little more detail on the comment that cord-less phones are low capacity because the conventional wisdom is thatcordless systems provide an extremely high capacity. Actually, becauseof the design decisions made to simplify the handset, the techniques
166 Introduction to Wireless Local Loop
normally adopted to increase spectrum efficiency, such as complexmodulation techniques, are not used in cordless phones and as a resultthey tend to use around four times as much spectrum per voice channelas cellular�hence they have a relatively low capacity. However, mostcordless office installations deploy numerous base stations throughoutthe building and the effect of a large number of low-capacity base stationsis a higher capacity than a single cellular base station deployed onnearby rooftops. Hence, the valid claim that when used as a cordlessoffice or home phone, cordless phones typically provide a high overallcapacity.
In the case of WLL there is a strong incentive to minimize the numberof base stations since each has a site rental, line connection, line rental,and power supply cost. On a per-base-station basis, cordless systemsprovide the lowest overall capacity. Only by deploying more base stationsthan other systems can their capacity be enhanced.
The key cordless technologies of DECT, PHS, and CT-2 are describednext. Readers wishing to know more about cordless systems shouldrefer to [1].
11.2 DECT
The digital enhanced cordless telephone (DECT) was standardized byETSI during the early 1990s, initially for use as a wireless office PABX.Only recently has it been suggested for deployment in WLL networks.DECT�s key strengths are good voice quality, the ability to provide highbandwidth, and the avoidance of frequency planning. Its weaknesses arelow capacity unless deployed within a short range and possible problemsas the range increases due to ISI. DECT-based WLL products are availablefrom a range of sources, including Siemens, Ericsson, and Alcatel.
DECT has a further advantage: the availability of unlicensed and stan-dardized spectrum. In most countries, especially in Europe, the frequencyband 1.88 to 1.9 GHz has been set aside for DECT. Therefore, operatorscan obtain spectrum easily, and manufacturers are able to achieve goodeconomies of scale with their equipment. Using the generic access proto-col (GAP) currently being developed, subscriber equipment from onemanufacturer should be able to interwork with network equipment froma different manufacturer, easing concerns over multisourcing.
The cordless technologies 167

DECT transmits using TDMA. Each radio channel is 1.728 MHz wide,into which a DECT carrier with a data rate of 1.152 Mbps is inserted.Radio channels are spaced 2 MHz apart. Because the data rate is signifi-cantly lower than the bandwidth, DECT allows adjacent channels to beused in the same cells, unlike most other radio standards. However, italso makes relatively inefficient use of the bandwidth available. Each1.152-Mbps bearer is divided into 24 timeslots. Nominally, 12 timeslotsare for base station-to-subscriber transmission, and 12 are for subscriber-to-base station transmission. That can be varied dynamically, however,if there is more information to be transmitted in one direction thanthe other.
Because of the transmission in both directions on the same fre-quency, DECT is said to be time division duplex (TDD). Literally, the timeis divided between the different duplex directions. TDD has a number ofadvantages, such as simpler RF design. It is important to note that the factthat the same radio channel is used in both directions makes the use ofantenna diversity simpler. This issue is explained next in more detail.
The fast-fading pattern changes as the frequency (and hence thewavelength) changes. It is possible for a mobile receiving on one fre-quency and transmitting on another 45 MHz away to have the downlinkin a fade but the uplink transmitting a signal that is received strongly atthe base station. One way of overcoming fades is antenna diversity. Insuch an arrangement, the receiver has two antennas positioned ideally atleast a wavelength apart. The hope is that if one antenna is in a fade, theother one is not. By taking the signal from the antenna with the strongestsignal during each burst, significant improvements in received error ratecan be achieved. This is known as spatial diversity. Unfortunately, the useof diversity antennas on the subscriber unit is often difficult. Because theunit is relatively small, it can be difficult to space the antennas far enoughapart, and the additional cost of a second antenna often can make theequipment uncompetitive. TDD provides a solution. When receiving atransmission, the base station decides which of its diversity antennas isreceiving the strongest signal. Because the base station will transmit onthe same channel back to the subscriber unit, it knows that if it transmitsfrom the antenna that received the strongest signal, then the subscriberunit will receive a good-quality signal. That way, a diversity path isachieved to the subscriber unit without the need for a second antenna inthe subscriber unit.
168 Introduction to Wireless Local Loop
TDD can lead to some confusion in a capacity comparison with anon-TDD system. For a non-TDD system, when capacity per megahertz isquoted, it is normal to actually quote capacity on a 2 × 1 MHz basis, that is,only the spectrum required on the downlink is counted and it is assumedthat equal spectrum is available on the uplink. For a fair comparison, TDDsystems should have the capacity calculated for a 2-MHz bandwidth. Thathas been performed throughout this book.
Within each of the 24 slots on the TDMA frame, a 32-Kbps bearercapability is provided. That allows ADPCM speech or a range of dataoptions. Slots can be concatenated to provide up to 552 Kbps per user(requiring 18 of the 24 slots), although that will prevent many other usersfrom accessing the base station at the same time.
DECT also has DCA, which was explained in Chapter 9. DCA allowsDECT systems both to exist without the need for frequency planning andto maximize the system capacity in cases where the interference fromsurrounding cells is relatively low.
The high data rate of DECT of 1.152 Mbps can cause some problemswith ISI. DECT does not have an equalizer; hence, any reflected pathswith an extra path length of 260m more than the main path can causeproblematic ISI. When an omnidirectional antenna is used in an urbanenvironment, the ISI problem tends to limit the range of DECT to under300m. However, when directional antennas are used at the subscriberequipment, the range can be extended substantially. Figure 11.1 showsthat, with a directional antenna with an overall beamwidth of 20 degrees,the subscriber unit can be positioned at least 23 km from the base stationbefore ISI becomes problematic. DECT has a relatively low transmitpower, so it is more likely that range would be constrained by inadequatesignal strength rather than ISI.
One key advantage of DECT is the simplicity of the system, resultingin relatively inexpensive equipment costs. Because highly complex radiotransmission methods and protocols have been avoided, DECT base sta-tions are available at only a fraction of the cost of cellular base stations.Further, with a large number of TDMA slots, 12 on one channel, the RFcosts are significantly reduced compared to other systems.
To illustrate a DECT system in more detail, information on theEricsson DRA1900 system is provided next. The system architecture isshown in Figure 11.2. The main components of the system are the radionode controller (RNC), the DECT access node (DAN), and the fixed access
The cordless technologies 169
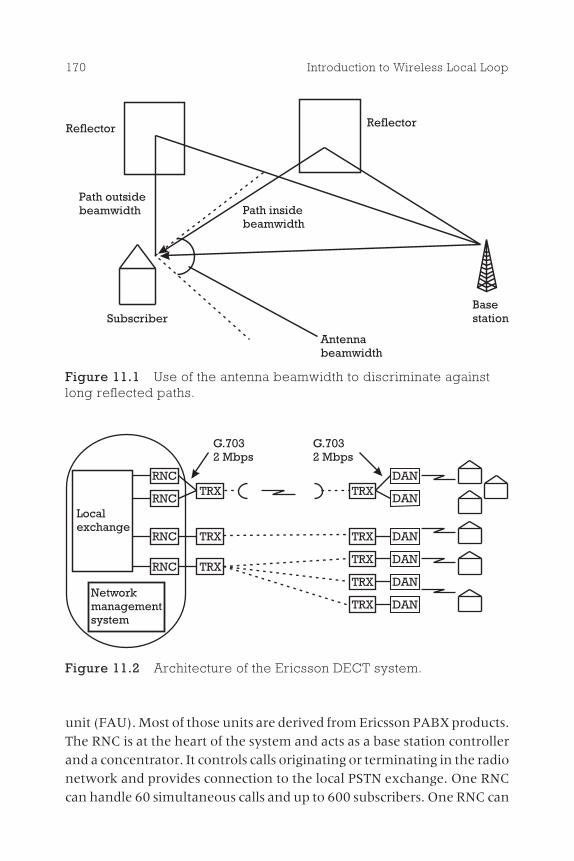
unit (FAU). Most of those units are derived from Ericsson PABX products.The RNC is at the heart of the system and acts as a base station controllerand a concentrator. It controls calls originating or terminating in the radionetwork and provides connection to the local PSTN exchange. One RNCcan handle 60 simultaneous calls and up to 600 subscribers. One RNC can
170 Introduction to Wireless Local Loop
Basestation
Antennabeamwidth
ReflectorReflector
Path insidebeamwidth
Path outsidebeamwidth
Subscriber
Figure 11.1 Use of the antenna beamwidth to discriminate againstlong reflected paths.
Localexchange
RNC
RNC
RNC
RNC
Networkmanagementsystem
TRX
TRX
TRX
TRX
TRX
TRX
TRX
TRX
DAN
DAN
DAN
DAN
DAN
DAN
G.7032 Mbps
G.7032 Mbps
Figure 11.2 Architecture of the Ericsson DECT system.
control up to eight base stations, although in high-traffic areas, the callvolume from a single base station will mean that one RNC per base stationmay be required.
To provide greater capacity, more than one RNC can be deployed.Note that while subscribers can roam within the area covered by a singleRNC, they cannot roam between different RNCs. That is unlikely to be aproblem in a WLL environment. Typically, the RNCs will be located at thelocal exchange site to economize on transmission resources. Because thelink between the base station and the RNCs sends voice using 32-Kbpscoding, while the link from the RNCs into the network uses 64-Kbpscoding, only half the resources are required if the RNCs are deployed inthis fashion; for a single RNC, all 60 calls can be accommodated on a single2-Mbps link.
The base station, or DAN, consists of a small cabinet and two antennasspaced about 2m apart to achieve sufficient spatial diversity. Typically,omnidirectional antennas are used, although directional antennas maybe required where high range is needed. Each cabinet contains six DECTtransceivers and a control unit that provides DAN control and multiplexesthe call traffic on the industry standard ITU-T G.703/704 2-Mbps connec-tion back to the RNC. The link might be wire, fiber, microwave, or radio.Drop-and-insert multiplexers can be used to connect DANs onto a ring ina bus configuration.
The fixed-access unit is installed at the subscriber�s premises. It iscomposed of a DECT transceiver, a line interface unit, an antenna, apower supply, and a battery backup. The line interface allows an ordi-nary analog telephone to be connected to the unit. Multiple line units(up to 12) can be provided easily by the connection of more line interfacesto the DECT transceiver.
DECT also has the possibility of deploying repeater units, which maybe useful if that is required to provide mobility in a limited area such as anoffice or shopping mall. The repeater unit works by receiving the data inone timeslot during the receive half of the TDD frame and retransmittingit, using a different antenna during the transmit half of the frame. Itessentially is a combination of a DECT terminal and a DECT base station.Repeaters are deployed in two ways:
1. The coverage-enhancement unit uses multiple directional anten-nas to extend the range of the DAN, providing coverage in
The cordless technologies 171
shadowed areas and connecting to the subscriber units in thenormal manner. It also can be used to overcome the problem ofnew buildings being erected after the network was planned.
2. The residential fixed repeater unit uses a directional antennato communicate with the DAN but then reradiates via an omni-directional antenna, creating a local microcell.
Although repeaters provide some flexibility, they have two signifi-cant faults. The first is that they add delay equivalent to the time delaybetween the receive and transmit parts of the TDD frame, some 10 ms intotal. The second is that they are inefficient with resources, requiringtwice as much spectrum to carry the call as if a repeater were not used.Nevertheless, in some situations they can be beneficial.
The DECT system also includes a network management componentthat manages all the RNCs connected to a local exchange and providesoperations and maintenance functionality. Like many operations-and-maintenance (O&M) platforms, it runs HP Openview as an operatingsystem, providing a graphical user interface to the network.
For a number of years after the standard was introduced, DECT failedto take off. In recent years, however, penetration has increased substan-tially, particularly in Germany. It may be that with success in the WLLmarket DECT will sell substantially around the world. Table 11.1 lists thekey parameters of DECT.
11.3 PHS
The personal handiphone system (PHS) is a Japanese standard for usein the 1,895- to 1,918-MHz frequency band. Between 1996 and the earlypart of 1998 it proved highly successful in telepoint applications inJapan, where the subscriber density is very high, and generated muchinterest in Asian-Pacific countries. However, toward the middle of 1998the dramatic rise in subscribers suddenly slowed and then subscribernumbers started to fall. This trend continued throughout 1998 with theresult that many PHS manufacturers and operators decided to leave themarket at the end of 1998. This slowdown appears to be yet anothercountry discovering that the use of cordless phones for a telepoint appli-cation is not a viable approach. It is hard to understand why the operators
172 Introduction to Wireless Local Loop

ever thought it would be viable, given the experience around the world,but pressure and incentives from the Japanese government are thoughtto have persuaded some that the market would be different this time. As aresult of this roller-coaster ride, PHS was in the ascendancy as a WLL tech-nology during the early part of 1998 and then started to lose its sparkleduring the latter part of 1998. It is now expected that it will only achieve asmall fraction of the sales that DECT will achieve in WLL deployments.
Like DECT, PHS is based on a TDMA-TDD approach. It uses a carrierspacing of 300 kHz, providing four channels, although typically oneof those channels will need to be used for control information. PHS uses32-Kbps ADPCM coding. Also like DECT it uses DCA to optimally selectthe best frequency. Table 11.2 lists the key parameters of PHS.
11.4 CT-2
CT-2 initially was developed in the United Kingdom as an alternative toanalog cordless home phones. Before its development was complete,however, a number of operators suggested that it should be deployed fortelepoint. The subsequent failure of telepoint networks in most countrieshas tended to brand CT-2 as a failed standard. In practice, CT-2 equipment
The cordless technologies 173
T a b l e 1 1 . 1Key Parameters of DECT
Services
Telephony Yes, good voice quality
ISDN Yes
Fax Yes
Data Yes, up to 552 Kbps
Videophone Potentially
Supplementary services Wide range
Multiple lines Up to 12
Performance
Range (radius) Up to 5 km
Cells per 100 km2 1.3
Capacity per cell, 2 × 1 MHz 5.2
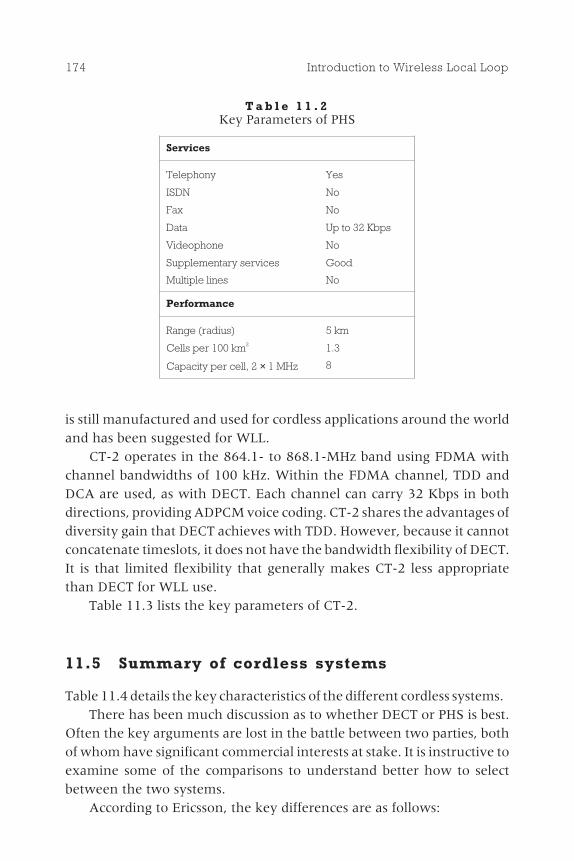
is still manufactured and used for cordless applications around the worldand has been suggested for WLL.
CT-2 operates in the 864.1- to 868.1-MHz band using FDMA withchannel bandwidths of 100 kHz. Within the FDMA channel, TDD andDCA are used, as with DECT. Each channel can carry 32 Kbps in bothdirections, providing ADPCM voice coding. CT-2 shares the advantages ofdiversity gain that DECT achieves with TDD. However, because it cannotconcatenate timeslots, it does not have the bandwidth flexibility of DECT.It is that limited flexibility that generally makes CT-2 less appropriatethan DECT for WLL use.
Table 11.3 lists the key parameters of CT-2.
11.5 Summary of cordless systems
Table 11.4 details the key characteristics of the different cordless systems.There has been much discussion as to whether DECT or PHS is best.
Often the key arguments are lost in the battle between two parties, bothof whom have significant commercial interests at stake. It is instructive toexamine some of the comparisons to understand better how to selectbetween the two systems.
According to Ericsson, the key differences are as follows:
174 Introduction to Wireless Local Loop
T a b l e 1 1 . 2Key Parameters of PHS
Services
Telephony Yes
ISDN No
Fax No
Data Up to 32 Kbps
Videophone No
Supplementary services Good
Multiple lines No
Performance
Range (radius) 5 km
Cells per 100 km2 1.3
Capacity per cell, 2 × 1 MHz 8
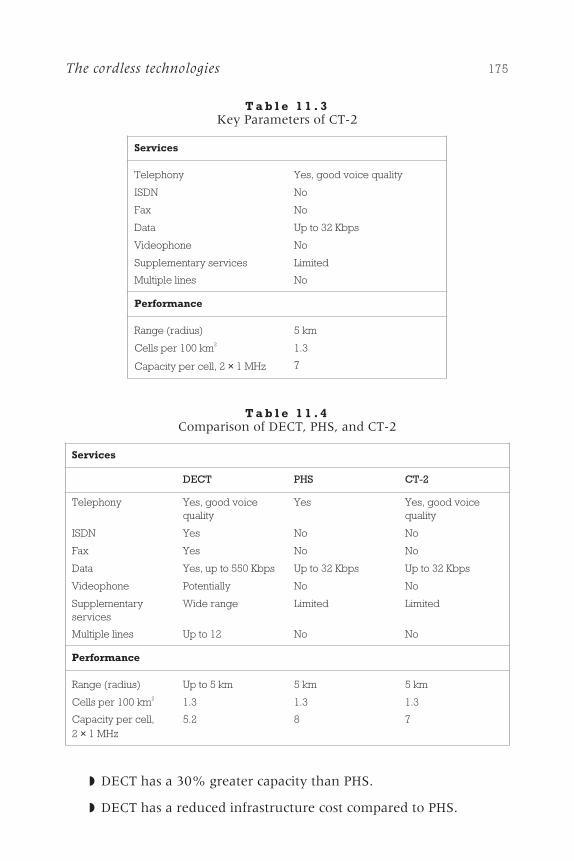
◗ DECT has a 30% greater capacity than PHS.
◗ DECT has a reduced infrastructure cost compared to PHS.
The cordless technologies 175
T a b l e 1 1 . 3Key Parameters of CT-2
Services
Telephony Yes, good voice quality
ISDN No
Fax No
Data Up to 32 Kbps
Videophone No
Supplementary services Limited
Multiple lines No
Performance
Range (radius) 5 km
Cells per 100 km2 1.3
Capacity per cell, 2 × 1 MHz 7
T a b l e 1 1 . 4Comparison of DECT, PHS, and CT-2
Services
DECT PHS CT-2
Telephony Yes, good voicequality
Yes Yes, good voicequality
ISDN Yes No No
Fax Yes No No
Data Yes, up to 550 Kbps Up to 32 Kbps Up to 32 Kbps
Videophone Potentially No No
Supplementaryservices
Wide range Limited Limited
Multiple lines Up to 12 No No
Performance
Range (radius) Up to 5 km 5 km 5 km
Cells per 100 km2 1.3 1.3 1.3
Capacity per cell,2 × 1 MHz
5.2 8 7
◗ DECT is easier to plan.
◗ DECT has a lower tolerance to ISI.
◗ DECT can provide 64 Kbps and ISDN bearers whereas PHS cannot.
◗ DECT can provide repeaters.
◗ DECT can interwork with GSM.
◗ DECT systems exist better in an uncontrolled environment.
According to Fujitsu, the key differences are as follows:
◗ PHS has a lower delay.
◗ PHS has a reduced infrastructure cost.
◗ PHS has a greater capacity.
◗ PHS has simpler connection to the PSTN.
◗ PHS base stations have lower power consumption.
Most of those claims have been discussed. However, it is worth examiningthe capacity issue in more detail. The starting point is to note that DECThas 12 traffic channels per 2-MHz bandwidth, that is, six per megahertz,while PHS has four traffic channels per 300-kHz bandwidth, or 13 permegahertz. However, PHS requires around 3 dB more cochannel protec-tion as a result of its more complex modulation scheme, increasing thecluster size that must be used. The effect of that on the cluster size can bemodeled as follows. According to Lee [2], the cluster size is given by
K SIR= ⋅23 (11.1)
Hence, the cluster size of DECT, with a SIR of around 9 dB, will be 2.3,whereas the cluster size for PHS with a 3-dB greater cluster size willbe 3.2. Factoring that into the capacity results in a DECT capacity percell of 2.6 voice channels/cell/MHz, while PHS achieves four voicechannels/cell/MHz. (Remember, the figures quoted in the tables are for2 × 1 MHz, so they are twice those quoted in this paragraph.)
The question of infrastructure cost is more difficult to evaluate untilthe actual costs of the different base stations are known. DECT propo-nents contend that fewer DECT transceivers are required because each
176 Introduction to Wireless Local Loop
transceiver provides 12 channels compared to the 4 of PHS. Ericssonclaims that a DECT base station will cost 1.1 times as much as a PHS basestation but will provide three times the capacity, hence the overall reduc-tion in infrastructure costs. Most likely, the base station costs will bedominated by the economies of scale achieved and not the manufacturingdifficulties. In this area, it remains to be seen which technology willachieve the most.
In terms of delay, PHS does have a shorter delay than DECT, but forboth systems the delay is so small as to be insignificant (unless DECTrepeaters are used). Simplicity of connection to the PSTN and base stationpower consumption probably are of little relevance.
Perhaps the most interesting differences between DECT and PHS liein the services each can provide. DECT clearly is much better able to pro-vide high bandwidth and multiple line per subscriber services than PHS.Given that the spectrum efficiency is relatively similar and costs probablynot too dissimilar, it is that improved functionality that gives DECT theedge over PHS.
As a final point of note, the PHS spectrum allocation is not assured inthe Central European Post and Telecommunications (CEPT) countries.Hence, it may prove more difficult to deploy PHS than DECT from aspectrum allocation viewpoint in all but the Asian-Pacific countries.
References
[1] Tuttleby, W., ed., Cordless Telecommunications World-Wide, Berlin, Germany:Springer-Verlag, 1996.
[2] Lee, W. C. Y., �Spectrum Efficiency in Cellular,� IEEE Trans. Vehicular Tech.,Vol. 38, No. 2, May 1989, pp. 69�75.
The cordless technologies 177

The cellulartechnologies
12.1 Introduction
In all probability, most readers will have acellular phone, so a description here of theservice offered is largely unnecessary. Cellu-lar phones have been immensely successful,first in the 1980s with analog systems andthen in the 1990s with second-generationdigital systems. The key strengths of cellularinclude good coverage, excellent immunity tochannel errors, excellent economies of scaleas a result of high sales, and advanced andfully featured phones. Given the use of cellu-lar in some of the first WLL applications, it isonly natural that cellular should find itself akey WLL technology.
Cellular technologies also might seem tobe the natural choice where cellular operatorshave been given WLL licenses (although theprovision of dual licenses has not been awidespread occurrence). The use of cellulartechnology for WLL would bring benefitsin terms of economies in operations andmaintenance. However, mobile operators
179
Contents
12.1 Introduction
12.2 Analog cellular
12.3 Digital cellular
12.4 Future cellularsystems
12.5 Summary ofcellular systems
12C H A P T E R
typically will not want to use their mobile spectrum for fixed applicationsand for that reason may select a different technology in a different band.
When applied to WLL, cellular brings the advantages of immediateavailability, inexpensive subscriber equipment, and proven systems. Ithas good range and can offer mobility if required. However, it also brings ahost of problems, including relatively poor speech quality (although thisis improving); expensive network infrastructure configured to handlemobility, handover, and so on (which is no longer required); and aneed to use spectrum dedicated to cellular services (which tends to beexpensive).
There are a number of analog cellular systems, but generally they areso similar that it is sufficient to describe one typical system to characterizethem all. Broadly speaking, there are three digital systems: GSM, cdma-One (previously known as IS-95), and IS-136. GSM1800 and GSM1900are simply variants of GSM operating at different frequencies. IS-136and GSM are both TDMA based, and it is sufficient to describe just oneto characterize the systems. CdmaOne is CDMA based and must bedescribed in detail to understand its key attributes.
12.2 Analog cellular
Analog cellular has been deployed widely throughout most of the FirstWorld countries since the mid-1980s. It is slowly being withdrawn as digi-tal cellular networks are rolled out. Its key attraction for WLL lies in thefact that it is readily available and relatively inexpensive. Its key problemsare that it lacks facilities and has poor voice quality. The wide deploymentof analog cellular is expected to decrease in the future as digital andproprietary equipment becomes more readily available. As far as WLLoperations are concerned, all the analog cellular systems are more or lessidentical. The total access communications system (TACS) is describedhere as an example.
A TACS network consists of a number of base stations connecteddirectly to a switch. Switches are interconnected and are connected intothe PSTN. The TACS system allows for registration, tracking, and handoff,but because those features are irrelevant for WLL, they are not discussedfurther here.
TACS operates in the 900-MHz band using a 25-kHz channel spacingand a 45-MHz duplex spacing. Each TACS network also requires at
180 Introduction to Wireless Local Loop

least 21 channels to be reserved for control purposes. The control chan-nels provide paging information, allow random access, and provide themobiles with information on the system status.
Speech is carried within the radio channel using analog FM with apeak deviation of 9.5 kHz. That deviation is relatively high, resultingin significant adjacent channel interference. For that reason, adjacentchannels cannot be used in the same cell.
One major problem of TACS is that when a mobile is in a voice call,signaling must also be sent over the same channel. When a signalingmessage is being sent, the radio momentarily mutes the audio path,which results in occasional loss of a syllable of voice. The effect is a slight,but noticeable, degradation in speech quality.
Some of the key parameters of TACS are provided in Table 12.1. Incalculating the capacity, a cluster size of 12 was assumed, which, ifanything, results in an optimistic assessment.
12.3 Digital cellular
There are two key digital cellular systems, those based on TDMA tech-nology and those based on CDMA technology. Examples of both areprovided in this section.
The cellular technologies 181
T a b l e 1 2 . 1Key Parameters of TACS
Services
Telephony Relatively poor quality
ISDN No
Fax No
Data Limited, perhaps 1.2 Kbps
Videophone No
Supplementary services Limited range
Multiple lines No
Performance
Range (radius) Up to 35 km where topographyallows
Cells per 100 km2 0.026
Capacity per cell, 2 × 1 MHz 3.3 voice calls

12.3.1 GSM
GSM is a TDMA digital cellular system deployed in more than 120 coun-tries around the world. It is the nearest piece of equipment yet to becomea global mobile standard. It has been extremely successful as a result ofgood technical design and the fact that it is an open standard allowingoperators to multisource equipment both on the network and mobileside. For a full description of GSM, see [1].
A GSM network consists of base stations connected to base stationcontrollers (BSCs), which are connected in turn to switches. The switchesin the network are interconnected, and there is a single O&M and billingplatform located in the network.
GSM divides the spectrum into 200-kHz TDMA channels. Eachchannel is modulated with the use of Gaussian minimum shift key-ing (GMSK), resulting in significant adjacent channel interference. Aswith TACS, it is not possible to use the adjacent channel in the samecell. The 200-kHz channels are clustered with a cluster size of around9. Some manufacturers claim that much smaller cluster sizes can beachieved if frequency hopping is employed. Further, directional antennaswould help reduce the cluster size in a WLL network. Hence, theassumption is made here that a cluster size of 4 could be realized in aWLL deployment.
Each 200-kHz channel is divided into 8 full-rate voice channels or16 half-rate voice channels. The half-rate channels use a lower rate coder,which generally is perceived to be of a lower speech quality. Nevertheless,the important capacity savings mean that some cellular operators aredeploying half-rate systems. Each voice channel has an associated controlchannel. This channel allows information such as the frequencies ofsurrounding cells to be passed to the mobile and for the mobile to returnmeasurement information without causing the break in speech thatwould occur in TACS. At least one voice channel per cell needs to beset aside as a control channel, providing paging and cell broadcastinformation.
GSM employs 13-Kbps speech coding using a complex RPE-LTPcoder. That provides speech quality that is better than analog cellular buttypically inferior to ADPCM coders. In 1998, the GSM speech coder wasenhanced with the so-called enhanced full-rate coder, which provides asignificant improvement in voice quality, nearly to a level equal toADPCM.
182 Introduction to Wireless Local Loop
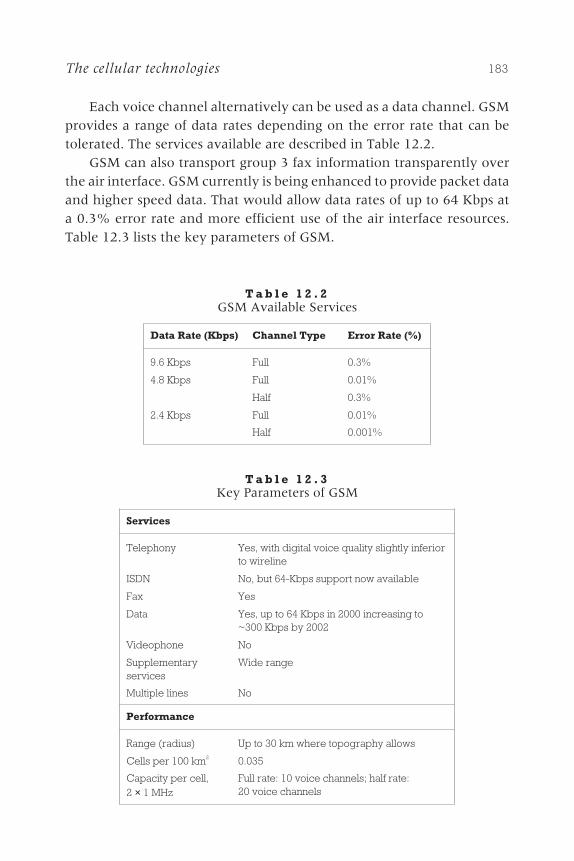
Each voice channel alternatively can be used as a data channel. GSMprovides a range of data rates depending on the error rate that can betolerated. The services available are described in Table 12.2.
GSM can also transport group 3 fax information transparently overthe air interface. GSM currently is being enhanced to provide packet dataand higher speed data. That would allow data rates of up to 64 Kbps ata 0.3% error rate and more efficient use of the air interface resources.Table 12.3 lists the key parameters of GSM.
The cellular technologies 183
T a b l e 1 2 . 2GSM Available Services
Data Rate (Kbps) Channel Type Error Rate (%)
9.6 Kbps Full 0.3%
4.8 Kbps Full 0.01%
Half 0.3%
2.4 Kbps Full 0.01%
Half 0.001%
T a b l e 1 2 . 3Key Parameters of GSM
Services
Telephony Yes, with digital voice quality slightly inferiorto wireline
ISDN No, but 64-Kbps support now available
Fax Yes
Data Yes, up to 64 Kbps in 2000 increasing to~300 Kbps by 2002
Videophone No
Supplementaryservices
Wide range
Multiple lines No
Performance
Range (radius) Up to 30 km where topography allows
Cells per 100 km2 0.035
Capacity per cell,2 × 1 MHz
Full rate: 10 voice channels; half rate:20 voice channels
It is perhaps a surprise that GSM has had very little exposure as aWLL technology given its success as a mobile technology. At the end of1998 only one manufacturer�Nokia�was actively promoting a GSMWLL system, although some others, such as Motorola, were sellingthe subscriber elements of the WLL system. Instead, almost all focus oncellular WLL has been on cdmaOne systems. There may be a number ofreasons for this. First, GSM mobile systems exist in most countries in theworld, utilizing all of the GSM spectrum, so any GSM WLL activity wouldneed to be in a different spectrum band outside of those standardized forGSM. This is not the case with cdmaOne, which works in bands adjacentto the GSM bands and thus can be deployed in countries with GSMmobile systems. Another issue may be its great success as a cellularstandard, which means that most GSM manufacturers are devoting alltheir resources to continued development of their cellular system and seelittle merit in the development of a WLL variant. Most analysts predictthat this situation will continue and that GSM will not be a major factor inWLL sales.
12.3.2 cdmaOne
The cdmaOne standard for cellular communications is heavily basedupon the CDMA technology designed by the American company Qual-comm. The standard has gained some success in the United States andAsian-Pacific regions entering deployment during 1997 and 1998. Its pro-ponents have claimed that its major advantage is a significant capacityincrease over other cellular systems. That increase has proved impossibleto calculate or simulate, but now that the first results are available fromdeployed networks, it can be stated with some confidence.
The cdmaOne standard specifies only the air interface, allowingequipment manufacturers to design the network in whatever mannerthey deem appropriate. In practice, many manufacturers have adoptedthe GSM design principles; hence, base stations connect back to BSCs andthen to switches.
The system uses single-cell clusters, in which each base stationtransmits its CDMA signal on the same carrier. The carrier bandwidth is1.228 MHz, and there is a duplex spacing of 45 MHz.
The downlink transmission consists of a permanent pilot tone and anumber of radio channels. The pilot tone is used by the mobile to estimate
184 Introduction to Wireless Local Loop
the path loss, so as to set power control initially, and to acquire synchroni-zation to the codeword generator. Other channels are set aside for pagingand other downlink information. Speech is encoded using a variable-ratecodec, where the bit rate depends on the talker activity. That reducesinterference to other users of the CDMA channel. Channel coding thenis applied to generate a transmitted bit rate of 19.2 Kbps, which is thenspread by a 64-chip Walsh code sequence to generate the 1.228-Mbpstransmitted waveform.
The uplink transmission is slightly different. Speech is generatedin the same manner, but higher rate coding is used to give a bitstream of28.8 Kbps. The interleaved bits are then grouped into 6-bit symbols, andeach symbol addresses a lookup table containing a particular Walsh code.That spreads the signal to 307.2 kchips/s. Because other mobiles couldselect the same Walsh code, further spreading is required. Each mobilegenerates a unique PN sequence at 1.228 Mbps, which is used to spreadthe data to the full transmitted bandwidth.
Calculation of the capacity of a CDMA system is extremely difficult.As explained in Chapter 9, some approximations can be made. However,perhaps more useful are the results from real deployments where up to15 voice channels per carrier were employed. This was achieved with the13-Kbps voice codec described next. CDMA has a key advantage overTDMA in that when a new sector is added, the capacity is increased by anextra 15 channels. In TDMA, the addition of new sectors provides onlylimited capacity gains. That makes it difficult to perform a strict compari-son of the different technologies. Here, a single sector per cell has beenassumed, but it is noted that the CDMA system can be enhanced morereadily than the TDMA system.
Even more complexity is added when the technology is deployedas a WLL rather than a mobile system. In this case, a number offactors contribute to the capacity being higher than in the mobile case,including:
◗ Because the terminals are stationary, the rate of change of thechannel is much less and as a result power control errors are muchsmaller.
◗ Because the signal is more likely to arrive via a LOS or near-LOSpath, the fading environment is less severe and hence the SNRrequired is lower.
The cellular technologies 185
◗ Because buildings provide shielding from adjacent cells, the inter-ference received by both the user terminals and the base stationsfrom adjacent cells is lower.
The net result of these factors is a dramatic increase in capacity. Insimulations and early deployment work, Motorola has noted that it canbe possible to increase the capacity to 30 voice channels per sector forcases in which the user terminals are on upstairs floors or an externalantenna is used. In cases for which the user terminal is on lowerfloors, the capacity might be around 22 voice channels per carrier. Thisnear doubling in capacity over the mobile case is something that is typi-cally only achieved with CDMA and gives it a substantial edge over othercellular technologies for WLL in terms of capacity.
When cdmaOne was first standardized, it used an 8-Kbps proprietaryvoice codec designed by Qualcomm. However, there was some concernabout the voice quality that could be supported with this codec. Thus, asecond codec was introduced, similar to the GSM codec and working at13 Kbps. The majority of network operators were selecting this 13-Kbpscodec until 1999, when an enhanced variable rate codec (EVRC) oper-ating at 8 Kbps was introduced.
The cdmaOne standard is relatively poor at supporting fax and data.Both can be carried with modem support up to around 9.6 Kbps, butthe range of services provided by GSM is not available. These servicesare likely to be introduced during 2000 as part of the IS-95B standard.Table 12.4 lists the key parameters of cdmaOne.
12.4 Future cellular systems
Substantial work is being carried out on the next generation of mobileradio systems, which are expected to appear between 2002 and 2005.Although no information is available on whether those systems will bedesigned such that they are applicable to WLL, it seems likely that thetechnology eventually will be suggested for WLL. Very little is knownabout these systems, including their data rates, facilities, and so on, so it isnot possible at this stage to know whether they will be attractive for WLLoperation. This section briefly describes the ideal third-generation mobilesystems.
186 Introduction to Wireless Local Loop

First, before the start of any explanation of the third-generation ideal,it is important to understand certain terminology. In Europe the nextgeneration has been named the Universal Mobile TelecommunicationsSystem (UMTS). At a worldwide level, it has been termed InternationalMobile Telecommunications (IMT-2000).
The vision of UMTS, which is shared to a large extent by those outsideEurope, has been articulated in many slightly differing ways but can besummarized as �communication to everyone everywhere.� Communica-tion in this instance might include the provision of information. It willbe a system that everyone will use regardless of whether they are inthe office, at home, or on an airplane. To achieve that goal, the systemessentially must provide the following features:
◗ An extensive feature set to appeal to all the current disparate usersof different types of radio systems such as:
◗ Cellular users, who require high voice quality and good coverage;
◗ Users who currently deploy their own private systems (oftenknown as PMR users), who require group and broadcast calls,rapid channel access, and low cost;
The cellular technologies 187
T a b l e 1 2 . 4Key Parameters of cdmaOne
Services
Telephony Yes, with voice quality similar to or slightlybetter than GSM
ISDN No
Fax Yes, using a modem
Data Up to 9.6 Kbps
Videophone No
Supplementary services Limited range
Multiple lines No
Performance
Range (radius) 30 km under good topographic conditions
Cells per 100 km2 0.035
Capacity per cell, 2 × 1 MHz 24 per sector

◗ Paging users, who require a small terminal and good coverage;
◗ Cordless users, who require excellent communications with highdata rates when in the office or home;
◗ Satellite users, who require truly worldwide coverage;
◗ Users in airplanes, who currently have limited system availability;
◗ Data users, whose requirements range from telemetry to remotecomputer network access.
◗ Ubiquitous coverage with a wide range of cells such as:
◗ Satellite cells covering whole countries;
◗ Macrocells covering a radius of up to 30 km;
◗ Minicells covering up to around 3 km;
◗ Microcells covering a few streets;
◗ Picocells covering an office, a train, an airplane, and so on.
Major players in this area postulate that these goals will be achievedthrough a system with the following characteristics:
◗ An adaptive air interface such that access methods such as CDMA,TDMA, and FDMA can be selected as appropriate with bandwidthsdependent upon the service required and a data rate of up to 2 Mbpsavailable in some locations;
◗ Mobiles that can have their �operating system� downloaded toallow for network evolution;
◗ An architecture based on intelligent network principles.
The system must also integrate seamlessly with the fixed network suchthat users receive nearly identical services whether they are using fixed ormobile phones. Current predictions as to the timescales of third-generationsystems vary slightly, but typically the following assumptions are made:
◗ Standardization completed, 2000;
◗ First product available, 2002;
◗ Product widely available, 2005.
188 Introduction to Wireless Local Loop

The advent of UMTS offers the opportunity to design a much bet-ter WLL product than is currently available, making a better balancebetween price and features. This can be understood better by starting withthe requirements of operators and users. The �perfect� WLL productwould be one that can be deployed in all markets around the world. Itwould be inexpensive, able to operate in any frequency band, andprovide an excellent range of facilities. It should be equally capable ofvoice telephony, Internet access, and file transfer.
The design philosophy would be similar to that employed whendesigning the ATM packet data standard for fixed systems: to providea transport mechanism able to handle circuit and packet switched trans-mission equally well. However, ATM is designed to work best at data ratesof above 2 Mbps per user, is relatively inefficient of resources, and is notwell suited to direct transfer to a WLL environment. A different, packet-based protocol would be required to maximize the bandwidth available tothe users in the limited spectrum resource.
The outline form of the perfect WLL product would be as follows:
◗ The system would be packet based, with negotiated bandwidth anddelay at the start of a session. Hence, it could provide services fromvoice and video through e-mail on the same bearer at maximumefficiency. Packets would be small with minimal headers and couldbe based initially on the principles adopted within the packet radiosystems developed for mobile standards such as GSM.
◗ The technology would utilize software on the computing platformthat was acting as the data source in order to format data into aform suitable for transmission. This would ensure that it would bepossible to accommodate most future applications.
◗ The air interface would be based on UMTS.
◗ The infrastructure would be based around a packet switch, provid-ing interfaces to circuit and packet switched networks.
Such a product would go some way toward overcoming the �broadbandproblem� discussed in Section 6.2. It would allow operators to buy anddeploy a narrowband system at narrowband prices, with the knowledgethat if the subscribers increased their requirements, all they would needto do is provide, or sell, subscribers the software for their PCs, which could
The cellular technologies 189
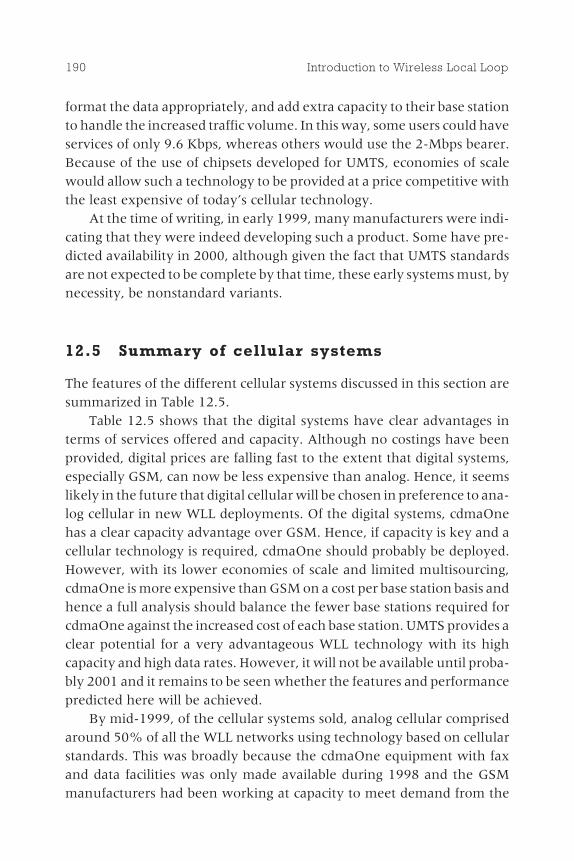
format the data appropriately, and add extra capacity to their base stationto handle the increased traffic volume. In this way, some users could haveservices of only 9.6 Kbps, whereas others would use the 2-Mbps bearer.Because of the use of chipsets developed for UMTS, economies of scalewould allow such a technology to be provided at a price competitive withthe least expensive of today�s cellular technology.
At the time of writing, in early 1999, many manufacturers were indi-cating that they were indeed developing such a product. Some have pre-dicted availability in 2000, although given the fact that UMTS standardsare not expected to be complete by that time, these early systems must, bynecessity, be nonstandard variants.
12.5 Summary of cellular systems
The features of the different cellular systems discussed in this section aresummarized in Table 12.5.
Table 12.5 shows that the digital systems have clear advantages interms of services offered and capacity. Although no costings have beenprovided, digital prices are falling fast to the extent that digital systems,especially GSM, can now be less expensive than analog. Hence, it seemslikely in the future that digital cellular will be chosen in preference to ana-log cellular in new WLL deployments. Of the digital systems, cdmaOnehas a clear capacity advantage over GSM. Hence, if capacity is key and acellular technology is required, cdmaOne should probably be deployed.However, with its lower economies of scale and limited multisourcing,cdmaOne is more expensive than GSM on a cost per base station basis andhence a full analysis should balance the fewer base stations required forcdmaOne against the increased cost of each base station. UMTS provides aclear potential for a very advantageous WLL technology with its highcapacity and high data rates. However, it will not be available until proba-bly 2001 and it remains to be seen whether the features and performancepredicted here will be achieved.
By mid-1999, of the cellular systems sold, analog cellular comprisedaround 50% of all the WLL networks using technology based on cellularstandards. This was broadly because the cdmaOne equipment with faxand data facilities was only made available during 1998 and the GSMmanufacturers had been working at capacity to meet demand from the
190 Introduction to Wireless Local Loop
cellular operators and hence were disinclined to target the WLL market-place. This situation has now changed and it is predicted that very fewWLL networks based on analog cellular technology will be announcedin the coming years. There seems to be widespread agreement thatcdmaOne will be the dominant WLL technology over the coming 5 years,possibly with UMTS overtaking it toward the end of that period.
Reference
[1] Mouly, M., and M-B. Pautet, The GSM System for Mobile Communications,published by the authors, ISBN 2-9507190-0-7.
The cellular technologies 191
T a b l e 1 2 . 5Comparison of TACS, GSM, cdmaOne, and UMTS
Services
TACS GSM cdmaOne UMTS
Telephony Relatively poorquality
Yes, slightlyinferior quality
Yes, slightlyinferior quality
Yes, wirelinequality
ISDN No No No Yes
Fax No Yes Yes Yes
Data Limited, perhaps1.2 Kbps
Yes, up to9.6 Kbps
Up to 9.6 Kbps Up to 2 Mbps
Videophone No No No Potentially
Supplementaryservices
Limited range Wide range Wide range Wide range
Centrex No No No No
Multiple lines No No No Yes
Performance
Range (radius) Up to 35 km Up to 30 km 30 km Probably~15 km
Cells/100 km2 0.026 0.035 0.035 0.14
Capacity percell, 2× 1 MHz
3.3 voice calls 10 voicechannels
24 voicechannels persector
Probablyaround 30 voicechannels persector


The proprietarytechnologies
13.1 Introduction
Proprietary technologies are defined as thosedesigned specifically for WLL, so it mightbe imagined that they would be superior tothe cordless and cellular technologies. Tech-nically, that is probably true, but just ascustom-made suits are not for all, bespokeWLL technologies are unlikely to be found inall networks.
The proprietary technologies generallyshare the following characteristics not avail-able in the other technologies:
◗ They all offer a wide range of services,including ISDN support.
◗ They operate in frequency bands above2 GHz.
◗ They provide excellent voice quality.
Proprietary technologies typically are moreexpensive than cellular and cordless. However,in some environments the advantages listed
193
Contents
13.1 Introduction
13.2 The TDMAtechnologies
13.3 The CDMAtechnologies
13.4 Othertechnologies
13.5 Summary
13C H A P T E R
above are so overwhelming that the cost increment is not relevant.Note that proprietary solutions offering data rates in excess of 2 Mbps areconsidered in the following chapter on broadband technologies.
The wide range of proprietary technologies is increasing monthly. Noattempt is made here to explain all the technologies. Instead, those tech-nologies that either are particularly popular or have some particularlyunusual characteristics are explained. To form some sort of grouping,technologies are split as to whether they are TDMA or CDMA. In somecases, because of confidentiality issues, only relatively small amountsof information could be gathered on certain systems. Also, many of thetechnologies are not in full commercial operation, so key figures such ascapacity are estimates.
13.2 The TDMA technologies
13.2.1 Nortel Proximity I
Nortel makes a range of WLL systems under the Proximity banner.Many of these are based on cordless or cellular technologies. However,Proximity I is a TDMA system developed in conjunction with the U.K.WLL operator Ionica, one of the very first operators in the world to deploya proprietary WLL system. Proximity I was one of the leading proprietarytechnologies at the end of 1998 but suffered a setback when Ionica, oneof its key customers, went into receivership and Nortel closed their U.K.factory as a result.
Proximity I offers a wide range of services, including 64-Kbps voiceand data links and a second-line capability. Subscriber units link to basestations over the air interface, and base stations are then connecteddirectly back to a PSTN switch. Each subscriber unit provides two lines.
The system uses TDMA channels with bandwidth of 307 kHz in a clus-ter size of 3, transmitting 512 Kbps over the channel using quadraturephase shift keying (QPSK) modulation. Up to 54 TDMA bearers can beaccommodated in the 3.4- to 3.6-GHz assignment using frequency divi-sion duplex (FDD) with a maximum of 18 channels on any given base sta-tion. Each TDMA channel can support ten 32-Kbps data channels. DCA isnot provided, but it is relatively easy to reconfigure the frequency assign-ment from the operations and maintenance center. Table 13.1 lists thesystem�s key parameters.
194 Introduction to Wireless Local Loop

13.2.2 Innowave Multigain
Innowave will not be happy to see its system classified as TDMArather than CDMA. They actually market it as an FH-CDMA/TDMA sys-tem. However, according to the terminology adopted in this book (seeChapter 8), their system is in fact an FH-TDMA system. Given the rela-tively small size and exposure of Innowave, they have been remarkablysuccessful in deploying their system to date, and a number of operationalnetworks around the world are using this technology.
In the Innowave system, users transmit in a given TDMA slot. How-ever, the actual frequency in which they transmit changes from burst toburst, where a burst lasts 2 ms (hence, there are 500 hops/s). In a givencell, no two users transmit on the same frequency at the same time. How-ever, users may transmit on the same frequency in adjacent cells. Byemploying different hopping sequences in adjacent cells, if a collisiondoes occur it will be only for a single burst. Error correction and interleav-ing can largely overcome the effect of such a collision. The system hasthe advantages of the simplicity of a TDMA system coupled with someof the �interference-sharing� properties that make CDMA spectrally effi-cient. Innowave claims that a cluster size of 1.25 can be achieved by thatapproach when directional antennas are deployed. In practice, that seems
The proprietary technologies 195
T a b l e 1 3 . 1Key Parameters of Nortel Proximity I
Services
Telephony Yes, high-quality voice
ISDN For future release
Fax Yes
Data Yes, up to 64 Kbps
Videophone No
Supplementary services Wide range
Multiple lines Two lines
Performance
Range (radius) Up to 15 km in rural areas
Cells per 100 km2 0.14
Capacity per cell, 2 × 1 MHz 11

somewhat optimistic, and it might be expected that a cluster size of 2would be more realistic.
The system uses a voice coder of 32 Kbps. It employs TDD, in whichboth the uplink and downlink are transmitted on the same frequency butat different times. Each 1 × 1 MHz channel supports eight voice channels.Hence, 16 voice channels per 2 × 1 MHz can be supported before the clus-ter effect is taken into account, and assuming a cluster size of 2, around8 voice channels/cell/2 × 1 MHz. Table 13.2 lists the key parameters ofthe Innowave Multigain system.
13.3 The CDMA technologies
13.3.1 Airspan Communications
The Airspan system was developed by DSC in conjunction with BT whoare using the system for rural access at 2 GHz. During 1998 DSC spun off aseparate venture called Airspan Communications to develop and sellthe product. It provides 64-Kbps voice channels and support for up to144-Kbps ISDN services. Airspan claims a cluster size of between 1 and 3depending on the environment.
Voice is provided using 64-Kbps PCM or ADPCM at 32 Kbps. Thesystem currently provides 2B + D ISDN per subscriber or, alternatively,
196 Introduction to Wireless Local Loop
T a b l e 1 3 . 2Key Parameters of Innowave Multigain
Services
Telephony Yes, good voice quality
ISDN For future release
Fax Yes
Data Yes, up to 32 Kbps
Videophone No
Supplementary services Yes
Multiple lines 1 to 4 lines
Performance
Range (radius) Up to 6 km in rural areas
Cells per 100 km2 0.88
Capacity per cell, 2 × 1 MHz 8
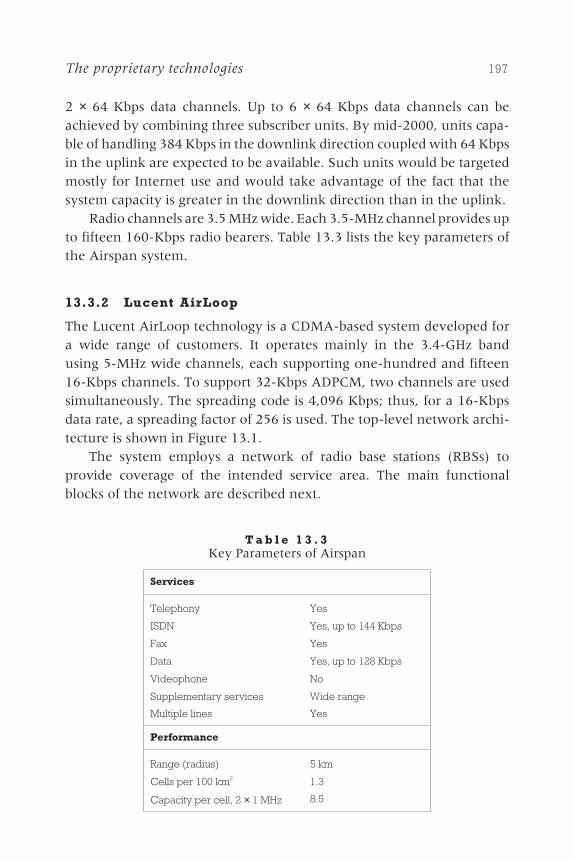
2 × 64 Kbps data channels. Up to 6 × 64 Kbps data channels can beachieved by combining three subscriber units. By mid-2000, units capa-ble of handling 384 Kbps in the downlink direction coupled with 64 Kbpsin the uplink are expected to be available. Such units would be targetedmostly for Internet use and would take advantage of the fact that thesystem capacity is greater in the downlink direction than in the uplink.
Radio channels are 3.5 MHz wide. Each 3.5-MHz channel provides upto fifteen 160-Kbps radio bearers. Table 13.3 lists the key parameters ofthe Airspan system.
13.3.2 Lucent AirLoop
The Lucent AirLoop technology is a CDMA-based system developed fora wide range of customers. It operates mainly in the 3.4-GHz bandusing 5-MHz wide channels, each supporting one-hundred and fifteen16-Kbps channels. To support 32-Kbps ADPCM, two channels are usedsimultaneously. The spreading code is 4,096 Kbps; thus, for a 16-Kbpsdata rate, a spreading factor of 256 is used. The top-level network archi-tecture is shown in Figure 13.1.
The system employs a network of radio base stations (RBSs) toprovide coverage of the intended service area. The main functionalblocks of the network are described next.
The proprietary technologies 197
T a b l e 1 3 . 3Key Parameters of Airspan
Services
Telephony Yes
ISDN Yes, up to 144 Kbps
Fax Yes
Data Yes, up to 128 Kbps
Videophone No
Supplementary services Wide range
Multiple lines Yes
Performance
Range (radius) 5 km
Cells per 100 km2 1.3
Capacity per cell, 2 × 1 MHz 8.5

13.3.2.1 Central office
The central office contains digital switching and network routing facilitiesrequired to connect the radio network to ISDN and the Internet.
13.3.2.2 Central access and transcoding unit
The central access and transcoding unit (CATU) is collocated with theswitch and performs the following functions:
◗ It controls the allocation of radio resources and ensures that theallocation is appropriate to the service being provided, for example,64-Kbps digital, 32-Kbps speech, ISDN.
◗ For speech services, it provides transcoding between variousspeech-coding rates and the switched 64-Kbps PCM.
13.3.2.3 Central transceiver unit
The central transceiver unit (CTRU) is located at the RBS. A single CTRUprovides a single CDMA radio channel. The CTRU performs the followingmain functions:
198 Introduction to Wireless Local Loop
Localexchange CATU CTRU
STRU ITS
Local exchange Base station (RBS)
Subscriber unit (NIU)ETSI V5.1,V5.2
G.703 (E1)CDMA air interface(5-MHz channel)
CATUCTRUSTRUITS
PSTN, ISDN,Internet X.24,
X.400 etc
Central access and transcoding unitCentral transceiver unitSubscriber transceiver unitIntelligent telephone socket
Figure 13.1 Radio access architecture.

◗ It provides the CDMA air interface.
◗ It transfers ISDN and plain old telephony service (POTS) signalinginformation transparently between the air interface and the CATU.
The connection between the CATU and the CTRU requires a 2-Mbpscapability and is normally made using direct connection or point-to-pointmicrowave links.
13.3.2.4 Network interface unit
The network interface unit (NIU) connects the subscribers to the radionetwork. The NIU comprises two functional blocks: the intelligent tele-phone socket (ITS) and the subscriber transceiver unit (STRU).
◗ The ITS provides the point of connection to the subscriber�s termi-nal equipment, for example, PABX, telephone, or LAN. The ITS isavailable in dual-line or multiline configuration.
◗ The STRU is located on the outside of the subscriber�s building andconsists of an integrated antenna and radio transceiver. The STRUprovides the interface between the ITS and the CDMA air interface.The STRU is connected to the ITS by a standard four-wire telephoneor data networking cable.
The number of subscriber connections supported by each NIU isdetermined by the type of service being provided by the connection. Thebasic NIU connection provides a single ISDN (2B + D) connection, effec-tively giving two unrestricted 64-Kbps channels. The same unit also canbe configured as either two or eight individual POTS lines using ADPCMand code excited linear predictor (CELP) speech coding, respectively.
The modulation technique employed first takes each 16-Kbps chan-nel and adds error-correction coding to reach 32 Kbps. It then uses Walshspreading with a spreading factor of 128 to reach the transmitted data rateof 4 Mbps. Finally, it multiplies that by one of a set of 16 PN codesequences also at 4 Mbps, which does not change the output data rate butprovides for interference from adjacent cells, as described in Section 8.6.During design of the network, each cell must have a PN codesequence number assigned to it such that neighboring cells do not havethe same number.
The proprietary technologies 199
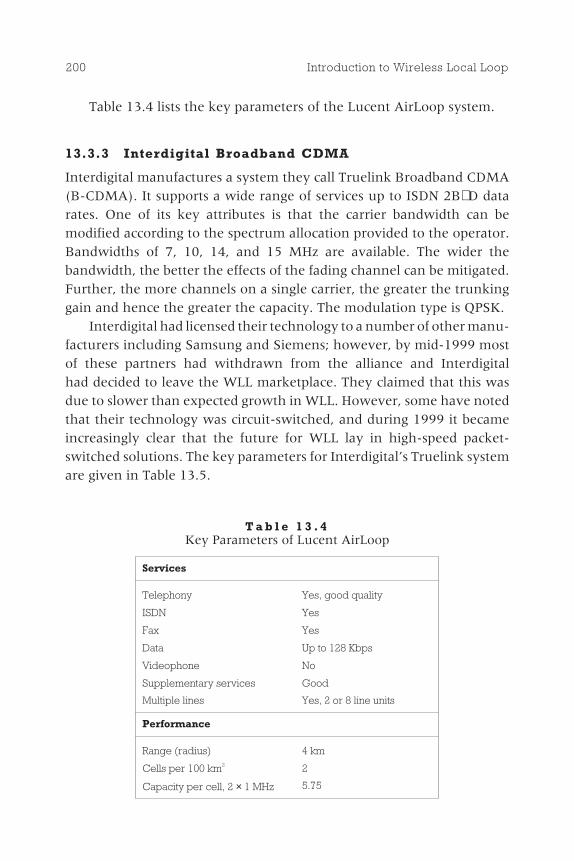
Table 13.4 lists the key parameters of the Lucent AirLoop system.
13.3.3 Interdigital Broadband CDMA
Interdigital manufactures a system they call Truelink Broadband CDMA(B-CDMA). It supports a wide range of services up to ISDN 2B+D datarates. One of its key attributes is that the carrier bandwidth can bemodified according to the spectrum allocation provided to the operator.Bandwidths of 7, 10, 14, and 15 MHz are available. The wider thebandwidth, the better the effects of the fading channel can be mitigated.Further, the more channels on a single carrier, the greater the trunkinggain and hence the greater the capacity. The modulation type is QPSK.
Interdigital had licensed their technology to a number of other manu-facturers including Samsung and Siemens; however, by mid-1999 mostof these partners had withdrawn from the alliance and Interdigitalhad decided to leave the WLL marketplace. They claimed that this wasdue to slower than expected growth in WLL. However, some have notedthat their technology was circuit-switched, and during 1999 it becameincreasingly clear that the future for WLL lay in high-speed packet-switched solutions. The key parameters for Interdigital�s Truelink systemare given in Table 13.5.
200 Introduction to Wireless Local Loop
T a b l e 1 3 . 4Key Parameters of Lucent AirLoop
Services
Telephony Yes, good quality
ISDN Yes
Fax Yes
Data Up to 128 Kbps
Videophone No
Supplementary services Good
Multiple lines Yes, 2 or 8 line units
Performance
Range (radius) 4 km
Cells per 100 km2 2
Capacity per cell, 2 × 1 MHz 5.75
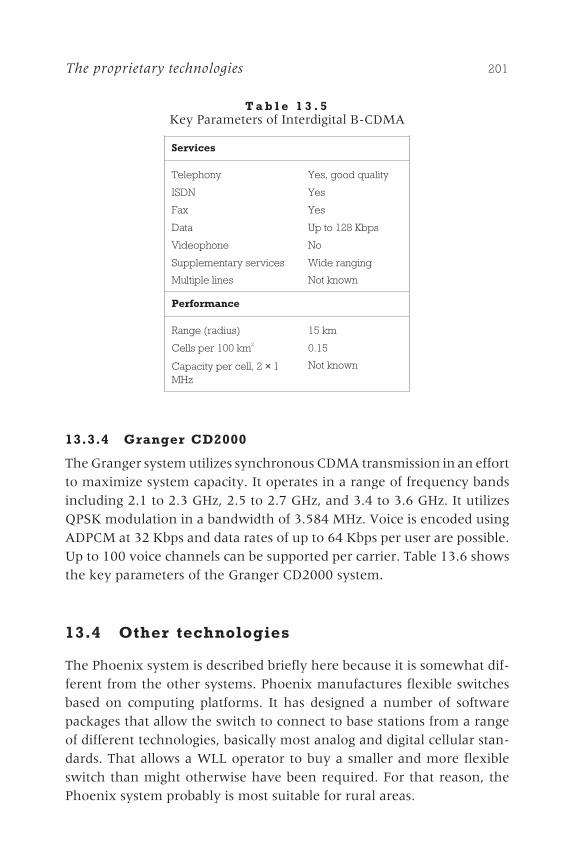
13.3.4 Granger CD2000
The Granger system utilizes synchronous CDMA transmission in an effortto maximize system capacity. It operates in a range of frequency bandsincluding 2.1 to 2.3 GHz, 2.5 to 2.7 GHz, and 3.4 to 3.6 GHz. It utilizesQPSK modulation in a bandwidth of 3.584 MHz. Voice is encoded usingADPCM at 32 Kbps and data rates of up to 64 Kbps per user are possible.Up to 100 voice channels can be supported per carrier. Table 13.6 showsthe key parameters of the Granger CD2000 system.
13.4 Other technologies
The Phoenix system is described briefly here because it is somewhat dif-ferent from the other systems. Phoenix manufactures flexible switchesbased on computing platforms. It has designed a number of softwarepackages that allow the switch to connect to base stations from a rangeof different technologies, basically most analog and digital cellular stan-dards. That allows a WLL operator to buy a smaller and more flexibleswitch than might otherwise have been required. For that reason, thePhoenix system probably is most suitable for rural areas.
The proprietary technologies 201
T a b l e 1 3 . 5Key Parameters of Interdigital B-CDMA
Services
Telephony Yes, good quality
ISDN Yes
Fax Yes
Data Up to 128 Kbps
Videophone No
Supplementary services Wide ranging
Multiple lines Not known
Performance
Range (radius) 15 km
Cells per 100 km2 0.15
Capacity per cell, 2 × 1MHz
Not known

13.5 Summary
A summary of the key characteristics of four of the different WLL tech-nologies is given in Table 13.7, excluding those technologies about whichtoo little is known to date to provide a coherent analysis. As can be seenfrom the table, all provide a good range of basic services, including good-quality voice, fax, and data. The differences occur in the support of ISDNand high-speed data, with Airspan and Lucent being particularly good.
In terms of performance, the Nortel equipment appears to have a sub-stantially higher range than the equipment from the other manufactur-ers, although range figures are notoriously problematic and in practice alltechnologies will probably be constrained to the same range as a result ofthe topography. Airspan and Innowave appear to provide the highestcapacity and so should be preferred in spectrum-constrained opera-tions�although again the reader is cautioned about the difficulty inproviding accurate estimates of capacity. The Lucent equipment appearsrelatively poor in terms of capacity. This poor performance is somewhatunexpected given its use of CDMA, and it remains to be seen whetherbetter performance can actually be achieved in practice.
In the next chapter the broadband technologies are considered.
202 Introduction to Wireless Local Loop
T a b l e 1 3 . 6Key Parameters of Granger CD2000
Services
Telephony Yes, good quality
ISDN No
Fax Yes
Data Up to 64 Kbps
Videophone No
Supplementary services Wide ranging
Multiple lines Not known
Performance
Range (radius) Not known
Cells per 100 km2 Not known
Capacity per cell, 2 × 1MHz
Not known

The proprietary technologies 203
T a b l e 1 3 . 7Summary of Key Parameters of Narrowband Proprietary
WLL Technologies
Services
Nortel Innowave Airspan Lucent
Telephony Yes,high-qualityvoice
Yes,good-qualityvoice
Yes,good-qualityvoice
Yes,good-qualityvoice
ISDN For futurerelease
For futurerelease
Yes Yes
Fax Yes Yes Yes Yes
Data Yes, up to64 Kbps
Yes, up to32 Kbps
Yes, up to144 Kbps
Up to 128 Kbps
Videophone No No No No
Supplementaryservices
Wide range Wide range Wide range Wide range
Multiple lines Two lines One to fourlines
Two lines Two- oreight-line units
Performance
Range (radius) 15 km 6 km 5 km 4 km
Cells per 100km2
0.14 0.88 1.3 2
Capacity percell, 2 × 1 MHz
10 8 8.5 5.75

The broadbandtechnologies
14.1 Introduction
Within the telecommunications arena, sup-pliers are increasingly concerned with thedelivery of broadband services to their cus-tomers. Such services could provide high-speed Internet access, improved connectivityfor home workers, and video on demand. Asdiscussed in Chapter 3, the fixed-line com-munity is investigating the use of digital sub-scriber line techniques such as asymmetricdigital subscriber line (ADSL) in order to pro-vide higher data rates in the short to mediumterm, with fiber to the curb (FTTC) and fiberto the home (FTTH) used to provide very highdata rates in the long term.
Other telecommunications providers arealso looking to provide broadband services,with satellite initiatives such as Teledesic,cable modems, and even mobile initiativessuch as the broadband mode within UMTS.WLL, as one of the newest access technolo-gies, is also claiming it can provide broadband
205
Contents
14.1 Introduction
14.2 Can WLLprovide broadbandservices?
14.3 MMDS
14.4 LMDS
14.5 MVDS and otherTV distribution systems
14.6 Wireless LANsystems
14.7 HiperAccess
14.8 Broadbandproprietary products
14.9 Mesh networks
14C H A P T E R
services. Whether it really can, and what the data rates provided by WLLmight be, is the subject of this chapter.
Broadband is an ill-defined term. For most operators it typically meansa bandwidth that is higher than their standard rate but still within thecapabilities of their access technology. For the fixed-line and cable opera-tors, broadband might mean 8 Mbps or higher. For the satellite operator itmight be 2 Mbps, whereas for the mobile operator it might be as low as64 Kbps. From the users� point of view, they might expect a similar servicefrom a broadband connection as from their office LAN, suggesting thatbroadband should provide data rates of 10 Mbps or higher. Many considerbroadband to be the provision of an E1 or T1 link at data rates of around2 Mbps, and it is this threshold that is used throughout this book whendiscussing broadband data rates.
Broadband is a concept that operators are currently more excitedabout than users. Most of the drivers for broadband result from a push bythe operators, rather than a pull from the users who, typically, do not cur-rently have the applications that require broadband services. Exceptionsinclude businesses that require high-speed interconnection to otheroffices, or multiple telephone lines, and teleworkers who require aLAN-like connection into the office computer system. More recently,high-speed Internet connections have emerged as a possible driver forbroadband demand.
Determining the bandwidth that users need both now and through-out the lifetime of a WLL system deployed today is problematic anddepends greatly on the environment. In developing countries, the keyissue is the provision of voice and fax at low cost, and existing WLLsystems are likely to meet those requirements for some time to come. Themore demanding users are those in developed countries, which areconsidered in more detail in the rest of this section.
Most users have little concept of what data rates they require, butthey would like all file transfers or Internet interrogations to take placealmost instantaneously. Most would agree that the 9.6 Kbps supplied bycellular technologies such as GSM is insufficient. Users might suggest thatif the same data rate that was available on the corporate LAN, typicallyEthernet, providing some 10 Mbps, could be made available this wouldprovide an acceptable level of service. However, corporate LANs are get-ting faster and it is quite likely that speeds in excess of 100 Mbps might beroutinely in use in 10 years time, within the lifetime of a WLL system.
206 Introduction to Wireless Local Loop
The user requirements for broadband services were studied by theETSI Broadband Radio Access Networks (BRAN) group, which is workingon developing a European standard for broadband WLL systems calledHiperAccess (see Section 14.7). They came to the conclusion that datarates of somewhere between 1.5 and 6 Mbps would be required to sup-port video applications, 2 Mbps would be sufficient for Web browsing,10 Mbps would be required for corporate access, and up to 25 Mbps forLAN interconnect. As a result, the HiperAccess group has decided to set asits goal the provision of data rates at up to 25 Mbps per user.
The BRAN work shows that different users will have differentrequirements. Most users can be expected to need voice and ISDN-typeapplications and many will probably also require Web browsing andvideo distribution, suggesting that data rates of between 2 and 6 Mbps willbe needed. Only home workers will require corporate network connec-tion and the number requiring LAN connections will be even fewer.The ideal WLL system would be able to cope with all of these users, asHiperAccess is intending to do. Other systems might target the majority ofusers with data rates between 2 and 6 Mbps.
Of course, as discussed at the beginning of this section, there willremain a requirement for low-cost systems providing voice and relativelylow data rates in developing countries for the foreseeable future.
A wide range of different broadband technologies has been proposed.At the lower end of the broadband category, probably the most well-developed system is the AirLine system from Ericsson, which operateswithin the 10-GHz band and provides users with however many 64-Kbpschannels they require for their data transmission. However, at the timeof writing there was some doubt as to the support of this project fromthe manufacturers involved. Other manufacturers who are developingsystems include Floware and Telescicom from Israel who both haveproducts capable of providing up to 4 Mbps to each user.
Beyond this lie the local multipoint distribution service (LMDS) prod-ucts, which are being designed for the most part in the United States.These were initially designed for TV distribution at 28 GHz, but operatorsare now looking into two-way data provision at these and lower frequen-cies. It is not clear what data rates might be provided, but rates in excessof 10 Mbps seem possible. At present few products are available andlittle is known of the propagation difficulties and operational issuesthat might be experienced with these systems, but, as discussed in
The broadband technologies 207
more detail in Section 14.4, high-speed data transmission is now beingdemonstrated.
An intriguing possibility is the use of wireless LANs as the basis for aWLL technology. Wireless LANs are designed to connect computers intooffice networks over a range of a few tens of meters and are relativelymature and inexpensive. By placing a directional antenna on the sub-scriber device and increasing the transmitter power, the technologiescould be deployed for WLL systems with a range of many kilometers.Most systems will require some modifications to compensate for theincreased signal delay and increased delay spread. Perhaps the great-est concern is that these systems will be relatively inefficient in theirspectrum use and will be difficult to deploy in a cellular configurationwhere interference from neighboring cells might be experienced. One ofthe U.K. WLL operators has decided to deploy such a system and this isinvestigated in more detail in Section 14.6.
The final tier is occupied by HiperAccess, providing data ratesof 25 Mbps. At present, HiperAccess is still in the early stages of stan-dardization. It is always difficult to estimate how long standardiza-tion will take, followed by the subsequent development of equipment,but based on previous experiences of ETSI standardization programs,it seems unlikely that HiperAccess systems will be commercially avail-able before 2001 or 2002. HiperAccess is examined in more detail inSection 14.7.
Although such high data rates may initially seem impressive, interms of radio technology they are relatively straightforward�radiosystems capable of providing bandwidths of greater than 155 Mbps havebeen available for some time. However, despite the technology beingrelatively straightforward, the key issue is the cost of deploying thesesystems.
The potential WLL operator is currently left in a difficult position. It isdifficult for them to predict what data rates will be required by their usersduring the next 10 years, and the solutions offered by manufacturers arechanging rapidly. The key concern for an operator will be �If I deploy aWLL system today, will a competitor come along next year with a systemoffering a higher data rate and steal most of my customers?� On the onehand, unless the operator deploys a WLL system, they will not be able toprofit from it. On the other hand, if they deploy the wrong system, theymight lose a substantial amount of money. Typically, if the operator is
208 Introduction to Wireless Local Loop
the PTO, they might decide to wait because they already have wire-line customers and may not perceive much of a competitive threat. If theyare a new operator, they will deploy a system in order to gain as muchtime over potential competitors as possible. But who is right, and whichsystem should a WLL operator deploy?
The simple answer is that the operator should deploy the system thatbest meets the price and data rate expectations of the target niche of cus-tomers over the system lifetime. As can be imagined, higher data ratestypically come at a higher cost. There are two reasons for this:
1. A little theory, as presented in Section 14.2, shows that for atechnically perfect design, an assignment of radio spectrum atleast 10 times the bandwidth offered to a user is required for thesystem to be economically viable. This means that a 10-Mbpssystem would need a spectrum assignment of at least 100 MHzbefore it could be viable. Assignments of this size are typicallyonly available above frequencies of 10 GHz; however, at thesefrequencies, problems with rain fading begin to appear, resultingin a short communications range and hence a high cost ofdeployment.
2. Narrowband systems can be based on cellular and cordless tech-nologies and so benefit from the economies of scale for thosesystems. Wider bandwidth systems have few technologies thatthey can leverage in order to reduce the cost and as a result willprobably be more expensive. However, if they gain widespreadsuccess in the WLL marketplace, this might be sufficient to gener-ate substantial economies of scale. This is certainly the route thatHiperAccess is hoping to follow, but it remains to be seen whetherit can be achieved.
Generalizing across different markets and predicting the future suc-cess and price of these nascent technologies is a very inexact science. Itseems likely that the higher frequency of operation of the broadband sys-tems will demand a price premium both in equipment cost and in a highernumber of cells for some time to come. As a result, the market might bedivided along the lines shown in Table 14.1.
The next section considers the technical limitations associated withthe provision of broadband WLL products.
The broadband technologies 209
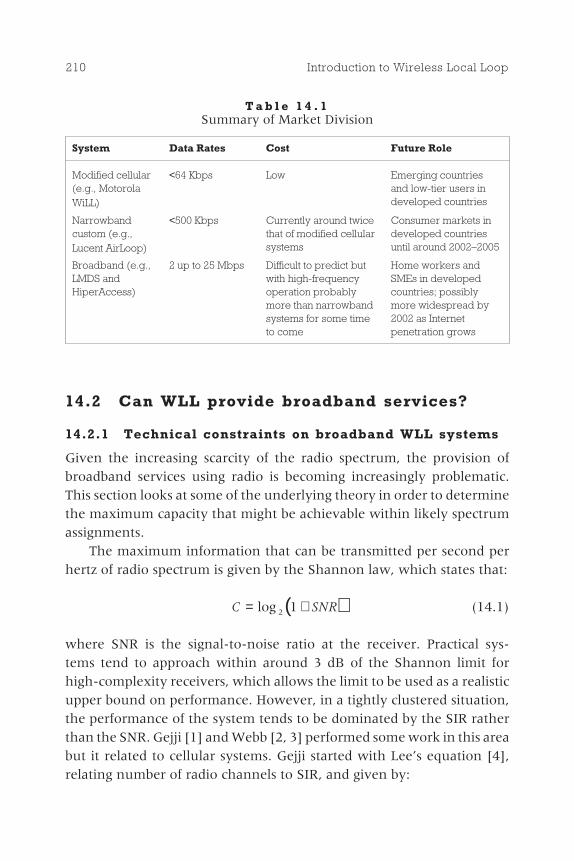
14.2 Can WLL provide broadband services?
14.2.1 Technical constraints on broadband WLL systems
Given the increasing scarcity of the radio spectrum, the provision ofbroadband services using radio is becoming increasingly problematic.This section looks at some of the underlying theory in order to determinethe maximum capacity that might be achievable within likely spectrumassignments.
The maximum information that can be transmitted per second perhertz of radio spectrum is given by the Shannon law, which states that:
( )C SNR= +log 2 1 (14.1)
where SNR is the signal-to-noise ratio at the receiver. Practical sys-tems tend to approach within around 3 dB of the Shannon limit forhigh-complexity receivers, which allows the limit to be used as a realisticupper bound on performance. However, in a tightly clustered situation,the performance of the system tends to be dominated by the SIR ratherthan the SNR. Gejji [1] and Webb [2, 3] performed some work in this areabut it related to cellular systems. Gejji started with Lee�s equation [4],relating number of radio channels to SIR, and given by:
210 Introduction to Wireless Local Loop
T a b l e 1 4 . 1Summary of Market Division
System Data Rates Cost Future Role
Modified cellular(e.g., MotorolaWiLL)<
<64 Kbps Low Emerging countriesand low-tier users indeveloped countries
Narrowbandcustom (e.g.,Lucent AirLoop)<
<500 Kbps Currently around twicethat of modified cellularsystems
Consumer markets indeveloped countriesuntil around 2002�2005
Broadband (e.g.,LMDS andHiperAccess)
2 up to 25 Mbps Difficult to predict butwith high-frequencyoperation probablymore than narrowbandsystems for some timeto come
Home workers andSMEs in developedcountries; possiblymore widespread by2002 as Internetpenetration grows
mB
B SIR
t
c
=2
3 (14.2)
where Bt is the total available bandwidth, Bc is the bandwidth required percall, and m is the number of radio channels per cell. He then replaced SNRin Shannon�s equation with SIR and substituted for Bc within Lee�sequation to derive:
( )m
B SIR
R SIR
t
b
=+
12241
.log
a (14.3)
where Rb is the user bit rate and α is a factor relating to the closeness towhich the Shannon limit can be approached.
A number of problems arise when extrapolating this result for a WLLenvironment. Key in Lee�s derivation is the assumption that both thewanted signal and the interfering signal are subject to a fourth-orderpath-loss law (i.e., path loss proportional to 1/d4). Measurements of WLLsystems [5] have typically shown that the path loss relating to the wantedsignal can be characterized by a 1/d2 relationship where d is the distancefrom the base station, due to the system design, which requires a line-of-sight (LOS) path between the base station and the receiver. For the inter-ferer, the situation is typically different. Often there will not be a LOS pathfrom the interfering base station to the receiver. Further, the directional-ity of the receiving antenna will ensure that the interfering signal willsuffer a 20-dB reduction in signal strength compared to the wantedsignal. This reduction may be further increased by mounting the receiveron a part of the house where the building itself also acts to block theinterfering signal.
To date, measurements of the propagation characteristics of interfer-ing signals in typical WLL systems have not been published, hence it isdifficult to define the path loss relating to the interfering signal. Here it isassumed that, because a LOS is unlikely for the interfering signal, andbecause it will typically fall outside of the main antenna beam, the pathloss will be similar to that for cellular, where a LOS is also rare. Hence theinterfering signal will be modeled as 1/d4, while the wanted signal will bemodeled as 1/d2. Taking the same approach as Lee, it is found that in thiscase that:
The broadband technologies 211
CI
R
D=
−
−
b
b1
2
246 (14.4)
where b1 and b2 are constants relating to the path loss from the wantedsignals and the interferers, respectively, R is the cell radius, and D is thedistance between adjacent cochannel cells. This can be rewritten as:
CI
D
R
R=
b
b1
2
4 2
6 (14.5)
and hence
D
R
C
I R=
b
b2
12
146
(14.6)
According to Lee:
mB
B Kt
c
=• (14.7)
where K is the cluster size, and
KD
R=
1
3
2
(14.8)
hence, substituting for K in (14.9) we find that:
mB
BR
C
I
t
c
=•
2
3
12
2
1
b
b (14.9)
Taking Gejji�s approach of substituting for Bc with Shannon�s equation,leads to:
( )m
B CI
RR
C
I
t
b
=+
•
log 2
2
2
1
1
2
3
1 b
b (14.10)
212 Introduction to Wireless Local Loop
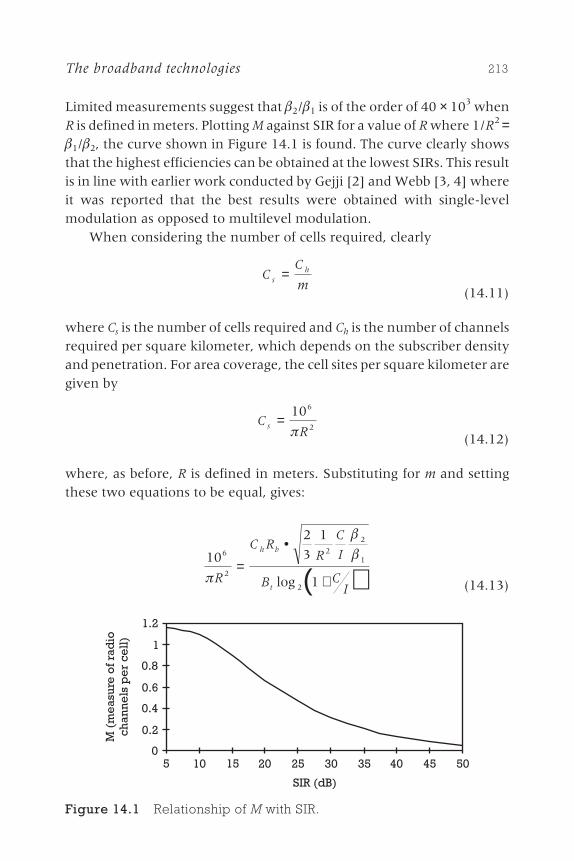
Limited measurements suggest that b2/b1 is of the order of 40 × 103 whenR is defined in meters. Plotting M against SIR for a value of R where 1/R2 =b1/b2, the curve shown in Figure 14.1 is found. The curve clearly showsthat the highest efficiencies can be obtained at the lowest SIRs. This resultis in line with earlier work conducted by Gejji [2] and Webb [3, 4] whereit was reported that the best results were obtained with single-levelmodulation as opposed to multilevel modulation.
When considering the number of cells required, clearly
CC
msh=
(14.11)
where Cs is the number of cells required and Ch is the number of channelsrequired per square kilometer, which depends on the subscriber densityand penetration. For area coverage, the cell sites per square kilometer aregiven by
CR
s =106
2p (14.12)
where, as before, R is defined in meters. Substituting for m and settingthese two equations to be equal, gives:
( )10
2
3
1
1
6
2
2
2
1
2p
b
b
R
C RR
C
I
B CI
h b
t
=•
+log (14.13)
The broadband technologies 213
0
0.2
0.4
0.6
0.8
1
1.2
SIR (dB)
M(m
eas
ure
ofr
adio
chan
ne
lsp
er
cell
)
5 10 15 20 25 30 35 40 45 50
Figure 14.1 Relationship of M with SIR.

which can be solved in terms of R as:
( )R
B CI
C BC
I
t
h b
=+
•
10 1
2
3
62
2
1
log
pb
b (14.14)
Here it has been assumed that in order to maximize the capacity, the sys-tem designer has used techniques that require an SIR of only 10 dB. SIRsof 5 dB have not been assumed because, at present, few radio systems areable to work at such low SIRs. Having made this assumption, (14.14) canbe simplified to:
RC
B
Rh
t
b
=×21 103.
(14.15)
In practice, the maximum achievable radius is typically around 5,000mand the minimum around 100m. If the equation requires values of Rsmaller than 100m then the provision of the capacity is probably techni-cally unfeasible. If the value of R is greater than 5,000m then it has beenlimited to 5,000m.
In the remainder of this section, Bt/Rb is used as the unit of analysis.This simplifies the analysis by removing the need to vary both the spec-trum assignment and the user bit rate in order to determine the sensitivityto either.
Further gains may be possible through the use of sectorization, par-ticularly in the case for which a CDMA-based air interface is used. Thesehave been ignored in this particular case but could increase the capacityfor real-life systems.
The remaining stage of the analysis is then to determine the radiusand hence the number of cells for a range of capacity requirements andspectrum assignments and to determine whether this level of infrastruc-ture can be provided economically.
14.2.2 Practical and economic constraints onbroadband systems
The theory developed in the previous section shows that, as is wellknown, capacity is increased as cell size is reduced. However, an increase
214 Introduction to Wireless Local Loop

in the number of cells increases the cost of the network. In this section,the economic limits on the number of cells are considered to determinethe maximum capacity that might be offered by a broadband WLL system.
14.2.2.1 Costs
The key cost elements for a broadband WLL system are as follows:
◗ The cost per subscriber unit, which has been assumed to be $1,000.
◗ The cost of the base station equipment, which is not well known,but assumed here to be around $300,000 per base station.
◗ The cost of linking the base station back to the switch. This will needto be a high-bandwidth link with a capacity of around 300 Mbpsand has been assumed to be self-laid fiber-optic cable, with a cablingcost of $30/m.1 The average link distance will be around twice thecell radius, allowing the traffic from a base station to be �droppedand inserted� onto the cable. As derived earlier, the radius isdependent on the capacity required.
◗ The cost of the switch and other related components. Compared tothe base station cost these are typically of little significance.
◗ Ongoing costs of maintenance, power, site rental, and so on.To simplify the analysis it has been assumed that these areinsignificant.
14.2.2.2 Revenue
The revenue is very difficult to calculate because tariff policies for broad-band services are still far from clear. Nevertheless, some approxima-tions can be made as follows. In dense capital cities there are around6,000 buildings per square kilometer. Penetration is highly approximate,but as a starting point, narrowband WLL operators have achieved around5% penetration in the United Kingdom and, depending on the attractive-ness of tariffs and services offered, similar levels of penetration represent asuitable starting point for this analysis. Traffic levels are equally unknownuntil the services offered are determined, but a starting point might be to
The broadband technologies 215
1. In practice, many operators will not be able to lay their own cables and instead will leaseresources from a PTO. However, the lease charged by the PTO will reflect the cost oflaying the cable and hence will tend to be similar to the installation cost on a through-lifecosting basis.
assume traffic levels of 0.1E (which would be the same as 10% ofthe bandwidth at 1E). This leads to traffic levels of around 30E at thebroadband rate per square kilometer.
The revenue generated then depends on the tariff. To approximatewhat this might be, two scenarios that might form an upper and lowerband have been priced. The upper band might be that of a business thatcurrently wants a broadband link; the typical approach is a leased line at amultiple of 2 Mbps (the E1 rate). At present, in London, it costs around$7,700 per year to lease such a line. Given that prices are expected to fallin the future, it is perhaps reasonable to assume that this will be the reve-nue received for a broadband connection of around 10 Mbps in futureyears. The lower bound might be that for nonbusiness users, whocurrently typically do not have a broadband connection; the closestcomparison is an ISDN line. Such users pay around $640 per year rentalfor the line and then more for the call charges incurred.
A full analysis of revenue would be considerably more complex thanthe approach adopted here, taking into account interconnection fees,connection rates, peak and off-peak call rates, and so on. Here, for sim-plicity, only the rental costs are assumed. With these assumptions, therevenue is fixed at $2.2 million per year per square kilometer for businessuse or $184,000 per year per square kilometer for residential use. Whenconverting to through-life costs, a 10-year accounting period with adiscount rate of 10% has been assumed.
14.2.2.3 Outstanding assumptions
The remaining issues of importance are the size of the spectrum assign-ment to the operator, which is key in scaling the capacity per megahertzper square kilometer, and the bandwidth of the broadband services to beoffered. The spectrum assignment is likely to vary dramatically fromcountry to country and be dependent on the frequency of operation.Existing assignments for WLL and MVDS operators vary from 2 × 15 MHzfor narrowband systems, through 2 × 100 MHz for broadband systems, to1 × 1,000 MHz or more for multipoint distribution systems.
A broadband WLL service might offer users a bandwidth of 10 Mbps.Hence, using the ratio of bandwidth assigned to bit rate per user, asdiscussed in the previous section, we might expect to see a variation fromas little as 1 to around 100. The results of such a variation are analyzedbelow.
216 Introduction to Wireless Local Loop
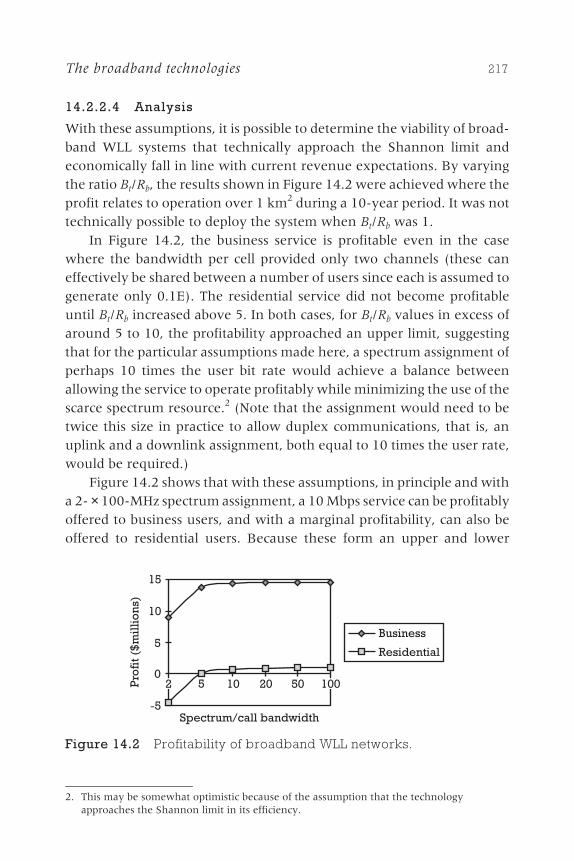
14.2.2.4 Analysis
With these assumptions, it is possible to determine the viability of broad-band WLL systems that technically approach the Shannon limit andeconomically fall in line with current revenue expectations. By varyingthe ratio Bt/Rb, the results shown in Figure 14.2 were achieved where theprofit relates to operation over 1 km2 during a 10-year period. It was nottechnically possible to deploy the system when Bt/Rb was 1.
In Figure 14.2, the business service is profitable even in the casewhere the bandwidth per cell provided only two channels (these caneffectively be shared between a number of users since each is assumed togenerate only 0.1E). The residential service did not become profitableuntil Bt/Rb increased above 5. In both cases, for Bt/Rb values in excess ofaround 5 to 10, the profitability approached an upper limit, suggestingthat for the particular assumptions made here, a spectrum assignment ofperhaps 10 times the user bit rate would achieve a balance betweenallowing the service to operate profitably while minimizing the use of thescarce spectrum resource.2 (Note that the assignment would need to betwice this size in practice to allow duplex communications, that is, anuplink and a downlink assignment, both equal to 10 times the user rate,would be required.)
Figure 14.2 shows that with these assumptions, in principle and witha 2- × 100-MHz spectrum assignment, a 10 Mbps service can be profitablyoffered to business users, and with a marginal profitability, can also beoffered to residential users. Because these form an upper and lower
The broadband technologies 217
-5
0
5
10
15
Spectrum/call bandwidth
Business
Residential
5 10 20 502 100Pro
fit(
$mil
lio
ns)
Figure 14.2 Profitability of broadband WLL networks.
2. This may be somewhat optimistic because of the assumption that the technologyapproaches the Shannon limit in its efficiency.

bound, it would appear likely that in practice a profitable service can beoffered.
14.2.2.5 Variables
Many of the variables in this analysis have a major effect on the results.Most of these relate to the assumptions made about costs, revenue, andusage. For example, the relationship of profit for the residential caseagainst annual revenue per customer is shown in Figure 14.3 for thecase where Bt/Rb is 10.
The relationship with penetration is shown in Figure 14.4. While thebusiness profitability increases as the penetration increases, the residen-tial profitability mostly stays constant. Penetration levels above 20%were not technically possible with this penetration and Bt/Rb value.
Another important parameter is the traffic generated by the users. Inthe previous analysis we have assumed 0.1E. For the residential case, it islikely that revenue can be increased in line with usage, leaving the over-all profitability unchanged. For the business case, our comparator wasa leased line, where the annual payment is unchanged with usage.
218 Introduction to Wireless Local Loop
−0.5
0
0.5
1
1.5
400 600 800
Rental $/year
200 1,000Pro
fit(
$mil
lio
ns)
Figure 14.3 Relationship between residential revenue and profit.
0102030405060
1% 2% 5% 10% 20%Penetration
Business
Residential
Pro
fit(
$mil
lio
ns)
Figure 14.4 Relationship between profit and penetration.
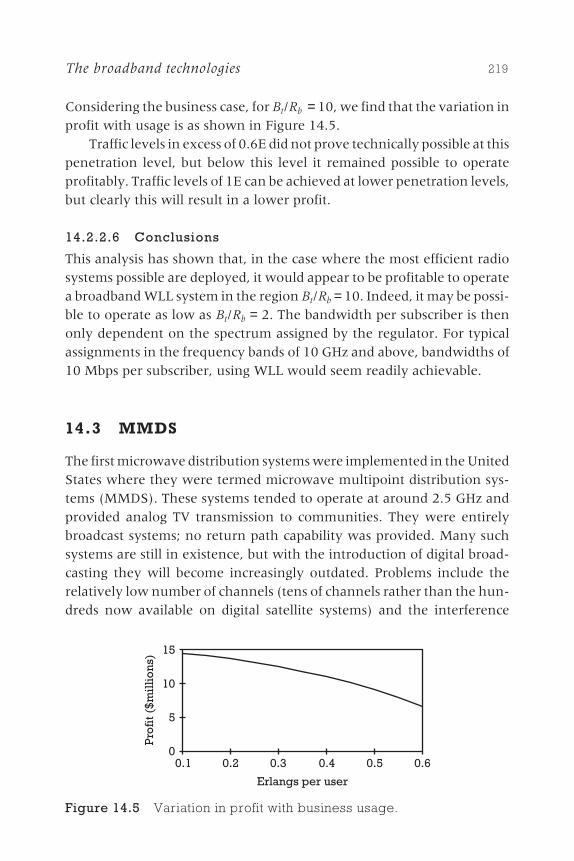
Considering the business case, for Bt/Rb = 10, we find that the variation inprofit with usage is as shown in Figure 14.5.
Traffic levels in excess of 0.6E did not prove technically possible at thispenetration level, but below this level it remained possible to operateprofitably. Traffic levels of 1E can be achieved at lower penetration levels,but clearly this will result in a lower profit.
14.2.2.6 Conclusions
This analysis has shown that, in the case where the most efficient radiosystems possible are deployed, it would appear to be profitable to operatea broadband WLL system in the region Bt/Rb = 10. Indeed, it may be possi-ble to operate as low as Bt/Rb = 2. The bandwidth per subscriber is thenonly dependent on the spectrum assigned by the regulator. For typicalassignments in the frequency bands of 10 GHz and above, bandwidths of10 Mbps per subscriber, using WLL would seem readily achievable.
14.3 MMDS
The first microwave distribution systems were implemented in the UnitedStates where they were termed microwave multipoint distribution sys-tems (MMDS). These systems tended to operate at around 2.5 GHz andprovided analog TV transmission to communities. They were entirelybroadcast systems; no return path capability was provided. Many suchsystems are still in existence, but with the introduction of digital broad-casting they will become increasingly outdated. Problems include therelatively low number of channels (tens of channels rather than the hun-dreds now available on digital satellite systems) and the interference
The broadband technologies 219
0
5
10
15
0.1 0.2 0.3 0.4 0.5 0.6
Erlangs per user
Pro
fit(
$mil
lio
ns)
Figure 14.5 Variation in profit with business usage.
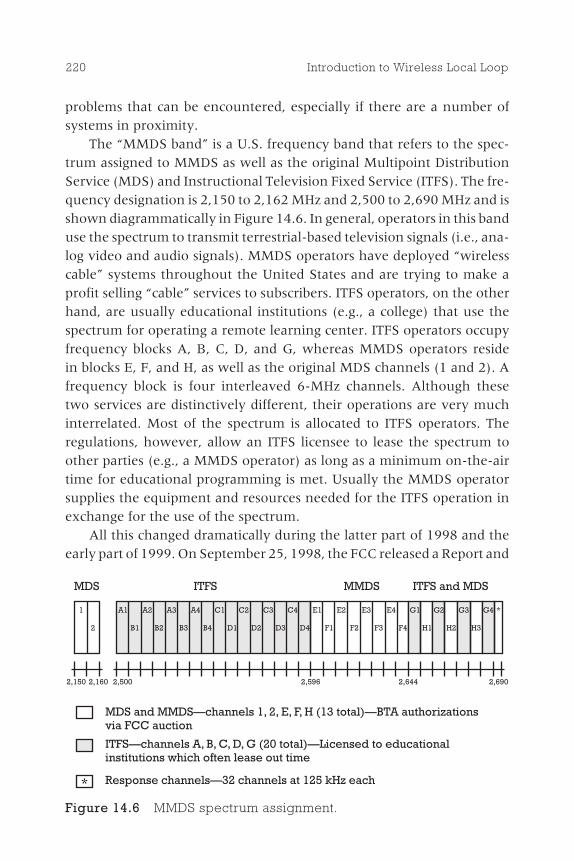
problems that can be encountered, especially if there are a number ofsystems in proximity.
The �MMDS band� is a U.S. frequency band that refers to the spec-trum assigned to MMDS as well as the original Multipoint DistributionService (MDS) and Instructional Television Fixed Service (ITFS). The fre-quency designation is 2,150 to 2,162 MHz and 2,500 to 2,690 MHz and isshown diagrammatically in Figure 14.6. In general, operators in this banduse the spectrum to transmit terrestrial-based television signals (i.e., ana-log video and audio signals). MMDS operators have deployed �wirelesscable� systems throughout the United States and are trying to make aprofit selling �cable� services to subscribers. ITFS operators, on the otherhand, are usually educational institutions (e.g., a college) that use thespectrum for operating a remote learning center. ITFS operators occupyfrequency blocks A, B, C, D, and G, whereas MMDS operators residein blocks E, F, and H, as well as the original MDS channels (1 and 2). Afrequency block is four interleaved 6-MHz channels. Although thesetwo services are distinctively different, their operations are very muchinterrelated. Most of the spectrum is allocated to ITFS operators. Theregulations, however, allow an ITFS licensee to lease the spectrum toother parties (e.g., a MMDS operator) as long as a minimum on-the-airtime for educational programming is met. Usually the MMDS operatorsupplies the equipment and resources needed for the ITFS operation inexchange for the use of the spectrum.
All this changed dramatically during the latter part of 1998 and theearly part of 1999. On September 25, 1998, the FCC released a Report and
220 Introduction to Wireless Local Loop
MDS ITFS MMDS ITFS and MDS
MDS and MMDS�channels 1, 2, E, F, H (13 total)�BTA authorizationsvia FCC auction
ITFS�channels A, B, C, D, G (20 total)�Licensed to educationalinstitutions which often lease out time
Response channels�32 channels at 125 kHz each*
A1 A2 A3 A4 C1 C2 C3 C4 E1 E2 E3 E4 G1 G2 G3 G4 *1
2 B1 B2 B3 B4 D1 D2 D3 D4 F1 F2 F3 F4 H1 H2 H3
2,150 2,160 2,500 2,596 2,644 2,690
Figure 14.6 MMDS spectrum assignment.

Order (Docket 97-217) that allows MMDS and ITFS operators to trans-form their services from one-way analog TV broadcasts into two-waydigital data services. The data services could include broadcast multime-dia entertainment (i.e., digital TV), on-demand entertainment, Internetconnectivity, and so on. Shortly after this ruling, at the start of 1999,long-distance carriers started purchasing MMDS operators to gain accessto their spectrum in order to bypass the local loop operators and gaindirect access to the home. On April 19, 1999, MCI WorldCom Inc.announced that it would purchase CAI Wireless, an MMDS operator.MCI has also purchased Prime Cable, another MMDS operator. Sprintannounced in April 1999 that it would purchase People�s Choice TVor PCTV and ATI or American Telecasting Inc., both of which wereMMDS operators. Sprint and MCI had spent a combined total of around$2.5 billion to acquire these operators by August 1999. This was seen bymany observers as the start of the race to get a wireless broadband pipe tokey residential and business subscribers in developed countries.
At the time of writing, Sprint and MCI had not made any announce-ments about the technologies that they were selecting to provide thisservice. The characteristics of the MMDS bands are such that there is nowell-defined uplink and downlink assignment making the use of manystandard technologies problematic. Possible technologies that might beadopted for this band included:
◗ Upbanded cable modems, as discussed in more detail below;
◗ TDD solutions, which could overcome the band assignment prob-lem such as the Adaptive Broadband technology discussed inSection 14.8.3;
◗ Downbanded LMDS solutions, such as those discussed in Section 14.4.
14.3.1 Upbanded cable modems
Cable modems are devices used to enable high data rate transmissionthrough coaxial cable networks, as described in Section 3.3. They tend toutilize TDMA framing structures and QAM modulation since the SNR ona cable system is relatively high and can accommodate higher level modu-lation. Further, because they need to fit in around TV channels distrib-uted on the cable system, they tend to use the same 6-MHz bandwidth asthe TV signals. Their transmission frequencies are typically in the range of
The broadband technologies 221

300 to 860 MHz in the downstream direction and 5 to 30 MHz in theupstream direction. The cable modem industry has produced a stan-dard for the development of cable modems known as Data Over CableSystem Interface Specification (DOCSIS) that describes in detail themanner in which cable modems are designed to operate. More details canbe obtained at http://www.cablemodem.com/, including the completeDOCSIS specification free of charge.
When faced with a need to urgently develop equipment able tooperate in the MMDS frequency bands, many saw cable modems as anatural starting point. They brought the advantages of a technology thatwas already proven and an open standard as well as equipment that wasalready being manufactured. However, there are problems with cablemodems as well. The equipment specification was designed for the RFchannel experienced over a cable and not over open-air transmission,with the result that aspects such as equalization are not optimal for open-air transmission. The use of higher level modulation resulting in highSNRs and SIRs being required, potentially results in a lower overall capac-ity, as detailed in Section 14.2. Further, the cable modem specification isFDD, whereas (as mentioned earlier) the simplex MMDS band assign-ments make the use of FDD problematic. Nevertheless, the pressingtimescales of some of the operators ensured that cable modems were usedin some initial deployments. At the time of writing, some manufacturerswere working on �enhanced cable modems� with different Layer 1 andLayer 2 specifications from the DOCSIS specification, while maintainingthe same Layer 3 protocol. These different lower layer systems includedthe use of techniques such as orthogonal frequency division multiplexing(OFDM) and TDD-TDMA. An example of this type of solution is theCisco/Motorola VOFDM system with a DOCSIS Layer 3 and proprietaryLayer 1 and 2. This solution maintains many of the cable modem parame-ters, such as 6-MHz channels.
14.4 LMDS
With the shortcomings of MMDS for television broadcast, an effort wasmade to increase the number of channels and improve the quality ofreception. This led to the proposal of a new system for operation inthe United States and in Asian-Pacific countries. This was known as the
222 Introduction to Wireless Local Loop
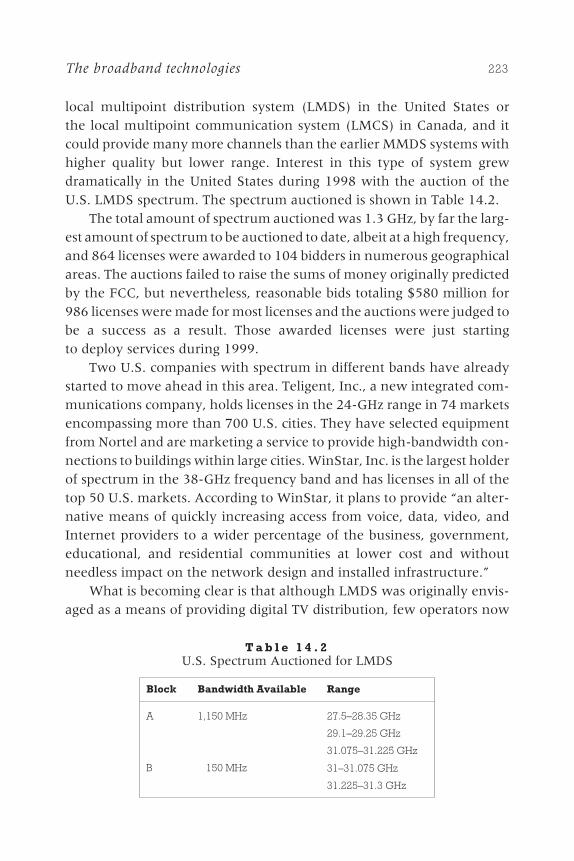
local multipoint distribution system (LMDS) in the United States orthe local multipoint communication system (LMCS) in Canada, and itcould provide many more channels than the earlier MMDS systems withhigher quality but lower range. Interest in this type of system grewdramatically in the United States during 1998 with the auction of theU.S. LMDS spectrum. The spectrum auctioned is shown in Table 14.2.
The total amount of spectrum auctioned was 1.3 GHz, by far the larg-est amount of spectrum to be auctioned to date, albeit at a high frequency,and 864 licenses were awarded to 104 bidders in numerous geographicalareas. The auctions failed to raise the sums of money originally predictedby the FCC, but nevertheless, reasonable bids totaling $580 million for986 licenses were made for most licenses and the auctions were judged tobe a success as a result. Those awarded licenses were just startingto deploy services during 1999.
Two U.S. companies with spectrum in different bands have alreadystarted to move ahead in this area. Teligent, Inc., a new integrated com-munications company, holds licenses in the 24-GHz range in 74 marketsencompassing more than 700 U.S. cities. They have selected equipmentfrom Nortel and are marketing a service to provide high-bandwidth con-nections to buildings within large cities. WinStar, Inc. is the largest holderof spectrum in the 38-GHz frequency band and has licenses in all of thetop 50 U.S. markets. According to WinStar, it plans to provide �an alter-native means of quickly increasing access from voice, data, video, andInternet providers to a wider percentage of the business, government,educational, and residential communities at lower cost and withoutneedless impact on the network design and installed infrastructure.�
What is becoming clear is that although LMDS was originally envis-aged as a means of providing digital TV distribution, few operators now
The broadband technologies 223
T a b l e 1 4 . 2U.S. Spectrum Auctioned for LMDS
Block Bandwidth Available Range
A 1,150 MHz 27.5�28.35 GHz
29.1�29.25 GHz
31.075�31.225 GHz
B 1,150 MHz 31�31.075 GHz
31.225�31.3 GHz
intend to use it in this manner. Most have put together business cases thatshow that there is more money to be made by distributing data. This isbecause TV distribution is now mostly in the hands of either the cableoperators or the satellite operators, who have cornered the market for TVmaterial. Further, the short propagation range of LMDS (discussed inmore detail later) makes coverage of large cities expensive. Instead, if anLMDS transmitter is placed on a tall building and if most of the receiversare on tall buildings (as would be the case for businesses in city centerareas), then propagation is simpler and most of the potential users can becovered from a single base station. These users are offered an E1 to E3(2- to 8-Mbps) bearer, which they can use to handle all their office voiceand data communications, bypassing the fixed operators who oftencharge many thousands of dollars per month for such a service.
LMDS is not a single self-contained standard in the way that GSM is.There are some guidelines for LMDS systems, but systems from eachmanufacturer tend to be different. First, both FDMA and TDMA accessmethods are used. FDMA tends to be utilized where subscribers wantpermanent circuits, and hence one frequency can be given permanentlyto one subscriber. TDMA tends to be utilized where subscribers only wantaccess to bandwidth on demand and hence more timeslots can be given toa particular user as the demand rises. FDMA offers the advantage that nomedium access control is required�the user just transmits what theywant whenever they want as they have a dedicated resource. However,TDMA generally allows more efficient utilization in the case where trafficlevels are not constant.
The next choice is the adoption of the modulation scheme. MostLMDS systems come preprogrammed with a range of modulationschemes that can be selected as conditions permit. For example, each ofthe modulation schemes shown in Table 14.3 might be used where thefinal column shows the bandwidth that would be required for a constantbit rate 2-Mbps (E1) link using FDMA.
As discussed in Section 8.4, although the higher level modulationschemes appear to offer much greater bandwidth efficiency, there aremany other issues to discuss. Higher level schemes require a higher SNRand as a result have a lower range. They are also more susceptible to inter-ference and would require a higher frequency reuse in a tightly clusteredconfiguration, which might result in less overall user bandwidth beingavailable. In practice, modulation levels will be chosen based on the
224 Introduction to Wireless Local Loop
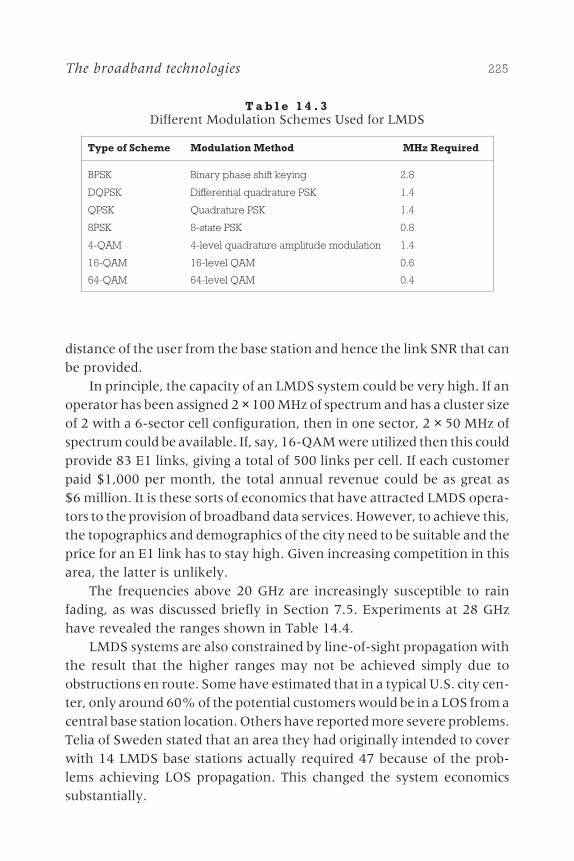
distance of the user from the base station and hence the link SNR that canbe provided.
In principle, the capacity of an LMDS system could be very high. If anoperator has been assigned 2 × 100 MHz of spectrum and has a cluster sizeof 2 with a 6-sector cell configuration, then in one sector, 2 × 50 MHz ofspectrum could be available. If, say, 16-QAM were utilized then this couldprovide 83 E1 links, giving a total of 500 links per cell. If each customerpaid $1,000 per month, the total annual revenue could be as great as$6 million. It is these sorts of economics that have attracted LMDS opera-tors to the provision of broadband data services. However, to achieve this,the topographics and demographics of the city need to be suitable and theprice for an E1 link has to stay high. Given increasing competition in thisarea, the latter is unlikely.
The frequencies above 20 GHz are increasingly susceptible to rainfading, as was discussed briefly in Section 7.5. Experiments at 28 GHzhave revealed the ranges shown in Table 14.4.
LMDS systems are also constrained by line-of-sight propagation withthe result that the higher ranges may not be achieved simply due toobstructions en route. Some have estimated that in a typical U.S. city cen-ter, only around 60% of the potential customers would be in a LOS from acentral base station location. Others have reported more severe problems.Telia of Sweden stated that an area they had originally intended to coverwith 14 LMDS base stations actually required 47 because of the prob-lems achieving LOS propagation. This changed the system economicssubstantially.
The broadband technologies 225
T a b l e 1 4 . 3Different Modulation Schemes Used for LMDS
Type of Scheme Modulation Method MHz Required
BPSK Binary phase shift keying 2.8
DQPSK Differential quadrature PSK 1.4
QPSK Quadrature PSK 1.4
8PSK 8-state PSK 0.8
4-QAM 4-level quadrature amplitude modulation 1.4
16-QAM 16-level QAM 0.6
64-QAM 64-level QAM 0.4
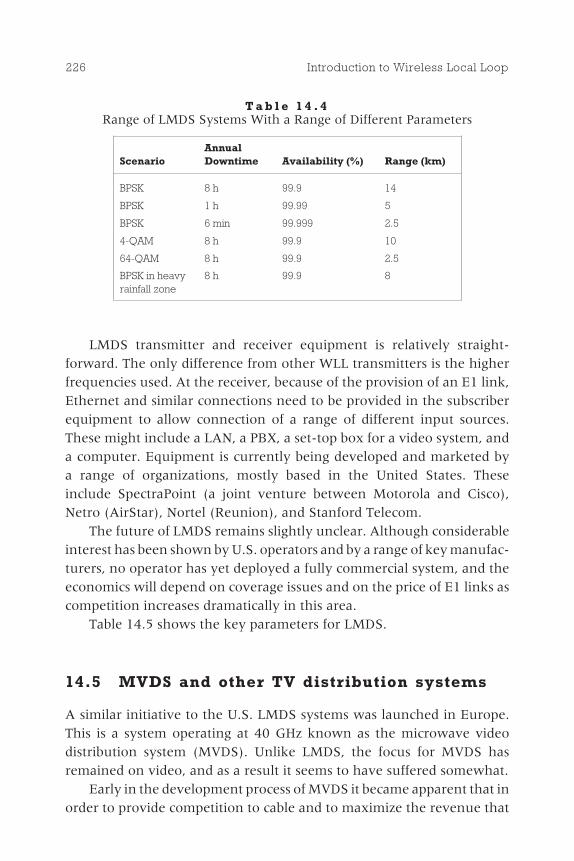
LMDS transmitter and receiver equipment is relatively straight-forward. The only difference from other WLL transmitters is the higherfrequencies used. At the receiver, because of the provision of an E1 link,Ethernet and similar connections need to be provided in the subscriberequipment to allow connection of a range of different input sources.These might include a LAN, a PBX, a set-top box for a video system, anda computer. Equipment is currently being developed and marketed bya range of organizations, mostly based in the United States. Theseinclude SpectraPoint (a joint venture between Motorola and Cisco),Netro (AirStar), Nortel (Reunion), and Stanford Telecom.
The future of LMDS remains slightly unclear. Although considerableinterest has been shown by U.S. operators and by a range of key manufac-turers, no operator has yet deployed a fully commercial system, and theeconomics will depend on coverage issues and on the price of E1 links ascompetition increases dramatically in this area.
Table 14.5 shows the key parameters for LMDS.
14.5 MVDS and other TV distribution systems
A similar initiative to the U.S. LMDS systems was launched in Europe.This is a system operating at 40 GHz known as the microwave videodistribution system (MVDS). Unlike LMDS, the focus for MVDS hasremained on video, and as a result it seems to have suffered somewhat.
Early in the development process of MVDS it became apparent that inorder to provide competition to cable and to maximize the revenue that
226 Introduction to Wireless Local Loop
T a b l e 1 4 . 4Range of LMDS Systems With a Range of Different Parameters
ScenarioAnnualDowntime Availability (%) Range (km)
BPSK 8 h 99.9 14
BPSK 1 h 99.99 5
BPSK 6 min 99.999 2.5
4-QAM 8 h 99.9 10
64-QAM 8 h 99.9 2.5
BPSK in heavyrainfall zone
8 h 99.9 8
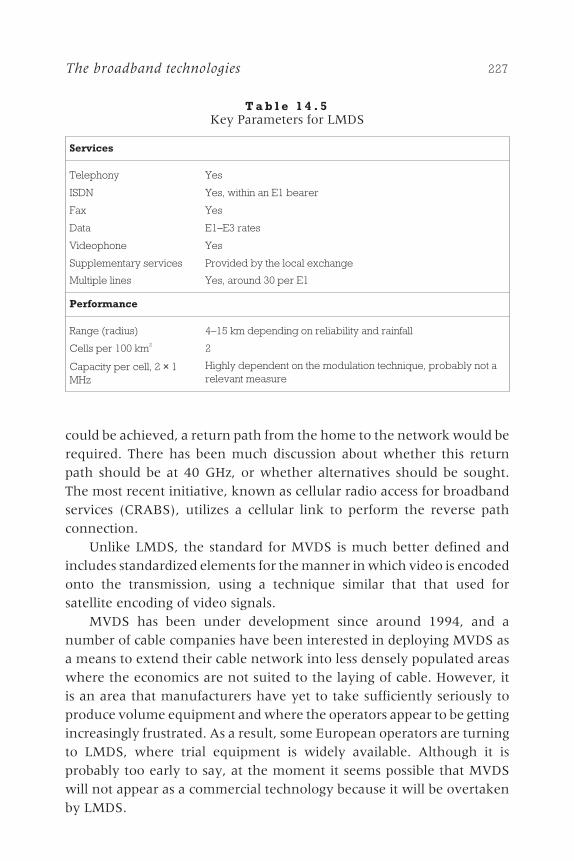
could be achieved, a return path from the home to the network would berequired. There has been much discussion about whether this returnpath should be at 40 GHz, or whether alternatives should be sought.The most recent initiative, known as cellular radio access for broadbandservices (CRABS), utilizes a cellular link to perform the reverse pathconnection.
Unlike LMDS, the standard for MVDS is much better defined andincludes standardized elements for the manner in which video is encodedonto the transmission, using a technique similar that that used forsatellite encoding of video signals.
MVDS has been under development since around 1994, and anumber of cable companies have been interested in deploying MVDS asa means to extend their cable network into less densely populated areaswhere the economics are not suited to the laying of cable. However, itis an area that manufacturers have yet to take sufficiently seriously toproduce volume equipment and where the operators appear to be gettingincreasingly frustrated. As a result, some European operators are turningto LMDS, where trial equipment is widely available. Although it isprobably too early to say, at the moment it seems possible that MVDSwill not appear as a commercial technology because it will be overtakenby LMDS.
The broadband technologies 227
T a b l e 1 4 . 5Key Parameters for LMDS
Services
Telephony Yes
ISDN Yes, within an E1 bearer
Fax Yes
Data E1�E3 rates
Videophone Yes
Supplementary services Provided by the local exchange
Multiple lines Yes, around 30 per E1
Performance
Range (radius) 4�15 km depending on reliability and rainfall
Cells per 100 km2 2
Capacity per cell, 2 × 1MHz
Highly dependent on the modulation technique, probably not arelevant measure
Even more fundamentally, the potential failure of MVDS and the useof LMDS as a data system rather than a video distribution system probablymarks the end of the use of WLL-type technologies to broadcast video. Inthe future, satellite, cable, and standard terrestrial broadcasting in UHFwill probably provide the predominant distribution means for digitalvideo.
14.5.1 CABSINET
There is one exception to the generally pessimistic forecast for videodistribution over WLL. Within Europe there is a project under waytermed cellular access to broadband services and interactive television(CABSINET). The aim of this project is to �define and demonstrate a wire-less broadband access network for the coverage of the last mile in bothurban and rural environments, serving customers with either fixed orsemi-portable equipment.� The system is designed for both video anddata, and like MVDS, utilizes the 40-GHz band for its main transmission.However, it recognizes the problems with propagation into buildings atthis band and so utilizes small repeaters close to the customers. Theserepeaters downconvert the signal to 5.7 GHz for subsequent retransmis-sion into the building. The aim is for receivers mounted on top of televi-sions to receive this 5.7-GHz signal, negating the need for an externalantenna.
The 40-GHz transmission utilizes QPSK modulation, encoding four8-Mbps programs within each 39-MHz channel. The 5.7-GHz systemutilizes a bandwidth of 150 MHz in total coupled with coded orthogonalfrequency division multiplexing (COFDM) modulation to encode one8-Mbps program into an 8-MHz channel. The radio link is bidirectional,also allowing it to be used for data of varying rates. The project delivered ademonstrator in September 1998 and was completed in August 1999,although at the time of writing the commercial viability of continuingwith the work was not clear.
Although interesting in its use of two sets of frequencies to achieve itsobjectives, many questions still remain about CABSINET. It is not clearhow many repeaters will be needed and what their cost will be. It is notclear whether the 5.7-GHz signal will penetrate homes with sufficientstrength to be well received. It is not clear whether the 5.7-GHz band willbe available in many countries. Finally, it is not clear whether there is a
228 Introduction to Wireless Local Loop
demand for video to be distributed in this manner given the ubiquity ofsatellite television. It will probably bea few years before it will becomeclear whether these problems can be solved and whether CABSINET willrepresent a commercial video distribution technology.
14.6 Wireless LAN systems
In the search for low-cost, high-bandwidth WLL technologies, someoperators have turned to the wireless local area network (W-LAN) mar-ketplace. W-LANs were originally designed for use within an office as analternative to connecting computers to an Ethernet. They generally pro-vide around 1 Mbps of total bandwidth and a random access method thatlooks very similar to the carrier sense/collision detection multiple access(CS/CDMA) approach utilized by Ethernet systems. They typically have arange of up to 100m and utilize a variety of multiple-access techniques.They work in a number of frequency bands including 2.4 to 2.483 GHz,5.15 to 5.35 GHz, and 5.725 to 5.875 GHz. They do not need frequencyplanning because the building fabric is assumed to provide sufficientisolation between the different W-LAN systems. The cost per line of thesesystems is currently around the $1,000 mark. Most W-LANs conform tothe IEEE 802.11 standard.
Some WLL operators and manufacturers have looked at the possibil-ity of changing the frequency band to the 3.4-GHz band widely used forWLL, increasing the transmitter power and utilizing directional antennasso that the range can be increased. During 1998, a U.K. WLL operator,Tele2, signed a contract with a U.S. W-LAN manufacturer, BreezeCom,for the delivery of such a system and at the end of 1999 announcedcommercial service.
The advantages of such an approach are that most of the equipment isoff the shelf and benefits from the economies of scale achieved fromW-LAN sales. As a result, at the start of 1999, it offered better availabilityand cost that any other broadband technology. Because it is based on theEthernet, it is also a packet-based system, allowing very efficient access tothe Internet. Early versions, however, only provide data and do not allowvoice transmission.
Despite these advantages, the systems raise many concerns. First, thetotal bandwidth is limited to around 1.6 MHz per carrier, limiting the
The broadband technologies 229
number of subscribers that can be handled. Second, the system has notbeen designed to operate with interference, and the use of the systemoutdoors removes the natural shielding between transmitters that thebuilding fabric provided. Third, the Ethernet is a relatively inefficient useof resources and hence the spectral efficiency is poor.
At the start of 1999, the general opinion was that these hybridsystems represented a good interim solution, but that once a custom-designed packet-based broadband WLL technology was available, thenthese solutions would no longer be adopted.
14.7 HiperAccess
In April 1997, ETSI established the Broadband Radio Access Networks(BRAN) project. The aim of the project was to utilize broadband LANtechnology and broadband fixed radio access to meet the needs of futuremultimedia applications and services. A suite of products was proposed�HiperLan for LAN systems, HiperAccess for WLL systems, and HiperLinkfor backhaul technologies. An excellent introduction to the BRAN proj-ects and HiperAccess in particular can be found in [6].
BRAN decided that there was a need for a high-bandwidth WLL prod-uct that could meet the need of consumers for variable-rate packet-basedInternet access at a low cost. Based on a study of a range of different typesof uses including Internet access, file transfer, and video distribution, asdiscussed in Section 14.1, BRAN came to the conclusion that a peak datarate of 25 Mbps would be sufficient for most applications.
BRAN noted the dilemma raised in Section 14.2, where it is shownthat high bandwidths per user are only available at high frequencies, butthat these suffer from short range. Much like CABSINET, BRAN decidedthat the solution to this problem would be to specify a repeater function�potentially as an integral part of the users� wireless terminal�whichwould improve the coverage substantially. By this means they intend toachieve a target range of 5 km.
At the time of writing in 1999, HiperAccess was still in its early days.Spectrum for its operation had not yet been identified and the standardshad only gone as far as the requirements stage, with no detailed work onaspects such as the multiple-access system. It was supported by a widerange of manufacturers and the intention was to complete the bulk of the
230 Introduction to Wireless Local Loop
standardization work by June 2000, although at the time of writing therewere indications that this would be delayed.
If HiperAccess delivers a system as promised and on time and it iswidely accepted, it could go on to become the WLL technology of thefuture. However, there are many potential problems to overcome yet.Standardization is notoriously time consuming and it is quite possible thatthe standards will be delayed from the date set. If, say, the standards aredelayed until 2001, this could result in equipment not being delivereduntil 2003. By this time there could already be a wide range of broadbandsystems on the market and manufacturers could be unwilling to developyet another one. There are also potential problems with spectrum forthis system.
Finally, and perhaps most critically, there are many concerns over thecost. With a broad bandwidth, the potential need for repeater functional-ity in each terminal, and probable operation at a high frequency, theterminals may be relatively expensive compared to systems providing,say, 2 Mbps. It is far from clear whether users will pay a premium forthis higher data rate, or whether they will want to transmit and receivesubstantial video files as HiperAccess has assumed. It may be that systemsoffering 2 Mbps provide the user with a better mix of price and functional-ity than HiperAccess offers. Time will tell, but in this case it could be along wait.
14.8 Broadband proprietary products
In principle, there is little difference between broadband and narrow-band, other than a wider bandwidth signal being transmitted. The sameaccess techniques, error-correction techniques, modulation techniques,and so on can be used. CDMA systems can become a little more difficultbecause once a high bandwidth (e.g., 2 Mbps) is multiplied by a typi-cal spreading factor (e.g., 128) the resulting bandwidth of 256 Mbpsrequires baseband circuitry operating at this rate or higher in order toperform the decorrelation function. However, smaller spreading factorscan be used, and baseband circuitry operating at above 100 MHz isnow well established. A limited number of products are already avail-able providing broadband data rates and these are examined in thissection.
The broadband technologies 231

14.8.1 Floware
This system is also manufactured by Siemens under the name Walkair.The system works in the 3.5- and 10-GHz frequency bands. It utilizesradio channels 1.75 MHz wide and can provide data rates of between64 Kbps and 4 Mbps per user. It can provide both voice and data services.The multiple access scheme is TDMA using frequency division duplex,and 64-level QAM modulation is utilized in conjunction with trelliscoding in order to maximize the efficiency of use of the radio channel. Itutilizes dynamic channel allocation to ease frequency planning. Like theTelescicom system, it supports the transmission of packetized data overthe air.
14.8.2 Telescicom
Telescicom has two products known as Mega Cell and Mega Loop. MegaCell is a high-speed stand-alone overlay system designed to operatealongside narrowband cellular or WLL systems providing a high data rateto users. It utilizes CDMA coupled with TDD and supports Ethernetapplications through its compatibility with the IEEE 802.3 standard. It isavailable within a wide range of different frequency bands. The MegaLoop product appears similar but also offers telephony in addition to thedata services provided by Mega Cell.
14.8.3 Adaptive Broadband and Ensemble
Two companies, Adaptive Broadband and Ensemble, are both develop-ing what appears to be very similar technologies. Both technologies arebased on TDD-TDMA with bandwidths of up to 20 MHz per carrier. Bothare packet-oriented so users are not able to establish a permanent circuitfor their transmissions. These systems are interesting in that they utilize atechnology that would almost certainly not work in a mobile system dueto the fact that a 20-MHz bearer would result in substantial ISI. In thefixed environment, as explained in Section 10.1, there is much less ISIand so such wide bandwidth carriers can be utilized with less powerfulequalizers than would otherwise be the case. Adaptive Broadband havenoted that they are using 20-tap equalizers in their system.
The advantages of these two systems are:
232 Introduction to Wireless Local Loop

◗ A TDMA approach is relatively simple and easily allows a single userto access all of the bandwidth simply by assigning them all thetimeslots.3
◗ A TDD approach provides the maximum flexibility and efficiency incases where traffic is asymmetric.
◗ It is relatively easy to scale the technology to different bandwidths.
Indeed, it would appear that this type of technology is probably the bestsuited of all the broadband technologies for users who only require databut at relatively high rates of up to around 15 Mbps per user. This may bethe case for small office/ home office (SOHO) operations in developedcountries.
The Adaptive Broadband system utilizes ATM format transmissionand effectively provides a �pipe� that connects to a user�s computer at oneend and to a network at the other. The system is aimed more at data usageand indeed voice capabilities are not provided on the basic system, theassumption being that voice is just an application that the users canachieve by adding the appropriate hardware or software (e.g., a voiceover IP, VoIP) to their computers.
Adaptive Broadband also promises that their system will delivervariable-level modulation, with the basic system using QPSK but, likeLMDS, a capability to change to different modulation levels such as16-QAM. Just as with LMDS, this may increase the capacity where thereare isolated cells, but in a clustered environment the increase in bits perhertz is likely to be offset by the necessary increase in cluster size in orderto provide the increased SIR needed.
These technologies are expected to be available during 2000/2001.
14.9 Mesh networks
Toward the end of 1999, at the time this second edition was being written,a number of small manufacturers were proposing �mesh networks.� Thebasic concept of a mesh network is that each of the subscriber devices has
The broadband technologies 233
3. In a CDMA arrangement, if a single user requires all of the bandwidth then they need toreceive multiple codes simultaneously, which results in a dramatic increase in thecomplexity of the subscriber unit.
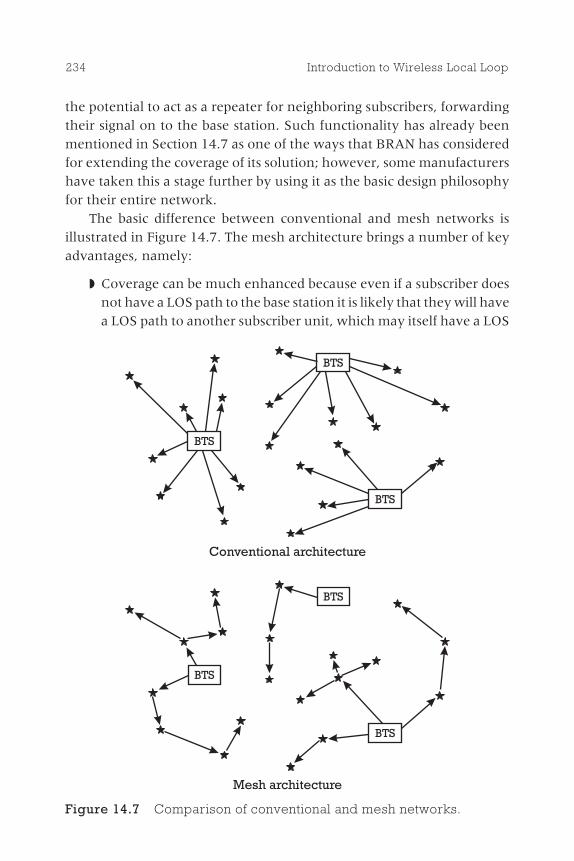
the potential to act as a repeater for neighboring subscribers, forwardingtheir signal on to the base station. Such functionality has already beenmentioned in Section 14.7 as one of the ways that BRAN has consideredfor extending the coverage of its solution; however, some manufacturershave taken this a stage further by using it as the basic design philosophyfor their entire network.
The basic difference between conventional and mesh networks isillustrated in Figure 14.7. The mesh architecture brings a number of keyadvantages, namely:
◗ Coverage can be much enhanced because even if a subscriber doesnot have a LOS path to the base station it is likely that they will havea LOS path to another subscriber unit, which may itself have a LOS
234 Introduction to Wireless Local Loop
Conventional architecture
Mesh architecture
BTS
BTS
BTS
BTS
BTS
BTS
Figure 14.7 Comparison of conventional and mesh networks.

path to the base station. Hence, both the range and the percentageof subscribers that can be serviced within the coverage area areimproved.
◗ It is possible that capacity can be increased because the spectrumcan be reused on a much smaller cell basis than with a conventionalarchitecture.
◗ By utilizing alternative routing paths in the case of network failure,much as can occur on the Internet, it is possible for higher reliabilityto be achieved.
However, mesh networks bring a number of problems that also needto be solved:
◗ Subscriber units tend to be costly and complex as a result of needingto be able to receive and forward multiple transmissions whileat the same time serving their own subscriber. For example, asubscriber unit may require four directional antennas�three toreceive signals from other units and one to forward onward towardthe base station.
◗ Antenna mounting becomes more complex. Instead of mountingon the side of a house it now becomes more desirable to mountabove the roofline to maximize the number of other nodes that arevisible.
◗ Steerable antennas are now required since the mesh may changeover time as new units are added and old units decommissioned.
◗ Automatic logarithms for mesh design are required so that they canrun in subscriber units but need to avoid the �hot spot� problemthat can often occur where one subscriber unit in a particularly stra-tegic location (e.g., able to see both the base station and a shadowedarea) becomes overwhelmed by the number of other subscriberunits attempting to communicate through it. Because the algorithmis decentralized, it can be difficult to resolve problems that occur ona more �global� level.
◗ Algorithms for frequency assignment within the mesh are requiredthat suffer from the same problem of needing to be decentralizedyet seeking to solve a global problem.
The broadband technologies 235
◗ Algorithms are required to enable one subscriber unit to �find�other nearby units, which can be problematic when narrow direc-tional beams are used for communications. In this case, getting bothbeams to point at each other, when the relative locations are notknown, can be very difficult.
◗ Delay can become problematic for subscriber units near the edge ofthe mesh, since it is necessary for their signals to be decoded andrecoded multiple times before reaching the base station.
◗ Base station locations may need to be changed as time goes on andthe mesh structure builds in unpredictable manners.
◗ Very little is known about mesh networks and how they will per-form in the real world, which makes their deployment high risk.
If all of these, and possible other, problems can be resolved, then meshnetworks may become a powerful tool for providing high data rates onhigh-frequency bands in dense urban environments. Perhaps the keyproblem is the complexity and cost of the subscriber unit�with pricesfalling rapidly for conventional units and wireless operators competingwith cable and ADSL providers, price is becoming increasingly important.
To date the only mesh networks that have been attempted have beenin rural areas and in applications where the data rate is very low (e.g.,electricity meter reading). It is clearly a risk to deploy such a networkgiven that the network may become unstable over time as more subscrib-ers are added. However, with a number of manufacturers such as Radiantand RoofTop Networks pursuing this area, it seems likely that trial sys-tems will be deployed during 2000 with, perhaps, the first commercialsystems being installed around 2001/2002.
References
[1] Gejji, R. R., �Channel Efficiency in Digital Cellular CommunicationsSystems,� Proc. 42nd IEEE Vehicular Tech. Conf., Denver, CO, 1992.
[2] Webb, W. T., �Modulation Methods for PCNs,� IEEE Commun. Magazine,Vol. 30, No. 12, Dec. 1992, pp. 90�95.
236 Introduction to Wireless Local Loop
[3] Webb, W. T., �Spectrum Efficiency of Multilevel Modulation Schemes inMobile Radio Communications,� IEEE Trans. on Commun., Vol. 43, No. 8,Aug. 1995, pp. 2344�2349.
[4] Lee, W. C. Y., �Spectrum Efficiency in Cellular,� IEEE Trans. on VehicularTech., Vol. 38, No. 2, May 1989, pp. 69�75.
[5] Haine, J., �HiperAccess: An Access System for the Information Age,� IEEElectron. Commun. Eng. J., Vol. 10, No. 5, October 1998, pp. 229�235.
The broadband technologies 237

Choosing the righttechnology
15.1 Introduction
By this stage, you have been introduced to awide range of different and confusing sys-tems. This chapter helps guide the operatorthrough choosing the most appropriate tech-nology. To do that, the chapter is split intocapacity, cost, and functionality comparisons.
Most operators will not be able to selectfrom the full range of technologies. Spectrumavailability will immediately limit the tech-nologies that can be adopted, making thechoice considerably simpler. Other factorswill have a heavy bearing on the capacityrequired, the maximum cost, and the servicesthat can be offered. Once all those factorshave been taken into account, the choice oftechnologies is likely to be very small indeed.
In this comparison, the broadband tech-nologies have not been included. These pro-vide such different services that an operatortypically would not have any difficulty decid-ing whether a narrowband or a broadbandsystem was most appropriate. Broadband
239
Contents
15.1 Introduction
15.2 Capacitycomparison
15.3 Cost comparison
15.4 Functionalitycomparison
15.5 Summary
15C H A P T E R
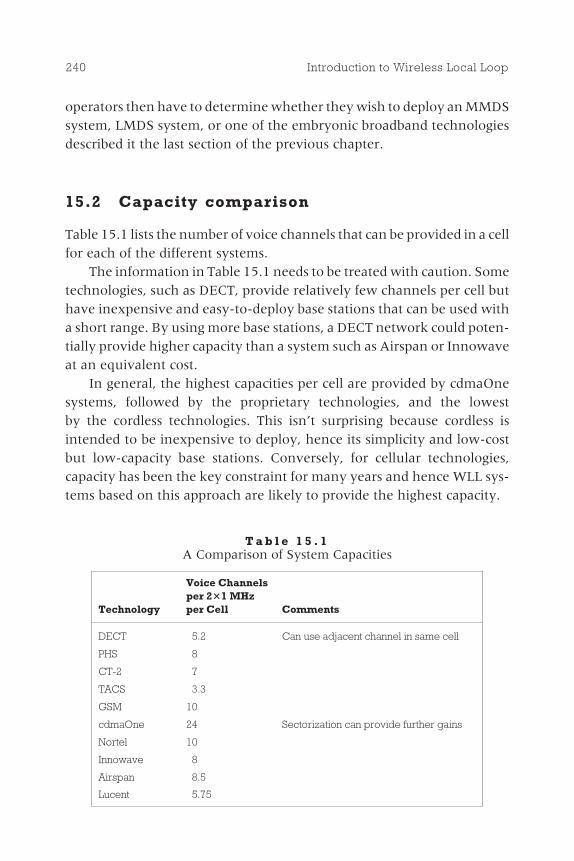
operators then have to determine whether they wish to deploy an MMDSsystem, LMDS system, or one of the embryonic broadband technologiesdescribed it the last section of the previous chapter.
15.2 Capacity comparison
Table 15.1 lists the number of voice channels that can be provided in a cellfor each of the different systems.
The information in Table 15.1 needs to be treated with caution. Sometechnologies, such as DECT, provide relatively few channels per cell buthave inexpensive and easy-to-deploy base stations that can be used witha short range. By using more base stations, a DECT network could poten-tially provide higher capacity than a system such as Airspan or Innowaveat an equivalent cost.
In general, the highest capacities per cell are provided by cdmaOnesystems, followed by the proprietary technologies, and the lowestby the cordless technologies. This isn�t surprising because cordless isintended to be inexpensive to deploy, hence its simplicity and low-costbut low-capacity base stations. Conversely, for cellular technologies,capacity has been the key constraint for many years and hence WLL sys-tems based on this approach are likely to provide the highest capacity.
240 Introduction to Wireless Local Loop
T a b l e 1 5 . 1A Comparison of System Capacities
Technology
Voice Channelsper 231 MHzper Cell Comments
DECT 5.2 Can use adjacent channel in same cell
PHS 8
CT-2 7
TACS 3.3
GSM 10
cdmaOne 24 Sectorization can provide further gains
Nortel 10
Innowave 8
Airspan 8.5
Lucent 5.75
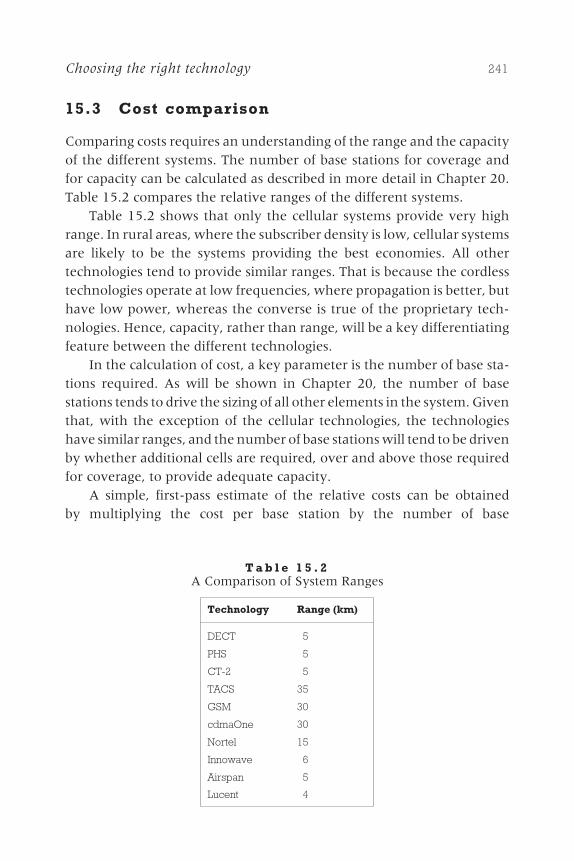
15.3 Cost comparison
Comparing costs requires an understanding of the range and the capacityof the different systems. The number of base stations for coverage andfor capacity can be calculated as described in more detail in Chapter 20.Table 15.2 compares the relative ranges of the different systems.
Table 15.2 shows that only the cellular systems provide very highrange. In rural areas, where the subscriber density is low, cellular systemsare likely to be the systems providing the best economies. All othertechnologies tend to provide similar ranges. That is because the cordlesstechnologies operate at low frequencies, where propagation is better, buthave low power, whereas the converse is true of the proprietary tech-nologies. Hence, capacity, rather than range, will be a key differentiatingfeature between the different technologies.
In the calculation of cost, a key parameter is the number of base sta-tions required. As will be shown in Chapter 20, the number of basestations tends to drive the sizing of all other elements in the system. Giventhat, with the exception of the cellular technologies, the technologieshave similar ranges, and the number of base stations will tend to be drivenby whether additional cells are required, over and above those requiredfor coverage, to provide adequate capacity.
A simple, first-pass estimate of the relative costs can be obtainedby multiplying the cost per base station by the number of base
Choosing the right technology 241
T a b l e 1 5 . 2A Comparison of System Ranges
Technology Range (km)
DECT 5
PHS 5
CT-2 5
TACS 35
GSM 30
cdmaOne 30
Nortel 15
Innowave 6
Airspan 5
Lucent 4

stations required for each technology. Here is where the difficultiesappear. The cost per base station is not publicized, is generally subjectto confidentiality agreements, and in any case is liable to significantchange. For these reasons, it is not possible to expand the analysis onrelative costs.
Some simple guidelines can be established if it is assumed that thecordless technologies all cost approximately the same and that the cost isapproximately half that of the other technologies. The overall effectwould be to make the cordless technologies the least expensive wherethey provided sufficient capacity without requiring additional base sta-tions above those needed for coverage. Where additional base stations arerequired, cordless technologies may be slightly less expensive than theproprietary technologies, but the differences are small. PHS probablyprovides the best combination of low cost and relatively high capacity,with DECT not performing so well.
15.4 Functionality comparison
Table 15.3 compares the functionalities provided by the different systems.The table shows that only DECT and the proprietary technologies couldbe classed as providing a full range of services. Of particular importance indeveloped markets is the provision of multiple lines, which only Nortel,Airspan, Innowave, and Lucent are able to provide.
15.5 Summary
Selecting the most appropriate technology is a process of taking theconstraints and using them as filters to derive a short list of technologies.The key filters are the following:
◗ The available frequency bands;
◗ The subscriber density;
◗ The competitive situation.
242 Introduction to Wireless Local Loop
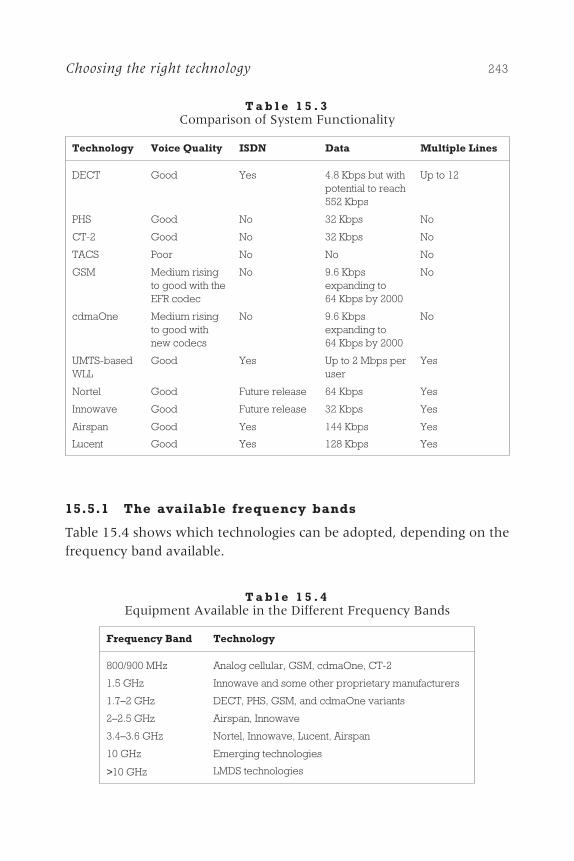
15.5.1 The available frequency bands
Table 15.4 shows which technologies can be adopted, depending on thefrequency band available.
Choosing the right technology 243
T a b l e 1 5 . 3Comparison of System Functionality
Technology Voice Quality ISDN Data Multiple Lines
DECT Good Yes 4.8 Kbps but withpotential to reach552 Kbps
Up to 12
PHS Good No 32 Kbps No
CT-2 Good No 32 Kbps No
TACS Poor No No No
GSM Medium risingto good with theEFR codec
No 9.6 Kbpsexpanding to64 Kbps by 2000
No
cdmaOne Medium risingto good withnew codecs
No 9.6 Kbpsexpanding to64 Kbps by 2000
No
UMTS-basedWLL
Good Yes Up to 2 Mbps peruser
Yes
Nortel Good Future release 64 Kbps Yes
Innowave Good Future release 32 Kbps Yes
Airspan Good Yes 144 Kbps Yes
Lucent Good Yes 128 Kbps Yes
T a b l e 1 5 . 4Equipment Available in the Different Frequency Bands
Frequency Band Technology
800/900 MHz Analog cellular, GSM, cdmaOne, CT-2
1.5 GHz Innowave and some other proprietary manufacturers
1.7�2 GHz DECT, PHS, GSM, and cdmaOne variants
2�2.5 GHz Airspan, Innowave
3.4�3.6 GHz Nortel, Innowave, Lucent, Airspan
10 GHz Emerging technologies
>10 GHz LMDS technologies
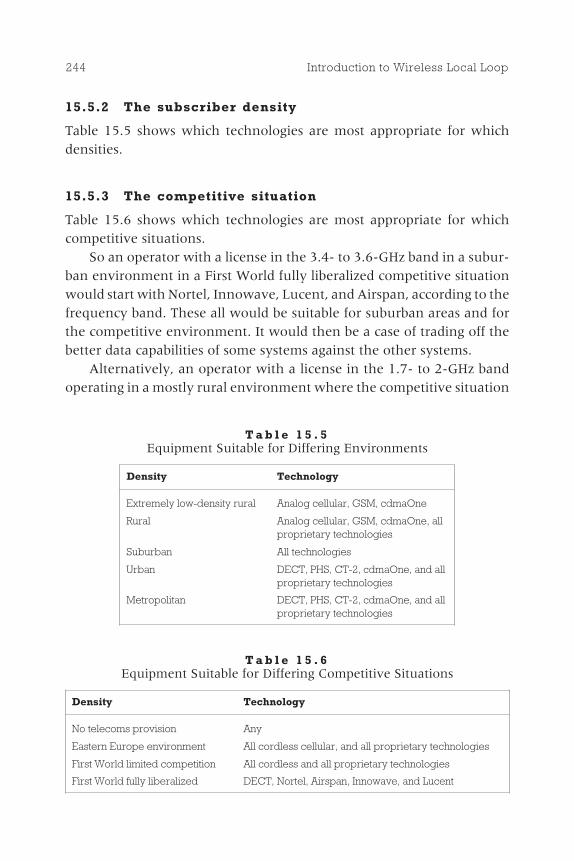
15.5.2 The subscriber density
Table 15.5 shows which technologies are most appropriate for whichdensities.
15.5.3 The competitive situation
Table 15.6 shows which technologies are most appropriate for whichcompetitive situations.
So an operator with a license in the 3.4- to 3.6-GHz band in a subur-ban environment in a First World fully liberalized competitive situationwould start with Nortel, Innowave, Lucent, and Airspan, according to thefrequency band. These all would be suitable for suburban areas and forthe competitive environment. It would then be a case of trading off thebetter data capabilities of some systems against the other systems.
Alternatively, an operator with a license in the 1.7- to 2-GHz bandoperating in a mostly rural environment where the competitive situation
244 Introduction to Wireless Local Loop
T a b l e 1 5 . 5Equipment Suitable for Differing Environments
Density Technology
Extremely low-density rural Analog cellular, GSM, cdmaOne
Rural Analog cellular, GSM, cdmaOne, allproprietary technologies
Suburban All technologies
Urban DECT, PHS, CT-2, cdmaOne, and allproprietary technologies
Metropolitan DECT, PHS, CT-2, cdmaOne, and allproprietary technologies
T a b l e 1 5 . 6Equipment Suitable for Differing Competitive Situations
Density Technology
No telecoms provision Any
Eastern Europe environment All cordless cellular, and all proprietary technologies
First World limited competition All cordless and all proprietary technologies
First World fully liberalized DECT, Nortel, Airspan, Innowave, and Lucent
is best characterized as Eastern European would start with the possibletechnologies as DECT, PHS, GSM, and cdmaOne, based on the frequencyband. The operator then would narrow that down to GSM and IS-95,according to the need for high range. Given the greater capacity of cdma-One, this would be the natural choice for this deployment.
Choosing the right technology 245

Looking at atechnology in detail:cdmaOne
16.1 Introduction
This chapter takes a look at one specific tech-nology in a lot more detail than has been pos-sible in the previous chapters in order toexamine some of the issues that arise. Cdma-One has been selected because it is the tech-nology predicted by analysts to take thelargest share of the WLL marketplace by2005. The fundamental details of cdmaOnewere explained in Chapters 8 and 9. Here theparticular implementation by the manufac-turer that currently has the largest share of theWLL marketplace, Motorola, is examined.
16.2 System architecture
An overview of the system architecture isshown in Figure 16.1. The key components ofthis figure are:
247
Contents
16.1 Introduction
16.2 Systemarchitecture
16.3 PSTN to WAMinterconnection
16.4 Wireless accessmanager
16.5 Base stations
16.6 Fixed wirelessterminal
16C H A P T E R
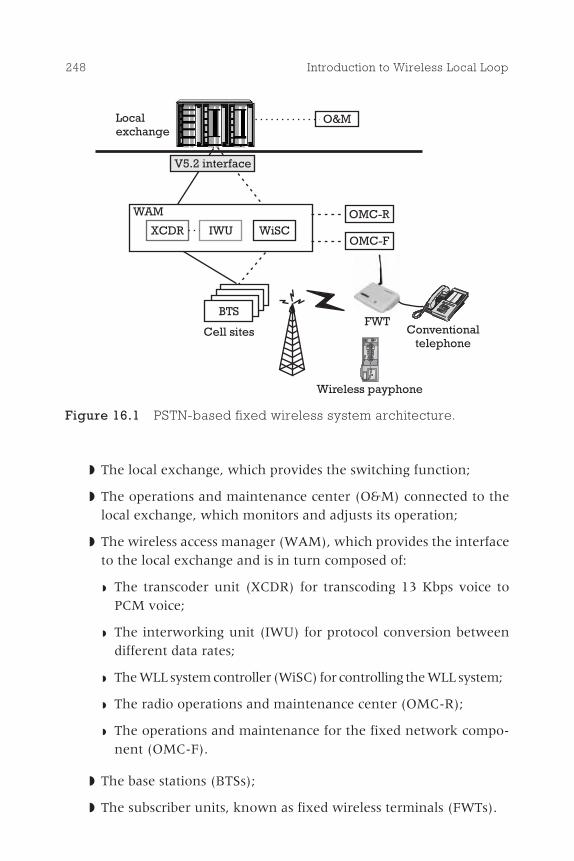
◗ The local exchange, which provides the switching function;
◗ The operations and maintenance center (O&M) connected to thelocal exchange, which monitors and adjusts its operation;
◗ The wireless access manager (WAM), which provides the interfaceto the local exchange and is in turn composed of:
◗ The transcoder unit (XCDR) for transcoding 13 Kbps voice toPCM voice;
◗ The interworking unit (IWU) for protocol conversion betweendifferent data rates;
◗ The WLL system controller (WiSC) for controlling the WLL system;
◗ The radio operations and maintenance center (OMC-R);
◗ The operations and maintenance for the fixed network compo-nent (OMC-F).
◗ The base stations (BTSs);
◗ The subscriber units, known as fixed wireless terminals (FWTs).
248 Introduction to Wireless Local Loop
BTS
O&M
V5.2 interface
OMC-R
OMC-FXCDR IWU WiSC
Cell sites
Wireless payphone
FWTConventional
telephone
Localexchange
WAM
Figure 16.1 PSTN-based fixed wireless system architecture.

16.3 PSTN to WAM interconnection
The PSTN is connected to the WAM using the V5.2 interface. This wasapproved by ETSI in 1991 and is specified in the ETS 300 347 standard.The V5.2 interface is also approved by the International Telecommunica-tions Union (Telecommunication Standardization Sector) and is knownas the ITU-T G.965 standard.
The V5 interface provides the connection between the local exchange(LE) and the access network (AN). The switch provides functions such ascall processing, billing, and the numbering plan, as well as supplementaryservices such as three-party calling and call waiting. The AN provides theinfrastructure to allow access to those services. The WLL part performsthe functions necessary to allow for radio access to the LE functionsincluding certain subscriber management functions, subscriber paging,authentication, radio resource allocation, and call delivery.
There are two variants of the V5 interface, known as V5.1 and V5.2protocols. The V5.1 is a single 2,048-Kbps interface that supports PSTNuser ports and ISDN basic access. The V5.2 interface is a more advancedprotocol that consists of up to sixteen 2,048-Kbps links.
16.3.1 Physical interface
The V5 interface utilizes the lower level protocols provided by the E1framing structure. An E1 link has 32 timeslots of which timeslot 0 isalways used for synchronization and alarms. Timeslot 16 is normally usedfor trunk signaling such as call setup commands. However, in the V5applications, depending on the switch, timeslot 16 may be used as acontrol link timeslot or as another voice timeslot. The LE is responsible forthe allocation of timeslots on the E1 interface. The AN provides calldelivery to the end user. The AN must always �request� that a call beset up.
16.3.2 V5.2 digital interface
In V5.2 up to 16 E1s can be �pooled together� and treated as a sin-gle �group.� This group or collection of up to 16 E1s is referred as a�V5 route.� A single V5 route is controlled by one control link. TheMotorola implementation uses two control links in an active/standbyfashion.
Looking at a technology in detail: cdmaOne 249
The first two E1s in the V5 route are configured as follows: (1) either29 or 30 timeslots are used as voice timeslots; (2) one timeslot on each ofthe first two E1s carries the control link. The 3rd through 16th E1 linksconfigured do not have any control channels but are all used for user traf-fic, allowing 31 timeslots to be used as voice trunks. If an E1 fails, onlythose timeslots are lost. Unlike V5.1, no single group of subscribers is leftwithout service because the timeslots are a pooled resource. All thathappens is the level of blocking goes up somewhat due to the reducednumber of timeslots available.
Whenever the AN wishes to use a timeslot, it asks the LE for an alloca-tion. The LE allocates a particular timeslot on a particular E1 link forthe duration of the call and when the call is over, the LE deallocates theresource.
16.3.3 V5.2 protocol flow
The following protocols have been specified in the V5.2 ETSI standard forthe exchange of the signaling and control information:
◗ Control protocol: control information related to the operational stateof supported user ports;
◗ Link control protocol: control information related to the operational stateand identification of any of the 2,048-Kbps links of the V5.2 interface;
◗ Bearer channel connection protocol (BCC): provides the means for theLE to request the AN to establish and release connections betweenspecified AN user ports and specified V5.2 interface timeslots;
◗ Protection protocol: mechanisms that can be used to protect activecommunication channels;
◗ PSTN protocol: transfers information about the analog line state overthe V5 interface to the LE, which supervises the call.
A schematic of the V5.2 protocol flow is shown in Figure 16.2.
16.3.4 System configuration using a networkinterface unit
When a V5.2 interface is not available at the PSTN, a network interfaceunit (NIU) is added to the system configuration as shown in Figure 16.3.
250 Introduction to Wireless Local Loop
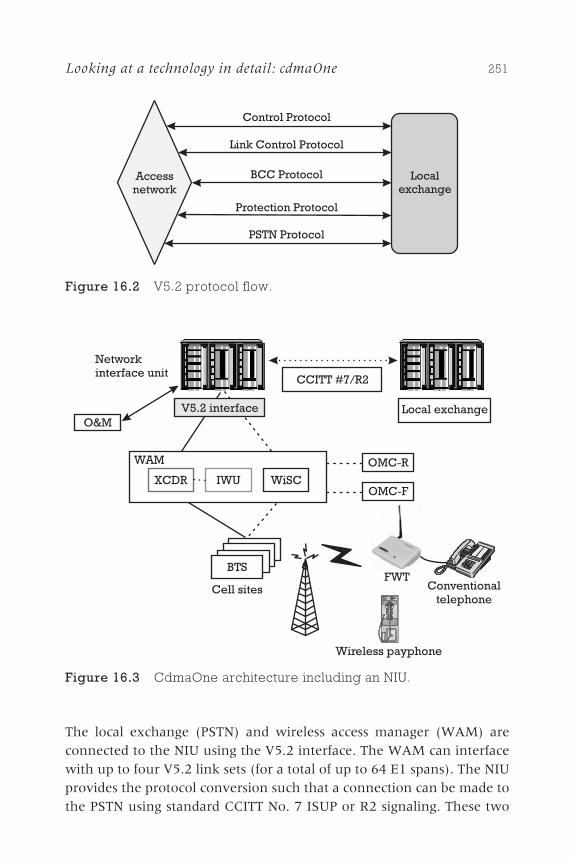
The local exchange (PSTN) and wireless access manager (WAM) areconnected to the NIU using the V5.2 interface. The WAM can interfacewith up to four V5.2 link sets (for a total of up to 64 E1 spans). The NIUprovides the protocol conversion such that a connection can be made tothe PSTN using standard CCITT No. 7 ISUP or R2 signaling. These two
Looking at a technology in detail: cdmaOne 251
PSTN Protocol
Protection Protocol
BCC Protocol
Link Control Protocol
Control Protocol
Accessnetwork
Localexchange
Figure 16.2 V5.2 protocol flow.
BTS
O&MV5.2 interface
CCITT #7/R2
Local exchange
OMC-R
OMC-FXCDR IWU WiSC
Cell sites
Wireless payphone
FWTConventional
telephone
Networkinterface unit
WAM
Figure 16.3 CdmaOne architecture including an NIU.

forms of signaling are less efficient than V5.2 since they require a dedi-cated link per subscriber, that is, no concentration is provided. However,in some cases, old exchanges cannot be upgraded to V5.2 capability and itis necessary to make use of an NIU.
16.4 Wireless access manager
The WAM with an optional operations and maintenance center�radio(OMC-R) serves as a means of connecting the switching network withthe base stations. The WAM controls digital signal coding, provides theinterface to the BTSs, establishes an interconnect to the local PSTN, andprovides authentication, subscriber management, and call routing. Theoptional OMC-R serves as an interface to the system and providesconfiguration, fault detection, security, and performance management.
WAM capacity depends upon the average number of subscribersserved by the cell sites in the system. This is driven by the call models usedfor the subscriber, which is mainly dependent on the traffic per sub-scriber. Other factors that influence the WAM capacity include thenumber of cell sites in the system, the addition of an interworking unit(IWU) to support data calls, the percentage of data calls versus voice calls,the grade of service (GOS) for the subscriber, and the number of busyhour call attempts per subscriber.
The WAM includes the WiSC, XCDR, and IWU, which are describedin more detail next.
16.4.1 Wireless system controller (WiSC)
The WiSC controls the system�s radio channels and serves as a perform-ance monitoring concentration point for all cell sites. It supports severalI/O protocols that are used to communicate with other entities in the sys-tem including the switch, the OMC-R, the transcoders, and the cell sites.
The WiSC communicates with the PSTN via the V5.2 interface, pass-ing subscriber and billing data as appropriate. The WiSC includes (1) a callprocessing platform to process calls to and from WLL subscribers and(2) a subscriber access manager to manage the translation betweena wireless phone number and the electronic serial number (ESN) ofthe FWT.
252 Introduction to Wireless Local Loop

16.4.2 Transcoder (XCDR)
The major functions of the transcoder are:
◗ Terminating the BTS span lines (E1/T1) and forwarding the BTSsignaling messages to and from the WiSC;
◗ Transcoding of voice between PCM and the voice coding usedwithin cdmaOne;
◗ Link compression and decompression;
◗ Echo cancellation, which is required to compensate for the inher-ent delay of digital voice codes.
16.4.3 Interworking unit (IWU)
This translates between different data formats and data rates so thatthe 9.6-Kbps rate available on the WLL network can be matched with the64-Kbps bearer used by the E1 link.
16.5 Base stations
Various base stations are available depending on the site and the trafficrequirements in the area. The base stations include the following types.
16.5.1 SC2450 CDMA BTS
The SC2450 CDMA BTS is a single-frame, indoor base station. OneSC2450 CDMA frame can house two CDMA RF cages. Each cage containsthe control cards, channel-processing cards, and transceivers required tosupport one CDMA carrier. One single-tone linear power amplifier(STLPA) cage is required per CDMA carrier. A two-carrier BTS musttherefore be equipped with two RF cages and two STLPA cages.
The SC2450 CDMA BTS supports the 800-MHz CDMA air interface ineither omni transmit/omni receive or three-sector transmit/three-sectorreceive configurations.
16.5.2 SC614 CDMA BTS
The SC614 is a lightweight self-contained cell site platform that providesfull macrocell coverage for both 8- and 13-Kbps CDMA systems. The
Looking at a technology in detail: cdmaOne 253
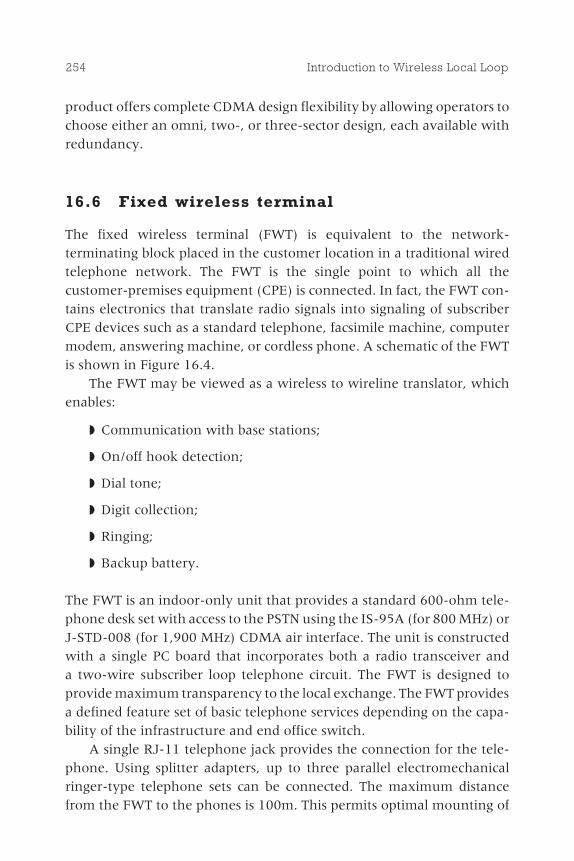
product offers complete CDMA design flexibility by allowing operators tochoose either an omni, two-, or three-sector design, each available withredundancy.
16.6 Fixed wireless terminal
The fixed wireless terminal (FWT) is equivalent to the network-terminating block placed in the customer location in a traditional wiredtelephone network. The FWT is the single point to which all thecustomer-premises equipment (CPE) is connected. In fact, the FWT con-tains electronics that translate radio signals into signaling of subscriberCPE devices such as a standard telephone, facsimile machine, computermodem, answering machine, or cordless phone. A schematic of the FWTis shown in Figure 16.4.
The FWT may be viewed as a wireless to wireline translator, whichenables:
◗ Communication with base stations;
◗ On/off hook detection;
◗ Dial tone;
◗ Digit collection;
◗ Ringing;
◗ Backup battery.
The FWT is an indoor-only unit that provides a standard 600-ohm tele-phone desk set with access to the PSTN using the IS-95A (for 800 MHz) orJ-STD-008 (for 1,900 MHz) CDMA air interface. The unit is constructedwith a single PC board that incorporates both a radio transceiver anda two-wire subscriber loop telephone circuit. The FWT is designed toprovide maximum transparency to the local exchange. The FWT providesa defined feature set of basic telephone services depending on the capa-bility of the infrastructure and end office switch.
A single RJ-11 telephone jack provides the connection for the tele-phone. Using splitter adapters, up to three parallel electromechanicalringer-type telephone sets can be connected. The maximum distancefrom the FWT to the phones is 100m. This permits optimal mounting of
254 Introduction to Wireless Local Loop

the FWT in an area of good RF coverage (such as near a window), whilebeing able to drive most any residential RJ-11 copper plant within ahome, apartment, or office. Telephone performance specifications arebased primarily on Bellcore standards, though certain variants of BritishTelecom standards are also supported. Secondary surge protection of thetelephone line is provided within the FWT. Primary protection is requiredif the connecting antenna cable or telephone line is routed outdoors, orinto an area exposed to lightning strikes. In these situations, an externalprimary surge protector is recommended, and a lightning arrester deviceshould be used on the antenna lead. If more service lines are required at asingle location, additional FWTs can be collocated if a minimum antennaseparation of at least 3m is maintained.
Looking at a technology in detail: cdmaOne 255
Compact size
Service andstatus LED
Power, batteryoperation, andfault LED
Generic 2.5 mm14V DC / 5%
power connector+ + −
RJ-45 jackData (serial)connection
RJ-12 jackTelephonesFax machinesProgramming
Battery backupOn/Off switch
External batteryMolex connector
50 ohm antennaconnector TNC
Modeminside
Figure 16.4 The Motorola FWT.

The FWT features an antenna port, which can support directlyconnected omnidirectional antennas or provide a coaxial connection forremote antennas. In situations of fringe coverage, CDMA design guide-lines may suggest that the omnidirectional antenna can be mountedremotely (even outdoors). Directional gain antennas may be required infringe areas.
The FWT is designed to be desk or wall mounted. An optional securitybracket is available for secure wall mounting of the FWT.
Various levels of self-test capabilities have been provided within theFWT. Two LEDs provide feedback to the user about the status of the FWT.One of the LEDs indicates the availability of the CDMA network and pro-vides feedback on relative signal strength during the installation process.The other LED indicates whether the FWT is operating on AC power orbattery power. In the event the unit detects an irrecoverable fault, thisLED turns red.
Motorola�s Windows-based FWT programming and diagnostic soft-ware (FWT-PDS) provides advanced test capabilities. When connected tothe FWT-PDS, the FWT can perform diagnostics on the two-wire loopconnected to the FWT and self-diagnostics on the FWT itself. Digital pathloopback can be used to verify the audio path integrity and to isolatefaults. Providing the infrastructure supports it, this allows the serviceprovider to quickly isolate problems remotely or on location.
When supported by the infrastructure, the FWT works with selectedelements of the O&M system to provide the operator with the followingcapabilities:
◗ Network status monitoring;
◗ Event/alarm management;
◗ Fault management;
◗ Performance management;
◗ Configuration management;
◗ Security management.
The FWT will not make unsolicited reports of alarms or events. Theoperator uses a custom electronic interface cable that connects the RJ-11jack of the FWT to a PC running the FWT-PDS application. Also the
256 Introduction to Wireless Local Loop
FWT-PDS can download new operating software into software releasecompatible FWTs.
The FWT can be field programmed. Parameters that require program-ming before proper field operation can be expected to include the mobileID, mobile phone numbers, system ID, network ID, and A/B band chan-nel number assignments. In addition, numerous parameters that describehow the FWT behaves can be programmed if desired. Examples includethe characteristics of the dial tone and other call progress tones, ringfrequency and cadence, and certain dialing parameters.
Looking at a technology in detail: cdmaOne 257

Deploying wirelesslocal loop systems
Part V deals with the practical deploymentof WLL systems, from applying for a
license to run a system through designingthe service, developing the business case, roll-ing out the network, and providing ongoingsupport.
WLL networks are based around cells thatdeliver signals to receivers and, as such, arebroadly similar to cellular systems. Nearlyall the aspects of deploying the system areclosely related to those for cellular. Readersmay also want to draw on other referencesand their own experience in the cellularindustry. Further, each country and each net-work is different; the information providedhere can only be a guide.
VP A R T

Getting a license
17.1 Spotting the opportunity
The first stage in gaining a license is noticingthat there is an opportunity to gain one.Chapter 4 introduced details about potentialmarkets in a number of different regions.Each operator will have its own view as towhich types of markets it favors, often basedon experience.
The simplest opportunities to spot arethose in the home country. Operators cur-rently providing a cellular or trunked net-work are well placed to notice whether thereappears to be a substantial unmet demandfor WLL. Individuals in the telecommunica-tions industry may be well placed to starttheir own companies to take advantage ofopportunities.
One simple way to spot opportunities isto monitor the actions of the governmentdepartment administering licenses for radioor telecommunications applications. Often,forthcoming competitions for licenses areannounced publicly, allowing an operator toinvestigate a potential opportunity.
261
Contents
17.1 Spotting theopportunity
17.2 Writing thelicense application
17.3 Radio spectrumfor WLL
17.4 Radio spectrumissues
17C H A P T E R
Operators that want to follow a formalized approach might considerthe procedure described in the following sections, where countries aresegmented into the following categories: developing countries, EasternEuropean countries, and First World countries. In effect, the proceduresdescribed below form a sieve into which pass all countries and out ofwhich fall the most attractive countries. Each category is examined indetail to discover whether additional factors affect its attractiveness.
17.1.1 Developing countries
Information should be gathered on the following factors:
◗ The current teledensity;
◗ The GDP per head;
◗ The political stability of the country;
◗ The telecommunications environment in the country, includingthe number of operators and the relative competition among them;
◗ The presence of international aid funding;
◗ Projected growth figures for the country.
Of key interest are countries with a relatively low teledensity com-pared to the GDP per head. Such countries are prime candidates for WLL,as long as there are no concerns over the stability of the country or thecompetitive environment. Information on GDP per head can be obtainedfrom a range of sources, for example, The Economist. Information on tele-density is available from organizations such as the ITU. Some typicalfigures for Latin America are shown in Table 17.1.
In Table 17.1, the second and third columns are relatively self-explanatory. The numbers in the fourth column are somewhat unusualand are obtained by dividing the teledensity by the GDP per head. Theresult is multiplied by 1,000 to make the numbers more legible. Column 4is a measure of whether a country is underserved or overserved relative toits GDP. For example, a country with a better provision of telecommuni-cations than would be expected for its GDP would score highly in thefourth column. An operator would be most interested in countries thatare poorly served relative to their GDP, because they would have a highdemand for telecommunications coupled with the capability to pay for
262 Introduction to Wireless Local Loop
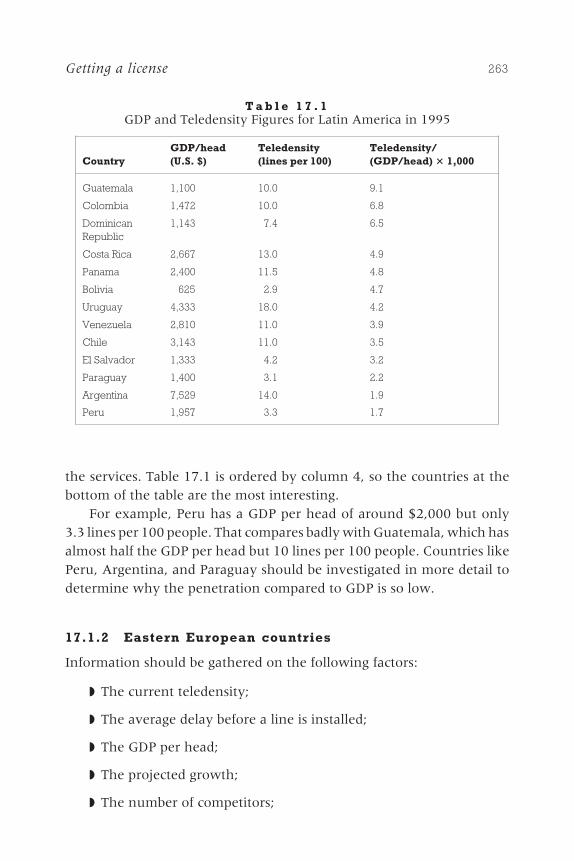
the services. Table 17.1 is ordered by column 4, so the countries at thebottom of the table are the most interesting.
For example, Peru has a GDP per head of around $2,000 but only3.3 lines per 100 people. That compares badly with Guatemala, which hasalmost half the GDP per head but 10 lines per 100 people. Countries likePeru, Argentina, and Paraguay should be investigated in more detail todetermine why the penetration compared to GDP is so low.
17.1.2 Eastern European countries
Information should be gathered on the following factors:
◗ The current teledensity;
◗ The average delay before a line is installed;
◗ The GDP per head;
◗ The projected growth;
◗ The number of competitors;
Getting a license 263
T a b l e 1 7 . 1GDP and Teledensity Figures for Latin America in 1995
CountryGDP/head(U.S. $)
Teledensity(lines per 100)
Teledensity/(GDP/head) 3 1,000
Guatemala 1,100 10.0 9.1
Colombia 1,472 10.0 6.8
DominicanRepublic
1,143 7.4 6.5
Costa Rica 2,667 13.0 4.9
Panama 2,400 11.5 4.8
Bolivia ...625 2.9 4.7
Uruguay 4,333 18.0 4.2
Venezuela 2,810 11.0 3.9
Chile 3,143 11.0 3.5
El Salvador 1,333 4.2 3.2
Paraguay 1,400 3.1 2.2
Argentina 7,529 14.0 1.9
Peru 1,957 3.3 1.7
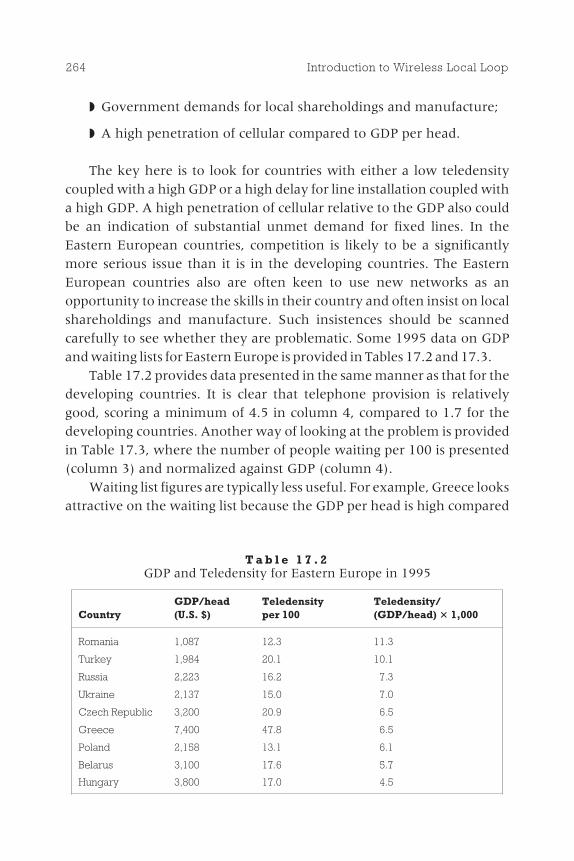
◗ Government demands for local shareholdings and manufacture;
◗ A high penetration of cellular compared to GDP per head.
The key here is to look for countries with either a low teledensitycoupled with a high GDP or a high delay for line installation coupled witha high GDP. A high penetration of cellular relative to the GDP also couldbe an indication of substantial unmet demand for fixed lines. In theEastern European countries, competition is likely to be a significantlymore serious issue than it is in the developing countries. The EasternEuropean countries also are often keen to use new networks as anopportunity to increase the skills in their country and often insist on localshareholdings and manufacture. Such insistences should be scannedcarefully to see whether they are problematic. Some 1995 data on GDPand waiting lists for Eastern Europe is provided in Tables 17.2 and 17.3.
Table 17.2 provides data presented in the same manner as that for thedeveloping countries. It is clear that telephone provision is relativelygood, scoring a minimum of 4.5 in column 4, compared to 1.7 for thedeveloping countries. Another way of looking at the problem is providedin Table 17.3, where the number of people waiting per 100 is presented(column 3) and normalized against GDP (column 4).
Waiting list figures are typically less useful. For example, Greece looksattractive on the waiting list because the GDP per head is high compared
264 Introduction to Wireless Local Loop
T a b l e 1 7 . 2GDP and Teledensity for Eastern Europe in 1995
CountryGDP/head(U.S. $)
Teledensityper 100
Teledensity/(GDP/head) 3 1,000
Romania 1,087 12.3 11.3
Turkey 1,984 20.1 10.1
Russia 2,223 16.2 7.3
Ukraine 2,137 15.0 7.0
Czech Republic 3,200 20.9 6.5
Greece 7,400 47.8 6.5
Poland 2,158 13.1 6.1
Belarus 3,100 17.6 5.7
Hungary 3,800 17.0 4.5

to other countries; thus, the relatively small waiting list results in a lowoverall score, which should indicate a particularly underserved market.However, the tables do agree on many countries. For example, bothTables 17.2 and 17.3 agree that Romania should be avoided becausethe GDP is so low that additional telecommunications is probably notaffordable by the population there.
17.1.3 First World countries
Information to obtain includes the following factors:
◗ Annual price reduction of services offered by the PTO;
◗ Number of competitors;
◗ Annual spending on telecommunications.
Essentially, the key is to look for uncompetitive PTOs, where anefficient WLL operator could gain market share rapidly. Places where thePTO has become competitive are normally marked by falling prices. Fal-ling prices also reduce the call charges that the WLL operator can offer.The most attractive markets are those where prices have been stable orhave even risen. The competitive environment is critical, and the totalspending allows the total market to be sized.
Getting a license 265
T a b l e 1 7 . 3GDP and Waiting Lists for Eastern Europe in 1995
CountryGDP/ head(U.S. $)
Number waitingper 100 people
Waiting list/(GDP/head) 3 1,000
Romania 1,087 5.7 5.2
Russia 2,223 7.3 3.3
Ukraine 2,137 6.9 3.2
Poland 2,158 6.3 2.9
Belarus 3,100 7.0 2.3
Czech Republic 3,200 6.0 1.9
Hungary 3,800 7.0 1.8
Turkey 1,984 1.1 0.6
Greece 7,400 2.0 0.3

17.2 Writing the license application
To be awarded a license, it is normal to submit a license application. Thescope and the content of a license application vary dramatically depend-ing on the situation. For example:
◗ Where the license award is by auction based on the highest pricepaid, the license application typically need only provide supportingproof of registration of the operator, possibly including financialstatements depending on requirements.
◗ Where the license application is noncompetitive, the document needsto explain clearly why the operator should be given the license.
◗ Where the license award is by a process known as a �beauty con-test,� a substantial and well-written document is required. In abeauty contest, the government typically sets a number of criteriaagainst which the bids are evaluated, such as improvements in tele-communications in the country, provision of jobs to the country,rollout plans, and efficiency of the use of the radio spectrum. Eachcriterion needs to be addressed fully to convince the regulator thatthe operator should be awarded a license.
The following general factors should be included in the licenseapplication:
◗ Introduction;
◗ Overview of the operator, including ownership and turnover;
◗ Details of the service proposed;
◗ A technical description of how the network will be realized;
◗ A demonstration that the radio spectrum required is being usedefficiently;
◗ Simplified business plans showing the justification for building thenetwork;
◗ A network build plan showing the speed with which the networkwill be built;
◗ A summary of the advantages to the country;
266 Introduction to Wireless Local Loop
◗ Appendixes, including coverage maps, detailed technical informa-tion (where appropriate), details of the frequencies required, andinterference assessments with other users of the radio spectrum(where required).
The most important fact to understand is what the regulator or thegovernment wants to get from the license award. Possible governmentobjectives include the following:
◗ Increasing the teledensity at a higher rate than the PTO could achieve;
◗ Providing telephony to rural regions;
◗ Stimulating local industry and improving local skills;
◗ Gaining a cash injection through the sale of radio spectrum;
◗ Providing competition to the PTO, thus driving down prices;
◗ Providing higher bandwidth services, thus allowing further eco-nomic development.
The criteria at the start of the preceding list tend to be most prominent inthe developing and Eastern European countries; those criteria at the endmore likely in the First World countries. Clearly, understanding theobjective and tailoring the license application and business plan in amanner that focuses directly on maximizing the benefit received by thegovernment will go a long way toward increasing the possibility ofthe license application being successful.
On a more prosaic level, remember that one of the key concerns of thegovernment officials who decide whether an application should begranted will be not to make an inappropriate decision. They will be look-ing for reassurance that the organization is competent and will performas specified. Presenting a substantial and well-formatted applicationdocument will go some way to reassuring them that the application isgenuine and the organization competent.
17.3 Radio spectrum for WLL
All WLL systems require radio spectrum. Without radio spectrum therecan be no transmissions. However, radio spectrum is a scarce resource
Getting a license 267
with numerous competing demands, managed by government-appointed bodies. Many potential WLL networks fail because of an inabil-ity to gain sufficient spectrum. This part of the book is designed to helpoperators by enabling them to better understand the spectrum manage-ment process and hence enable them to deal successfully with thespectrum manager. This section is quite long�a lot is happening inspectrum management and the changes will be of critical importance to aprospective operator, hence they need to be properly understood. Thesection looks first at the issues of finding spectrum for WLL and the needfor regulatory support and then goes on to explain the key players inspectrum management, looking at why spectrum management is chang-ing and the likely results. It ends with a discussion as to how spectrummanagement should be performed and the implications of this for theWLL operator and the equipment.
17.3.1 Finding radio spectrum for WLL
Finding radio spectrum for new applications such as WLL is problematic.First, finding spectrum that can be freed from its existing use is difficult.Second, most regulators are unwilling to allocate spectrum to an applica-tion until they are assured of its success; they want to avoid clearing aband only to find that the spectrum will not be fully utilized. A particularproblem with WLL has been the wide range of applications for whichWLL is in use around the world. This range of applications has requireddifferent frequency bands. For example, ISDN services in developedcountries require a different band from basic voice provision in ruralapplications. As a result, no single band has emerged as the clear favoritefor WLL, and hence regulators are left in some doubt as to the allocationswhich they should make. Current frequency bands in use for WLLinclude those shown in Table 17.4.
The wide range of allocations shown in Table 17.4 has suggested tomany regulators that no single key band should be allocated to WLL, butthat it is acceptable to provide whatever frequency band proves the moststraightforward to clear. The result of this has been that for potential WLLoperators in most countries in the world, gaining spectrum in one of theabove bands has proved problematic. In many cases, the difficulty inobtaining radio spectrum has tended to bias operators toward selectingtechnologies for which spectrum is already available; key among these
268 Introduction to Wireless Local Loop
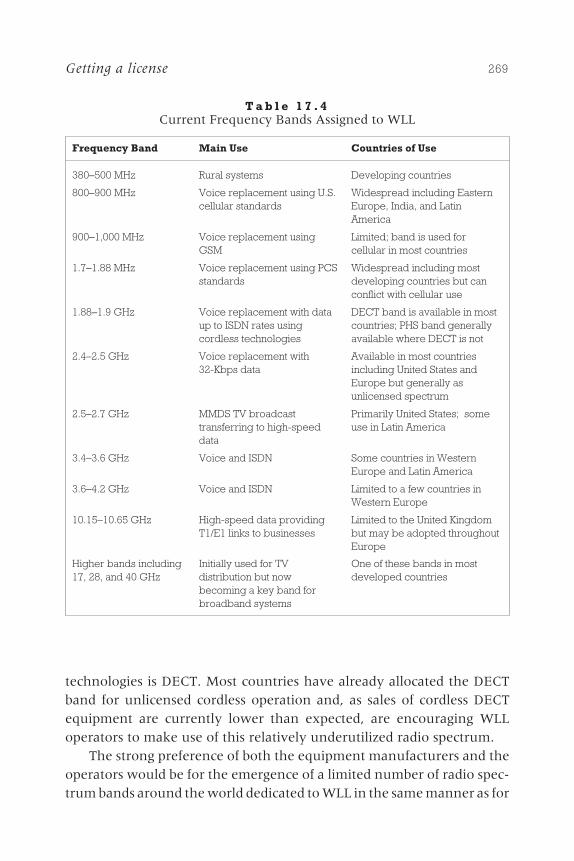
technologies is DECT. Most countries have already allocated the DECTband for unlicensed cordless operation and, as sales of cordless DECTequipment are currently lower than expected, are encouraging WLLoperators to make use of this relatively underutilized radio spectrum.
The strong preference of both the equipment manufacturers and theoperators would be for the emergence of a limited number of radio spec-trum bands around the world dedicated to WLL in the same manner as for
Getting a license 269
T a b l e 1 7 . 4Current Frequency Bands Assigned to WLL
Frequency Band Main Use Countries of Use
380�500 MHz Rural systems Developing countries
800�900 MHz Voice replacement using U.S.cellular standards
Widespread including EasternEurope, India, and LatinAmerica
900�1,000 MHz Voice replacement usingGSM
Limited; band is used forcellular in most countries
1.7�1.88 MHz Voice replacement using PCSstandards
Widespread including mostdeveloping countries but canconflict with cellular use
1.88�1.9 GHz Voice replacement with dataup to ISDN rates usingcordless technologies
DECT band is available in mostcountries; PHS band generallyavailable where DECT is not
2.4�2.5 GHz Voice replacement with32-Kbps data
Available in most countriesincluding United States andEurope but generally asunlicensed spectrum
2.5�2.7 GHz MMDS TV broadcasttransferring to high-speeddata
Primarily United States; someuse in Latin America
3.4�3.6 GHz Voice and ISDN Some countries in WesternEurope and Latin America
3.6�4.2 GHz Voice and ISDN Limited to a few countries inWestern Europe
10.15�10.65 GHz High-speed data providingT1/E1 links to businesses
Limited to the United Kingdombut may be adopted throughoutEurope
Higher bands including17, 28, and 40 GHz
Initially used for TVdistribution but nowbecoming a key band forbroadband systems
One of these bands in mostdeveloped countries

cellular. Given the allocations already made, it would appear sensible tostandardize on a worldwide basis:
◗ Operation of WLL systems within cellular frequency bands at thediscretion of the operator;
◗ The provision of the DECT band;
◗ The 3.4- to 3.6-GHz band for data rates up to 1 Mbps;
◗ The 10-GHz band for high bandwidth applications;
◗ The 28-GHz band for very high bandwidth applications.
17.3.2 Regulatory matters
As well as deciding about the provision of radio spectrum, decisions needto be made on a number of other important matters concerning thedeployment of WLL, including these:
◗ The number of licenses to be awarded;
◗ The provision of a regulator to ensure fairness in the areas ofinterconnect and cross-subsidy;
◗ The need for tariff rebalancing;
◗ The detailed terms of the license including aspects such as cov-erage obligations, technology obligations, and universal serviceobligations.
The number of licenses to be awarded can be a complex decision. Manycountries have a preference to issue multiple licenses in order to ensurecompetition. There may also be other aspects to the license, such as a uni-versal service obligation, that would make the awarding of competitivelicenses problematic. However, in the absence of such aspects, the lowpenetration required in order for a WLL operator to be profitable wouldseem to imply that more than one license could successfully be awardedsubject to the availability of sufficient radio spectrum. Interestingly, at thetime of writing, even the European Commission does not appear to haveformulated a policy in this area, despite their strong guidelines for licenseawards to cellular operators. However, a general EC policy documentconcerning competition states that it is only legitimate to award a single
270 Introduction to Wireless Local Loop
license for a particular service for a case in which there is a shortage ofradio spectrum. Given the fact that demonstrating a shortage of radiospectrum is problematic, this would suggest that most European coun-tries would expect to issue more than one WLL license in each of the keyareas of their country, and other countries might do well to follow thisexample.
A strong regulatory body is essential if the WLL operator will be com-peting against an incumbent. The WLL operator will need to interconnectwith the incumbent, who may also be tempted to use international callcharges to subsidize local access, undercutting the WLL operator. Only ifthere is a strong regulator�with the capability to examine the accountsof the incumbent in order to ensure fair play�will it be possible for thenew operator to compete effectively.
Linked to the need to avoid cross-subsidy is the rebalancing of tariffs.In most cases, tariffs do not accurately reflect costs. Typically, 90% to 95%of the cost of providing a call resides in the local connection, andthe remaining 5% to 10% resides in the backhaul and international links.Hence, national calls should be only slightly more expensive than localcalls. However, national and international calls typically are much moreexpensive than local calls, with the high national and international costsubsidizing the reduced local call rate. It is this imbalance between thecost of provision of a local call and the price of a local call that is beingexploited by Internet service providers in order to deliver internationalconnections at a much lower price than the PTO. The regulator shouldrecognize that tariff rebalancing will take place once Internet telephonybecomes a serious possibility because this technology will allow usersmerely to pay a local call rate for all their calls. By encouraging tariffrebalancing at a more rapid rate, competition in the local loop can beintroduced more rapidly.
WLL systems are likely to have an impact on the universal serv-ice obligation (USO) of the existing PTO. At present, as explained inSection 4.6, most PTOs use urban subscribers (and international calls) tosubsidize the cost of connecting rural subscribers, since in a wired envi-ronment the cost of connection is nearly proportional to the density ofsubscribers. The new WLL operators will tend to focus on urban and sub-urban environments where they can achieve the maximum profitability.This impacts the USO in two ways. First, by capturing from the PTO thosesubscribers who perform the subsidization, the revenue available for
Getting a license 271
subsidization will fall. Second, rural subscribers will immediately beginpaying a higher price for their telecommunications because they will notbe able to migrate to the WLL operator who is offering a lower tariff. Theregulator may decide to ask the WLL operator to pay some portion of theirrevenue to a universal service fund�which can then be used by theincumbent to pay for the USO�but setting an appropriate level ofpayment is very difficult and threatens to reduce competition by forcingthe WLL operator to subsidize the much larger incumbent. It wouldgenerally be more appropriate for the government to explicitly subsidizerural connections rather than try to achieve this implicitly through theUSO if they have universal service as one of their key requirements.
17.3.3 Fixed and mobile applications
In many countries, telecommunications licenses specify whether theoperator can offer a fixed or a mobile service. Often, fixed operators arebarred from offering a mobile service and vice versa. This is a problematicarea�for example, if a subscriber plugs a mobile terminal into the mainterminal for it to be recharged, during that time it is effectively a fixedtelephone, but mobile operators could provide a service to that phone.Fixed users can provide themselves with a mobile service by adding acordless phone to their phone socket. The Italian fixed operator took thisone stage further by deploying DECT base stations throughout key cities,arguing that these are just extensions of the fixed service and not a truemobile service.1 As technology develops, the boundary between fixedand mobile services will become increasingly blurred and difficult to regu-late. In general, it seems less appropriate to distinguish between fixed andmobile services and more appropriate to simply allocate the spectrum fortelecommunications, letting the operators select the use that will providethe greatest benefit to them and, by implication, to the country.
This often leaves mobile operators considering providing a WLL servicewithin their existing spectrum and WLL operators looking at providing amobile service. For the mobile operators, it is typically only economical toprovide WLL service in rural areas where they have excess capacitybecause in the areas where they have capacity constraints, mobile calls
272 Introduction to Wireless Local Loop
1. As an aside, regardless of the regulatory issues, this system, like all other cordless �city�solutions proved to be a commercial failure, again showing that cordless does not have arole to play in the provision of limited mobility solutions.
provide the greatest revenue. For the WLL operator, the possibility of pro-viding a mobile service depends on the frequency band assigned. If theyhave a cellular band, then they can clearly provide a mobile service in justthe same manner as a mobile operator and, indeed, their revenue in thiscase may be maximized if they concentrate on mobile rather than fixedservice. If they have a license in the cordless bands or the bands above2 GHz, then typically the cost of providing a cellular service will be muchgreater than that faced by the cellular operators, and hence it would bemore appropriate to offer only a fixed service.
In summary, in cases where a cellular band has been assigned forWLL, difficulty arises when trying to regulate the use of the band andwhen deciding whether mobile applications should be allowed. However,regulators should attempt to impose as few restrictions as possible on theuse of bands and hence ideally should not specify whether the license isfixed or mobile.
17.3.4 Manufacturing WLL equipment for theworld market
Manufacturers currently face an uncertain market when designing theirWLL equipment. In particular, it is difficult to determine in whichfrequency bands a product should operate. Producing equipment that canwork in a wide range of different frequency bands would allow manufac-turers flexibility if different frequencies ended up being allocated by dif-ferent regulators, but would add complexity and expense to the product.With operators requiring the lowest cost product possible, the manufac-turer needs to make complex decisions as to the viability of developingproducts for different frequency bands.
Manufacturers also face difficulties in cases where there is uncer-tainty over whether a fixed or a mobile license has been awarded. If thelicense is purely a mobile license, then a mobile system can be offered;whereas if the license is purely for a fixed service, then a system withoutmobility and with links into the PSTN switch�rather than a mobileswitching center�can be deployed. However, in cases where there isuncertainty, for example, as to whether it will be possible to add mobileservices to a fixed network, equipment must be deployed that bothprovides fixed services at the lowest costs and can be upgraded to mobileservice.
Getting a license 273

17.4 Radio spectrum issues
17.4.1 Radio spectrum management
The world of radio spectrum management comprises a number of impor-tant institutions. The most important is the ITU (previously known as theCCITT, from the French for Central Committee for Telephony and Teleg-raphy). The radio division (ITU-R) is responsible for drawing up guide-lines for international spectrum use. The ITU has no formal power, butits importance is widely recognized and nearly all countries abide by itsrecommendations. The work of the ITU is conducted through biannualworld radio conferences (WRCs). At these conferences, proposals arediscussed for changes to the manner in which spectrum is used. Themeetings are often fraught with tension as each country tries to negotiatea settlement that meets its own interests. At the end of each conference,the ITU recommendations are updated. An ITU recommendation lookssomething like the stylized version shown in Table 17.5.
Each recommendation forms one page of a large book covering theentire radio spectrum band from 10 kHz through to around 300 GHz. ForITU recommendations, the world is divided into three regions:
◗ Europe, Russia, and Africa;
◗ North America and South America;
◗ The rest of the world.
For each region, a primary allocation is shown in uppercase letters.The primary allocation has key rights over the spectrum, can use the spec-trum without concern for the interference it generates (within thefrequency band designated), and can expect not to suffer interferencefrom others. There also may be a secondary allocation, which is shown in
274 Introduction to Wireless Local Loop
T a b l e 1 7 . 5A Stylized Example of an ITU Recommendation
Frequency Band 1.455 GHz�1.460 GHz
Region 1 Region 2 Region 3
FIXED FIXED SATELLITE
aeronautic (note 234) MOBILE fixed
lowercase letters. The secondary allocation has to coexist with the pri-mary allocation, must not interfere with the primary allocation, and mustexpect to suffer interference. Secondary allocation is known as sharing.Sharing often works well between, for example, fixed links and satellitelinks, because both are stationary and can be planned around each other.In some cases, there are two primary allocations, which must interworkon a mutual status.
It is worth noting that the ITU-R recommendations actually are some-what vague. For example, the Region 2 allocation shown in Table 17.5allows almost any use of the radio spectrum, from private mobile radiothrough microwave links, wireless local loop, and so on.
As regards WLL, the ITU is important in providing guidance for bandsthat can be used worldwide, allowing economies of scale to be achieved.However, there is no ITU-R category for WLL, so countries will be seekinga FIXED status in a number of key bands, such as 3.4 to 3.6 GHz. Whetherthat will be achieved remains to be seen.
Below the ITU may be another layer of spectrum management, forexample, the CEPT represents Europe and Eastern Europe, and Africa hasan embryonic spectrum management body. Bodies like the CEPT have asan objective the standardization of spectrum use throughout Europe,easing cross-border issues, and providing a strong voice in WRC meetings.CEPT recommendations are much more specific than ITU recommenda-tions and might include a specific allocation for WLL. Like the ITU, theCEPT has no official power, but its decisions are respected by its members,who realize that doing so is in their best interests.
CEPT decisions are reached by consensus. Typically, one of the mem-ber countries or a standardization body provides an input document toCEPT stating an interest in a pan-European allocation for a particularapplication. Study teams are then appointed within CEPT to look into theissue. The teams assess the total spectrum requirements for the new serv-ice and the most appropriate frequency bands where the service might belocated. They then approach each of the members to understand whetherthe members might be able to make radio spectrum available for theapplication. Finally, they reach a recommendation as to what spectrumshould be allocated. All the members then vote on the recommendations.In some cases, members might choose not to accept the recommendationbecause of existing use of the spectrum. Generally, if the proposal haswidespread endorsement, CEPT accepts the allocation, although it may
Getting a license 275
be noted that in some countries the allocation will not be available in thenear future.
The CEPT also has been attempting to produce a common Europeanradio spectrum band plan. That has proved to be a task fraught with diffi-culties. The existing uses of the bands are varied throughout the CEPTcountries, and few members are prepared to change allocations (whichwould require users to replace their radio equipment) for the purposes ofharmonization. The CEPT has discovered that harmonization is possibleonly in the lesser used parts of the spectrum (e.g., above 3 GHz) and thenonly if the harmonization is a long-term goal (in this case, harmonizationis intended by 2008).
Below the multinational bodies lie the national spectrum managers,which are part of the government and administer both allocation andassignment on a national level. Their role includes making decisions as tothe use for a particular band within ITU and CEPT guidelines, decidingwhich operator will have access to the band, monitoring the band usage,and resolving cases of interference. The national spectrum managementbodies do have official power.
In general, a spectrum manager has three tasks:
1. Fair distribution of spectrum where there are a number of appli-cants for the spectrum (assignment);
2. Clearance of bands for new applications or the migration of usersto more efficient equipment as it is developed (clearance);
3. The decision as to how much spectrum to give to a particular use(allocation).
Currently, these decisions are typically made administratively andnot by the use of any clear and objective measures. A spectrum managerwill carefully consider the evidence, normally provided in a technical andeconomic form, and will make a judgment as to the most appropriatedecision.
For example, assignment normally is conducted either on a first-come first-served basis, in which the spectrum is given to applicantsuntil there is none left, or by a beauty contest, in which applicants arejudged according to criteria such as their financial standings and previoustrack records. Clearance occurs in two stages. First, after a long process of
276 Introduction to Wireless Local Loop
consultation, a spectrum manager makes a judgment that clearance is nec-essary. Then the incumbent is given a long period of time, typically 10 yearsor more, to move, which allows their equipment to depreciate fully. Allo-cation is performed mostly on a first-come first-served basis, with theadvantages of the contending uses weighed in an administrative manner.
Spectrum management is an issue only when the spectrum is con-gested (otherwise, there is sufficient spectrum to meet all apparent needs)and when use of spectrum can be improved through greater efficiency.
17.4.1.1 Congestion
Most users of radio spectrum have some intuitive understanding as towhen congestion is occurring. Rules of thumb adopted by the usersinclude when no channels are available at the site on which they apply fora license and when license rejection rates reach a significant level asperceived by the user. Although these rules of thumb are undoubtedlyuseful, to be used consistently, congestion should be defined on a morerigorous basis. A number of possible definitions have been considered, ofwhich the most promising is the following:
A band is congested when there is an excess of demand over supply. The
level of congestion is the cost to the potential users of using alternative
communications means where necessary.
That measure encapsulates the level of congestion and the importance ofthat congestion to the country. Where there is no congestion, the cost iszero. The difficulty with such a measure is that the excess demand often isnot clearly visible: some users do not apply for frequencies because theyare sure that their request will not be granted. Quantifying the additionalcosts faced by users also can be difficult because of commercial confidenti-ality. Despite these difficulties, approximations typically can be used inderiving this measure of congestion.
17.4.1.2 Efficiency
To understand how the term efficient use of the spectrum should be defined,it is necessary to consider the objectives of the spectrum manager. Thespectrum manager manages a valuable and finite resource on behalf ofthe government and hence the country. Good spectrum management can
Getting a license 277
be defined as maximizing the value that the country achieves from thisscare resource, leading to this definition:
Spectrum is used efficiently when it is used in such a way that the
economic value to the country of its use is maximized.
That definition is somewhat unsatisfactory because it is extremely diffi-cult to determine whether the economic value has indeed been maxi-mized. Nevertheless, some basic principles that can be used to help judgeefficiency can be established. The economic value achieved from a bandof spectrum is increased, more or less proportionally, as the number ofusers or the traffic generated per user is increased (as long as the qualityof service is maintained). The economic value is decreased as the cost ofusing the spectrum rises, for example, as equipment prices become moreexpensive. These principles show that, as an approximation, technicalefficiency can be used to help understand whether efficiency couldbe enhanced. There are a number of possible measures of technicalefficiency, but for the purposes of spectrum management, one study [1]suggests that the most appropriate measure is as follows:
Technical efficiency is a measure of the information transmitted per
megahertz per day, nationwide by a particular use or user.
As an example of this, approximations suggest that private mobile radio(PMR)2 users transmit only one quarter of the information transmittedper megahertz by cellular users. Hence, were PMR users accommodatedon cellular, only one quarter of the spectrum currently used for PMRwould be required. To determine whether that would improve efficiency,it is necessary to look further at the value gained by PMR users by exam-ining the functionality they achieve from their system. This topic is dis-cussed in detail in [1], but suffice it to say here that for some users withdemanding requirements, efficiency is greater if they remain with PMR,despite a lower technical efficiency. For most users, however, a higherefficiency of use would be expected on cellular.
There is a further dimension to efficiency. The spectrum is used mostefficiently when both allocation and assignment are performed in such amanner as to divide the spectrum among the users who generate the
278 Introduction to Wireless Local Loop
2. Known as specialized mobile radio (SMR) in the United States.
greatest economic value for the country. Typically, technical efficiencyseeks only to improve the use of spectrum within the existing allocationframework.
17.4.1.3 New trends
The emergence of a number of new trends and pressures in the use andregulation of radio spectrum is making the task of spectrum managementincreasingly difficult. Two of those trends are discussed here: first, thoseoriginating from the users of radio spectrum, and second, those originat-ing from the government. As regards the users, the following problemsarise:
◗ The continuing growth in demand among existing spectrum users;
◗ The dramatic increase in new applications requiring radiospectrum;
◗ The increasing profit that can be made from possession of a licenseto operate a telecommunications network in certain frequencybands, resulting in increasing pressure on the spectrum manager tomake such licenses available.
In regard to the government, a number of trends are taking place, suchas the need for revenue, fairness, and increased competition. These overallobjectives, which affect all parts of government policy, also have an impacton spectrum management policy, affecting the manner in which thespectrum manager works. Important trends include the following:
◗ The need for greater openness in government;
◗ The trend toward deregulation of the telecommunications sectorand the increased competition that has resulted;
◗ The use of spectrum as a fundraising resource by some govern-ments;
◗ The possibility of privatization of the spectrum manager.
17.4.1.4 Growth in demand
One major problem facing spectrum managers is the ever-increasinggrowth in demand. In many countries, for example, the growth in cellu-lar radio subscribers is some 60% per year. Even in the world of PMR,
Getting a license 279

whose demise has been predicted numerous times, annual growth con-tinues to exceed 6% in the United Kingdom. To some extent, that growthin demand can be met by advances in technology.3 However, at best theadvances in technology cancel the growth of users, and in the high-growth world of cellular they do not come close to accommodatinggrowth. The growth in demand can only increase the pressure on thespectrum manager to find additional spectrum.
17.4.1.5 Dramatic increase in new applications
In addition to growth in existing applications, recent years have seena dramatic increase in the overall number of applications vying forspectrum. This has been caused mainly by improvements in technol-ogy, which have made certain applications possible, and by reductions inequipment cost, which has made existing applications economicallyviable for new deployments. New applications that have arisen recentlyinclude mobile-to-satellite communication systems, such as Iridium andGlobalstar, and, of course, WLL systems.
17.4.1.6 The profits to be made from spectrum use
Organizations offering services based on the spectrum they have beenassigned are generating increasingly large profits. For example, cellularoperators throughout Europe are seeing their values increase rapidly. Therealization that access to radio spectrum is becoming increasingly profit-able is causing more commercial operators to bring increasing pressure tobear on spectrum management organizations for access to the appropri-ate spectrum, both through direct lobbying to the spectrum manager andindirect lobbying through elective bodies. The pressures brought to bearin this manner are typically much more forcefully expressed than thosewhere profit is not the key driving element.
280 Introduction to Wireless Local Loop
3. For example, PMR channel bandwidth has tended to be halved approximately every10 to 15 years (25-kHz channels in the 1970s, 12.5-kHz channels in the 1980s, and6.25-kHz channels in the 1990s). Each halving approximately doubles capacity. Anannual growth rate of 6% requires that capacity be doubled every 12 years to accom-modate growth. Thus, in this case, technical advances are meeting the demand forgrowth. This is not true in cellular, where growth of 60% per year outstrips technicaladvances, which achieved a capacity increase of around 100% in the last 10 years.
17.4.1.7 The need for openness
Government departments, especially in the developed world, are comingunder increasing pressure to act in an open manner, with key decisiondocuments made publicly available and the evaluation criteria for majordecisions publicized. This can pose problems for spectrum managers usingthe current judgment-based methods for allocating and assigning spec-trum because it is often difficult to clearly and simply justify a decisionoften reached after a long process of weighing contradictory claims. Usingan approach such as an auction, where the winner is universally under-stood to be the entity paying the most, provides a much more open andtransparent means to assign spectrum.
17.4.1.8 Deregulation and increased competition
In many developed countries there is a trend to deregulate the telecom-munications sector. Such moves are attractive to the state and to thepopulation because increased competition often brings about betterservice and lower prices. However, deregulation can cause problems tothe spectrum manager. Increased competition typically brings with itrequirements for more spectrum without actually offering any additionalservices to the public. Additional spectrum must be provided to the newoperators on a fair and equitable basis compared with the assignment tothe incumbent.
17.4.1.9 Use of spectrum as a government revenue-raisingresource
It has been known for many years that radio spectrum is a valuableresource, but recently governments have discovered that they can cap-ture part of the value through selling the radio spectrum in some form. Inan era when governments are under pressure to balance budgets withoutincreasing taxes or reducing social provision, the pricing of radio spec-trum�along with other revenue-raising techniques such as privatiza-tion�is seen as an important supplementary source of income. That canincrease the pressure on spectrum managers to move toward revenue-raising economic spectrum management approaches.
17.4.1.10 Privatization of the spectrum manager
In some developed countries, there is a desire to reduce the overall size ofgovernment by returning as many functions as possible to the private
Getting a license 281
sector. Normally this is achieved through the process of privatization.Such a move could change the way spectrum managers operate.
17.4.2 Modern allocation and assignment methods
There are a number of economic techniques spectrum managers can use.They are listed next, along with details of which of the trends identifiedin Section 17.4.1 they are able to address. Each technique is then dis-cussed in detail.
◗ Economic value of spectrum analysis estimates the value that thecountry achieves from each different use of the spectrum andhence gives some signals as to which uses should be preferred. Thistechnique helps overcome the difficulty of the increasing numbersof new applications.
◗ Administrative pricing increases the annual license fee required forthe spectrum to a level that encourages users to make carefulchoices about the efficiency with which they use the spectrum. Thistechnique helps overcome the growth in demand and the pressureson assignment, as well as all the difficulties associated with govern-ment policies.
◗ Trading allows users a range of rights to sell or lease spectrum andpossibly to subdivide their assignment. This technique helps over-come the growth in demand, the growth of new applications, andthe profit-driven pressure on assignment. It also provides greateropenness and allows more deregulation of the telecommunicationssector.
◗ Competitions such as auctions determine to whom large blocks ofspectrum should be assigned. This technique overcomes the growthin demand, the profit-driven pressure, and all the governmentobjectives.
Table 17.6 shows which tool can be used to solve which general task.In some cases, it is clear that certain tools can or cannot achieve particularobjectives. In others, it depends very much on the objective. For example,administrative prices can be used to judge the value of the spectrumand influence allocation decisions in some situations. In many cases,however, overriding issues will prevent this from occurring effectively.
282 Introduction to Wireless Local Loop
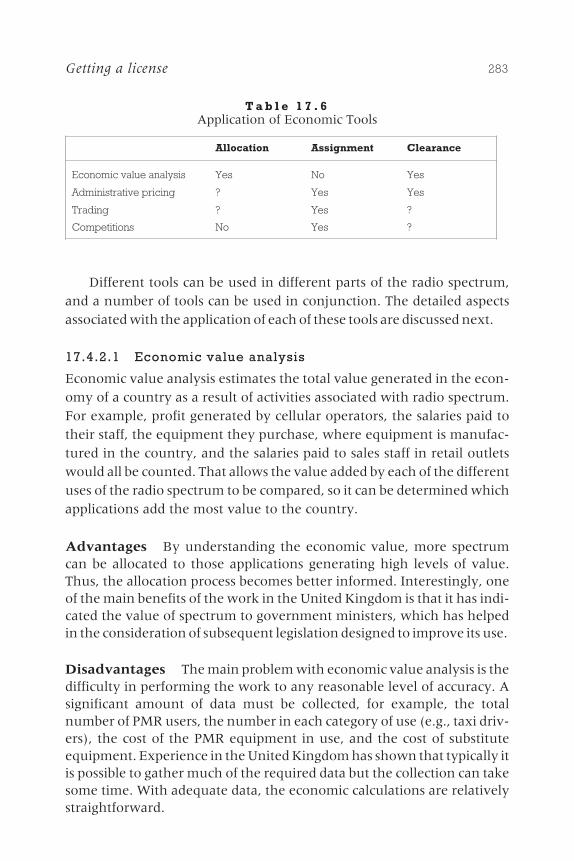
Different tools can be used in different parts of the radio spectrum,and a number of tools can be used in conjunction. The detailed aspectsassociated with the application of each of these tools are discussed next.
17.4.2.1 Economic value analysis
Economic value analysis estimates the total value generated in the econ-omy of a country as a result of activities associated with radio spectrum.For example, profit generated by cellular operators, the salaries paid totheir staff, the equipment they purchase, where equipment is manufac-tured in the country, and the salaries paid to sales staff in retail outletswould all be counted. That allows the value added by each of the differentuses of the radio spectrum to be compared, so it can be determined whichapplications add the most value to the country.
Advantages By understanding the economic value, more spectrumcan be allocated to those applications generating high levels of value.Thus, the allocation process becomes better informed. Interestingly, oneof the main benefits of the work in the United Kingdom is that it has indi-cated the value of spectrum to government ministers, which has helpedin the consideration of subsequent legislation designed to improve its use.
Disadvantages The main problem with economic value analysis is thedifficulty in performing the work to any reasonable level of accuracy. Asignificant amount of data must be collected, for example, the totalnumber of PMR users, the number in each category of use (e.g., taxi driv-ers), the cost of the PMR equipment in use, and the cost of substituteequipment. Experience in the United Kingdom has shown that typically itis possible to gather much of the required data but the collection can takesome time. With adequate data, the economic calculations are relativelystraightforward.
Getting a license 283
T a b l e 1 7 . 6Application of Economic Tools
Allocation Assignment Clearance
Economic value analysis Yes No Yes
Administrative pricing ? Yes Yes
Trading ? Yes ?
Competitions No Yes ?
17.4.2.2 Administrative pricing
Most administrations set license fees at a level that covers the cost ofadministering the spectrum. Under administrative pricing, that link isbroken and prices are set at a level that approximates the market valueof the spectrum. Prices are ideally set at a level where supply anddemand match, and hence congestion is eliminated. At those levels, userswould then have incentives to release unused or underused spectrum,to consider alternative services or uncongested frequency bands, andto implement more spectrally efficient technologies. The prices would notnecessarily be relatively static, like the current license fees, but wouldchange to reflect both changes in demand (e.g., the increase due to a newapplication being provided over radio) and changes in technology (e.g.,new narrowband radio systems). The spectrum manager would need tocarefully monitor supply and demand conditions to be able to changethe price.
A major work describes the process of setting administrative prices[2]. Detailed economic arguments explain how prices are set, but funda-mentally a user in a congested band where demand exceeds supply needsto see that investment in an alternative that uses less spectrum wouldlower costs. That currently is not the case, so the role of pricing is tochange the costs of the user such that the alternative becomes attractive.
More explicitly, once pricing is introduced, users will be faced withthe cost of the current equipment or service (as they are at present) plus anew cost that is the annual administrative price over the equipment life-time. The alternative is for users to move to a different form of equip-ment or service that uses less spectrum. Because it uses less spectrum,the administrative cost component is lower than that of the currentequipment. Even if the alternative is more expensive before pricing isintroduced, it becomes less expensive after pricing.
For example, a PMR user might purchase narrowband equipment,move to a shared PMR system, or move to cellular systems. The cost ofeach alternative can be calculated. If, say, narrowband equipment is thelowest cost, then the administrative prices should be such that the cost ofthe new equipment is offset by the savings in administrative prices overthe equipment lifetime.
Advantages The key advantage of administrative pricing is that it canencourage existing users to think carefully about the amount of spectrum
284 Introduction to Wireless Local Loop
they require, preventing hoarding and providing an incentive to usenarrowband equipment. A secondary advantage is the raising ofadditional resources for either radio spectrum management orgovernment use.
Disadvantages Calculating prices is difficult and unlikely to be accu-rate. The government needs to monitor carefully the effect of the pricesand adjust them accordingly, which requires substantial skill.
17.4.2.3 Trading
Spectrum trading is a means to develop a real market in spectrum, asopposed to the pseudo-market created by administrative pricing. Byallowing trading between users of spectrum, prices can fluctuate rapidlyin accordance with the actual supply and demand, as opposed to thatperceived by the administrator. Many of the goals are the same as foradministrative pricing in that because the spectrum has a value, users areinclined to use it efficiently. The incentive is not the stick of annual feesbut the carrot of potentially large cash gains through sale.
There are many options with trading, including the simple sale of alicense to another entity, the ability to divide a license and sell parts of it toanother entity, and the ability to lease the license to another entity. Oneor all of these options could be provided. The introduction of trading oftenrequires major new legislation and the design of an extended transitionalprogram as tradability is extended across various areas of the spectrum.Important transitional steps typically include the following:
◗ Setting up a publicly accessible spectrum register;
◗ Introducing spectrum trading rights gradually and differentiallyacross different areas of spectrum;
◗ Limiting capital gains that might be earned by license holders,possibly including auctions and increases in charges;
◗ Introducing compensation for repossession of spectrum.
Advantages Trading has a number of advantages over administrativepricing, for example:
◗ The true market value is realized for the spectrum.
Getting a license 285

◗ Trade in spectrum typically will be able to take place more rapidlythan the administrator can reassign spectrum.
◗ Organizations purchasing others would readily be able to keep anyspectrum involved.
Disadvantages Trading has a number of disadvantages, for example:
◗ Windfall gains may be made by those who happen to hold spectrumat the time that trading is introduced.
◗ The value of the spectrum may not be realized by some users, so thedesired signals to improve the efficiency of spectrum use may not beseen.
◗ The state does not capture any revenue.
◗ The market may be difficult to administer and regulate, resulting indistortions of the market and problems when spectrum needs to berepossessed.
17.4.2.4 Competitions
Competitions can be used where there are large blocks of spectrum andmore competing organizations that require the spectrum than there isspectrum available. The most straightforward form of competition is theprice auction, whereby the bidder offering the highest price is awardedthe spectrum. Other techniques include beauty contests, in which quali-tative judgment is used, and service auctions, in which the bidder offeringthe best service to the user is the winner. There are a number of auctiondesigns, and the whole area of running an auction requires careful study.Much of this study has now been performed and documented for the per-sonal communications service (PCS) auctions in the United States, whichhave shown that, if conducted carefully, competitions can be a successfultool for assigning spectrum. Where auctions are being used, most spec-trum managers are now adopting the U.S. PCS auction methodology,thus avoiding the need to partake in auction design. Auctions are widelyused for cellular licenses around the world but typically not for otherapplications.
Advantages Some of the advantages of auctions are the following:
286 Introduction to Wireless Local Loop
◗ They are transparent and visibly fair.
◗ They are cheap to operate compared with the alternative assign-ment methods, especially when auction designs proved by othersare adopted.
◗ They raise money for government.
◗ They can be devised to take into account a variety of valid concernsother than just price paid.
◗ They give a market test of the value of spectrum, which maybe of value for devising policy in areas where auctions are notappropriate.
Disadvantages Spectrum auctions are not suitable for small or low-value uses, such as local PMR and individual fixed links, because of therelatively high transaction costs in conducting auctions, problems indefining a product to sell, and the intermittent nature of demand. How-ever, there might be scope for auctioning national PMR and fixed-linkbands to organizations that would provide local spectrum licenses toindividual users.
17.4.2.5 Spectrum management and WLL
For WLL, it is likely that some of these tools will be used. The simplest toolto use for WLL is competitions, typically in the form of auctions. Thisis because much of the spectrum used for WLL will be empty andthere may be competing applicants. Auctions can help make a decisionbetween different WLL operators.
Spectrum pricing also may be an issue. If the spectrum is provided atno cost, and spectrum pricing is used to control the growth in fixed-linkdemand, it will be hard for the spectrum manager to defend not applyingspectrum pricing to WLL. Fortunately, the prices applying to fixed linksare relatively low, so such pricing may not be problematic.
In some countries, it may be possible to avoid pricing altogether.Where the government is eager to introduce competition to the PTO, itmay be prepared to waive spectrum fees to allow the new WLL operatorto compete as effectively as possible, which was the case in the UnitedKingdom.
Getting a license 287
17.4.3 Implications of new spectrum managementtechniques for the WLL operator
The discussion here on spectrum management has shown that shortageof spectrum is still very much a problem. Predictions that digital modula-tion and microcells would lead to a world where spectrum scarcity was athing of the past have not come about [3]. Digital modulation has offeredonly slight improvements in capacity over analog modulation, and micro-cells remain expensive and are deployed only where absolutely neces-sary. A shortage of spectrum leads the spectrum manager to considercarefully how spectrum should be distributed, and such a shortage hasimportant implications for the WLL operator.
For the operator, the implications of a spectrum shortage are asfollows:
◗ Spectrum is available only at higher frequencies, preventing the useof many of the available technologies and restricting the range andcoverage to LOS propagation.
◗ It is important to deploy the more technically efficient technologies,such as CDMA, to maximize capacity and demonstrate to thespectrum manager that the spectrum is being used as efficientlyas possible.
◗ High-bandwidth applications, such as 384-Kbps bearers, willrequire significant amounts of spectrum, requiring a more denseinfrastructure. Thus, although a technology may offer a high datarate bearer, lack of spectrum may prevent operators from deployingthat service unless they are prepared to build a high density ofcell sites.
For the spectrum manager, the implications of a shortage of spectrumare the following:
◗ Users must be required to demonstrate the economic value of theirapplication to retain spectrum. Statistics kept by the operatorshowing the value added to the economy by their business and theirsuccess in meeting coverage and competition objectives will bevaluable.
288 Introduction to Wireless Local Loop
◗ In distributing the spectrum, market forces such as auctioning andpricing are likely to be used to ensure that the most economicallyefficient use of the spectrum is achieved.
Some spectrum managers may feel that it is their task to advise WLLoperators on which technology they should adopt. To date, there hasbeen little tendency to do that for WLL, but in some countries it is likely.WLL operators in those countries will need to determine whether themandated technology is appropriate; if it is not, the operators will have topetition the government to be allowed to use a different technology.
Another potential area for obligation is coverage. Regulators can seecoverage obligations as a way of preventing cream-skimming and ensur-ing that the operator remains serious in its investment in the network. Asargued in Chapter 5, this is a form of USO requiring cross-subsidy andshould be avoided in a competitive environment. Nevertheless, it seemsextremely common. In practice, few spectrum managers will rescind alicense when a network provides 50% coverage rather than the required60% coverage, so there will be some latitude in not meeting that obliga-tion. (In any case, the lack of real power to enforce such an obligationmakes it inappropriate for the spectrum manager to make it part of thelicense condition.)
References
[1] NERA, Smith, Review and Update of 1995 Economic Impact Study, London, U.K.:Radiocommunications Agency, 1997.
[2] Study into the Use of Spectrum Pricing, London, U.K.: RadiocommunicationsAgency, April 1996. (Also available on the Internet at http://www.open.gov.uk/radiocom.)
[3] Calhoun, C., Wireless Access and the Local Telephone Network, Norwood, MA:Artech House, 1992.
Getting a license 289

Choosing a serviceoffering
18.1 Introduction
Different technologies have different capa-bilities, as was indicated in Part IV. It is impor-tant that the appropriate mix of capabilities,or services, be selected for the target market.If the total service package is insufficient,customers will migrate to competitors whooffer better service. If the service package isexcessive, the system cost will be high andcompetitors can attract customers by offeringa lower cost service.
Choosing the right mix is a task for themarketing department. They should under-stand the services available, the services thatthe potential customers say they require, andthe services that customers might reasonablybe expected to require but do not yet realizethey need, given global trends in telecom-munications and local trends in growth andmodernization. The marketing departmentneeds to understand how much customersare likely to pay for each of the services, thedistribution of demand, and the strategy that
291
Contents
18.1 Introduction
18.2 Possiblecomponents of theservice offering
18.3 Mobility in thelocal loop
18C H A P T E R

the competition is likely to adopt. One of the key trends driving increasedservice is the need for Internet access. Internet users, as explained inChapter 2, often require an additional line coupled with relativelyhigh-rate data capabilities. That will drive WLL systems to offer at leasttwo lines in all but the least developed countries.
More details about how to determine which service offerings to adoptbased on predictions of penetration and revenue are provided in theChapter 19.
One underlying thread to many of the requirements of the users iswireline transparency. This is an imprecise term that means broadly that itshould be possible to connect to the WLL system with any device that hadbeen connected to the wireline system, and the device should work withno changes. Although a worthwhile aim, the problem with meeting thisrequirement is that many devices that work on analog landlines havebeen modified or designed to work within the limitations of the copperpairs. Working in the same manner over digital WLL systems is often inef-ficient and complex. A good example of this is fax. With digital transmis-sion it makes the most sense to use digital fax systems (i.e., the faxtransmission mechanism utilized by GSM phones). With analog faxmachines, their output signal must be converted into a digital form beforetransmission and converted back to analog after transmission, addingcomplexity and cost.
A further problem with wireline transparency is understanding thescope of the services that this covers. As discussed in Chapter 3, wirelinesystems can provide ISDN and possibly ADSL signals at up to 8 Mbps. Fewwould currently expect a �wireline transparent WLL system� to support8-Mbps transmission. To most people, �wireline transparent� typicallymeans the support of voice, DTMF signaling, analog fax transmission, anddata transmission, although the rate expected will vary from user to user.Providing this transparency can be a heavy burden for the manufacturer. Incountries where most users did not have a telephone line before, there is astrong argument for not providing transparency and persuading users whowish to connect peripherals to the line to utilize modern digital systems.
18.2 Possible components of the service offering
This section describes key service elements.
292 Introduction to Wireless Local Loop
18.2.1 Plain old telephony service (POTS)
POTS is simple voice service, which all WLL systems will provide as aminimum offering. The key concern here is voice quality. In all but theleast developed markets, voice quality as good as conventional wirelinewill be essential.
18.2.2 ISDN
ISDN services were described in Section 3.1.2. Generally, ISDN is taken tomean data at rates of 144 Kbps or higher, providing at least two lines,either of which can be used for voice or data.
18.2.3 Fax
Fax service allows the transmission of documents using international faxstandards, which are designed to operate over analog phone lines. If adigital phone line is provided, conversion will be required to ensure thatthe fax is transmitted correctly. Because most WLL vendors provide suchcapabilities within their system, both analog and digital WLL systems arelikely to support fax.
18.2.4 Data
Data can be supported on analog lines with a modem and digital lineswithout a modem. The key issue is the data rate to be supported. Analoglines can typically support up to 33.6 Kbps. Digital lines can support upto whatever digital bandwidth is provided; for example, systems such asAirLoop can provide up to 384 Kbps and DECT up to 552 Kbps.
Most users will not see data as a service. They will have a particularapplication, such as the Internet, and will experience certain delaysdepending on the data capabilities of the system. In understanding therequirements for data, it is necessary to understand the use to whichsubscribers will put the system. That may entail understanding computerfile transfer requirements and the data sent by some in-house packages.
18.2.5 Videophone
Videophone is a much talked-about service that few providers, as yet,have adopted. It requires a data capability from the network of around
Choosing a service offering 293
384 Kbps or higher, depending on the quality of the picture required;much lower bandwidths are possible but tend to result in pictures thatmove in a jerky fashion. If it is predicted that videophone will be widelyused, relatively high bandwidth data links will need to be provided. Whenconsidering the requirement for videophones, it is important to remindusers that the cost of a call will be substantially greater than the cost of avoice call.
18.2.6 Supplementary services
Supplementary services include a host of features, for example:
◗ Caller ID;
◗ Call-back-when-free;
◗ Call divert;
◗ Follow-me service;
◗ Advice of charge;
◗ Divert to voice mail;
◗ Call waiting;
◗ Barring of certain incoming and outgoing calls.
The list of possible supplementary services is almost endless. Supple-mentary services are supported in the switch, so if there is a requirementto upgrade supplementary services at a later date, the appropriate soft-ware can normally be installed on the switch. If the switch cannot handlethe features, the cost per subscriber of replacing the switch is rela-tively low.
18.2.7 Centrex
Centrex is a service provided to businesses whereby instead of installingan office PABX�allowing, among other things, office workers to call eachother using typically only three- or four-digit dialing codes�all calls arerouted to the central switch, which acts like a PABX. The switch recog-nizes that the call has come from a particular office and decodes the shortdialing number before routing the call to the appropriate person in the
294 Introduction to Wireless Local Loop

office. Centrex service provides savings for the company, which no longerneeds to buy and maintain a PABX, and may offer better services.Although it provides increased revenue to the operator, it means that theoperator needs to provide significant capacity on the air interface free ofcharge in order to route calls in a trombone from one user in the companyback to another.
18.2.8 Operator services
Going one stage beyond Centrex, some networks will provide an operatorservice, where callers phoning the switchboard number of a company areconnected to an operator employed by the WLL operator and located cen-tral to a number of companies. The operator takes the call and forwards itas appropriate. This allows the company to reduce staff requirements, andbecause the central operator can act as a switchboard operator for anumber of companies, staff efficiency can be improved.
18.2.9 Multiple lines
If a subscriber is provided with more than one line, then one line can beused for fax or data without preventing the other line from being used forincoming or outgoing calls. Most residential customers do not now sub-scribe to multiple lines because the cost is typically twice that of a normalline. Offering multiple lines at a discount could be an appropriate market-ing strategy. Most proprietary WLL technologies offer the facility of duallines to subscribers.
Businesses, of course, will require numerous lines, typically 2 to 14,sometimes more. Systems capable of providing that capacity are availablebut typically are configured for the business market alone. High-capacitysystems often are realized through the use of point-to-point microwavelinks in the 13- or 22-GHz band.
18.2.10 Leased lines
The concept of a leased line is a difficult one in WLL and worth exploringin more detail. The idea stems from the tariffing principles on existing sys-tems. Generally speaking, telephony is tariffed on the basis of the amountof traffic generated. For users generating extremely high amounts oftraffic, the PTO typically offers them a tariff where they can �lease� a
Choosing a service offering 295
dedicated line. They pay a monthly rental for the line (which is muchgreater than the monthly connection fee) but do not incur any callcharges, regardless of how much information they send down the line.Users who lease a line are inclined to think they �own� the line and thatthere should be no blocking on the line. In practice, in a wired network,everyone has a dedicated line up to the switch, regardless of whether theydecide to lease it or not; blocking then can occur in the switch on all of thelines. Nevertheless, there is an expectation of better service from a leasedline than that which might be experienced from a nonleased line.
In a WLL network, the concept of a leased line is stretched even morethinly because, short of permanently reserving a slot on the air interface fora particular user, there is no concept of a dedicated resource that the usercan �lease.� Leasing simply becomes a different tariff package whereby theuser elects to pay a high monthly fee and receives no call charges. Opera-tors might like to offer such a package since it will accord with the mannerin which large businesses currently pay for their communications. The dif-ficulty arises if the user expects a better service as a result of leasing the line.In a typical WLL system, the same level of blocking is experienced by allusers, so it will be difficult to differentiate between leased-line users andnormal users. In such a system, if a better grade of service is required for theleased-line users, they need to be on a different bearer.
A better solution is to make use of priority and preemption. The net-work would recognize that a leased-line user wishes to access thenetwork, they would accord that user a higher priority, and would thenpreempt the call of a lower priority user to make the resources available.Operators will want to use such a tactic with care. Users become signifi-cantly more upset by a call that drops out part way through than by afailed attempt to start a call. If better service is offered to one user, it is pos-sible that another user will become dissatisfied.
A compromise is to keep a number of channels free for higher priorityusers. When all the other channels are busy, a low-priority user will beblocked from the network when attempting to set up a call. High-priorityusers, however, will be able to access the spare channels. Deciding on thenumber of channels to reserve in this manner is difficult�too high, andthe air interface resources are badly used; too low, and high-priority userswill still be blocked. Cellular operators have considerable expertise insetting this number because they tend to leave a pool of channels forsubscribers handing over from nearby cells.
296 Introduction to Wireless Local Loop
In practice, few of the existing WLL technologies offer priority andpreemption, so this option will rarely be available.
18.2.11 Internet service provision
In addition to having a line offering data capabilities, Internet userswill need to have a subscription with an Internet service provider thatprovides their gateway into the Internet. A WLL operator could providethat value-added service to the customer.
18.2.12 Long-distance and international services
A WLL operator, in the strict sense of the word, owns the infrastructureconnecting the subscribers� homes to the nearest switch. The revenue isassociated with carrying telephony traffic across that segment. Whetherthe traffic is local or international is irrelevant, the operator receives thesame fee for carrying the traffic. In practice, most WLL operators also owna switch. They interconnect the switch to long-distance operators andto international gateways. When a subscriber makes a long-distancecall, the WLL operator routes the call from its own switch into thelong-distance network. The operator charges the user for a long-distancecall but has to pay interconnect fees to the long-distance operator, withthe result that the WLL operator typically gains little more revenue for along-distance call than from a local call.
There are a number of possible ways to increase revenue. One is forthe WLL operator to deploy a long-distance network (i.e., connectionsbetween main cities). Such a deployment would be a trunked backbonenetwork and is beyond the scope of this book. The simpler alternative is tonegotiate an attractive interconnect agreement with the long-distanceoperator, allowing the WLL operator to keep a larger share of the revenuefrom the long-distance traffic.
Interconnect negotiations are beyond the scope of this book. There islittle science to an interconnect negotiation but considerable negotiatingskill coupled with the need to understand the cost structure of the long-distance carrier. Such negotiations are best left to experts who have thedetailed experience of having conducted them. The importance of suchnegotiations should not be underestimated�a favorable interconnectagreement can make a significant difference to the network profitability.
Choosing a service offering 297
18.3 Mobility in the local loop
Most WLL networks have envisaged using fixed subscriber unitsmounted on the outside wall of subscribers� premises with a lead con-nected to a phone socket inside the house. Radio, however, can pro-vide a capability that copper cannot�mobility. Since the earliest WLLdeployments, a number of manufacturers and operators have examinedwhether mobility should be provided in a WLL system. The reasons forconsidering mobility are varied. The fact that those involved in WLLhave typically been involved in cellular radio certainly has had animpact. Manufacturers, particularly those using cordless technology,have stressed the added bonus of mobility in their WLL product literature.Literature about early WLL systems recounts stories about how thesystem performed well as a mobile system during some disaster. Thissection sets out the issues.
First, it is important to define mobility:
◗ Full mobility is the mobility offered by cellular radio, in that theuser can expect to roam to most parts of the country and makeand receive calls from a handset. Implicit in this definition is thehandover of calls.
◗ Limited mobility is the user being able to move within a small areaaround the home, perhaps a radius of 1 to 2 km, and still make andreceive calls. Call handover is not expected.
◗ No mobility is defined as a phone fixed by a wire into a base unit.
The provision of mobility has the potential to add significantly to thecost of a WLL system, due to the cost of enhanced coverage and the needfor additional elements in the network.
For cordless and proprietary WLL technologies, significant enhance-ment in coverage is required above that for a standard WLL deployment ifmobility is to be offered. Compared to mobile systems, WLL deploymentsachieve a gain in link budget of up to 20 dB through the use of directionalantennas mounted at rooftop level. To provide mobility in the home, abuilding penetration loss must also be built into the calculations; meas-urements have shown that for a reasonably reliable house penetration afurther 20-dB loss must be allowed. The requirement for up to an addi-tional 40 dB on the link budget has significant implications for the size of
298 Introduction to Wireless Local Loop
the cells. Use of propagation models applicable to WLL suggests that a40-dB difference would reduce a cell size of 5 km without mobility to400m with mobility. Experience with those deploying DECT systemshas shown an even more severe coverage restriction, from 5 km to200m when mobility is required. In the case of DECT, 600 times morecells are required if a mobility service is to be offered over the samecoverage area.
This is not as important an issue with cellular technologies whereWLL terminals are mounted inside the house, sometimes at ground floorlevel. In this case, all the link budget gains are lost and the range of theWLL system is the same as the range of the cellular system. There may stillbe a penalty to pay for mobility in that CDMA systems have increasedcapacity when deployed as WLL compared to cellular and hence the pro-vision of mobility might require more infrastructure at the base station.However, this penalty is not quite so great as for cordless and hencemobility might be a viable option with cellular-based technologies.
For full mobility, a number of additional network components arerequired, including home- and visitor-location registers and gatewayswitches. Functionality, such as idle mode cell selection and handover,is required in the mobile, and the network and the cell planning mustprovide sufficient overlap to allow handover to occur. For some of theWLL technologies that have been derived from cellular, that functionalitywill mostly be in place. For others, it will not be possible to achieve thefunctionality.
For limited mobility, very little in the way of additional components isrequired, but the network planning may need to take care of propagationphenomena such as multipath, which would not be so severe in a deploy-ment where there is no mobility.
The major issue, though, is the coverage for all but cellular-based sys-tems. For in-building coverage, between 150 and 600 times as many cellswill be required. Even if mobility is restricted to outside the house, allow-ing the range to increase to perhaps 1.4 km, 12 to 15 times as many cellswill be required. They will add significantly to the network cost, which, asa crude approximation, varies linearly with the number of cell sites.
The communications marketplace is a competitive one, where thePTO, cellular operators, and, in a few cities, cordless operators increas-ingly compete for traffic. The WLL operators will be entering into thatcompetitive environment and need to ensure that their offerings are
Choosing a service offering 299
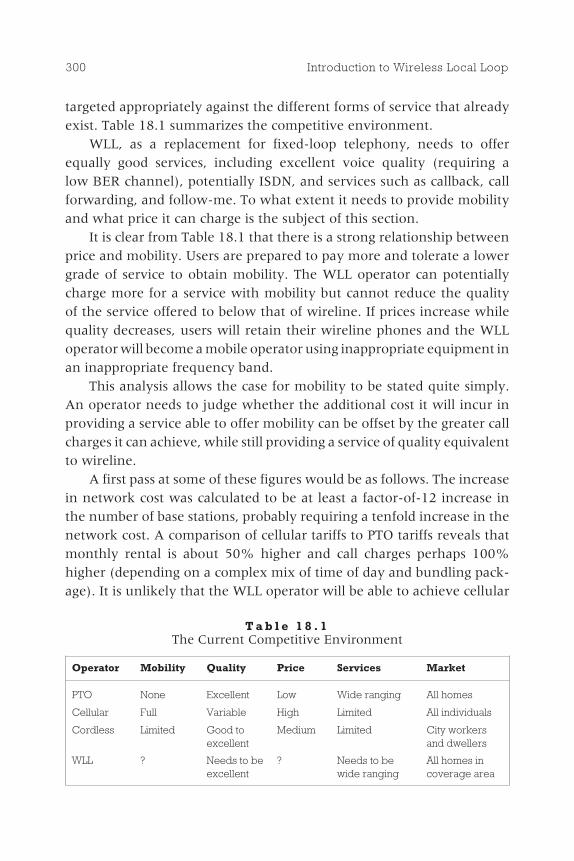
targeted appropriately against the different forms of service that alreadyexist. Table 18.1 summarizes the competitive environment.
WLL, as a replacement for fixed-loop telephony, needs to offerequally good services, including excellent voice quality (requiring alow BER channel), potentially ISDN, and services such as callback, callforwarding, and follow-me. To what extent it needs to provide mobilityand what price it can charge is the subject of this section.
It is clear from Table 18.1 that there is a strong relationship betweenprice and mobility. Users are prepared to pay more and tolerate a lowergrade of service to obtain mobility. The WLL operator can potentiallycharge more for a service with mobility but cannot reduce the qualityof the service offered to below that of wireline. If prices increase whilequality decreases, users will retain their wireline phones and the WLLoperator will become a mobile operator using inappropriate equipment inan inappropriate frequency band.
This analysis allows the case for mobility to be stated quite simply.An operator needs to judge whether the additional cost it will incur inproviding a service able to offer mobility can be offset by the greater callcharges it can achieve, while still providing a service of quality equivalentto wireline.
A first pass at some of these figures would be as follows. The increasein network cost was calculated to be at least a factor-of-12 increase inthe number of base stations, probably requiring a tenfold increase in thenetwork cost. A comparison of cellular tariffs to PTO tariffs reveals thatmonthly rental is about 50% higher and call charges perhaps 100%higher (depending on a complex mix of time of day and bundling pack-age). It is unlikely that the WLL operator will be able to achieve cellular
300 Introduction to Wireless Local Loop
T a b l e 1 8 . 1The Current Competitive Environment
Operator Mobility Quality Price Services Market
PTO None Excellent Low Wide ranging All homes
Cellular Full Variable High Limited All individuals
Cordless Limited Good toexcellent
Medium Limited City workersand dwellers
WLL ? Needs to beexcellent
? Needs to bewide ranging
All homes incoverage area
revenue. Thus, the case for full mobility in the local loop can simply bediscounted. However, in the case of cellular technologies, the networkcost increase might well be less than 50% and this might be balanced bythe revenue from mobile and fixed usage.
There are, however, a number of options for offering different typesof mobility that are considerably less expensive and likely to be of interestto customers.
◗ Provide mobility only in areas close to the base station. Even if abase station covers a radius of 5 km, those users within, say, 300mof the base station could have a mobile service around their housesand gardens. For no additional cost, limited mobility could beoffered to a subset of subscribers, maximizing revenue. The diffi-culty in such an approach will be in determining which subscriberscan receive the service and then marketing a range of differentpackages to different subscribers, depending on location.
◗ Let users install cordless phones. An alternative would be to install aWLL line without mobility (which could be any technology) andthen sell users DECT cordless home base stations. Such a phoneand base station costs around $200 and will provide the user withmobility within a range of 200m from the house. The WLL operatorcould then choose to deploy DECT base stations in a few key loca-tions, such as shopping malls, and then market a sort of cordlessservice.
◗ Use dual-mode phones. Dual-mode DECT/GSM phones becameavailable from a few manufacturers in 1999. By selling the cus-tomer a WLL line to the house, a DECT or GSM home base station,and either a dual-mode DECT/GSM handset or an enhanced GSMhandset in a bundled package, full mobility could be provided at nocost to the WLL operator. A user with such a phone could roamthroughout the world. On returning home, the phone would auto-matically switch to the home base station when within range, rout-ing calls across the WLL system. (Users could, of course, puttogether such a package for themselves, but with appropriate mar-keting the WLL operator could appear to be providing somethingdifferent.)
Choosing a service offering 301

◗ Instead of starting with a WLL system and adding mobility, movein the opposite direction by starting with a mobile system andrendering it suitable for both mobile and fixed use. A number of thecellular standards have added capabilities that enable this form ofusage. For example, IS-136 has standardized a personal base stationwith residential system identification and GSM has standardized acordless terminal system, both of which broadcast a single trafficchannel within the house. This allows mobile handsets to be usedin the home without taking capacity from the external cellularnetwork [1].
The disadvantage of the third approach is that the WLL operator willnot carry the traffic when the subscriber is out of range of the home basestation and so will lose revenue. But, as shown earlier, capturing thatrevenue requires a disproportionate expenditure.
Table 18.2 shows the positioning that a WLL operator must adopt tobe able to operate profitably.
The WLL operator needs to take advantage of the fact that wirelessconnections to a building are generally less expensive than wired connec-tions to operate from a lower cost base than the PTO. That allows WLLoperators to attract customers with a combination of lower prices and dif-ferentiated services. Providing mobility will cause prices to be raised, atwhich point WLL operators will be providing a more expensive and infe-rior service than the PTO and a generally inferior service than the cellularoperator. However, that does not need to stop the WLL operator from
302 Introduction to Wireless Local Loop
T a b l e 1 8 . 2The Current Competitive Environment
Operator Mobility Quality Price Services Market
PTO None Excellent Low Wideranging
All homes
Cellular Full Variable High Limited Allindividuals
Cordless Limited Good toexcellent
Medium Limited City workersand dwellers
WLL None(except viahome basestations)
Needs to beexcellent
Low Needs to bewideranging
All homes incoveragearea
marketing a mobile service by offering home base stations and dual-modephones (although the PTO also could market a similar service).
The provision of WLL is a complex matter, with WLL networks beingused for a range of tasks from the provision of telecommunications toareas that have never had communications, to the shortening of the wait-ing lists in Eastern European countries, to providing competition to thePTO in developed countries. The different environments require a rangeof different approaches, different technologies, and different services.Despite the wide range of networks, none of them would benefit from theprovision of mobility. A WLL operator that wants to offer mobility shouldseek a cellular license.
Reference
[1] Coursey, Cameron, Understanding Digital PCS: The TDMA Standard, Norwood,MA: Artech House, 1999.
Choosing a service offering 303


Developing thebusiness case
The business case is probably the singlemost important document in the process
of deploying the network. With decisionshaving been made as to the technology, thedensity of the cells, the interconnect method,and the market niche, the business case is thepoint where all these come together to deter-mine whether the project will be successful.
As well as being vital internally, the busi-ness case will be shown to investors and, pos-sibly in a shortened form, to the governmentas part of the license application.
19.1 The overall structure ofthe business case
In a general sense, the business case bal-ances the total outgoings in the form of net-work capital and ongoing cost with the totalincomings in the form of subscriber revenue.
305
Contents
19.1 The overallstructure of thebusiness case
19.2 The networkbuild costs
19.3 The ongoingcosts
19.4 Predictingrevenue
19.5 Financingarrangements
19.6 Summaryfinancial statistics
19.7 Tariffing policies
19.8 Analyzing thebusiness case
19C H A P T E R

Neither of these calculations is simple. This section examines some of thetypical issues and problems that arise.
The key drivers underlying the spreadsheet come from estimates ofsubscriber numbers, traffic levels, and tariffs over the lifetime of the net-work. Such estimates are more of an art than a science. The starting pointis the gathering of as much data as possible about the target country interms of the following:
◗ The population and the area of the country;
◗ The GDP per head and the variation in GDP across the country;
◗ The current teledensity, number of telephone lines, and distribu-tion of those lines;
◗ The number of businesses and the distribution of those businessesaccording to the number of people employed;
◗ The current costs and growth in take-up of services offered by theexisting telecommunications operators;
◗ The levels of penetration achieved by other competing operators(e.g., cable operators) where such competition exists.
Study of those figures, particularly in comparison with other similarcountries, can reveal potential openings in the market. For example, sucha study of the United Kingdom would reveal that the take-up of ISDNservices was much slower than in France and Germany, and that that wasprobably a result of the relatively high tariff charged by BT. Based on that,a potential market opening exists in the provision of ISDN services.
More detailed study would include interviews with a selection ofpotential users to try to gauge their willingness to try a new telecommuni-cations provider and the key services that they would require to switch toa new provider. Continuing the United Kingdom example, potentialISDN users would probably require a price at least 15% below that ofBT�s, coupled with the same reliability and quality as achieved from BT.
There then follows a somewhat iterative process. Based on a serviceand price requirement and expectations of traffic figures, a prelimi-nary network costing and financial modeling process can be performed.That will show whether the required services can be offered profitably.Depending on the result, it may then be necessary to increase the price,reduce the expected penetration, and rerun the model with the new
306 Introduction to Wireless Local Loop
variables until the most profitable operating position is reached. Assum-ing the model has been built on a flexible spreadsheet package, this neednot be problematic.
19.2 The network build costs
The network build costs are divided into subscriber equipment costs andnetwork equipment costs.
19.2.1 Subscriber equipment costs
The cost of a subscriber unit can be obtained from the manufacturer.There is likely to be a number of different subscriber units with differentfunctionality and different costs, and each needs to be treated separately.The following information needs to be gathered:
◗ The projected number of new units required each year. This will bebased on the predicted number of new subscribers expected eachyear. In cases where the subscriber units are owned by the operator,the operator can expect to reclaim most of the units from subscrib-ers who leave the network; hence, the number of units requiredfrom the manufacturer will equal the net number of new subscrib-ers per year. Otherwise, the number of units required will beapproximately the gross number of new subscribers each year. (Thegross subscriber number is the total number of new subscribersjoining the network in the year. The net subscriber number is equalto the gross numbers minus the number of subscribers leaving thenetwork.) In most cases, the projected number of new units peryear over the network lifetime will follow the S-curve shown inFigure 19.1; hence, the spreadsheet will need a column for eachyear along with the actual number of new units expected duringthat year.
◗ The projected cost of the subscriber units over the investmentperiod. In most cases, subscriber unit costs can be expected to fallas both manufacturing volumes and competition increase. Theextent of such a fall is difficult to estimate because the market isembryonic; typical figures might be between 5% and 10% a year.Depending on the complexity of the spreadsheet required, either a
Developing the business case 307
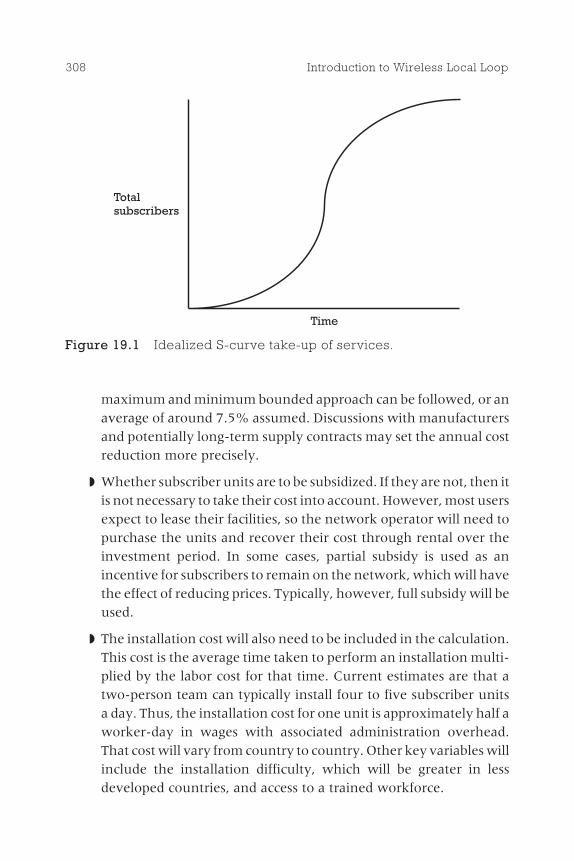
maximum and minimum bounded approach can be followed, or anaverage of around 7.5% assumed. Discussions with manufacturersand potentially long-term supply contracts may set the annual costreduction more precisely.
◗ Whether subscriber units are to be subsidized. If they are not, then itis not necessary to take their cost into account. However, most usersexpect to lease their facilities, so the network operator will need topurchase the units and recover their cost through rental over theinvestment period. In some cases, partial subsidy is used as anincentive for subscribers to remain on the network, which will havethe effect of reducing prices. Typically, however, full subsidy will beused.
◗ The installation cost will also need to be included in the calculation.This cost is the average time taken to perform an installation multi-plied by the labor cost for that time. Current estimates are that atwo-person team can typically install four to five subscriber unitsa day. Thus, the installation cost for one unit is approximately half aworker-day in wages with associated administration overhead.That cost will vary from country to country. Other key variables willinclude the installation difficulty, which will be greater in lessdeveloped countries, and access to a trained workforce.
308 Introduction to Wireless Local Loop
Time
Totalsubscribers
Figure 19.1 Idealized S-curve take-up of services.

A typical spreadsheet for the calculation of the subscriber units� costmight then look like Figure 19.2. Of course, projections are likely tocontinue for many more years than shown here. The spreadsheet hasbeen restricted to 6 years so as not to overcomplicate the example. Thekey points for the analysis are that the cost of the subscriber units occursgradually, building to a maximum some time during the middle of theinvestment period in the network. That gradual spend is helpful inreducing overall investment requirements.
19.2.2 Network costs
The key components of the network costs are the following:
◗ Base stations;
◗ Base station interconnection;
◗ Base station controllers (if required);
Developing the business case 309
Basic assumptions
2-line unit 1,$500
8-line unit $1,500
Installation 1,$150
Annual price reduction 7%
Subsidy 0%
Year 2000 2001 2002 2003 2004 2005
Units installed/ year(thousands)
2-line units 10 30 60 100 100 60
8-line units 2 4 10 15 10 6
Cost
2-line ($) 1,500 1,465 1,432 1,402 1,374 1,348
8-line ($) 1,500 1,395 1,297 1,207 1,122 1,044
Total cost ($millions) 9.8 24.6 49.4 75.6 65.1 37.0
Figure 19.2 Example spreadsheet for subscriber unit calculations.
◗ Base station controller interconnection (if required);
◗ Switching costs;
◗ Operations, maintenance, and billing system costs.
19.2.2.1 Base station costs
Base stations account for the following costs:
◗ The hardware cost of a base station, as quoted by the manufacturer.That cost will need to be adjusted according to the number of�cards� required in the base station, which will depend on the pre-dicted capacity. Allowance is typically not required for the reduc-tion in base station cost over time because most will be purchased atthe start of network rollout.
◗ The installation cost for a base station, including the cost of erectingmasts where required, connecting to power supplies, and othersimilar costs.
◗ The planning overhead associated with each base station, requiringperhaps one day of planning time per base station.
19.2.2.2 Base station interconnection costs
The base station interconnection (i.e., connecting the base station to theswitch) cost depends on whether leased lines or microwave links are used(discussed in Chapter 20). If leased lines are used, a one-time connectionfee may be payable to the PTO, but all other costs will be ongoing ratherthan capital. In cases where microwave links are required, there is the fullcapital cost of the link equipment as well as the installation cost, althoughthe latter is typically minor when conducted as part of the base stationinstallation.
19.2.2.3 Base station controller costs
Some WLL technologies require that the base stations be connected tobase station controllers. In that case, the full hardware cost of the basestation controller must be included as well as installation cost. Mostnetworks co-site the base station controller with either one of the basestations or the switch; hence, there is typically little site rental costassociated with this element.
310 Introduction to Wireless Local Loop
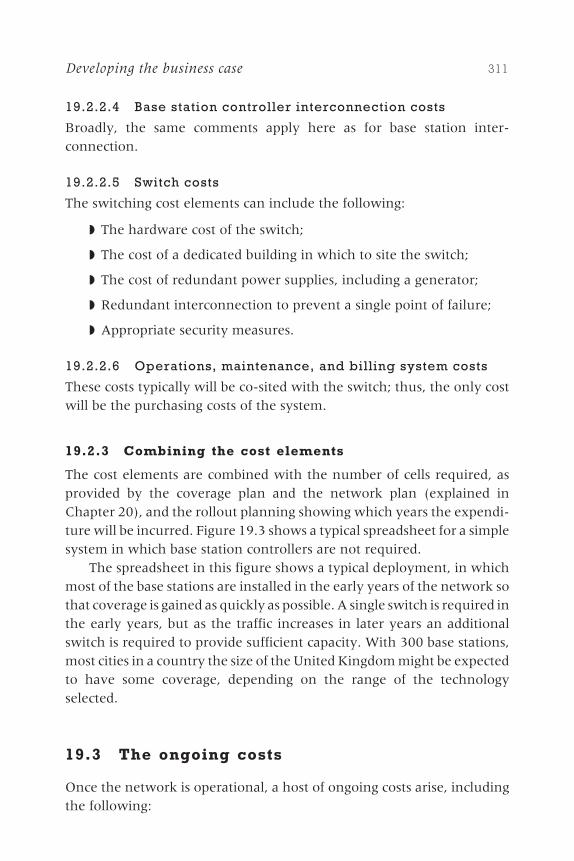
19.2.2.4 Base station controller interconnection costs
Broadly, the same comments apply here as for base station inter-connection.
19.2.2.5 Switch costs
The switching cost elements can include the following:
◗ The hardware cost of the switch;
◗ The cost of a dedicated building in which to site the switch;
◗ The cost of redundant power supplies, including a generator;
◗ Redundant interconnection to prevent a single point of failure;
◗ Appropriate security measures.
19.2.2.6 Operations, maintenance, and billing system costs
These costs typically will be co-sited with the switch; thus, the only costwill be the purchasing costs of the system.
19.2.3 Combining the cost elements
The cost elements are combined with the number of cells required, asprovided by the coverage plan and the network plan (explained inChapter 20), and the rollout planning showing which years the expendi-ture will be incurred. Figure 19.3 shows a typical spreadsheet for a simplesystem in which base station controllers are not required.
The spreadsheet in this figure shows a typical deployment, in whichmost of the base stations are installed in the early years of the network sothat coverage is gained as quickly as possible. A single switch is required inthe early years, but as the traffic increases in later years an additionalswitch is required to provide sufficient capacity. With 300 base stations,most cities in a country the size of the United Kingdom might be expectedto have some coverage, depending on the range of the technologyselected.
19.3 The ongoing costs
Once the network is operational, a host of ongoing costs arise, includingthe following:
Developing the business case 311
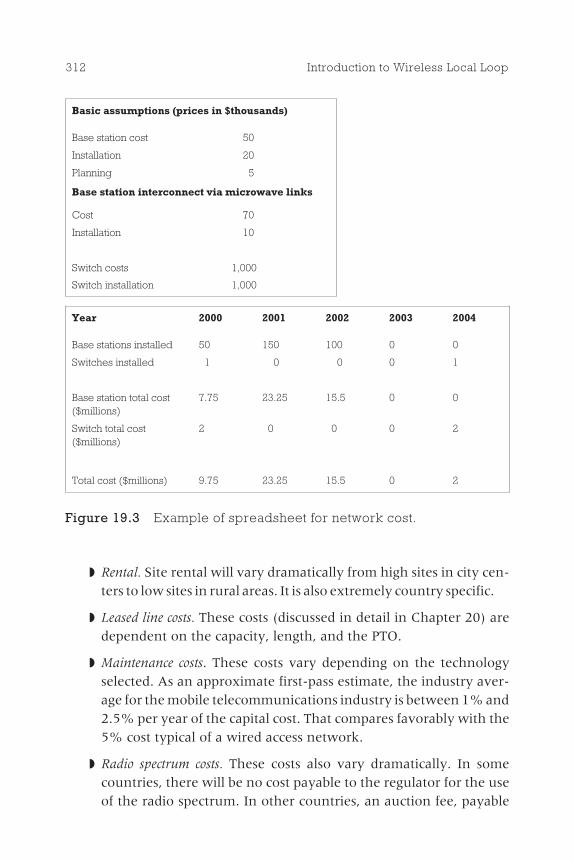
◗ Rental. Site rental will vary dramatically from high sites in city cen-ters to low sites in rural areas. It is also extremely country specific.
◗ Leased line costs. These costs (discussed in detail in Chapter 20) aredependent on the capacity, length, and the PTO.
◗ Maintenance costs. These costs vary depending on the technologyselected. As an approximate first-pass estimate, the industry aver-age for the mobile telecommunications industry is between 1% and2.5% per year of the capital cost. That compares favorably with the5% cost typical of a wired access network.
◗ Radio spectrum costs. These costs also vary dramatically. In somecountries, there will be no cost payable to the regulator for the useof the radio spectrum. In other countries, an auction fee, payable
312 Introduction to Wireless Local Loop
Basic assumptions (prices in $thousands)
Base station cost 50
Installation 20
Planning 5
Base station interconnect via microwave links
Cost 70
Installation 10
Switch costs 1,000
Switch installation 1,000
Year 2000 2001 2002 2003 2004
Base stations installed 50 150 100 0 0
Switches installed 1 0 0 0 1
Base station total cost($millions)
7.75 23.25 15.5 0 0
Switch total cost($millions)
2 0 0 0 2
Total cost ($millions) 9.75 23.25 15.5 0 2
Figure 19.3 Example of spreadsheet for network cost.
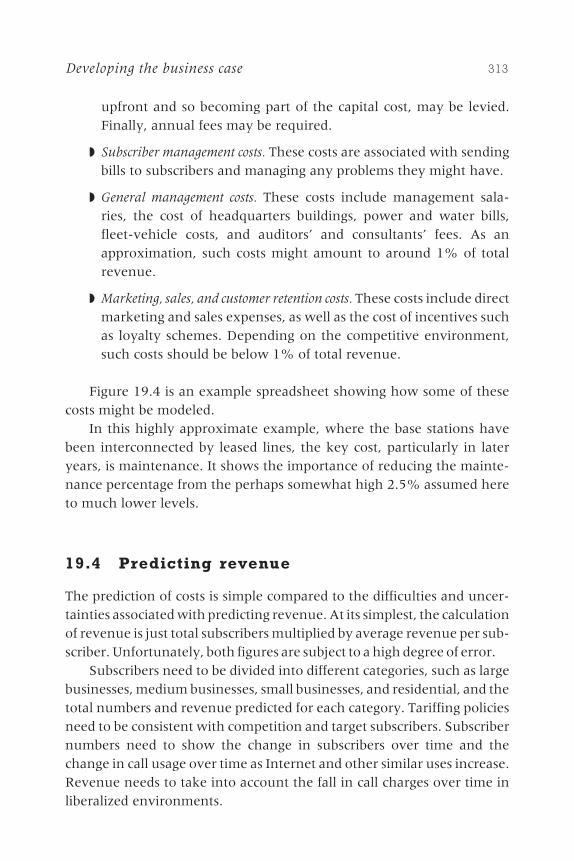
upfront and so becoming part of the capital cost, may be levied.Finally, annual fees may be required.
◗ Subscriber management costs. These costs are associated with sendingbills to subscribers and managing any problems they might have.
◗ General management costs. These costs include management sala-ries, the cost of headquarters buildings, power and water bills,fleet-vehicle costs, and auditors� and consultants� fees. As anapproximation, such costs might amount to around 1% of totalrevenue.
◗ Marketing, sales, and customer retention costs. These costs include directmarketing and sales expenses, as well as the cost of incentives suchas loyalty schemes. Depending on the competitive environment,such costs should be below 1% of total revenue.
Figure 19.4 is an example spreadsheet showing how some of thesecosts might be modeled.
In this highly approximate example, where the base stations havebeen interconnected by leased lines, the key cost, particularly in lateryears, is maintenance. It shows the importance of reducing the mainte-nance percentage from the perhaps somewhat high 2.5% assumed hereto much lower levels.
19.4 Predicting revenue
The prediction of costs is simple compared to the difficulties and uncer-tainties associated with predicting revenue. At its simplest, the calculationof revenue is just total subscribers multiplied by average revenue per sub-scriber. Unfortunately, both figures are subject to a high degree of error.
Subscribers need to be divided into different categories, such as largebusinesses, medium businesses, small businesses, and residential, and thetotal numbers and revenue predicted for each category. Tariffing policiesneed to be consistent with competition and target subscribers. Subscribernumbers need to show the change in subscribers over time and thechange in call usage over time as Internet and other similar uses increase.Revenue needs to take into account the fall in call charges over time inliberalized environments.
Developing the business case 313
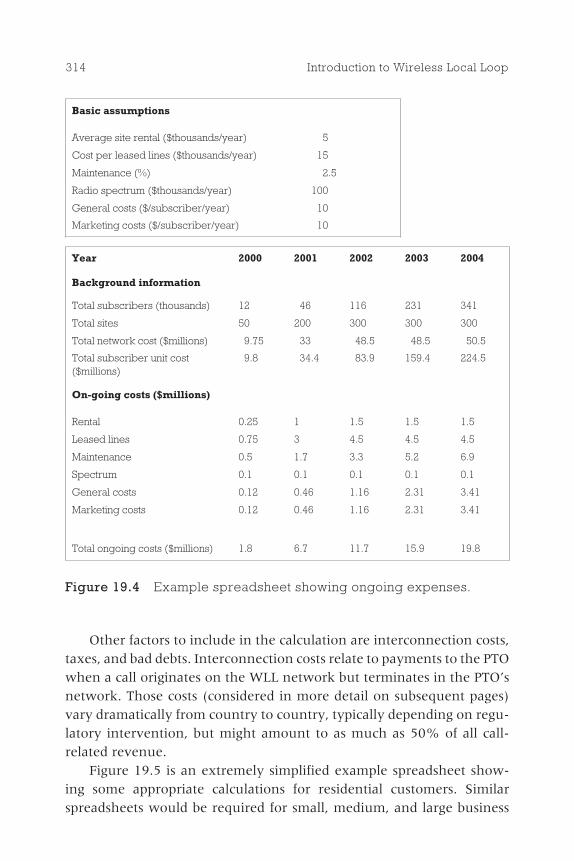
Other factors to include in the calculation are interconnection costs,taxes, and bad debts. Interconnection costs relate to payments to the PTOwhen a call originates on the WLL network but terminates in the PTO�snetwork. Those costs (considered in more detail on subsequent pages)vary dramatically from country to country, typically depending on regu-latory intervention, but might amount to as much as 50% of all call-related revenue.
Figure 19.5 is an extremely simplified example spreadsheet show-ing some appropriate calculations for residential customers. Similarspreadsheets would be required for small, medium, and large business
314 Introduction to Wireless Local Loop
Basic assumptions
Average site rental ($thousands/year) 5
Cost per leased lines ($thousands/year) 15
Maintenance (%) 2.5
Radio spectrum ($thousands/year) 100
General costs ($/subscriber/year) 10
Marketing costs ($/subscriber/year) 10
Year 2000 2001 2002 2003 2004
Background information
Total subscribers (thousands) 12 46 116 231 341
Total sites 50 200 300 300 300
Total network cost ($millions) 9.75 33 48.5 48.5 50.5
Total subscriber unit cost($millions)
9.8 34.4 83.9 159.4 224.5
On-going costs ($millions)
Rental 0.25 1 1.5 1.5 1.5
Leased lines 0.75 3 4.5 4.5 4.5
Maintenance 0.5 1.7 3.3 5.2 6.9
Spectrum 0.1 0.1 0.1 0.1 0.1
General costs 0.12 0.46 1.16 2.31 3.41
Marketing costs 0.12 0.46 1.16 2.31 3.41
Total ongoing costs ($millions) 1.8 6.7 11.7 15.9 19.8
Figure 19.4 Example spreadsheet showing ongoing expenses.

customers and any other groupings thought to be relevant. Operatorsmust remember that the difficulty here is obtaining trustworthy forecastsof subscriber numbers and call tariffs. Current figures, historical extrapo-lation, and the advice of expert observers should all be used in an attemptto make the figures as accurate as possible.
In reality, considerably more complex spreadsheets than that inFigure 19.5 would be required.
Figure 19.6 shows in more detail all the components of the revenuecalculation. It highlights the important role of interconnect fees. For someWLL operators, as much as half their revenue is paid to the PTO in inter-connect fees. This figure demonstrates the complexity of calculating reve-nue. On the positive side, the WLL operator will gain revenue from the
Developing the business case 315
Basic assumptions
Annual subscription/customer ($) 100
Fall in subscription/year 10%
Call minutes/subscriber/year 4,000
Cost/minute ($) 0.1
Rise in usage/year 10%
Fall in cost/minute/year 10%
Interconnect fees 20%
Bad debts 5%
Year 2000 2001 2002 2003 2004
Total subscribers(thousands)
10 40 100 200 300
Total subscriptions($millions)
1 3.6 8 14 18
Call minutes (millions) 40 176 480 1,040 1,680
Cost/minute ($) 0.10 0.09 0.08 0.07 0.07
Less interconnect 20% 20% 20% 20% 20%
Less bad debts 5% 5% 5% 5% 5%
Total call revenue($millions)
3.0 11.9 29.2 56.9 82.7
Total revenue($millions)
4.0 15.5 37.2 70.9 100.7
Figure 19.5 Example spreadsheet for predicted revenue.
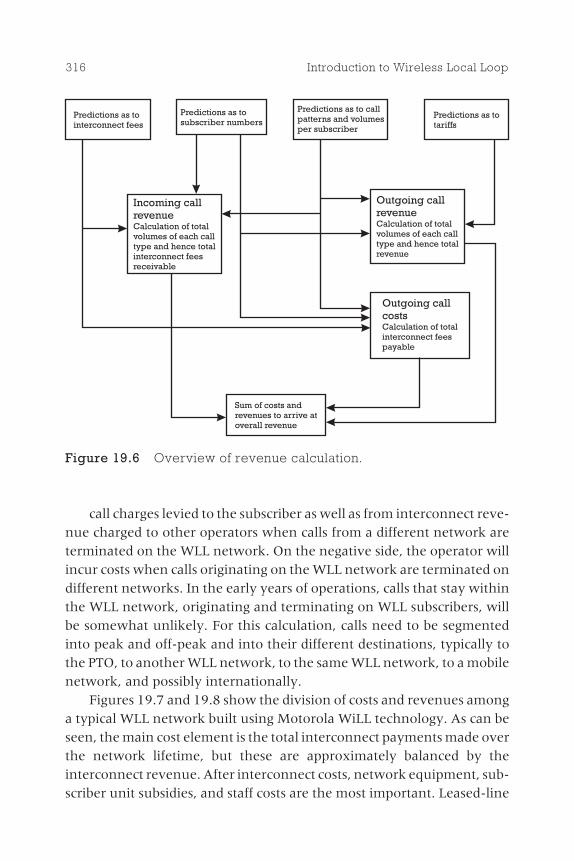
call charges levied to the subscriber as well as from interconnect reve-nue charged to other operators when calls from a different network areterminated on the WLL network. On the negative side, the operator willincur costs when calls originating on the WLL network are terminated ondifferent networks. In the early years of operations, calls that stay withinthe WLL network, originating and terminating on WLL subscribers, willbe somewhat unlikely. For this calculation, calls need to be segmentedinto peak and off-peak and into their different destinations, typically tothe PTO, to another WLL network, to the same WLL network, to a mobilenetwork, and possibly internationally.
Figures 19.7 and 19.8 show the division of costs and revenues amonga typical WLL network built using Motorola WiLL technology. As can beseen, the main cost element is the total interconnect payments made overthe network lifetime, but these are approximately balanced by theinterconnect revenue. After interconnect costs, network equipment, sub-scriber unit subsidies, and staff costs are the most important. Leased-line
316 Introduction to Wireless Local Loop
Predictions as tosubscriber numbers
Predictions as to callpatterns and volumesper subscriber
Predictions as totariffs
Outgoing callrevenueCalculation of totalvolumes of each calltype and hence totalrevenue
Predictions as tointerconnect fees
Incoming callrevenueCalculation of totalvolumes of each calltype and hence totalinterconnect feesreceivable
Outgoing callcostsCalculation of totalinterconnect feespayable
Sum of costs andrevenues to arrive atoverall revenue
Figure 19.6 Overview of revenue calculation.
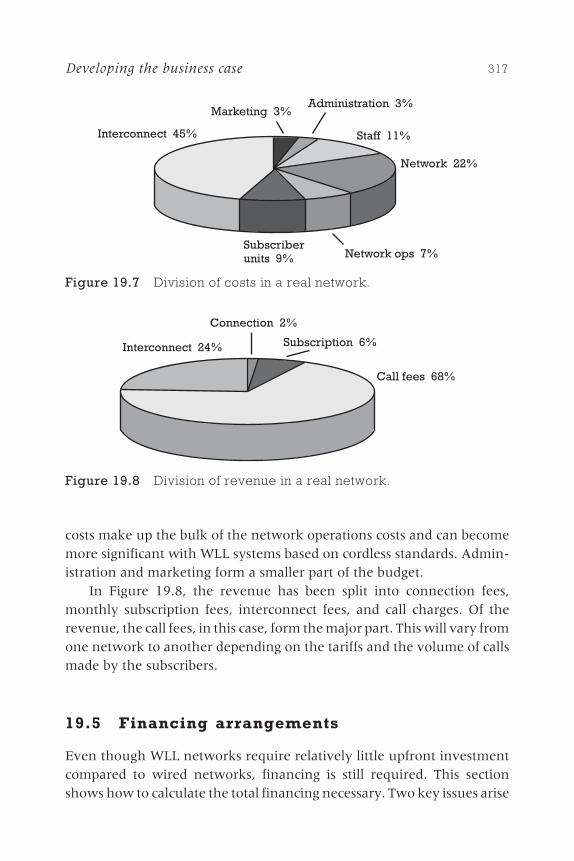
costs make up the bulk of the network operations costs and can becomemore significant with WLL systems based on cordless standards. Admin-istration and marketing form a smaller part of the budget.
In Figure 19.8, the revenue has been split into connection fees,monthly subscription fees, interconnect fees, and call charges. Of therevenue, the call fees, in this case, form the major part. This will vary fromone network to another depending on the tariffs and the volume of callsmade by the subscribers.
19.5 Financing arrangements
Even though WLL networks require relatively little upfront investmentcompared to wired networks, financing is still required. This sectionshows how to calculate the total financing necessary. Two key issues arise
Developing the business case 317
Staff 11%
Network 22%
Network ops 7%Subscriberunits 9%
Interconnect 45%
Administration 3%Marketing 3%
Figure 19.7 Division of costs in a real network.
Call fees 68%
Interconnect 24%
Connection 2%
Subscription 6%
Figure 19.8 Division of revenue in a real network.
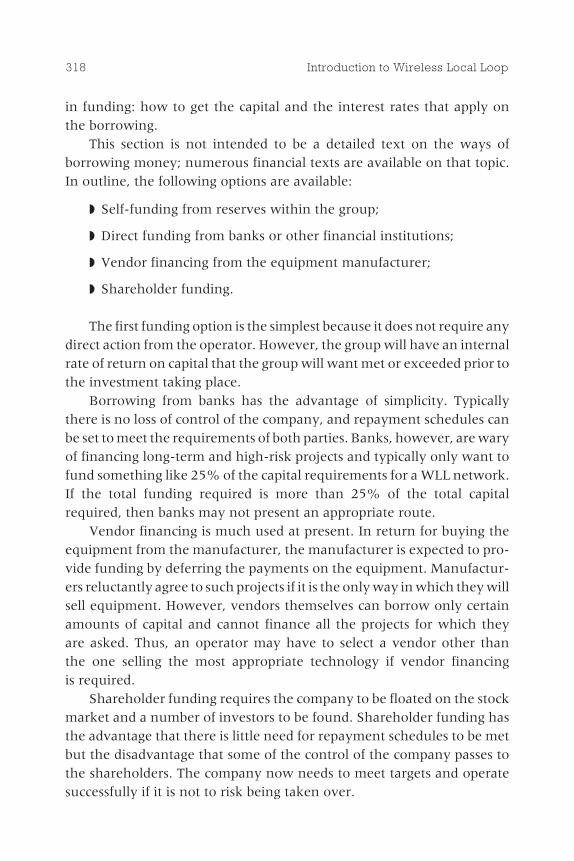
in funding: how to get the capital and the interest rates that apply onthe borrowing.
This section is not intended to be a detailed text on the ways ofborrowing money; numerous financial texts are available on that topic.In outline, the following options are available:
◗ Self-funding from reserves within the group;
◗ Direct funding from banks or other financial institutions;
◗ Vendor financing from the equipment manufacturer;
◗ Shareholder funding.
The first funding option is the simplest because it does not require anydirect action from the operator. However, the group will have an internalrate of return on capital that the group will want met or exceeded prior tothe investment taking place.
Borrowing from banks has the advantage of simplicity. Typicallythere is no loss of control of the company, and repayment schedules canbe set to meet the requirements of both parties. Banks, however, are waryof financing long-term and high-risk projects and typically only want tofund something like 25% of the capital requirements for a WLL network.If the total funding required is more than 25% of the total capitalrequired, then banks may not present an appropriate route.
Vendor financing is much used at present. In return for buying theequipment from the manufacturer, the manufacturer is expected to pro-vide funding by deferring the payments on the equipment. Manufactur-ers reluctantly agree to such projects if it is the only way in which they willsell equipment. However, vendors themselves can borrow only certainamounts of capital and cannot finance all the projects for which theyare asked. Thus, an operator may have to select a vendor other thanthe one selling the most appropriate technology if vendor financingis required.
Shareholder funding requires the company to be floated on the stockmarket and a number of investors to be found. Shareholder funding hasthe advantage that there is little need for repayment schedules to be metbut the disadvantage that some of the control of the company passes tothe shareholders. The company now needs to meet targets and operatesuccessfully if it is not to risk being taken over.
318 Introduction to Wireless Local Loop
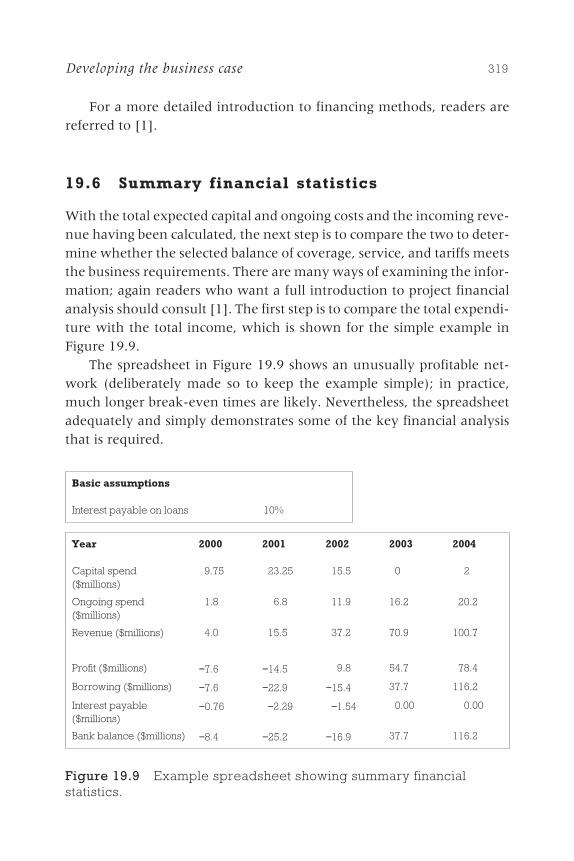
For a more detailed introduction to financing methods, readers arereferred to [1].
19.6 Summary financial statistics
With the total expected capital and ongoing costs and the incoming reve-nue having been calculated, the next step is to compare the two to deter-mine whether the selected balance of coverage, service, and tariffs meetsthe business requirements. There are many ways of examining the infor-mation; again readers who want a full introduction to project financialanalysis should consult [1]. The first step is to compare the total expendi-ture with the total income, which is shown for the simple example inFigure 19.9.
The spreadsheet in Figure 19.9 shows an unusually profitable net-work (deliberately made so to keep the example simple); in practice,much longer break-even times are likely. Nevertheless, the spreadsheetadequately and simply demonstrates some of the key financial analysisthat is required.
Developing the business case 319
Basic assumptions
Interest payable on loans 10%
Year 2000 2001 2002 2003 2004
Capital spend($millions)
9.75 23.25 15.5 0 2
Ongoing spend($millions)
1.8 6.8 11.9 16.2 20.2
Revenue ($millions) 4.0 15.5 37.2 70.9 100.7
Profit ($millions) −7.6 −14.5 9.8 54.7 78.4
Borrowing ($millions) −7.6 −22.9 −15.4 37.7 116.2
Interest payable($millions)
−0.76 −2.29 −1.54 0.00 0.00
Bank balance ($millions) −8.4 −25.2 −16.9 37.7 116.2
Figure 19.9 Example spreadsheet showing summary financialstatistics.
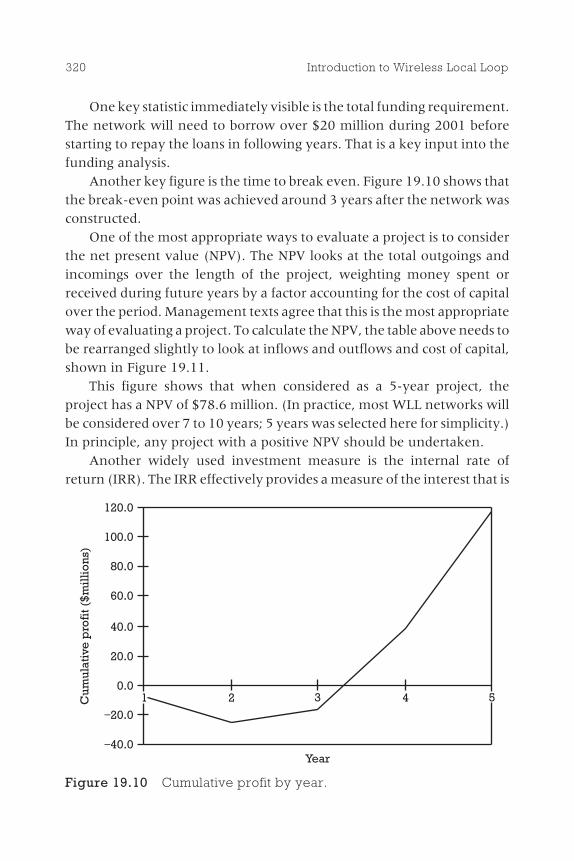
One key statistic immediately visible is the total funding requirement.The network will need to borrow over $20 million during 2001 beforestarting to repay the loans in following years. That is a key input into thefunding analysis.
Another key figure is the time to break even. Figure 19.10 shows thatthe break-even point was achieved around 3 years after the network wasconstructed.
One of the most appropriate ways to evaluate a project is to considerthe net present value (NPV). The NPV looks at the total outgoings andincomings over the length of the project, weighting money spent orreceived during future years by a factor accounting for the cost of capitalover the period. Management texts agree that this is the most appropriateway of evaluating a project. To calculate the NPV, the table above needs tobe rearranged slightly to look at inflows and outflows and cost of capital,shown in Figure 19.11.
This figure shows that when considered as a 5-year project, theproject has a NPV of $78.6 million. (In practice, most WLL networks willbe considered over 7 to 10 years; 5 years was selected here for simplicity.)In principle, any project with a positive NPV should be undertaken.
Another widely used investment measure is the internal rate ofreturn (IRR). The IRR effectively provides a measure of the interest that is
320 Introduction to Wireless Local Loop
120.0
100.0
80.0
60.0
40.0
20.0
0.0
−20.0
−40.0
Cum
ulat
ive
pro
fit(
$mil
lio
ns)
Year
1 2 3 4 5
Figure 19.10 Cumulative profit by year.
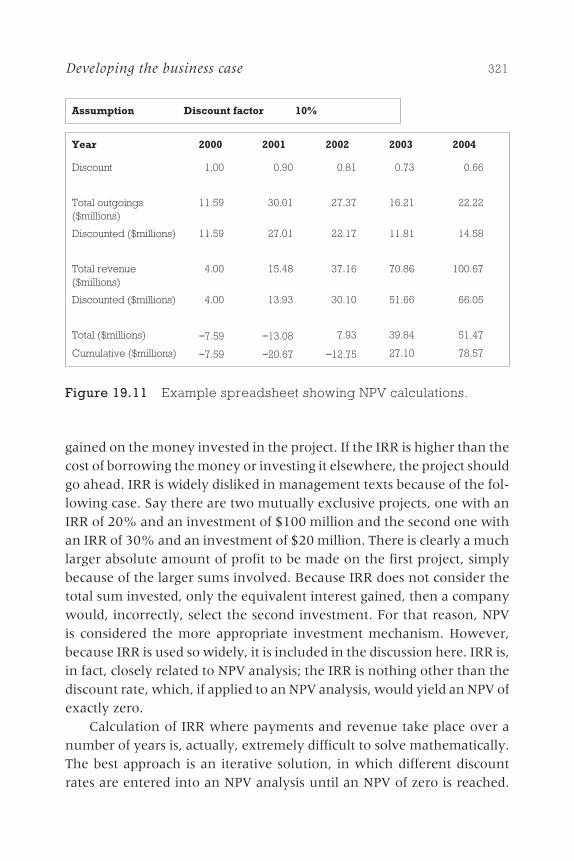
gained on the money invested in the project. If the IRR is higher than thecost of borrowing the money or investing it elsewhere, the project shouldgo ahead. IRR is widely disliked in management texts because of the fol-lowing case. Say there are two mutually exclusive projects, one with anIRR of 20% and an investment of $100 million and the second one withan IRR of 30% and an investment of $20 million. There is clearly a muchlarger absolute amount of profit to be made on the first project, simplybecause of the larger sums involved. Because IRR does not consider thetotal sum invested, only the equivalent interest gained, then a companywould, incorrectly, select the second investment. For that reason, NPVis considered the more appropriate investment mechanism. However,because IRR is used so widely, it is included in the discussion here. IRR is,in fact, closely related to NPV analysis; the IRR is nothing other than thediscount rate, which, if applied to an NPV analysis, would yield an NPV ofexactly zero.
Calculation of IRR where payments and revenue take place over anumber of years is, actually, extremely difficult to solve mathematically.The best approach is an iterative solution, in which different discountrates are entered into an NPV analysis until an NPV of zero is reached.
Developing the business case 321
Assumption Discount factor 10%
Year 2000 2001 2002 2003 2004
Discount 1.00 0.90 0.81 0.73 0.66
Total outgoings($millions)
11.59 30.01 27.37 16.21 22.22
Discounted ($millions) 11.59 27.01 22.17 11.81 14.58
Total revenue($millions)
4.00 15.48 37.16 70.86 100.67
Discounted ($millions) 4.00 13.93 30.10 51.66 66.05
Total ($millions) −7.59 −13.08 7.93 39.84 51.47
Cumulative ($millions) −7.59 −20.67 −12.75 27.10 78.57
Figure 19.11 Example spreadsheet showing NPV calculations.
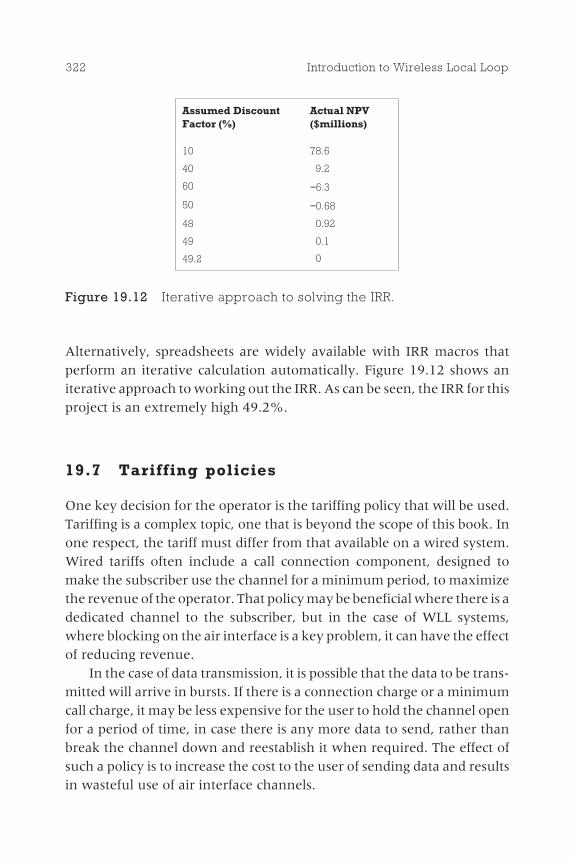
Alternatively, spreadsheets are widely available with IRR macros thatperform an iterative calculation automatically. Figure 19.12 shows aniterative approach to working out the IRR. As can be seen, the IRR for thisproject is an extremely high 49.2%.
19.7 Tariffing policies
One key decision for the operator is the tariffing policy that will be used.Tariffing is a complex topic, one that is beyond the scope of this book. Inone respect, the tariff must differ from that available on a wired system.Wired tariffs often include a call connection component, designed tomake the subscriber use the channel for a minimum period, to maximizethe revenue of the operator. That policy may be beneficial where there is adedicated channel to the subscriber, but in the case of WLL systems,where blocking on the air interface is a key problem, it can have the effectof reducing revenue.
In the case of data transmission, it is possible that the data to be trans-mitted will arrive in bursts. If there is a connection charge or a minimumcall charge, it may be less expensive for the user to hold the channel openfor a period of time, in case there is any more data to send, rather thanbreak the channel down and reestablish it when required. The effect ofsuch a policy is to increase the cost to the user of sending data and resultsin wasteful use of air interface channels.
322 Introduction to Wireless Local Loop
Assumed DiscountFactor (%)
Actual NPV($millions)
10 78.6
40 9.2
60 −6.3
50 −0.68
48 0.92
49 0.1
49.2 0
Figure 19.12 Iterative approach to solving the IRR.
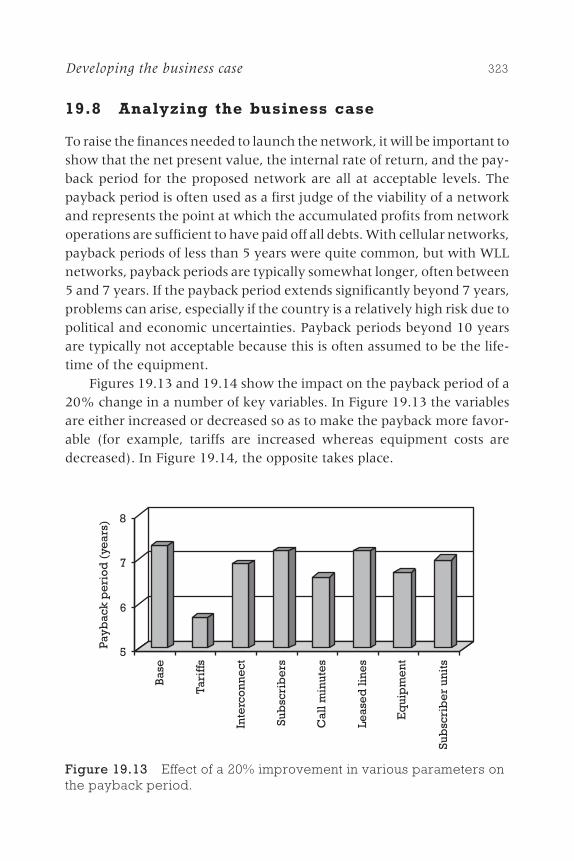
19.8 Analyzing the business case
To raise the finances needed to launch the network, it will be important toshow that the net present value, the internal rate of return, and the pay-back period for the proposed network are all at acceptable levels. Thepayback period is often used as a first judge of the viability of a networkand represents the point at which the accumulated profits from networkoperations are sufficient to have paid off all debts. With cellular networks,payback periods of less than 5 years were quite common, but with WLLnetworks, payback periods are typically somewhat longer, often between5 and 7 years. If the payback period extends significantly beyond 7 years,problems can arise, especially if the country is a relatively high risk due topolitical and economic uncertainties. Payback periods beyond 10 yearsare typically not acceptable because this is often assumed to be the life-time of the equipment.
Figures 19.13 and 19.14 show the impact on the payback period of a20% change in a number of key variables. In Figure 19.13 the variablesare either increased or decreased so as to make the payback more favor-able (for example, tariffs are increased whereas equipment costs aredecreased). In Figure 19.14, the opposite takes place.
Developing the business case 323
5
6
7
8
Payb
ack
pe
rio
d(y
ear
s)
Bas
e
Tari
ffs
Inte
rco
nn
ect
Sub
scri
be
rs
Cal
lmin
ute
s
Leas
ed
lin
es
Eq
uip
me
nt
Sub
scri
be
run
its
Figure 19.13 Effect of a 20% improvement in various parameters onthe payback period.

In both of these figures it is clear that the key dependencies are on thetariffs, followed by the number of call minutes and then the equipmentcosts. Note that these parameters are for a representative network usingMotorola technology and that the relative effect of each of these parame-ters could be different in a network, for example, where the number ofbackhaul links was much higher.
Figure 19.15 shows the same case as Figure 19.13 but with acordless-based WLL technology used. For a cordless-based WLL network,while tariff remains the most important variable, the cost of the leasedlines becomes the second most important consideration. Hence, it isimportant to understand the network being modeled in detail before thekey sensitivities can be determined with certainty.
The model used to derive these figures is sophisticated. For example,in the case of an increase in call minutes, the model automatically redes-igns the network to provide the extra Erlangs required and recalculatesthe cost of the network with this additional capacity. The extra cost isthen subtracted from the extra revenue. In the case of interconnectcharges, both the incoming and outgoing interconnects have either beenincreased or decreased together. This tends to negate much of the effect ofa change in interconnect. Clearly, if the outgoing interconnect chargesare increased while the incoming interconnect remains fixed, the overallimpact on the network would be more severe.
324 Introduction to Wireless Local Loop
5
6
7
8
9
10Pa
ybac
kp
eri
od
(ye
ars)
Bas
e
Tari
ffs
Inte
rco
nn
ect
Sub
scri
be
rs
Cal
lmin
ute
s
Leas
ed
lin
es
Eq
uip
me
nt
Sub
scri
be
run
its
Figure 19.14 Effect of a 20% reduction on the payback period.
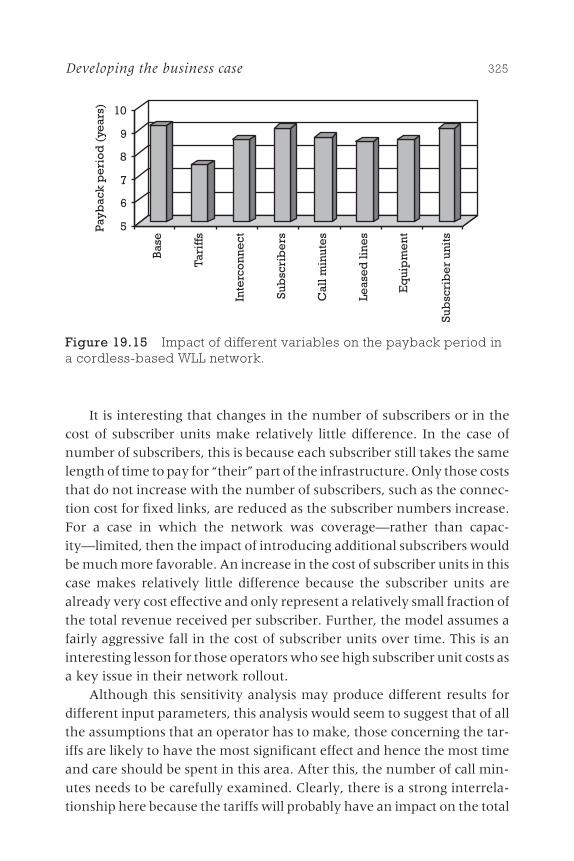
It is interesting that changes in the number of subscribers or in thecost of subscriber units make relatively little difference. In the case ofnumber of subscribers, this is because each subscriber still takes the samelength of time to pay for �their� part of the infrastructure. Only those coststhat do not increase with the number of subscribers, such as the connec-tion cost for fixed links, are reduced as the subscriber numbers increase.For a case in which the network was coverage�rather than capac-ity�limited, then the impact of introducing additional subscribers wouldbe much more favorable. An increase in the cost of subscriber units in thiscase makes relatively little difference because the subscriber units arealready very cost effective and only represent a relatively small fraction ofthe total revenue received per subscriber. Further, the model assumes afairly aggressive fall in the cost of subscriber units over time. This is aninteresting lesson for those operators who see high subscriber unit costs asa key issue in their network rollout.
Although this sensitivity analysis may produce different results fordifferent input parameters, this analysis would seem to suggest that of allthe assumptions that an operator has to make, those concerning the tar-iffs are likely to have the most significant effect and hence the most timeand care should be spent in this area. After this, the number of call min-utes needs to be carefully examined. Clearly, there is a strong interrela-tionship here because the tariffs will probably have an impact on the total
Developing the business case 325
5
6
7
8
9
10Pa
ybac
kp
eri
od
(ye
ars)
Bas
e
Tari
ffs
Inte
rco
nn
ect
Sub
scri
be
rs
Cal
lmin
ute
s
Leas
ed
lin
es
Eq
uip
me
nt
Sub
scri
be
run
its
Figure 19.15 Impact of different variables on the payback period ina cordless-based WLL network.
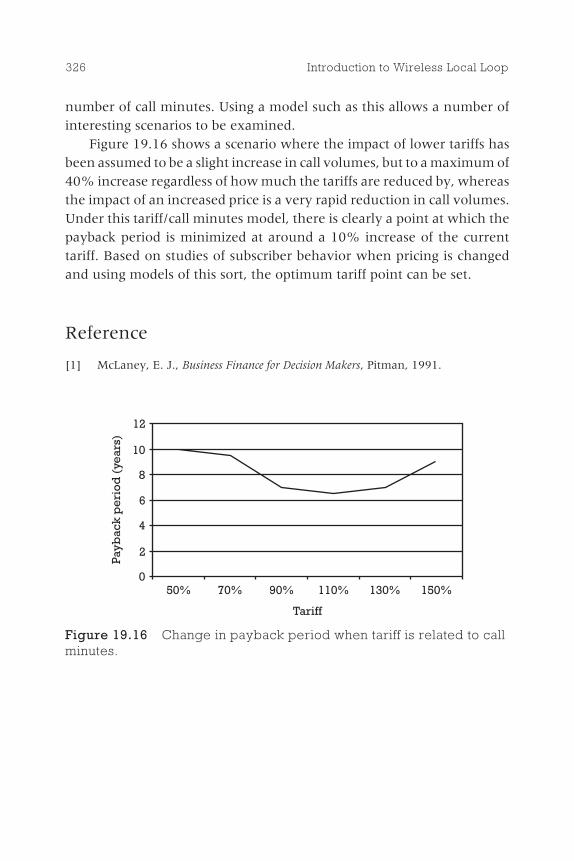
number of call minutes. Using a model such as this allows a number ofinteresting scenarios to be examined.
Figure 19.16 shows a scenario where the impact of lower tariffs hasbeen assumed to be a slight increase in call volumes, but to a maximum of40% increase regardless of how much the tariffs are reduced by, whereasthe impact of an increased price is a very rapid reduction in call volumes.Under this tariff/call minutes model, there is clearly a point at which thepayback period is minimized at around a 10% increase of the currenttariff. Based on studies of subscriber behavior when pricing is changedand using models of this sort, the optimum tariff point can be set.
Reference
[1] McLaney, E. J., Business Finance for Decision Makers, Pitman, 1991.
326 Introduction to Wireless Local Loop
0
2
4
6
8
10
12
50% 70% 90% 110% 130% 150%
Tariff
Payb
ack
pe
rio
d(y
ear
s)
Figure 19.16 Change in payback period when tariff is related to callminutes.
Rolling out thenetwork
20.1 Introduction
The operator has now reached the point ofbeing ready to start deploying the network.The license has been granted, the frequen-cies are available, the technology has beenselected, the finances have been arranged,and the business case describes the servicesand capacity to be offered. This chapterdescribes the process of actually getting a net-work up and running.
In many ways, this approach is similar tothat followed by cellular operators, so thosefamiliar with cellular deployment may wantto skip this part. An overview of the processof setting up the network is provided inFigure 20.1; a schematic of a WLL network isshown in Figure 20.2.
Each of the key steps in the block diagramin Figure 20.1 is described next, starting withselecting the number of cells, moving tochoosing the cell sites, connecting the cellsback into the network, and interfacing withswitching and backbone systems.
327
Contents
20.1 Introduction
20.2 Selecting thenumber of cells
20.3 Selecting thecell sites
20.4 Connecting thecells to the switch
20.5 Installing thesubscriber units
20.6 Billing, customercare, and relatedissues
20.7 Summary
20C H A P T E R
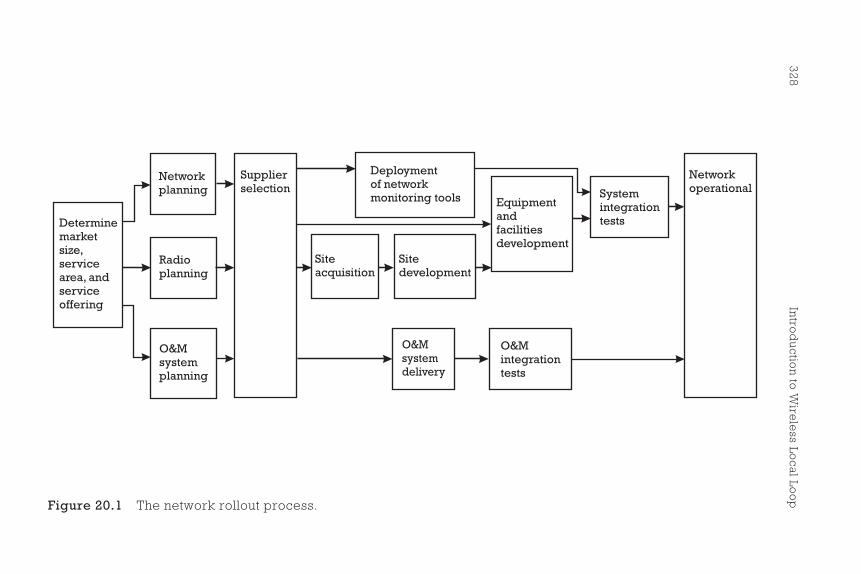
32
8In
trod
uctio
nto
Wire
less
Local
Loo
p
Determinemarketsize,servicearea, andserviceoffering
Networkplanning
Radioplanning
O&Msystemplanning
Supplierselection
Deploymentof networkmonitoring tools
Siteacquisition
Sitedevelopment
Equipmentandfacilitiesdevelopment
Systemintegrationtests
O&Msystemdelivery
O&Mintegrationtests
Networkoperational
Figure 20.1 The network rollout process.
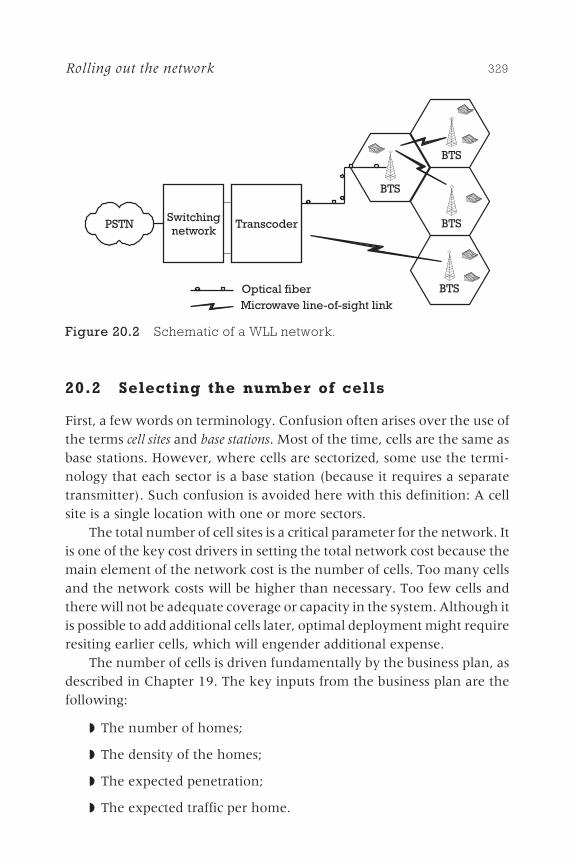
20.2 Selecting the number of cells
First, a few words on terminology. Confusion often arises over the use ofthe terms cell sites and base stations. Most of the time, cells are the same asbase stations. However, where cells are sectorized, some use the termi-nology that each sector is a base station (because it requires a separatetransmitter). Such confusion is avoided here with this definition: A cellsite is a single location with one or more sectors.
The total number of cell sites is a critical parameter for the network. Itis one of the key cost drivers in setting the total network cost because themain element of the network cost is the number of cells. Too many cellsand the network costs will be higher than necessary. Too few cells andthere will not be adequate coverage or capacity in the system. Although itis possible to add additional cells later, optimal deployment might requireresiting earlier cells, which will engender additional expense.
The number of cells is driven fundamentally by the business plan, asdescribed in Chapter 19. The key inputs from the business plan are thefollowing:
◗ The number of homes;
◗ The density of the homes;
◗ The expected penetration;
◗ The expected traffic per home.
Rolling out the network 329
Switchingnetwork
Transcoder
BTS
PSTN
BTS
BTS
BTSOptical fiberMicrowave line-of-sight link
Figure 20.2 Schematic of a WLL network.
These inputs are used to determine how many cells are required toprovide adequate capacity. The other important set of parameters isas follows:
◗ The area to be covered;
◗ The range of the system;
◗ The topography of the area.
This set of parameters is used to determine how many cells are required toprovide adequate coverage. Once calculations have been made as to howmany cells are required for capacity and how many for coverage, it isnecessary to take the higher of the two numbers. Another way of lookingat it is that it is necessary, at a minimum, to provide enough cells to coverthe target area; if that does not provide sufficient capacity, more cells willbe needed.
The calculation as to how many cells are required needs to be per-formed for each part of the country where conditions differ. That is, thereis little point coming up with the required base station density for anentire state in one calculation if that state actually consists of one densecity and otherwise rural areas. The base station density would be too lowto provide adequate capacity in the city and too high in the surroundingrural areas. The calculation should be performed for areas where any ofthe following factors differ significantly (say, by more than 20%) fromanother area:
◗ Density of homes;
◗ Expected penetration;
◗ Traffic per subscriber.
This might result, for example, in separate calculations being per-formed for the financial district of the city, which has high telecommuni-cations demand, and a neighboring area of the city that might containbusinesses with lower telecommunications demand. The need to performthe calculations numerous times is not problematic in itself; as will beseen, the calculation is relatively simple and could be computed quicklyon a spreadsheet. The difficulty is in obtaining the input information.Here it is assumed that the information has been obtained as part ofdevelopment of the business case.
330 Introduction to Wireless Local Loop
The number of cells required for coverage in a particular area isgiven by
( )Number of cells = ⋅
size of area km
rI
2
2p(20.1)
where r is the expected cell radius in kilometers, and I is a factor that rep-resents the inefficiency of tessellating cells (i.e., the fact that they overlapin practice).
The expected radius can be obtained from the manufacturer or fromtrial results. For those who want to understand this in more detail, a linkbudget can be constructed and the required path loss linked to the cellradius using propagation modeling.
The inefficiency factor derives from the fact that cells are not perfecthexagons, and it is not always possible to select cell sites exactly where aplan would require them to be. As a result, coverage areas from neighbor-ing cells often overlap (if they do not, there is a gap in the coverage, whichmay need to be filled with an additional cell). The size of the inefficiencyfactor varies, depending on the topography, the skill of the network plan-ner, and the availability of plentiful cell sites. As a guideline, a factor of 1.5(i.e., a 50% increase in the number of cells) would not be uncommon,and a factor as high as 2 would be experienced in some situations.
The number of cells required for capacity is given by
Number of cellstraffic channels required
traffic channe=
ls per cell(20.2)
It is necessary to calculate both of those factors. The number of trafficchannels required is given by
Number of channels E number of subscribers penetration= ⋅[ (%)
⋅ busy hour Erlangs per subscriber] (20.3)
where E[x] represents the conversion from Erlangs to traffic channelsusing the Erlang formula. That is simply a formula that describes howmany radio channels are required to ensure that blocking is no worsethan required for a given amount of traffic. The Erlang B formula isgiven by
Rolling out the network 331
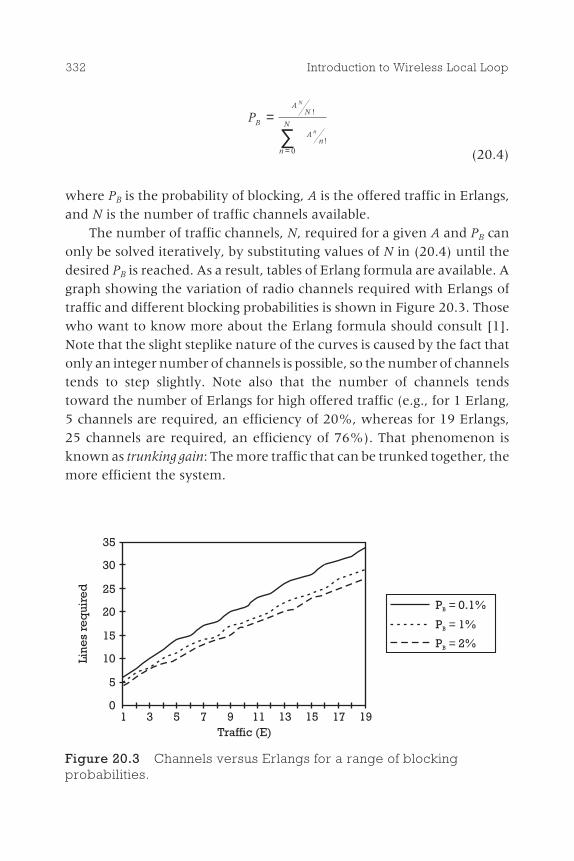
PB
AN
n
NA
n
N
n
=
=∑
!
!0 (20.4)
where PB is the probability of blocking, A is the offered traffic in Erlangs,and N is the number of traffic channels available.
The number of traffic channels, N, required for a given A and PB canonly be solved iteratively, by substituting values of N in (20.4) until thedesired PB is reached. As a result, tables of Erlang formula are available. Agraph showing the variation of radio channels required with Erlangs oftraffic and different blocking probabilities is shown in Figure 20.3. Thosewho want to know more about the Erlang formula should consult [1].Note that the slight steplike nature of the curves is caused by the fact thatonly an integer number of channels is possible, so the number of channelstends to step slightly. Note also that the number of channels tendstoward the number of Erlangs for high offered traffic (e.g., for 1 Erlang,5 channels are required, an efficiency of 20%, whereas for 19 Erlangs,25 channels are required, an efficiency of 76%). That phenomenon isknown as trunking gain: The more traffic that can be trunked together, themore efficient the system.
332 Introduction to Wireless Local Loop
Traffic (E)1 3 5 7 9 11 13 15 17 19
Lin
es
req
uire
d
0
5
10
15
20
25
30
35
P 0.1%B =P 1%B =P 2%B =
Figure 20.3 Channels versus Erlangs for a range of blockingprobabilities.

20.3 Selecting the cell sites
Having decided on the density of cells, it is then important to select thebest cell sites. Broadly speaking, if the system is coverage constrained,then cell sites on high buildings or high areas will be important. If thesystem is capacity constrained, then lower buildings may be more appro-priate because they will allow other buildings to act as shields, dividingcells and preventing the signal from spreading too far.
As a first pass, the coverage area should be divided into a regular grid(normally a hexagonal grid), with the radius of the hexagons being thecalculated cell radius as required for coverage or capacity. Base stationsites should then be sought as near as possible to the centers of thenominal hexagons.
The next stage is to make use of an appropriate planning tool, asdescribed in Section 7.6. With the use of a planning tool, base station sitescan be tried near the center of the nominal hexagon until one is foundthat approximates as closely as possible to the desired coverage. Theprocess is repeated, building up the entire grid. As one base station isselected, neighboring cells may need to move increasingly from the nomi-nal grid, such that they provide a minimal overlap with the first cells.
Once the sites have been selected on the computer, they should bechecked visually to make sure that the LOS paths are as predicted. Suit-able mounting points for antennas should be investigated, as shouldequipment housing and power supplies. If all these look promising, it istime to enter into negotiation with the owner of the building for therental of space to site the equipment. There is little that can be said aboutthis, other than a good negotiator may be required and it might be helpfulto find out the going rate for rental from other operators.
One approach that can avoid the need for site negotiation for everycell is to make a deal with an organization that owns numerous buildings,such as a bank. If that is done, the radio planning becomes quite different.Instead of working from a grid, base stations are now simulated on all thebanks (or whatever), and sites then are sought to fill in the resulting gaps.The number of cells required by this approach should be compared withthe number required if the buildings to be used are unconstrained. If addi-tional cells are required when using the banks, the extra cost associatedwith the additional cells can be compared with the savings made for site
Rolling out the network 333

rental and time spent negotiating to determine whether it is cost effectiveto use sites on the banks.
Radio planning is a resource-intensive procedure. Trained operatorswill need to spend some time using planning tools, trying differentconfigurations and cell sites to achieve the best layout. Depending on thecomplexity of the environment, the number of cells planned per personper day can vary dramatically. Operators may consider using contractstaff to perform the planning; as once the network has been rolled out,there will be little need for such staff.
There are some subtleties to the cell site planning. The first is the useof sectorization. Instead of using an omnidirectional antenna providingcoverage over a circle, directional antennas are deployed, splitting thecoverage into a number of wedge-shaped slices. Nonsectorized andsectorized cells are shown diagrammatically in Figures 20.4 and 20.5,respectively.
The benefits of sectorization differ dramatically for CDMA and TDMAsystems. For CDMA, sectorizing a cell results in an increase in capacity,
334 Introduction to Wireless Local Loop
f1, f2, f3
f1, f2, f3
f1, f2, f3
f1, f2, f3
Figure 20.4 Omnidirectional cell arrangement.
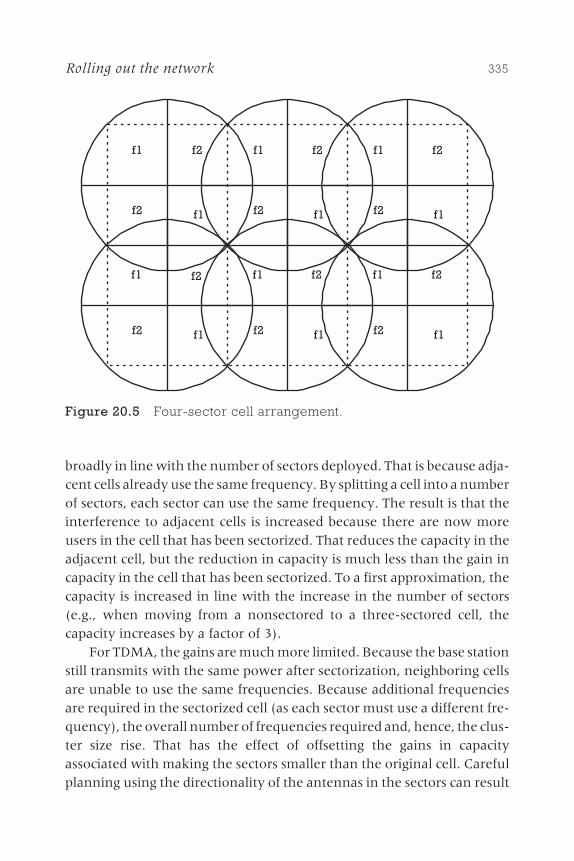
broadly in line with the number of sectors deployed. That is because adja-cent cells already use the same frequency. By splitting a cell into a numberof sectors, each sector can use the same frequency. The result is that theinterference to adjacent cells is increased because there are now moreusers in the cell that has been sectorized. That reduces the capacity in theadjacent cell, but the reduction in capacity is much less than the gain incapacity in the cell that has been sectorized. To a first approximation, thecapacity is increased in line with the increase in the number of sectors(e.g., when moving from a nonsectored to a three-sectored cell, thecapacity increases by a factor of 3).
For TDMA, the gains are much more limited. Because the base stationstill transmits with the same power after sectorization, neighboring cellsare unable to use the same frequencies. Because additional frequenciesare required in the sectorized cell (as each sector must use a different fre-quency), the overall number of frequencies required and, hence, the clus-ter size rise. That has the effect of offsetting the gains in capacityassociated with making the sectors smaller than the original cell. Carefulplanning using the directionality of the antennas in the sectors can result
Rolling out the network 335
f1 f2
f2 f1
f1 f2
f2 f1
f1 f2
f2 f1
f1 f2
f2 f1
f1 f2
f2 f1
f1 f2
f2 f1
Figure 20.5 Four-sector cell arrangement.
in some gains. For example, moving from a nonsectored system with acluster size of 3, then a three-sectored system would require a clustersize of around 7 or 8. The overall gain from sectorization is then around(3 × 3)/8 = 1.1 to (3 × 3)/7 = 1.3. With dynamic channel allocation, itmay be possible to increase those gains slightly more.
Each sector requires a separate base station unit, resulting in addi-tional cost, but the site rental is typically unchanged, making the use ofsectors on a single cell less costly than installing multiple small cells.
Given the limited gains of sectorization for TDMA systems, it is rea-sonable to ask why most GSM operators use a sectorized cell system in cityareas. The reason is that sectorization allows for a greater path loss than anonsectored approach because the gain of the sectored antennas can beincluded in the link budget. That has the effect of increasing the range.Given that a number of base station transceivers would be required tohandle the traffic generated in city areas anyway, connecting those trans-ceivers to different antennas results in little increase in cost. Further, incity areas, sectorization prevents some multipath reflections that mightoccur if an omnidirectional antenna was used, increasing signal strengthuntil finally a small capacity gain is achieved. Overall, for a small costincrease, improvements in capacity, range, and signal quality can beachieved by sectorization in this area.
In suburban and rural areas, however, sectorization is used less. Thatis because in those areas it may be that only one carrier is required toprovide sufficient capacity. The use of additional carriers to feed eachsector would engender a significant cost increase.
Another approach is the use of hierarchical cell structures. In a hierar-chical structure, an oversailing macrocell provides coverage to a largearea, which typically generates more traffic than the capacity provided bythe cell. Smaller microcells or minicells are then inserted in areas of par-ticularly high traffic density, taking some load off the macrocell. Suchminicells need to use a different radio frequency to avoid interference.This can be a sensible approach in a large city where the average trafficlevels are low, but there is a small area in the center with high traffic den-sities. If the nonhierarchical approach is adopted, then one cell would berequired in the center and perhaps six cells around it to cover the entirecity. Each of the six cells would be operating at well below capacity. With amacrocell�minicell approach, only two cells provide coverage in the samearea. The IS-136 standard allows many levels of hierarchical cells [2].
336 Introduction to Wireless Local Loop
20.4 Connecting the cells to the switch
Once the cells have been selected and the cell sites commissioned, it isnecessary to connect the cells to the network, typically to the switch (pos-sibly through a base station controller unit, depending on the architectureof the technology selected). There are three general ways to do that:
◗ Using a link leased from the PTO;
◗ Using a microwave point-to-point link;
◗ Using a satellite link.
Important factors in making the decision include the following:
◗ The relative cost, which is affected by the distance of the link, thecapacity required from the link, the presence of available infrastruc-ture, and the availability of radio spectrum;
◗ The desire to avoid using a link provided by the PTO, which isprobably a competitor;
◗ The desire to standardize the interconnection method throughoutthe network.
Each of the interconnection systems is explained in more detail in thefollowing sections.
20.4.1 Leased link
Leased link is the leasing of a line from the PTO. The line may not actuallybe cable�the PTO itself may be using satellite or microwave links�butthat will be transparent to the operator. The operator pays an annual feefor use of the link, which is typically related to the distance over which thelink runs and the capacity required from the link. There also may be aninitial connection fee to link the base station to the nearest access point inthe leased link network. PTOs typically publish books of prices for suchservices.
Even when the leased link is the cheapest option, operators may wantto avoid it for a number of reasons. Links may not be sufficiently reliableor have a sufficiently low error rate. The operator, for competitive orwhatever reasons, may want to avoid leasing key resources from a
Rolling out the network 337
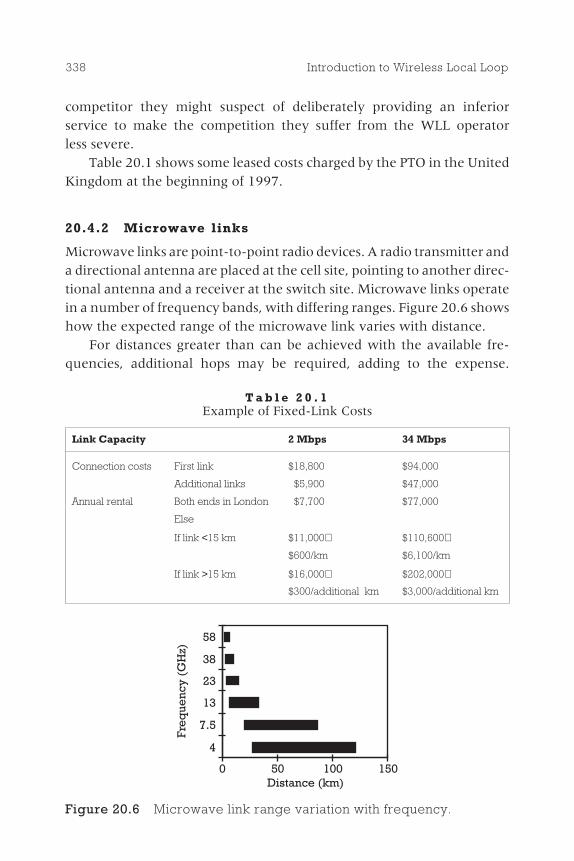
competitor they might suspect of deliberately providing an inferiorservice to make the competition they suffer from the WLL operatorless severe.
Table 20.1 shows some leased costs charged by the PTO in the UnitedKingdom at the beginning of 1997.
20.4.2 Microwave links
Microwave links are point-to-point radio devices. A radio transmitter anda directional antenna are placed at the cell site, pointing to another direc-tional antenna and a receiver at the switch site. Microwave links operatein a number of frequency bands, with differing ranges. Figure 20.6 showshow the expected range of the microwave link varies with distance.
For distances greater than can be achieved with the available fre-quencies, additional hops may be required, adding to the expense.
338 Introduction to Wireless Local Loop
T a b l e 2 0 . 1Example of Fixed-Link Costs
Link Capacity 2 Mbps 34 Mbps
Connection costs First link $18,800 $94,000
Additional links $5,900 $47,000
Annual rental Both ends in London $7,700 $77,000
Else
If link <15 km $11,000+ $110,600+
$600/km $6,100/km
If link >15 km $16,000+ $202,000+$300/additional km $3,000/additional km
Fre
que
ncy
(GH
z)
58
38
23
13
7.5
4
Distance (km)0 50 100 150
Figure 20.6 Microwave link range variation with frequency.

Further, spectrum assignments, particularly in the lower frequencybands, may not be available. As an example of that, Ionica, a now-bankrupt WLL operator in the United Kingdom, had stated that it wouldhave liked to interconnect all its base stations to its switches using micro-wave links at 7.5 GHz. However, due to spectrum congestion in the UnitedKingdom, spectrum was available only to satisfy 10% of the requestedlinks. Other links had to be at higher frequencies or using leased cable.
Some excellent texts are available on the difficulties associatedwith deploying fixed links, for example, [3]. Broadly, the same LOSradio propagation problems as described for WLL in Chapter 7 occur (theradio path from a WLL base station to a single subscriber looks similar to amicrowave fixed-link radio path).
The cost of microwave links lies in the cost of the link equipment, siterental (although that may not be required if the cell sites can be used), andongoing maintenance. Table 20.2 shows typical values for some ofthose costs. In the reading of this table it is important to remember thatannual site rentals and license fees are country specific; the examples hereare for the United Kingdom. The maintenance level will depend on thelocal environment; here 2.5% per annum of the equipment cost has beenassumed. The total cost is for a 10-year deployment, and the discountedcost takes into account a cost of capital at 10%. Equipment in the 38-GHzband is particularly inexpensive because of the high economies of scalegenerated in that band by the use of those frequencies by cellular opera-tors for interconnecting base station sites to switches. The site rental costfalls with higher frequencies because smaller antennas are used that placea lower wind loading on the mast. License fees also fall with higherfrequencies to reflect the lower congestion in those frequencies.
Rolling out the network 339
T a b l e 2 0 . 2Typical Costs ($) in 1997 for Fixed Links in Various Frequency Bands
FrequencyEquipmentCost
AnnualSiteRental
LicenseFee
AnnualMaintenance
TotalCost
DiscountedCost
4 GHz 80,000 4,800 1,600 2,000 164,000 136,280
13 GHz 80,000 4,800 1,600 2,000 164,000 136,280
22 GHz 60,000 3,000 1,000 1,500 115,000 96,850
38 GHz 48,000 2,400 1,800 1,200 92,000 77,480
55 GHz 60,000 2,400 1,400 1,500 103,000 88,810
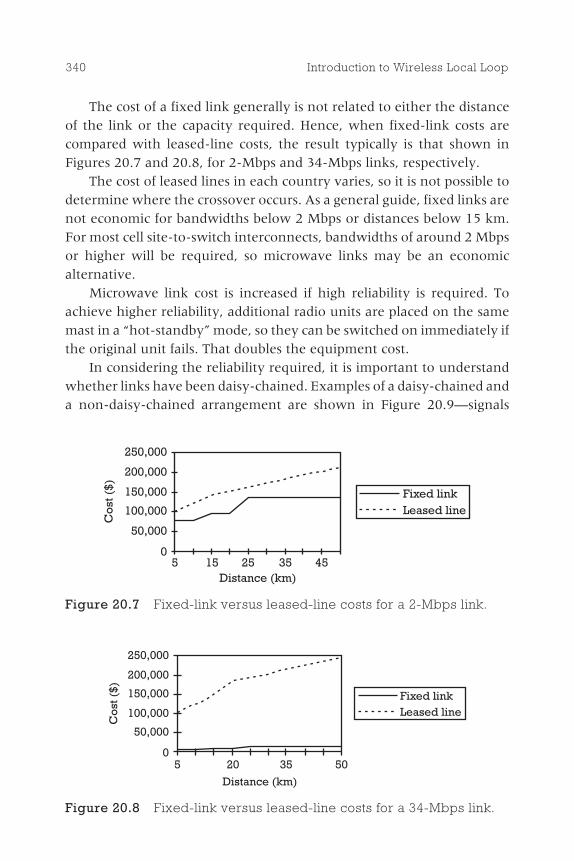
The cost of a fixed link generally is not related to either the distanceof the link or the capacity required. Hence, when fixed-link costs arecompared with leased-line costs, the result typically is that shown inFigures 20.7 and 20.8, for 2-Mbps and 34-Mbps links, respectively.
The cost of leased lines in each country varies, so it is not possible todetermine where the crossover occurs. As a general guide, fixed links arenot economic for bandwidths below 2 Mbps or distances below 15 km.For most cell site-to-switch interconnects, bandwidths of around 2 Mbpsor higher will be required, so microwave links may be an economicalternative.
Microwave link cost is increased if high reliability is required. Toachieve higher reliability, additional radio units are placed on the samemast in a �hot-standby� mode, so they can be switched on immediately ifthe original unit fails. That doubles the equipment cost.
In considering the reliability required, it is important to understandwhether links have been daisy-chained. Examples of a daisy-chained anda non-daisy-chained arrangement are shown in Figure 20.9�signals
340 Introduction to Wireless Local Loop
Co
st($
)
250,000
200,000
150,000
100,000
50,000
0
Fixed linkLeased line
5 15 25 35 45Distance (km)
Figure 20.7 Fixed-link versus leased-line costs for a 2-Mbps link.
5 20 35 50
Distance (km)
0
50,000
100,000
150,000
200,000
250,000
Co
st($
)
Fixed linkLeased line
Figure 20.8 Fixed-link versus leased-line costs for a 34-Mbps link.
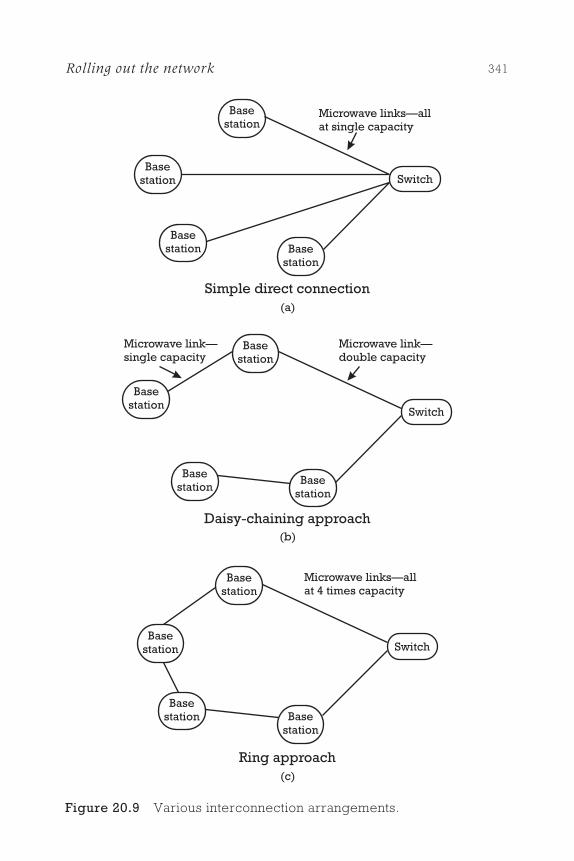
Rolling out the network 341
Basestation
Basestation
Basestation Base
station
Switch
Microwave links�allat single capacity
Simple direct connection
Basestation
Basestation
Basestation
Basestation
Switch
Microwave link�single capacity
Microwave link�double capacity
Daisy-chaining approach
Ring approach
Basestation
Basestation
Basestation Base
station
Switch
Microwave links�allat 4 times capacity
(a)
(b)
(c)
Figure 20.9 Various interconnection arrangements.

from some cells are carried over a number of fixed links, increasing theneed for reliability.
Simple probability modeling can be used to determine whetherredundancy is required based on reliability figures quoted by the manu-facturer, the reliability required by the business case, and the networkmodel. For example, if each link has a reliability of 99.9%, then for any ofthe base stations in arrangement (a) shown in Figure 20.9, that is the reli-ability experienced. In arrangement (b), for the two base stations linkedto other base stations, the reliability is 0.9992 = 99.8%. For arrangement(c), for a base station farthest from the switch, one of the links on theclockwise route and one of the links on the anticlockwise route back tothe switch need to fail simultaneously. The probability of the clockwisebranch not failing is 99.8%; when it has failed, there is a 99.8% probabil-ity that the other link has not failed. Hence, the overall reliability = 0.998+ 0.002 × 0.998 = 0.999996, or 99.9996%. Clearly, the ring approachprovides significant reliability gains.
Figure 20.9 also shows that those gains come at the cost of an increasein the link capacity. In the case of a ring, each link on the ring must becapable of carrying something close to the total capacity required by allthe base stations on the ring so that if one branch fails, all the traffic can bepassed through the remaining branches.1
20.4.3 Satellite links
With the use of very small aperture terminals (VSATs), base stations canbe linked to the switch via a satellite link. Typically, satellite links aremore expensive than fixed links and cause a significant delay to the sig-nal, which is perceived as delay or echo by the user and which is highlyundesirable. However, in situations where the cell site is so remote fromthe switch that a number of hops on a fixed link would be required andthere are no available leased lines, satellite links may form the only viablealternative.
To establish a satellite link, capacity must be leased from a satelliteoperator, such as Inmarsat, which will provide assistance in installing the
342 Introduction to Wireless Local Loop
1. To be more precise, those links at either end of the ring must be capable of carrying thetotal ring capacity; the one in the middle, half the link capacity; and those in betweenneed a capacity increasing linearly between the center and the ends. That can easily beseen if it is imagined that either one of the links nearest the switch fails.
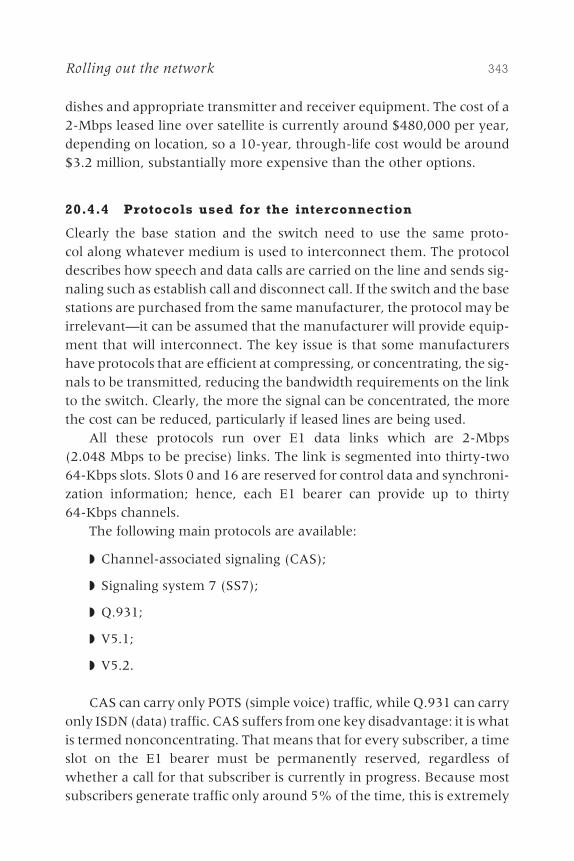
dishes and appropriate transmitter and receiver equipment. The cost of a2-Mbps leased line over satellite is currently around $480,000 per year,depending on location, so a 10-year, through-life cost would be around$3.2 million, substantially more expensive than the other options.
20.4.4 Protocols used for the interconnection
Clearly the base station and the switch need to use the same proto-col along whatever medium is used to interconnect them. The protocoldescribes how speech and data calls are carried on the line and sends sig-naling such as establish call and disconnect call. If the switch and the basestations are purchased from the same manufacturer, the protocol may beirrelevant�it can be assumed that the manufacturer will provide equip-ment that will interconnect. The key issue is that some manufacturershave protocols that are efficient at compressing, or concentrating, the sig-nals to be transmitted, reducing the bandwidth requirements on the linkto the switch. Clearly, the more the signal can be concentrated, the morethe cost can be reduced, particularly if leased lines are being used.
All these protocols run over E1 data links which are 2-Mbps(2.048 Mbps to be precise) links. The link is segmented into thirty-two64-Kbps slots. Slots 0 and 16 are reserved for control data and synchroni-zation information; hence, each E1 bearer can provide up to thirty64-Kbps channels.
The following main protocols are available:
◗ Channel-associated signaling (CAS);
◗ Signaling system 7 (SS7);
◗ Q.931;
◗ V5.1;
◗ V5.2.
CAS can carry only POTS (simple voice) traffic, while Q.931 can carryonly ISDN (data) traffic. CAS suffers from one key disadvantage: it is whatis termed nonconcentrating. That means that for every subscriber, a timeslot on the E1 bearer must be permanently reserved, regardless ofwhether a call for that subscriber is currently in progress. Because mostsubscribers generate traffic only around 5% of the time, this is extremely
Rolling out the network 343
inefficient. Its only benefit is that blocking is not possible on the basestation-to-switch interface.
The V5.1 protocol is also nonconcentrating, but it has the advantageof being able to carry both POTS and ISDN traffic. This is a significantadvantage, as the following example demonstrates. In a network whereboth POTS and ISDN are provided (as will be the case for many WLLnetworks), if CAS and Q.931 are used, then separate E1 lines wouldbe required for CAS signaling and Q.931 signaling. If each requiredonly half the capacity of an E1 line, then without V5.1, two E1 lineswould be required, whereas with V5.1, only a single line would berequired.
The V5.2 protocol is concentrating, so it is not necessary to dedicateresources on the E1 link to any particular subscriber�they can beassigned dynamically (in the same fashion as is performed on the airinterface). This allows far fewer E1 links to be used, reducing the overallnetwork cost.
By 1999, the V5.2 standard was widely accepted as the internationalmeans of connecting switches. Most manufacturers of WLL networks haddeveloped a V5.2 interface for their products.
If V5.2 is not used, it is possible that the system capacity is limited notby the air-interface capacity, but by the number of subscribers that can beaccommodated on the E1 links to the switch. For example, in one system,the base station allowed a maximum of 16 E1 connections back to theswitch using a V5.1 protocol. Given that each connection could support30 subscribers, the total cell capacity was limited to 480 subscribers. How-ever, in a fully loaded system where the subscriber traffic is assumed to below (0.1E) and the blocking tolerated high (1%), the air interface capacitycould be as high as 850 subscribers. Therefore, the main point of blockingwill be the switch connections, not the air interface.
In such a situation, some strange decisions are required. For example,rather than users being given a 2B + D ISDN connection, requiring two (ormore) slots on the E1 interface, they would be given a B + D connectionrequiring only a single slot. They could transmit the same total amount ofdata, but it would take twice as long. The air interface traffic would beunchanged (just less bursty), while the E1 resourcing would be eased.Clearly, the designer of a network does not want to be placed in such aposition.
344 Introduction to Wireless Local Loop
20.5 Installing the subscriber units
Once the network is operational, it is necessary to install subscriberterminals. The difficulty associated with this depends on the networkdesign and the subscribers� residences. In the simplest case, the signal issufficiently strong inside the house that no external antenna is required.The phone, with an antenna attached, is screwed to the room in the housewhere it will be used. Apart from some simple tests to check that there isadequate signal strength, such installation is straightforward.
Most WLL systems do not operate in that fashion. They require anexternal antenna mounted at rooftop level or on the side of the buildingto ensure a high-quality link of sufficient range. Installation is a case ofbolting the antenna to the side of the house and then running a cable,normally down the outside of the house and then into the room wherethe phone socket will be installed. The socket is then installed in the roomand the phone connected.
The skill is in mounting the antenna in a location where there is agood signal and orienting the antenna in the correct direction. To dothat, the installer requires some training. Upon arriving at the house, theinstallers need to know the direction of the base station�informationthat can be provided on the job card by the network planning tool. Theyneed to look in that direction from the house and take note of possibleobstructions, such as trees (remembering that trees in full leaf have agreater attenuation than bare trees), and looking for points on the housewhere such obstructions can be avoided or minimized. Having decided onthe approximate location on the house, the installers need to make signalstrength measurements, slowly moving the measurement device toensure that it is not situated in a fade. If the signal strength is satisfactory,the antenna unit can be mounted, the antenna aligned to maximizesignal strength, and the remainder of the installation completed. If thereis inadequate signal strength, that should be reported to the networkplanner so the reason can be ascertained.
In some parts of the world where WLL is deployed, the houses are toolow or too unstable for subscriber units to be mounted. Shantytowns are agood example of such locations. The normal solution is to mount the sub-scriber unit on a pole erected specifically for this purpose and situatedalongside the building in which coverage is required. This approach is
Rolling out the network 345
clearly more costly than mounting directly on the house but often itcannot be avoided. The poles need to be sturdy, as they may end up beingused by the shantytown dwellers as something to which they can bolttheir houses to increase structural stability.
20.6 Billing, customer care, and related issues
Generally, there is little that is new here. Billing systems can be takenfrom either fixed or mobile networks and used directly in a WLL environ-ment. Customer care help lines will be very similar to those implementedby the fixed operator. Perhaps the key issue for WLL is the requirement toenter the subscriber�s premises and bolt equipment onto the house. Thatcan be problematic for a number of reasons:
◗ Subscribers may not be home at the time of the appointment,resulting in a wasted visit and the additional cost of a later visit. Thesituation generally can be avoided if the subscriber can be given anexact time that the installer will arrive, if visits can be scheduled forevenings and weekends, and if the subscriber is called a few hoursbefore the visit to confirm the installation.
◗ The installers may be the only persons employed by the operatorwhom the subscribers meet. It is important that the installersbe well presented and generally give a good impression of theoperator.
◗ Subscribers may not be prepared to let the installers drill the neces-sary holes in their house; in particular, running the cable into theliving room often is problematic because it may affect interior deco-rations. Installers need to be well trained at making a minimum ofdisruption, making good afterward, and being inventive in lookingfor alternatives that might be more acceptable to the subscriber.
20.7 Summary
By now, you should understand a good deal about the concepts and ideasthat make up WLL. Going from an understanding of concepts to putting
346 Introduction to Wireless Local Loop
the ideas into practice is, of course, a large step. Remember to followthese steps:
1. Identify the target market.
2. Determine the service offering required.
3. Build a detailed business case.
4. Select the technology.
5. Apply for a license.
6. Gain appropriate financing.
7. Design and build the network.
8. Market the service to gain the required number of customers.
Also remember that expertise exists in the form of consultants andexperienced individuals. Making the best use of those resources canreduce significantly the cost of becoming a WLL operator.
Chapter 21 illustrates some of these concepts through the use of acase study.
References
[1] Schwartz, M., Telecommunication Networks�Protocols, Modelling and Analysis,Reading, MA: Addison-Wesley, 1987.
[2] Coursey, Cameron, Understanding Digital PCS: The TDMA Standard, Norwood,MA: Artech House, 1999.
[3] Freeman, R., Radio System Design for Telecommunications (1�100 GHz),New York: Wiley & Sons, 1987.
Rolling out the network 347

Case study
21.1 Introduction
This chapter presents a case study of thedesign of a WLL network to show how allthe different concepts in the preceding chap-ters come together.
This case study is based on the design ofa real WLL network in a Latin Americancountry. To preserve commercially confiden-tial information, the name of the country hasbeen withheld and some of the key marketforecast figures and equipment parametershave been modified. Nevertheless, the princi-ples illustrated by the case study are relevantregardless of the accuracy of the underlyinginformation.
21.2 Market demand forecast
This section examines the predicted marketdemand. The market demand is critical indetermining the spectrum and interconnectrequirements for the system and in drivingthe business case. First, predictions as to the
349
Contents
21.1 Introduction
21.2 Market demandforecast
21.3 System grade ofservice
21.4 Vendor selection
21.5 Radio spectrumrequirements
21.6 Numberingrequirements
21.7 Network buildplan
21.8 Networkconfiguration
21.9 Traffic matrixand routing
21.10 Summary
21C H A P T E R
number of lines are presented, followed by predictions as to the trafficgenerated by the different subscribers and the likely destination forthat traffic.
21.2.1 Provision of lines
The determination of the number of lines is based upon two key inputs.The first is the total population of each of the key cities where a WLL net-work is to be deployed. The second is the expected penetration of each ofthese markets over time. Estimating the expected market penetration isdifficult. In the case of this country, the following factors were taken intoaccount:
◗ In most cities in the country, there are currently two providers,both using wired solutions. Only in the capital are there any WLLoperators. Here, it is predicted that there will be two wired andthree wireless operators over the network lifetime.
◗ Current penetration is typically 40% of homes in the key cities. Thedemographic information available shows that 40% of homes aretoo poor to be able to afford a telephone service over the networklifetime. Overall penetration might reach 60% of homes (buta much lower percentage of the population) over the networklifetime.
◗ In most cities, the existing operators provide unsatisfactory service.Lines are typically strung between street lampposts with ad hocfixings and passing through trees. Reliability is poor and repairtimes long. Installing new wired lines is difficult because the roadtraffic density is so high that closing a road is problematic.
◗ Given that the WLL operator will provide a superior and lessexpensive service, it is expected to gain around 30% penetration ofhomes in most cities.
◗ In the capital, the greater competition will reduce the availablemarket to around 20% of all homes.
◗ That penetration will be reached linearly over 10 years. Such alinear increase in subscriber numbers is desirable because it allowsexpenditure and personnel numbers to remain relatively constantover the network lifetime.
350 Introduction to Wireless Local Loop
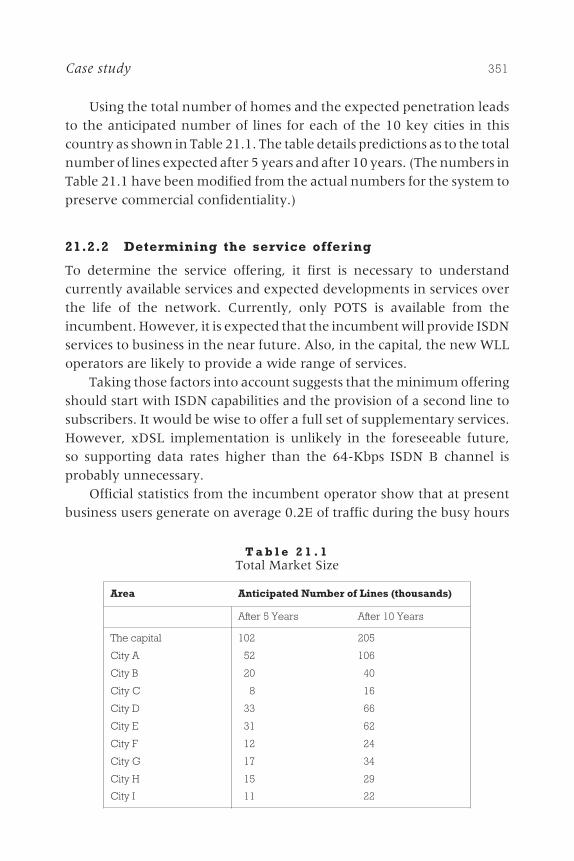
Using the total number of homes and the expected penetration leadsto the anticipated number of lines for each of the 10 key cities in thiscountry as shown in Table 21.1. The table details predictions as to the totalnumber of lines expected after 5 years and after 10 years. (The numbers inTable 21.1 have been modified from the actual numbers for the system topreserve commercial confidentiality.)
21.2.2 Determining the service offering
To determine the service offering, it first is necessary to understandcurrently available services and expected developments in services overthe life of the network. Currently, only POTS is available from theincumbent. However, it is expected that the incumbent will provide ISDNservices to business in the near future. Also, in the capital, the new WLLoperators are likely to provide a wide range of services.
Taking those factors into account suggests that the minimum offeringshould start with ISDN capabilities and the provision of a second line tosubscribers. It would be wise to offer a full set of supplementary services.However, xDSL implementation is unlikely in the foreseeable future,so supporting data rates higher than the 64-Kbps ISDN B channel isprobably unnecessary.
Official statistics from the incumbent operator show that at presentbusiness users generate on average 0.2E of traffic during the busy hours
Case study 351
T a b l e 2 1 . 1Total Market Size
Area Anticipated Number of Lines (thousands)
After 5 Years After 10 Years
The capital 102 205
City A 52 106
City B 20 40
City C 8 16
City D 33 66
City E 31 62
City F 12 24
City G 17 34
City H 15 29
City I 11 22
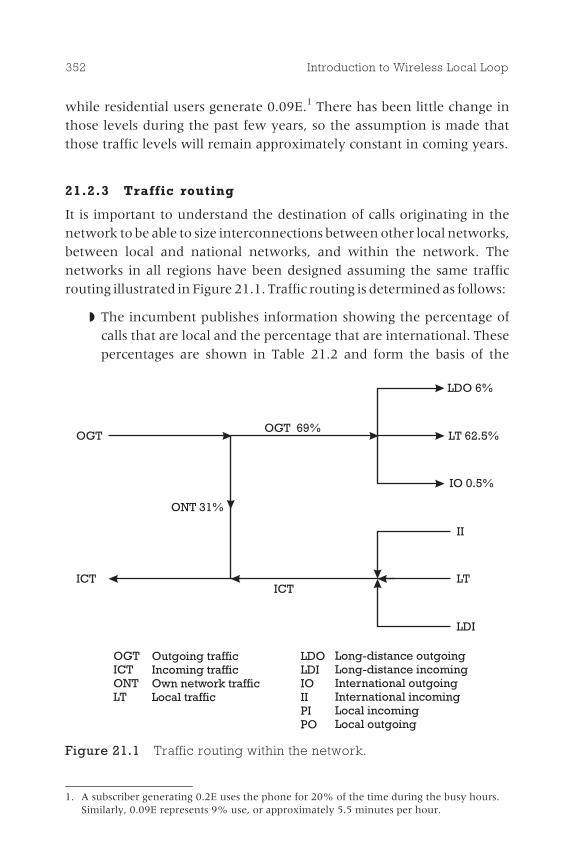
while residential users generate 0.09E.1 There has been little change inthose levels during the past few years, so the assumption is made thatthose traffic levels will remain approximately constant in coming years.
21.2.3 Traffic routing
It is important to understand the destination of calls originating in thenetwork to be able to size interconnections between other local networks,between local and national networks, and within the network. Thenetworks in all regions have been designed assuming the same trafficrouting illustrated in Figure 21.1. Traffic routing is determined as follows:
◗ The incumbent publishes information showing the percentage ofcalls that are local and the percentage that are international. Thesepercentages are shown in Table 21.2 and form the basis of the
352 Introduction to Wireless Local Loop
OGTOGT 69%
LDO 6%
LT 62.5%
IO 0.5%
II
LT
LDI
ICTICT
ONT 31%
OGTICTONTLT
Outgoing trafficIncoming trafficOwn network trafficLocal traffic
LDOLDIIOIIPIPO
Long-distance outgoingLong-distance incomingInternational outgoingInternational incomingLocal incomingLocal outgoing
Figure 21.1 Traffic routing within the network.
1. A subscriber generating 0.2E uses the phone for 20% of the time during the busy hours.Similarly, 0.09E represents 9% use, or approximately 5.5 minutes per hour.
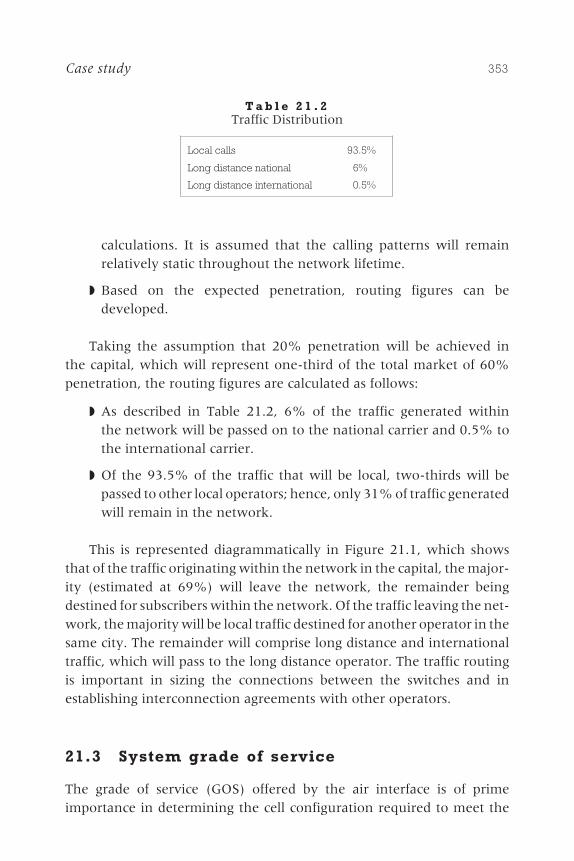
calculations. It is assumed that the calling patterns will remainrelatively static throughout the network lifetime.
◗ Based on the expected penetration, routing figures can bedeveloped.
Taking the assumption that 20% penetration will be achieved inthe capital, which will represent one-third of the total market of 60%penetration, the routing figures are calculated as follows:
◗ As described in Table 21.2, 6% of the traffic generated withinthe network will be passed on to the national carrier and 0.5% tothe international carrier.
◗ Of the 93.5% of the traffic that will be local, two-thirds will bepassed to other local operators; hence, only 31% of traffic generatedwill remain in the network.
This is represented diagrammatically in Figure 21.1, which showsthat of the traffic originating within the network in the capital, the major-ity (estimated at 69%) will leave the network, the remainder beingdestined for subscribers within the network. Of the traffic leaving the net-work, the majority will be local traffic destined for another operator in thesame city. The remainder will comprise long distance and internationaltraffic, which will pass to the long distance operator. The traffic routingis important in sizing the connections between the switches and inestablishing interconnection agreements with other operators.
21.3 System grade of service
The grade of service (GOS) offered by the air interface is of primeimportance in determining the cell configuration required to meet the
Case study 353
T a b l e 2 1 . 2Traffic Distribution
Local calls 93.5%
Long distance national 6%
Long distance international 0.5%
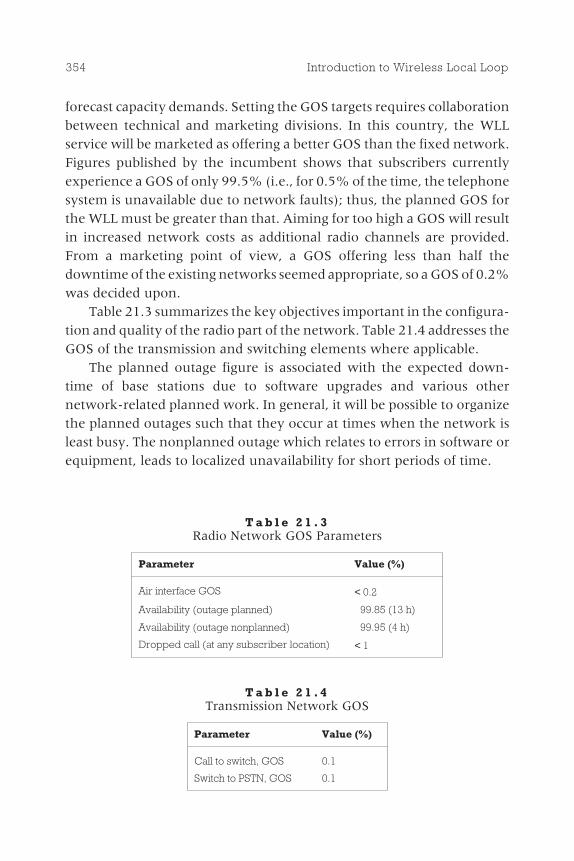
forecast capacity demands. Setting the GOS targets requires collaborationbetween technical and marketing divisions. In this country, the WLLservice will be marketed as offering a better GOS than the fixed network.Figures published by the incumbent shows that subscribers currentlyexperience a GOS of only 99.5% (i.e., for 0.5% of the time, the telephonesystem is unavailable due to network faults); thus, the planned GOS forthe WLL must be greater than that. Aiming for too high a GOS will resultin increased network costs as additional radio channels are provided.From a marketing point of view, a GOS offering less than half thedowntime of the existing networks seemed appropriate, so a GOS of 0.2%was decided upon.
Table 21.3 summarizes the key objectives important in the configura-tion and quality of the radio part of the network. Table 21.4 addresses theGOS of the transmission and switching elements where applicable.
The planned outage figure is associated with the expected down-time of base stations due to software upgrades and various othernetwork-related planned work. In general, it will be possible to organizethe planned outages such that they occur at times when the network isleast busy. The nonplanned outage which relates to errors in software orequipment, leads to localized unavailability for short periods of time.
354 Introduction to Wireless Local Loop
T a b l e 2 1 . 3Radio Network GOS Parameters
Parameter Value (%)
Air interface GOS < 0.2
Availability (outage planned) 99.85 (13 h)
Availability (outage nonplanned) 99.95 (4 h)
Dropped call (at any subscriber location) < 1
T a b l e 2 1 . 4Transmission Network GOS
Parameter Value (%)
Call to switch, GOS 0.1
Switch to PSTN, GOS 0.1
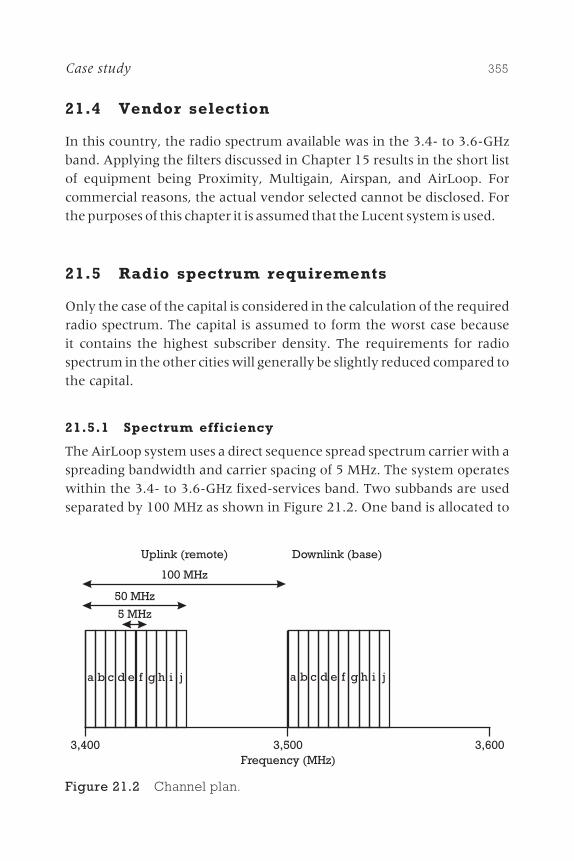
21.4 Vendor selection
In this country, the radio spectrum available was in the 3.4- to 3.6-GHzband. Applying the filters discussed in Chapter 15 results in the short listof equipment being Proximity, Multigain, Airspan, and AirLoop. Forcommercial reasons, the actual vendor selected cannot be disclosed. Forthe purposes of this chapter it is assumed that the Lucent system is used.
21.5 Radio spectrum requirements
Only the case of the capital is considered in the calculation of the requiredradio spectrum. The capital is assumed to form the worst case becauseit contains the highest subscriber density. The requirements for radiospectrum in the other cities will generally be slightly reduced compared tothe capital.
21.5.1 Spectrum efficiency
The AirLoop system uses a direct sequence spread spectrum carrier with aspreading bandwidth and carrier spacing of 5 MHz. The system operateswithin the 3.4- to 3.6-GHz fixed-services band. Two subbands are usedseparated by 100 MHz as shown in Figure 21.2. One band is allocated to
Case study 355
a b ec d f g jh i a b ec d f g jh i
3,400 3,500 3,600Frequency (MHz)
100 MHz
5 MHz
50 MHz
Uplink (remote) Downlink (base)
Figure 21.2 Channel plan.
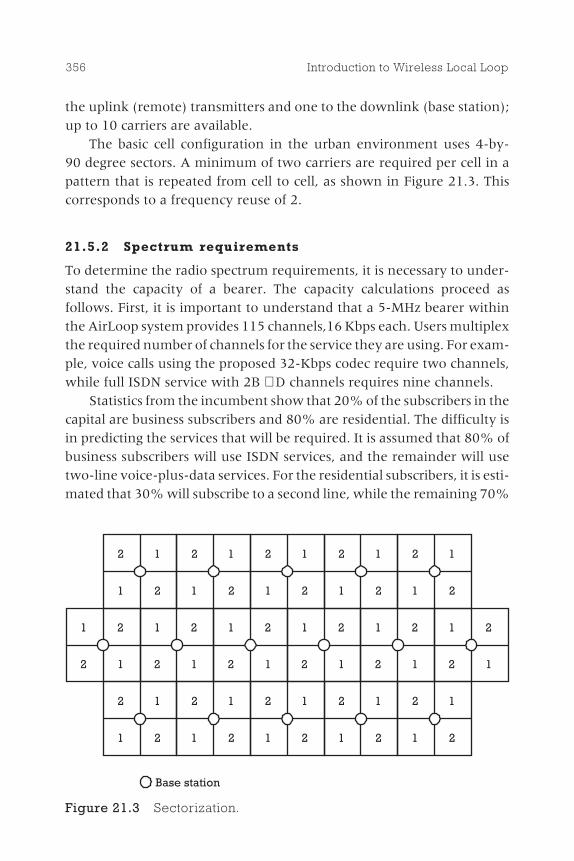
the uplink (remote) transmitters and one to the downlink (base station);up to 10 carriers are available.
The basic cell configuration in the urban environment uses 4-by-90 degree sectors. A minimum of two carriers are required per cell in apattern that is repeated from cell to cell, as shown in Figure 21.3. Thiscorresponds to a frequency reuse of 2.
21.5.2 Spectrum requirements
To determine the radio spectrum requirements, it is necessary to under-stand the capacity of a bearer. The capacity calculations proceed asfollows. First, it is important to understand that a 5-MHz bearer withinthe AirLoop system provides 115 channels,16 Kbps each. Users multiplexthe required number of channels for the service they are using. For exam-ple, voice calls using the proposed 32-Kbps codec require two channels,while full ISDN service with 2B + D channels requires nine channels.
Statistics from the incumbent show that 20% of the subscribers in thecapital are business subscribers and 80% are residential. The difficulty isin predicting the services that will be required. It is assumed that 80% ofbusiness subscribers will use ISDN services, and the remainder will usetwo-line voice-plus-data services. For the residential subscribers, it is esti-mated that 30% will subscribe to a second line, while the remaining 70%
356 Introduction to Wireless Local Loop
2 1
1 2
1 2
2 1
1 2
2 1
1 2
2 1
1 2
2 1
1 2
2 1
1 2
2 1
2 1
1 2
2 1
1 2
2 1
1 2
2 1
1 2
2 1
1 2
2 1
1 2
2 1
1 2
2 1
1 2
2 1
1 2
Base station
Figure 21.3 Sectorization.
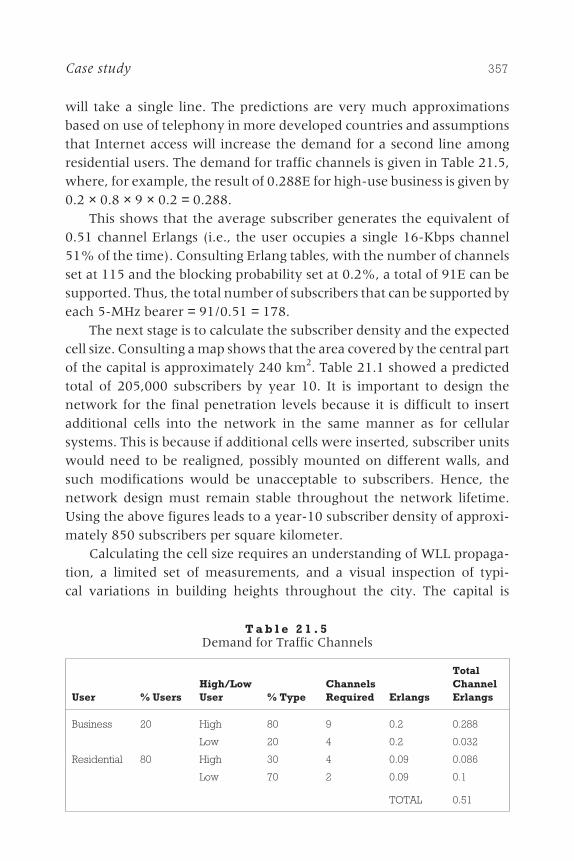
will take a single line. The predictions are very much approximationsbased on use of telephony in more developed countries and assumptionsthat Internet access will increase the demand for a second line amongresidential users. The demand for traffic channels is given in Table 21.5,where, for example, the result of 0.288E for high-use business is given by0.2 × 0.8 × 9 × 0.2 = 0.288.
This shows that the average subscriber generates the equivalent of0.51 channel Erlangs (i.e., the user occupies a single 16-Kbps channel51% of the time). Consulting Erlang tables, with the number of channelsset at 115 and the blocking probability set at 0.2%, a total of 91E can besupported. Thus, the total number of subscribers that can be supported byeach 5-MHz bearer = 91/0.51 = 178.
The next stage is to calculate the subscriber density and the expectedcell size. Consulting a map shows that the area covered by the central partof the capital is approximately 240 km2. Table 21.1 showed a predictedtotal of 205,000 subscribers by year 10. It is important to design thenetwork for the final penetration levels because it is difficult to insertadditional cells into the network in the same manner as for cellularsystems. This is because if additional cells were inserted, subscriber unitswould need to be realigned, possibly mounted on different walls, andsuch modifications would be unacceptable to subscribers. Hence, thenetwork design must remain stable throughout the network lifetime.Using the above figures leads to a year-10 subscriber density of approxi-mately 850 subscribers per square kilometer.
Calculating the cell size requires an understanding of WLL propaga-tion, a limited set of measurements, and a visual inspection of typi-cal variations in building heights throughout the city. The capital is
Case study 357
T a b l e 2 1 . 5Demand for Traffic Channels
User % UsersHigh/LowUser % Type
ChannelsRequired Erlangs
TotalChannelErlangs
Business 20 High 80 9 0.2 0.288
Low 20 4 0.2 0.032
Residential 80 High 30 4 0.09 0.086
Low 70 2 0.09 0.1
TOTAL 0.51
composed of buildings almost universally four stories high. There are fewtall buildings, except in the financial district. As a result, cellular operatorshave typically resorted to placing masts on top of buildings to get theantenna height some 10m above the building level. The same approachwill be required for WLL, possibly using the same masts as the cellularoperators. Such an approach provides a limited propagation range dueto the small height increment of the base stations above the buildinglevel. Measurements from a test site showed that the typical range wasapproximately 1 km from the base station.
It is desirable not to reduce that range if possible, because using themaximum range achievable minimizes the amount of infrastructurerequired. The government had indicated that 2 × 50 MHz might beallocated to the operator if it could be justified. The calculation as towhether this was sufficient proceeds as follows:
◗ Each cell covers an area of 3.14 km2. Each cell is divided into foursectors, with a frequency reuse of 2.
◗ In the area covered by one cell, 3.14 × 850 = 2,670 subscribers areexpected.
◗ To provide service to 2,670 subscribers, 2,670/178 = 15 carriers are
required = 4 carriers per sector.
◗ Because of the cluster effect, each carrier requires 2 × 10 MHz;
hence, the total spectrum requirement is 2 × 40 MHz.
◗ Allowing for some areas having a higher density of business users
than others, the need for 2 × 50 MHz of spectrum can readily bejustified.
These calculations show that, in most cases, the cell radius can be main-tained at 1 km and sufficient capacity provided. It is entirely fortuitousthat the system is operating at the point of just avoiding being capacityconstrained.
21.6 Numbering requirements
In each city where a network is installed, an appropriate range of num-bers will need to be allocated so that calls destined for subscribers within
358 Introduction to Wireless Local Loop
the network can be routed to the correct switch. The size of the number-ing range will need to be sufficient to cope with the expected number ofsubscribers, including the need for multiple numbers for some subscrib-ers. For example, in the capital, a numbering range providing 1,000,000numbers (six digits) will be required. The capital currently uses a seven-digit numbering system (an area code of 1 followed by seven digits);hence, the network would require a number of the form 6xx xxxx toaccommodate subscriber growth. Alternatively, 10 sets of five digits, forexample, 62x xxxx, 73x xxxx, and so on, would be required.
21.7 Network build plan
Discussions with local consultants in the capital reveal that the residencesunlikely to adopt a telephony service are located almost entirely on itseastern side. Therefore, the coverage plan is to provide coverage acrossthe entire remainder of the city. The sites were selected as follows:
◗ In the first instance, base station sites were proposed on a squaregrid, with base stations separated by 2 km (allowing a 1-km cover-age radius).
◗ For each site, a survey was performed around the center of the cell.Buildings that were slightly higher than surrounding buildings,particularly if they already had masts, were spotted and, wherepossible, a visual inspection performed from the building.
◗ Because of the homogeneity of buildings throughout the capital, inmost cases it was possible to select a building very close to theproposed location.
21.8 Network configuration
An overview of the network is shown in Figure 21.4. Broadly, thenetwork consists of three key elements�the base stations, the switch,and the network management system. The base stations are connected tothe switch via either radio or leased lines. In turn, the switch is connectedto local switches and the long-distance operator via fiber-optic cables. Thenetwork management system monitors all functions of the network andprovides status reports to the network management center.
Case study 359

The transmission system and the switching arrangements aredescribed in more detail next. See Chapter 13 for details of the AirLooptechnology, including the abbreviations and nomenclature.
21.8.1 Interswitch links
The determination of the most appropriate means to connect the networkswitch with other local carriers and the long-distance carrier starts with acalculation of the expected traffic. In the capital, as was shown inTable 21.1, approximately 205,000 subscribers are expected. That is actu-ally at the upper limit of the capacity of a single switch, and it would bebetter to deploy two switches to handle this number of subscribers. Eachswitch will then handle approximately 102,000 subscribers. Assumingthat each residential subscriber generates 0.09E of traffic in the busyhour, that each business subscriber generates 0.2E in the busy hour, andthat the split of residential to business is 80 to 20, then the interswitch
360 Introduction to Wireless Local Loop
Switchingnetwork
CATUracks
OMC(switch)
OMC(WLL)
Networkmanagement
center
Database/monitoring
system
Technical department
Customerservice center
To PSTN
RBS/network node
RBS
RBS RBS
Optical fiber/leased lines
Microwavelinks
OMC(trans)
Figure 21.4 General network configuration.
links both within the network and to external networks will require acombined capacity of:
(102,000 × 0.8 × 0.09) + (102,000 × 0.2 × 0.2) = 11,400E
Using 64-Kbps PCM, that corresponds to a total bandwidth require-ment on the order of around 800 Mbps. That could be readily providedover either a fiber-optic cable or a microwave link using six 155-MbpsSDH1 links. The switches will actually be located very close to theinterconnection points, so the cost of laying a cable is actually less in thiscase than the cost of microwave links. Further, the deployment of opticalfiber allows a greater reliability and a higher capacity, should additionalcapacity expansion be required.
21.8.2 Interswitch signaling system
The protocol used on the interswitch links typically depends on theprotocols used by the existing switches. In the capital, because theinternational standard SS7 signaling system is widely used, that protocolwas adopted for interconnection.
21.8.3 Interswitch synchronization
It is important that all the switches in an area be synchronized to avoidloss of data due to timing slippage. It is generally preferable to make use ofexisting accurate timing sources in the switches already deployed byother operators. That has the advantage of not introducing an addi-tional timing source into the network, thus complicating the difficultiesinvolved in interconnection. In the capital, the incumbent already pro-vides network timing to other local loop operators, so that timing sourcecan be used directly.
21.8.4 Base station to switch links
In general, the connections between the base stations and the switch willbe provided using microwave radios, to maximize deployment speed andminimize disruption to the city infrastructure. For each carrier deployed,an E1 link providing 2-Mbps data capability is required on the link to theswitch. On most base station sites, four sectors will be deployed, each
Case study 361
sector supporting up to five carriers. Hence, for a fully loaded base station,around 20 E1 carriers might be required, needing 40 Mbps of data trans-mission capability. In practice, the microwave links likely to be deployedprovide up to 16 E1 carrier capacity, that is, 32 Mbps. To avoid using twomicrowave links, the number of carriers deployed in those sectors ofthe base stations having the lowest demand will be reduced such that a32-Mbps link can be used.
Microwave radio equipment can be supplied operating in any of thefrequency bands set aside for point-to-point applications. For economicreasons, however, the 38-GHz band is preferred for links of up to approxi-mately 6 km in length and the 23-GHz band for links up to 15 km. Almostall of the links foreseen are less than 6 km in length. Because a relativelylarge number of base stations will be interconnected to the switch, it is notappropriate to use a ring configuration because that would result in arequirement for very high bandwidths flowing around the ring. Instead,a more appropriate configuration is to protect every microwave link,using a so-called 1 + 1 configuration. That means each link is backed up bya completely redundant link that can be activated immediately if the firstlink fails. Most base stations will be linked back directly to the switch in astar configuration, with some base stations daisy-chained.
Where daisy-chaining has occurred, the connection back to theswitch will require a higher bandwidth. Microwave links are widelyavailable with 155-Mbps bandwidth (the so-called SDH1 rate), allowingthe traffic from around five base stations to be concentrated onto a singlelink, which will be sufficient in this case.
21.9 Traffic matrix and routing
From the design principles concerning transmission described earlier andthe expectations as to the amount of traffic passing to different destina-tions, a traffic matrix can be constructed showing how the traffic will flowaround the network and through the interconnection points and how therequired resilience is achieved within the network. The traffic matriceswill be similar for all the cities, although the exact sizing of the differentlinks may change. In Figure 21.5, the traffic matrix for the capital is pro-vided to illustrate the design principles used. It shows a simplified versionof the network. The two switches to be installed are shown, as are two of
362 Introduction to Wireless Local Loop
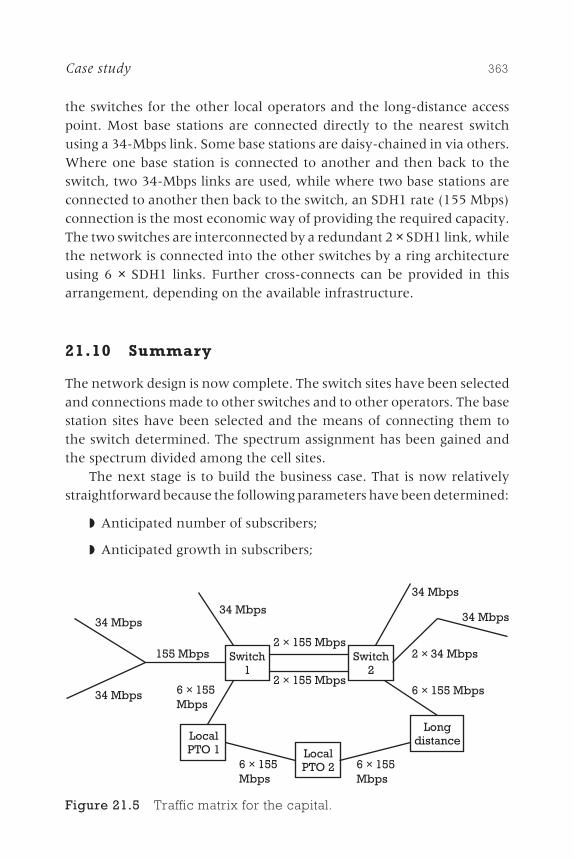
the switches for the other local operators and the long-distance accesspoint. Most base stations are connected directly to the nearest switchusing a 34-Mbps link. Some base stations are daisy-chained in via others.Where one base station is connected to another and then back to theswitch, two 34-Mbps links are used, while where two base stations areconnected to another then back to the switch, an SDH1 rate (155 Mbps)connection is the most economic way of providing the required capacity.The two switches are interconnected by a redundant 2 × SDH1 link, whilethe network is connected into the other switches by a ring architectureusing 6 × SDH1 links. Further cross-connects can be provided in thisarrangement, depending on the available infrastructure.
21.10 Summary
The network design is now complete. The switch sites have been selectedand connections made to other switches and to other operators. The basestation sites have been selected and the means of connecting them tothe switch determined. The spectrum assignment has been gained andthe spectrum divided among the cell sites.
The next stage is to build the business case. That is now relativelystraightforward because the following parameters have been determined:
◗ Anticipated number of subscribers;
◗ Anticipated growth in subscribers;
Case study 363
Switch1
Switch2
LocalPTO 1 Local
PTO 2
Longdistance
34 Mbps34 Mbps
34 Mbps
34 Mbps
34 Mbps
2 34× Mbps155 Mbps2 155 Mbps×
2 155× Mbps6 155× Mbps
6 155×Mbps
6 155×Mbps
6 155×Mbps
Figure 21.5 Traffic matrix for the capital.
◗ Expected traffic per subscriber;
◗ Total equipment requirements.
Once the marketing departments have estimated the tariff levels, cal-culation of total revenue and total expenditure can proceed using thebusiness case template given in Chapter 19. The full business case is notpresented here due to commercial confidentiality. Suffice it to say that itwas sufficiently good to proceed with the network license application.
364 Introduction to Wireless Local Loop

The future
22.1 Introduction
Those who are most able to accurately pre-dict the future invest accordingly and maketheir fortunes, while those less able resort toattempting to make money from telling oth-ers what their vision of the future is. Further,most authors wisely preface predictions withsome of the many examples of amusinglyinaccurate predictions. Finally, anyone writ-ing a book about a subject tends to be biasedtoward believing in the future potential ofthat subject. All those warnings are relevanthere; indeed, this chapter is more at therequest of the reviewers rather than the judg-ment of the author.
Nevertheless, predictions are interestingto read and, if treated with caution, can pro-vide useful stimulus to thought. This chapterhas been divided into four sections. The firstsection looks at possible technical advances inWLL technology, enabling better and lowercost offerings. The second looks at the capa-bilities of the other access technologies that
365
Contents
22.1 Introduction
22.2 Technicaladvances in WLL
22.3 Technicaladvances in otheraccess techniques
22.4 Changing userdemand
22.5 The future forWLL
22C H A P T E R
are in competition with WLL to enhance their capabilities. The thirdsection considers how users� demands might change in the much-heralded �Information Society.� The final section attempts to draw someconclusions from all of these predictions as to how future demand forWLL systems might develop.
22.2 Technical advances in WLL
Consumers are used to computers that double in power and capacityalmost annually and a seemingly invincible technical revolution. Suchrevolutions have not occurred in the world of wireless. Although therehas been a transition from analog to digital mobile telephony, the con-sumer benefits have not been great, and the transition will take place overa 15-year period. Plans for third-generation mobile radio systems showlittle more than an ability for the phone to master multiple different stan-dards. Equally, early predictions of the spectrum efficiency of the newersystems generally have proved to be incorrect, with GSM only providingmarginal capacity increases over TACS systems.
Hence, significant technological advances enabling much more effi-cient use of the radio spectrum and providing valuable additional bene-fits to users seem unlikely. WLL systems will add additional featuresand gain flexibility, but in general no major breakthroughs should beexpected.
It is easy to predict the arrival of broadband systems because these arealready under development; they will allow WLL to enter the commercialas well as the domestic market. A key issue will be the determinationof the best mix of bandwidth and price that the subscriber would want.3G-based WLL systems would seem to have much to offer in terms ofproviding data rates up to 2 Mbps at prices only slightly higher than theexisting cellular technologies. It is not clear whether LMDS systems willbe attractive to anything other than businesses if these 3G systems aredeveloped.
A key advance in WLL systems will be the move to a packet-basedarchitecture and the use of IP as a unified transport mechanism. Packetswitching will reduce the cost of WLL networks and allow them totransport voice, data, and Internet traffic in a seamless manner. Indeed,
366 Introduction to Wireless Local Loop

WLL networks may be the first to reach this �brave new world.� This isbecause there is less incentive for mobile networks to move to packetswitching because their data transmission load is lower, and existingwireline networks have a circuit switching legacy to overcome.
By far, the most important development will be the achievement oflarge economies of scale through worldwide penetration, which will leadto lower prices, further increasing the cost advantage of WLL systems. Atpresent, subscriber units cost perhaps $1,000 for the proprietary systems,whereas GSM mobile phones cost around $200 each. In principle, there islittle reason why WLL subscriber unit prices should not fall to the levelof mobile phones, or near those levels, as long as sufficient economies ofscale can be achieved, and cdmaOne units are already approachingthis price. This is a reinforcing trend; as prices fall, demand increases,resulting in greater economies of scale and further reductions until theequipment cost falls to the minimum manufacturing cost. WLL willundoubtedly follow that path since it has already taken the first stepsalong it, and orders are increasing even at current prices. However, it willnot follow it as quickly as the mobile systems due to the lack of standardi-zation and the resulting lack of competition. Nevertheless, within adecade, cellular-based subscriber units should cost less than around$150 each in real terms, with proprietary units at around $250 each.
22.3 Technical advances in other accesstechniques
The key question facing WLL systems is whether the xDSL technologieswill develop to such a level that subscribers will be able to cheaply receiveVoD and similar material through their existing copper pairs. Such adevelopment would allow the wired operators to subsidize their costof telecommunications with additional services, making market entrydifficult for WLL operators. The success of xDSL depends almost entirelyon the quality of the existing lines, which varies from region to region andcountry to country. Prediction in this area is almost impossible; however,it seems likely that the difficulty of xDSL provision will mean that it canonly be provided to a subset of possible subscribers. As a result, there willbe significant market remaining for WLL.
The future 367
Another important issue is whether the much-heralded fixed-mobileintegration will occur. Perhaps integration is a misnomer; mobile domi-nance might be a better way to describe the vision of those articulatingsuch a future. Simply put, why not use your mobile at home as well aswhen roaming? As long as the quality is sufficient and the call charges arelow, that makes establishing contact with an individual much simpler. Asdiscussed at length in Chapter 18, there are many flaws with that argu-ment, flaws that are increasingly emerging with time. Fixed-mobileintegration will not occur in any meaningful way during the next dec-ade. Instead, intelligent network platforms will perform call redirectionbetween fixed and mobile phones (where the fixed phone might actuallybe a home cordless base station), depending on a wide range of options sothat single numbers can be used and single bills provided. Indeed, suchplatforms are already here and are used for premium �personal numbers�in some countries. Such developments hold no concerns for WLL; a fixedline to the home will still be required.
Internet telephony is currently an application that concerns manyexisting operators. The concept is to use advanced speech coders to com-press and segment the voice and then send the packets over the Internet.The advent of the technology is entirely artificial due to the fact that allInternet calls are charged at local rates despite the fact that many result ininternational flows of data. That, in fact, reflects the true cost of telephonyprovision, where the local loop section represents the vast majority of thecost and the national and international trunk contribution is almost insig-nificant. However, fixed operators persist in inflating international pricesto increase profitability and in some cases subsidize the local loop. If Inter-net telephony works (and it is unlikely to do so for long, even if it doeswork at first, as the network becomes swamped by voice as well as thecurrent heavy data load), the net result simply will be that fixed operatorswill rebalance their tariffs so that Internet telephony is no longer worth-while. The only advantage then will be the ability to link voice withexploring a site so that users could contact the operator of the site they aresurfing for help.
Even that discussion is irrelevant for WLL. Whether the voice serviceis through the voice network or across the Internet, it will still be carriedalong the same WLL lines to the network and can still be tariffed at thesame rate. For that reason, Internet telephony poses little threat tothe WLL operator.
368 Introduction to Wireless Local Loop
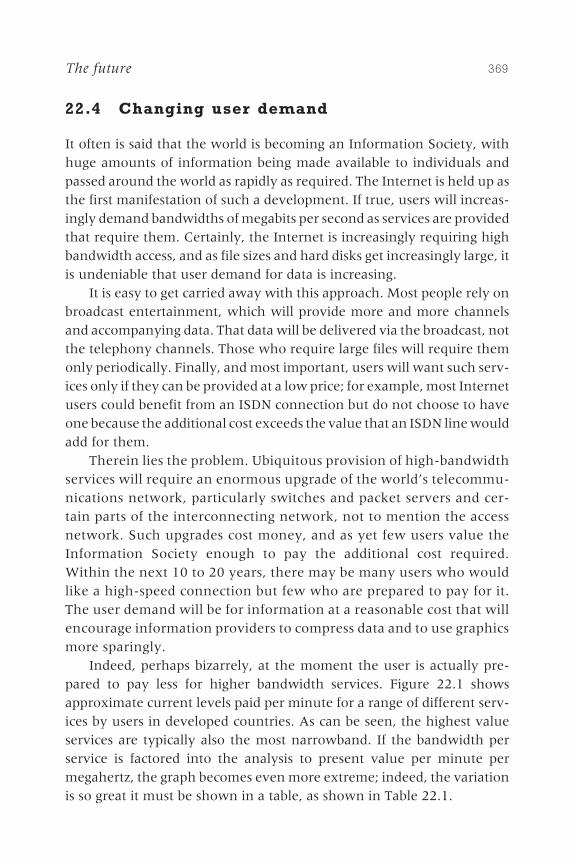
22.4 Changing user demand
It often is said that the world is becoming an Information Society, withhuge amounts of information being made available to individuals andpassed around the world as rapidly as required. The Internet is held up asthe first manifestation of such a development. If true, users will increas-ingly demand bandwidths of megabits per second as services are providedthat require them. Certainly, the Internet is increasingly requiring highbandwidth access, and as file sizes and hard disks get increasingly large, itis undeniable that user demand for data is increasing.
It is easy to get carried away with this approach. Most people rely onbroadcast entertainment, which will provide more and more channelsand accompanying data. That data will be delivered via the broadcast, notthe telephony channels. Those who require large files will require themonly periodically. Finally, and most important, users will want such serv-ices only if they can be provided at a low price; for example, most Internetusers could benefit from an ISDN connection but do not choose to haveone because the additional cost exceeds the value that an ISDN line wouldadd for them.
Therein lies the problem. Ubiquitous provision of high-bandwidthservices will require an enormous upgrade of the world�s telecommu-nications network, particularly switches and packet servers and cer-tain parts of the interconnecting network, not to mention the accessnetwork. Such upgrades cost money, and as yet few users value theInformation Society enough to pay the additional cost required.Within the next 10 to 20 years, there may be many users who wouldlike a high-speed connection but few who are prepared to pay for it.The user demand will be for information at a reasonable cost that willencourage information providers to compress data and to use graphicsmore sparingly.
Indeed, perhaps bizarrely, at the moment the user is actually pre-pared to pay less for higher bandwidth services. Figure 22.1 showsapproximate current levels paid per minute for a range of different serv-ices by users in developed countries. As can be seen, the highest valueservices are typically also the most narrowband. If the bandwidth perservice is factored into the analysis to present value per minute permegahertz, the graph becomes even more extreme; indeed, the variationis so great it must be shown in a table, as shown in Table 22.1.
The future 369
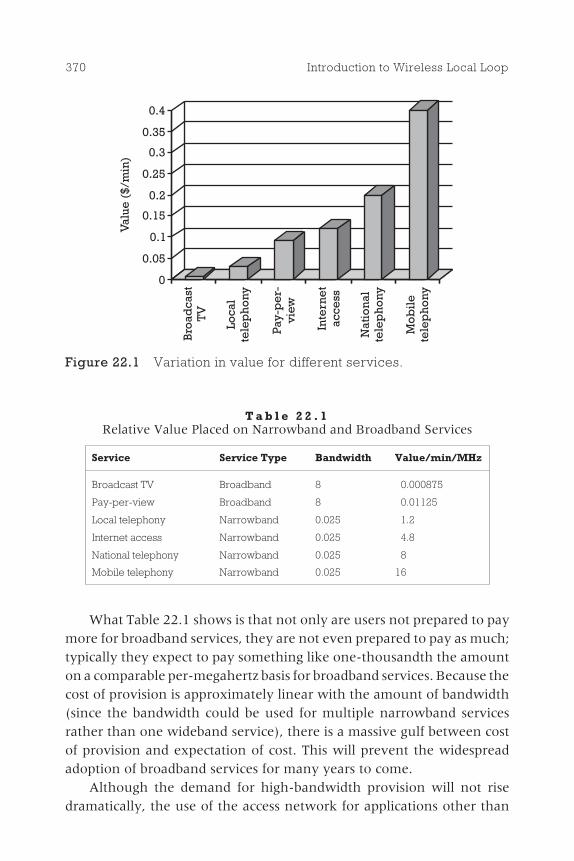
T a b l e 2 2 . 1Relative Value Placed on Narrowband and Broadband Services
Service Service Type Bandwidth Value/min/MHz
Broadcast TV Broadband 8 0.000875
Pay-per-view Broadband 8 0.01125
Local telephony Narrowband 0.025 1.2
Internet access Narrowband 0.025 4.8
National telephony Narrowband 0.025 8
Mobile telephony Narrowband 0.025 16
What Table 22.1 shows is that not only are users not prepared to paymore for broadband services, they are not even prepared to pay as much;typically they expect to pay something like one-thousandth the amounton a comparable per-megahertz basis for broadband services. Because thecost of provision is approximately linear with the amount of bandwidth(since the bandwidth could be used for multiple narrowband servicesrather than one wideband service), there is a massive gulf between costof provision and expectation of cost. This will prevent the widespreadadoption of broadband services for many years to come.
Although the demand for high-bandwidth provision will not risedramatically, the use of the access network for applications other than
370 Introduction to Wireless Local Loop
Val
ue($
/min
)0.4
0.35
0.3
0.25
0.2
0.15
0.1
0.05
0
Bro
adca
stT
V
Loca
lte
lep
ho
ny
Pay-
pe
r-vi
ew
Inte
rne
tac
cess
Nat
ion
alte
lep
ho
ny
Mo
bil
ete
lep
ho
ny
Figure 22.1 Variation in value for different services.
voice will change significantly. Internet access, including applicationssuch as home shopping, will dramatically increase the traffic generated bya home in that the phone line will now be used a much greater percent-age of the day. Modems will become a standard fit in computers andprobably also in televisions. That will fuel the demand for two or morelines per house and will also increase the revenue received per line by theoperator.
A final area worthy of mention is the increased environmentalawareness, which will make the laying of additional cables increasinglyproblematic. Even now, cable operators are criticized for damaging treeroutes. Once they are forced to pay compensation for the inconveniencetheir digging causes, wireless will become the preferred option for mostconnections.
22.4.1 Voice is mobile, data is fixed
As discussed in Chapter 3, a future where most voice calls are made onmobile phones but the vast bulk of data transmission is down fixed lines isone that seems quite likely. Hence, although WLL systems now tend torevolve around the provision of voice services and wireline transparency,it is likely that in only a few years time, the provision of broadband dataservices will be key, probably centered around IP delivery over packet-based protocols. The first MMDS solutions being trialed in the UnitedStates during the last part of 1999 are early examples of this, where somesolutions are data only with no voice capabilities, nor are they wirelinetransparent in that they do not offer fax, DTMF support, or any othersimilar features. Instead, they connect directly to a PC via an Ethernetconnector and provide �LAN equivalency.� During the next 5 years, therewill be a steady shift toward these types of solutions as voice increasinglybecomes a mobile application.
22.4.2 Where will the broadband revolution end?
Chapter 14 discussed a number of different broadband WLL solutions,and the preceding section noted how high-speed data transmission willbecome an increasingly important attribute for a WLL system. Therefore,it seems likely that these broadband solutions will increasingly come tothe fore as the leading WLL systems. At present, it is far from clear whichsolutions within the overall mix of broadband will play a key role, but the
The future 371
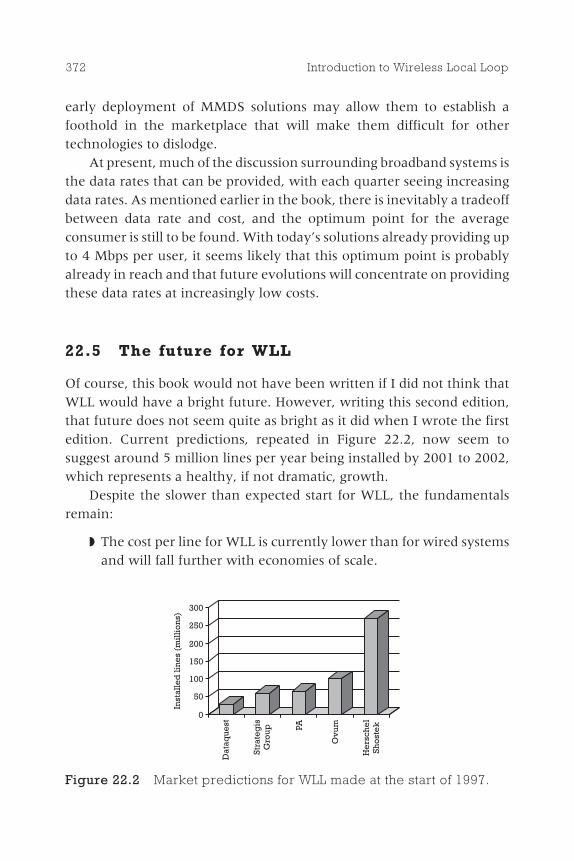
early deployment of MMDS solutions may allow them to establish afoothold in the marketplace that will make them difficult for othertechnologies to dislodge.
At present, much of the discussion surrounding broadband systems isthe data rates that can be provided, with each quarter seeing increasingdata rates. As mentioned earlier in the book, there is inevitably a tradeoffbetween data rate and cost, and the optimum point for the averageconsumer is still to be found. With today�s solutions already providing upto 4 Mbps per user, it seems likely that this optimum point is probablyalready in reach and that future evolutions will concentrate on providingthese data rates at increasingly low costs.
22.5 The future for WLL
Of course, this book would not have been written if I did not think thatWLL would have a bright future. However, writing this second edition,that future does not seem quite as bright as it did when I wrote the firstedition. Current predictions, repeated in Figure 22.2, now seem tosuggest around 5 million lines per year being installed by 2001 to 2002,which represents a healthy, if not dramatic, growth.
Despite the slower than expected start for WLL, the fundamentalsremain:
◗ The cost per line for WLL is currently lower than for wired systemsand will fall further with economies of scale.
372 Introduction to Wireless Local Loop
300
250
200
150
100
50
0
Inst
alle
dli
ne
s(m
illi
on
s)
Dat
aque
st
Stra
teg
isG
roup PA
Ovu
m
He
rsch
el
Sho
ste
k
Figure 22.2 Market predictions for WLL made at the start of 1997.
◗ The demand for telecommunications around the world willincrease significantly in coming years.
◗ Fragmentation and the development of market niches in the tele-communications market will allow a range of different operators tocoexist.
The predictions do not hinge on any technical or commercial break-through, although they do require that other access technologies do notdevelop unexpectedly or that other access technologies are discovered.
Of course, there will be some problems. Some operators will fail in thefirst few years through a misunderstanding of the market or throughthe deployment of inappropriate equipment, as for example has alreadyhappened with Ionica. Problems will soon emerge with the lack of radiospectrum and this will, effectively, increase the cost of radio spectrum,either directly, through auctions, or indirectly through the impossibilityof obtaining more, forcing greater network costs as smaller cells aredeployed. This will be partially solved as higher frequencies are used, butas with mobile radio, shortages of spectrum will remain a permanentproblem, limiting subscriber numbers and the data rates that can beoffered.
Despite these problems, the future of WLL is bright. Hopefully, youare now persuaded to invest some of your time or money in it.
The future 373

List of acronyms andabbreviations
A-D analog to digital
ADPCM adaptive differential pulse code modulation
ADSL asymmetric digital subscriber line
AM amplitude modulation
AMPS Advanced Mobile Phone System
AN access network
ARQ automatic repeat request
ATM Asynchronous Transfer Mode
BCC bearer channel connection protocol
BCH Bose-Chaudhuri-Hocquenghem
BER bit error rate
BRA basic rate access (ISDN at 144 Kbps)
BRAN Broadband Radio Access Networks
BSC base station controller
375
CABSINET cellular access to broadband services and interactivetelevision
CAS channel associated signaling
CATU central access and transcoding unit
CDMA code division multiple access
CELP code excited linear prediction
CEPT Central European Post and Telecommunications
COFDM coded orthogonal frequency division multiplexing
CPE customer-premises equipment
CRABS cellular radio access for broadband services
CS/CDMA carrier sense/collision detection multiple access
CT-2 Cordless Telephony system 2
CTRU central transceiver unit
D-AMPS digital AMPS
DAN DECT access node
DCA dynamic channel allocation
DCS1800 digital cellular system at 1800 MHz
DECT digital enhanced cordless telephone
DFT discrete Fourier transform
DOCSIS Data Over Cable System Interface Specification
DMT discrete multitone
DPSK differential phase shift keying
DS direct sequence
DS-CDMA direct sequence CDMA
DSL digital subscriber line
DSP digital signal processing
376 Introduction to Wireless Local Loop
ERMES European Radio Messaging System
ESN electronic serial number
ETSI European Telecommunications Standards Institute
EVRC enhanced variable rate codec
FAU fixed access unit
FDD frequency division duplex
FDM frequency division multiplexing
FDMA frequency division multiple access
FFT fast Fourier transform
FH frequency hopping
FH-CDMA frequency-hopped CDMA
FRA fixed radio access
FTTC fiber to the curb
FTTH fiber to the home
FWT fixed wireless terminal
FWT-PDS FWT programming and diagnostic software
GAP generic access protocol
GDP gross domestic product
GMSK Gaussian minimum shift keying
GOS grade of service
GSM global system for mobile communications
HDSL high-speed digital subscriber line
HDTV high-definition TV
HFC hybrid fiber coax
IFFT inverse fast Fourier transform
List of acronyms and abbreviations 377
IMT International Mobile Telecommunications
IP Internet Protocol
IRR internal rate of return
ISDN Integrated Services Digital Network
ISI intersymbol interference
ISM industrial, scientific, and medical
ITFS Instructional Television Fixed Service
ITS intelligent telephone socket
ITU International Telecommunications Union
IWU interworking unit
LAN local area network
LE local exchange
LMCS local multipoint communication system
LMDS local multipoint distribution systems
LOS line-of-sight
MAN metropolitan area network
MDS Multipoint Distribution Service
MMDS microwave multipoint distribution system
MVDS microwave video distribution system
NEXT near-end cross-talk
NIU network interface unit
NMT Nordic Mobile Telephone
NPV net present value
OFDM orthogonal frequency division multiplexing
O&M operations and maintenance
378 Introduction to Wireless Local Loop
OMC-F operations and maintenance center for the fixed networkcomponent
OMC-R operations and maintenance center�radio
PABX private access branch exchange
PAMR public access mobile radio
PC personal computer
PCM pulse code modulation
PCS personal communications service
PHS personal handiphone system
PM phase modulation
PMR private mobile radio
PN pseudo-random noise
POTS plain old telephony service
PSTN public switched telephone network
PTO post and telecommunications organization
QAM quadrature amplitude modulation
QPSK quadrature phase shift keying
RBS radio base station
REA Rural Electrification Administration
RF radio frequency
RFA radio fixed access
RLL radio in the local loop
RNC radio node controller
RPE-LTP regular pulse excited�long-term prediction
RPI retail price index
RS Reed Solomon
List of acronyms and abbreviations 379
SIR signal-to-interference ratio
SME small- to medium-sized enterprise
SMR specialized mobile radio
SNR signal-to-noise ratio
SOHO small office/home office
SS7 signaling system 7
STLPA single-tone linear power amplifier
STRU subscriber transceiver unit
TACS total access communications system
TCM trellis code modulation
TDD time division duplex
TDMA time division multiple access
TETRA Trans-European Trunked Radio
U-ADSL Universal ADSL
UHF ultra high frequency
UMTS Universal Mobile Telecommunications System
USO universal service obligation
VDSL very high-speed digital subscriber line
VSAT very small aperture terminal
VoD video on demand
VoIP voice over IP
WAM wireless access module
WiLL Motorola�s version of wireless local loop
WiSC WLL system controller
W-LAN wireless local area network
380 Introduction to Wireless Local Loop
WLL wireless local loop
WRC world radio conference
XCDR transcoder unit
xDSL belonging to the family ADSL, HDSL, and VDSL
List of acronyms and abbreviations 381

About the author
W illiam Webb graduated in electronic engineering from Southamp-ton University with a first class honors degree and all top year
prizes in 1989. In 1992 he gained his Ph.D. in mobile radio and in 1997he was awarded an M.B.A., all from Southampton University, UnitedKingdom.
From 1989 to 1993, Dr. Webb worked for Multiple Access Communi-cations Ltd. as the technical director in the field of hardware design,modulation techniques, computer simulation, and propagation model-ing. In 1993 he moved to Smith System Engineering Ltd., where he wasinvolved in a wide range of tasks associated with mobile radio and spec-trum management. These included devising the U.K. spectrum pricingproposals and writing the modifications to the GSM standard to introducegroup and broadcast calls. In 1997 he moved to NetCom Consultants,where he led the wireless local loop division, and in 1998 he movedto Motorola, where he is responsible for the strategic direction of thewireless local loop division.
Dr. Webb has published more than 50 papers, holds four patents, wasawarded the IERE Premium in 1994, is a member of the IEE where he sitson the Editorial Advisory Panel, and is a senior member of the IEEE. He is
383
the coauthor, with L. Hanzo, of Modern Quadrature Amplitude Modulation(New York: Wiley and Sons, 1992) and the author of Introduction toWireless Local Loop (Norwood, MA: Artech House, 1998), UnderstandingCellular Radio (Norwood, MA: Artech House, 1998), and The CompleteWireless Communications Professional: A Guide for Engineers and Managers(Norwood, MA: Artech House, 1999).
384 Introduction to Wireless Local Loop
Index
A
Accessvia coax, 32�34comparison, 40costs, 68developing countries, 48�49via mobile radio, 35�37multiple, 118�28overview, 23�24via power-line technology, 39summary, 39�40technologies, 23�40via TV broadcast, 34�35via twisted pair, 25�32via WLL, 37�38
Acronyms, 6�7Adaptive Broadband and
Ensemble, 232�33advantages, 232�33ATM format transmission, 233defined, 232variable-level modulation, 233See also Broadband proprietary
productsAdaptive differential PCM
(ADPCM), 110�11, 199
BER, 112coders, 111quality, 111quantization, 110
Administrative pricing, 284�85advantages/disadvantages, 284�85application of, 283defined, 282example, 284process, 284See also Radio spectrum
allocation/assignmentAirspan Communications, 196�97
data channels, 197defined, 196parameters, 197radio channels, 197voice, 196See also Proprietary technologies
Amplitude modulation(AM), 118, 119
Analog cellular, 180�81defined, 180TACS, 180�81See also Cellular systems
385
Analog-to-digital (A-D)converters, 108
Antennas. See Directional antennasAsymmetric digital subscriber line
(ADSL), 27, 205defined, 28functioning, 29Lite, 30NEXT, 28predications, 32Universal (U-ADSL), 30uses, 29See also xDSL
Attenuationdistance-related, 90�91rainfall, 99�100
Automatic repeat request(ARQ), 113
B
Bandwidthdetermining, 206microwave link, 362ratio to bit rate per user, 216requirements, 20telecommunications, 16total available, 211
Base station controllerscosts, 310GSM, 182interconnection costs, 311
Base stations, 253�54cells vs., 329costs, 310defined, 248interconnection costs, 310mobility in areas close to, 301SC614 CDMA, 253�54SC2450 CDMA, 253See also CdmaOne
Billing systems, 346Bit error rate (BER)
ADPCM coder, 112channels, 94
Block coding, 114Bose-Chadhuri-Hocquenghem
(BCH) codes, 114Broadband proprietary
products, 231�33Adaptive Broadband and
Ensemble, 232�33Floware, 232Telescicom, 232
Broadband Radio Access Networks(BRAN), 230
Broadband technologies, 83,85, 205�36
CABSINET, 228�29defined, 206drivers, 206HiperAccess, 230�31introduction to, 205�10LMDS, 222�26market summary, 209�10mesh networks, 233�36MMDS, 219�22MVDS, 226�28revolution, 371�72types of, 207�8wireless LAN, 229�30WLL provision of, 210�19
Broadband WLL, 19advantages/disadvantages, 38analysis variables, 218�19conclusions, 219costs, 215maximum capacity, 215outstanding assumptions, 216practical/economic
constraints, 214�19profitability, 217
386 Introduction to Wireless Local Loop
profit and penetrationrelationship, 218
profit variation with businessusage, 219
residential revenue and profitrelationship, 218
revenue, 215�16services, value placed on, 370spectrum size, 216technical constraints, 210�14viability analysis, 217�18See also Wireless local loop (WLL)
Broadcasting, 13�15cable, 13, 15digital, 14�15disadvantages, 35satellite, 13, 15, 35terrestrial, 35
Business case, 305�26analyzing, 323�26defined, 305developing, 305�26financial statistic
summary, 319�22financing arrangements, 317�19network build costs, 307�11ongoing costs, 311�13revenue prediction, 313�17spreadsheet drivers, 306structure, 305�7tariffing policies, 322
C
Cable modems, 34downstream capability, 34upbanded, 221�22
Cable systems, 10, 32�34advantages/disadvantages, 34composition, 33convergence and, 15
costs, 69cost variation with penetration/
distance, 70income source, 17maintenance costs, 70satellite vs., 13See also Broadcasting
Calhoun, C., 63�64, 70Capacity
calculating, 163CDMA, 142�46comparison, 240DECT, 176TDMA, 142WAM, 252
Carrier sense/collision detectionmultiple access(CS/CDMA), 229
Case study, 349�64grade of service, 353�54introduction, 349market demand forecast, 349�53network build plan, 359network configuration, 359�62numbering requirements, 358�59radio spectrum
requirements, 355�58summary, 363�64traffic matrix and routing, 362�63vendor selection, 355
CdmaOne, 36, 161, 184�86, 247�57architecture illustration, 248architecture including NIU, 251base stations (BTSs), 248, 253�54clusters, 184comparison, 191components, 248defined, 184downlink transmission, 184�85fax/data support and, 186fixed wireless terminals
(FWTs), 248, 254�57
Index 387
CdmaOne (continued)introduction to, 247operations and maintenance
center (O&M), 248parameters, 187PSTN to WAM
interconnection, 249�52speech coding, 185system architecture, 247�48system configuration, 250�52uplink transmission, 185voice codecs, 186wireless access module
(WAM), 248, 252�53See also Cellular systems
Cellsbase stations vs., 329calculation, 330for capacity, 331connecting, to switch, 337�44economic limits on, 215formulas, 331four-sector arrangement, 335inefficiency factor, 331macrocells vs. microcells, 149omnidirectional arrangement, 334for particular area, 331sectorization, 334�35selecting number of, 329�32size calculation, 357�58UMTS, 188
Cell sitesnegotiation, 333planning, 334selecting, 333�36
Cellular access to broadband servicesand interactive television(CABSINET), 228�29
Cellular systems, 13, 35�37, 179�91analog, 180�81CDMA, 128, 157
cdmaOne, 36, 161, 184�86,247�57
comparison of, 191D-AMPS, 157digital, 181�86disadvantages, 37future, 186�90GSM, 36, 157, 182�84introduction to, 179�80propagation, 89roles of, 37standards, 157strength, 35�36successful, 36�37summary of, 190�91TACS, 180�81TDMA, 36�37UMTS, 187�90WLL and, 179�80
Centrex service, 294�95CEPT, 275�76
decisions, 275radio spectrum band plan, 276
Channel-associated signaling(CAS), 243
ChannelsBER, 94DECT, 168demand for, 357Erlangs vs., 332LOS, 94�98measurements from, 90number needed, 331path loss, 90time variation in, 98�100wideband, 100�101
Ciphering, 116�17masks, 116, 117receiver and, 117schemes, 116transmitter and, 116
Circuit switching, 138�39
388 Introduction to Wireless Local Loop
Coax. See Cable systemsCode division multiple access
(CDMA), 8, 101, 124�28advantages, 127bandwidth flexibility, 149�50for broadband
applications, 150�51capacity, 142�46capacity limitation, 127cells, 149cellular, 128chip rate, 125code choice, 125codeword length, 125codeword shortages, 127cost, 149defined, 120direct sequence (DS-CDMA), 150frequencies, 144frequency-hopped
(FH-CDMA), 150frequency planning, 148gain, 143illustrated, 120interference and, 148ISI and, 101for mobile vs. WLL purposes, 132operation in unlicensed
bands, 148power control and, 127, 128process, 125range, 146�47sectorization, 147signal generation example, 126SNR, 143spreading codes in, 128�34TDMA debate with, 141�52technologies, 196�201use of, 146waveforms, numeric
representation of, 130WLL systems, 125�27, 134, 146
See also Multiple accessCode excited linear predictor
(CELP), 199Competition
environment, current, 300, 302Germany, 55high, 56�57limited, 54�56local loop, 54trunk network, 54United Kingdom, 56
Competitions technique, 286�87advantages/disadvantages, 286�87application of, 283defined, 282use of, 286See also Radio spectrum allocation/
assignmentComputing, 15�16Convergence, 10
cable and, 15cellular and, 13IP impact on, 16�17provider competition, 18PTOs as factor in, 12�13satellite and, 15twisted-pair copper as
factor in, 12�13See also Broadcasting; Computing;
TelecommunicationsConvolutional coders, 114Cordless systems, 37, 156, 165�77
applications, 165�66CT-2, 173�74DECT, 167�72design decisions, 165introduction to, 165�67PHS, 172�73summary of, 174�77WLL, 166�67
Cost base, 68
Index 389
Costsaccess, 68base station, 310base station controller, 310base station controller
interconnection, 311base station interconnection, 310broadband WLL, 215cable vs. WLL, 72�73comparison, 241�42general management, 313high-density case, 72hybrid systems, 74interconnection, 314leased line, 312, 340low-density case, 73maintenance, 70, 73, 312marketing, sales, customer
retention, 313medium-density case, 72microwave links, 339, 340network, 309�11network, calculating, 163network build, 307�11ongoing, 311�13operations, maintenance, billing
system, 311prediction, 313radio spectrum, 312�13rental, 312satellite link, 342subscriber equipment, 307�9subscriber management, 313wired systems, 68�71wireless systems, 71�74
Countriesdeveloping, 47�50, 262�63differences, 47Eastern European, 50�53, 263�65First World, 53�60, 265
Coverage, 103�5CT-2, 173�74
defined, 173operation frequency, 174parameters, 175technology comparison, 175See also Cordless systems
Customer care, 346
D
Datarates, 208, 209as service offering
component, 293Data Over Cable System Interface
Specification (DOCSIS), 222Developing countries, 47�50
access technologyattributes, 48�49
example, 49�50license opportunities, 262�63teledensity, 47telephony, 48traits, 47�48
Diffraction, 94�97angles, 97defined, 94illustrated, 95loss, 96parameters, 95
Digital broadcasting, 14�15Digital cellular. See Cellular systemsDigital enhanced cordless telephone
(DECT), 37, 160, 161, 167�72advantages, 167, 169architecture illustration, 170capacity, 176channels, 168DCA, 169DECT access node
(DAN), 169, 171defined, 167
390 Introduction to Wireless Local Loop
fixed access unit(FAU), 169�70, 171
infrastructure cost, 176�77ISI, 169network management
component, 172parameters, 173penetration, 172radio node controller
(RNC), 169, 170�71repeaters, 171, 172TDD, 168�69technology comparison, 175transceivers, 176�77transmit power, 169WLL products, 167See also Cordless systems
Digital subscriber lines (DSL).See xDSL
Directional antennas, 100beamwidth, 169, 170interference difference with, 145mounting, 345
Direct-sequence CDMA(DS-CDMA), 150
Discrete multitone (DMT), 29Distance-related attenuation, 90�91Doughnut cell, 74Dual-mode phones, 301Dynamic channel allocation
(DCA), 144�45DECT, 169gains, 145PHS, 145
E
Eastern Europe, 50�53developed countries vs., 53examples, 51license opportunities, 263�65
solution alternatives, 52teledensities, 50traits, 50�51WLL networks in, 52
Economicshybrid system, 74model, 68telecommunications
system, 67�68wired system, 68�71wireless system, 71�74
Economic value analysis, 283advantages/disadvantages, 283application of, 283defined, 282See also Radio spectrum
allocation/assignmentEconomies of scale, 367Environmental awareness, 371Erlang formula, 331, 332Error-correction coding, 112�16
defined, 112�13deployment, 113interleavers and, 115�16methodologies, 113�14redundancy, 113
Error-detection schemes, 113European Telecommunications
Standards Institute(ETSI), 157, 159
Broadband Radio AccessNetworks (BRAN), 207
spectrum mask, 159
F
Fadingfast, 91�94, 98�99Rayleigh, 92, 93slow, 91
Fast fading, 91�94, 98�99
Index 391
Fast fading (continued)defined, 91�92example, 92LOS path and, 93time variation and, 98�99waveform, 92, 93
Fast Fourier transform (FFT), 137Fax, as service offering
component, 293Fiber to the curb (FTTC), 205Fiber to the home (FTTH), 33, 205Financial statistics, 319�22
cumulative profit by year, 320example spreadsheet, 319internal rate of return
(IRR), 320�22NPV, 320, 321summary, 319�22
Financingbank, 318calculating, 317�19issues, 317�18options, 318payback period, 323�24, 325, 326raising, 323shareholder, 318vendor, 318
First World countries, 53�60categories, 53defined, 53Germany, 55�56high penetration, high
competition, 56�57high penetration, limited
competition, 54�56liberalized environment, 53license opportunities, 265teledensities, 53United Kingdom, 53, 57�60
Fixed radio access (FRA). SeeWireless local loop (WLL)
Fixed wireless terminals(FWTs), 254�57
antenna port, 256defined, 248, 254feature set, 254field programming, 257functions, 254illustrated, 255mounting, 256multiple, 255programming and diagnostic
software (FWT-PDS), 256surge protection, 255See also CdmaOne
Floware, 232Forecasts
geographical distribution oflines, 76
installed line, 76lines deployed, 77market, 75�78methodology, 78providing, 75technology distribution of
sales, 77Frequencies, 101�3
higher, use of, 103low, need for, 101�2standardization, 102WLL, 102
Frequency division duplex (FDD)systems, 140
Frequency division multiple access(FDMA), 120�22
advantages, 122channels, 120defined, 118disadvantages, 122ideal spectrum, 121illustrated, 120See also Multiple access
392 Introduction to Wireless Local Loop
Frequency-hopped CDMA(FH-CDMA), 150
Fresnel effects, 97, 98Fresnel zones, 98Functionality comparison, 242, 243
G
GDPfor developing countries, 262�63for Easter Europe, 264waiting lists for Eastern Europe
and, 265Generic access protocol (GAP), 167Germany, 55�56
competition, 55Deutsche Telekom, 56
Global marketplace, 9�11Global system for mobile
communications(GSM), 36, 182�84
base station controllers(BSCs), 182
channels, 182comparison, 191defined, 182manufacturers, 184network components, 182parameters, 183power transmission, 122ramping up for burst, 123services, 183spectrum, 121speech coding, 182See also Cellular systems
Grade of service (GOS), 353�54radio network, 354target, setting, 354transmission network, 354
Granger CD2000, 201, 202defined, 201
parameters, 202See also Proprietary technologies
H
High-rate digital subscriber line(HDSL), 27
defined, 28uses, 28See also xDSL
HiperAccess, 230�31as future WLL technology, 231spectrum, 230
Huygens-Fresnel theory, 97Hybrid systems, 74
I
India example, 49�50line supply vs. average waiting
list, 49WLL demand in, 50
Innowave Multigain, 195�96configuration, 195�96defined, 195parameters, 196voice coder, 196See also Proprietary technologies
Integrated Services Digital Network(ISDN), 17, 26�27
advantages/disadvantages, 27defined, 26as service offering
component, 293standard, 27United Kingdom, 56
Interconnection, 337�444base station, 310base station controller, 311costs, 310, 311
Index 393
Interconnection (continued)daisy-chaining, 341decision, 337direct, 341leased link, 337�38methods, 337microwave link, 338�42protocols, 343�44PSTN to WAM, 249�52ring, 341satellite link, 342�43
Interdigital B-CDMA, 200�201defined, 200licensing, 200parameters, 201See also Proprietary technologies
Interleaving, 115�16defined, 115disadvantage, 116illustrated, 116
Internal rate of return (IRR), 320�22Internet
data requirements, 20�21service provision, 297telephony, 368
Internet Protocol (IP), 16�17Interswitch
links, 360�61signaling system, 361synchronization, 361
Intersymbol interference (ISI), 93CDMA and, 101DECT and, 169OFDM and, 135, 137TDMA and, 123wideband channels and, 100
Inverse FFT (IFFT), 137Ionica, 83�84ITU, 274
guidelines, 275ITU-R, 274, 275recommendation example, 274
recommendations, 274, 275WRCs, 274
L
Leased lines, 295�97costs, 312, 340defined, 295�96fixed-link vs., 340in WLL, 296
Leased links, 337�38costs, 338defined, 337See also Interconnection
Licensesapplication, writing, 266�67application increase, 280awarding of, 266developing country, 262�63Eastern European
country, 263�65First World country, 265fixed and mobile
application, 272�73getting, 261�89government objectives, 267home country, 261number to be awarded, 270opportunities for, 261�65radio spectrum for WLL, 267�73radio spectrum issues, 274�89
Line-of-sight (LOS) path, 94�98diffraction, 94�97fast fading and, 93new obstructions, 99reflection, 97�98
Lines, numberdetermination, 350�51
Local loopcompetition, 54defined, 7
394 Introduction to Wireless Local Loop
mobility in, 298�303subsidization, 64See also Wireless local loop (WLL)
Local multipoint communicationsystem (LMCS). See Localmultipoint distributionsystems (LMDS)
Local multipoint distribution systems(LMDS), 222�26
access methods, 224capacity, 225defined, 222�23future of, 226line-of-sight propagation, 225modulation schemes, 224, 225parameters, 227propagation range, 224range, 226spectrum auctioned for, 223system guidelines, 224transmitter/receiver equipment, 226use of, 223�24See also Broadband technologies
Long distance/internationalservices, 297
Lucent AirLoop, 197�200central access and transcoding
unit (CATU), 198central office, 198central transceiver unit
(CTRU), 198�99defined, 197network interface unit (NIU), 199parameters, 200radio access architecture, 198radio base stations (RBSs), 197See also Proprietary technologies
M
Maintenance costs, 312
Management costs, 313Market demand forecast, 349�53
line determination, 350�51service offering
determination, 351�52traffic routing, 352�53
Marketing, sales, customer retentioncosts, 313
Mercury, 58, 61Mesh networks, 233�36
advantages, 234�35conventional architecture vs., 234defined, 233�34problems, 235�36trial systems, 236
Microwave links, 338�42bandwidth, 362costs, 339, 340defined, 338deploying, 339frequency bands, 338range variation, 338See also Interconnection
Microwave multipoint distributionsystems (MMDS), 219�22
band, 220characteristics, 221defined, 219�20spectrum assignment, 220upbanded cable modems, 221�22See also Broadband technologies
Microwave video distribution system(MVDS), 17, 226�28
defined, 226�27focus, 226potential failure of, 228standard, 227See also Broadband technologies
Mobile radio. See Cellular systems;Cordless systems
Mobilityin areas close to base station, 301
Index 395

Mobility (continued)defined, 298full, 299limited, 299in local loop, 298�303options, 301�2
Modemscable, 34, 221�22voiceband, 25�26xDSL, 29
Modulation, 117�18amplitude (AM), 118, 119phase (PM), 118, 119pulse code (PCM), 110�11quadrature amplitude
(QAM), 118waveforms, 119
Multipath propagation, 91Multiple access, 118�28
CDMA, 120, 124�28FDMA, 118, 120�22methods, 118�20TDMA, 120, 122�24
Multiple lines, as service offeringcomponent, 295
Multipoint Distribution Service(MDS), 220
N
Narrowband WLL, 18advantages/disadvantages, 38services, value placed on, 370See also Proprietary technologies
Net present value (NPV), 320, 321Network build costs, 307�11
base station, 310base station controller, 310base station controller
interconnection, 311base station interconnect, 310
combining, 311network, 309�11operations, maintenance, billing
system, 311subscriber equipment, 307�9switch, 311
Network build plan, 359Network configuration, 359�62
base station to switchlinks, 361�62
illustrated, 360interswitch links, 360�61interswitch signaling system, 361interswitch synchronization, 361
Network rollout, 327�47billing, 346cell interconnection, 337�46cells, selecting number of, 329�32cell sites, selecting, 333�36customer care, 346introduction to, 327�29process illustration, 328steps, 347summary, 346�47
Nordic Mobile Telephone (NMT)standard, 61
Nortel Proximity I, 194�95configuration, 194defined, 194parameters, 195services, 194See also Proprietary technologies
Numbering requirements, 358�59Nyquist theorem, 110
O
Ongoing costs, 311�13general management, 313leased line, 312maintenance, 312
396 Introduction to Wireless Local Loop
marketing, sales, customerretention, 313
radio spectrum, 312�13rental, 312subscriber management, 313
Operator services, 295Organization, this book, 7�8Orthogonal frequency division
multiplexing(OFDM), 29, 134�37, 222
advantages, 134for commercial deployment, 134conventional solutions vs., 135implementation difficulties, 137ISI and, 135, 137principle, 134transmitter arrangement, 136for two-way applications, 134for WLL, 137
P
Packet-based architecture, 366�67Packet switching, 138�39Path loss, 90, 212
law, 91phenomena, 90
Payback period, 323�2420% improvement effect, 32320% reduction effect, 324tariff related to call minutes
and, 326variables, impact of, 325See also Financing
Personal communications service(PCS) auctions, 286
Personal handiphone system(PHS), 145, 172�73
basis, 173defined, 172delay, 177
infrastructure cost, 177parameters, 174sales projection, 173spectrum allocation, 177technology comparison, 175See also Cordless systems
Phase modulation (PM), 118, 119Phoenix system, 201Plain old telephony service
(POTS), 293Planning tools, 103�4
defined, 103information on, 104principles, 104use of, 103�4
PN codes, 133Post and telecommunications
organizations (PTOs), 12as convergence factor, 13income source, 17
Power-line technology, 39Private access branch exchange
(PABX), 166Private mobile radio (PMR), 278Probability modeling, 342Propagation, 89�105
cellular, 89distance-related attenuation
and, 90�91fast fading and, 91�94introduction to, 89�94multipath, 91phenomena, 90slow fading and, 91WLL, 89
Proprietary technologies, 193�203Airspan Communications, 196�97CDMA, 196�201characteristics, 193cost of, 193defined, 193Granger CD2000, 201, 202
Index 397
Proprietary technologies (continued)Innowave Multigain, 195�96Interdigital B-CDMA, 200�201introduction to, 193�94Lucent AirLoop, 197�200Nortel Proximity I, 194�95parameter summary, 203Phoenix, 201summary of, 202�3TDMA, 194�96
Protocols, 343�44CAS, 343V5.1, 344V5.2, 344
Public switched telephone network(PSTN), 11
Pulse code modulation(PCM), 110�11
ADPCM, 110�11defined, 110
Q
Quadrature amplitude modulation(QAM), 118Quantization errors, 109�10
R
Radio fixed access (RFA). SeeWireless local loop (WLL)
Radio in the local loop (RLL). SeeWireless local loop (WLL)
Radio planning, 334Radio propagation. See PropagationRadio spectrum, 101, 267�89
application increase, 280competing demands, 268competition, increase, 281congestion, 277
costs, 312�13current frequency bands, 269demand growth, 279�80deregulation, 281difficulty in obtaining, 268�69efficiency, 277�79, 355�56finding, 268�70fixed/mobile applications
and, 272�73management, 274�82, 287openness, need for, 281pricing, 287regulatory matters, 270�72requirements, 355�58shortage implications, 288�89trends, 279unsatisfactory efficiency, 278use, as government
revenue-raising resource, 281use profits, 280for WLL, 267�73worldwide standardization, 270
Radio spectrum allocation/assignment, 282�87
administrativepricing, 282, 284�85
competitions, 282, 286�87economic tool application, 283economic value analysis, 282, 283trading, 282, 285�86
Radio spectrum manager, 288�89privatization, 281�82spectrum shortage and, 288�89tasks, 276WLL operators and, 289
Radio systems, 107�40block diagram, 108ciphering, 116�17circuit switching, 138�39error-correction coding, 112�16interleaving, 115�16modulation, 117�18
398 Introduction to Wireless Local Loop
multiple access, 118�28OFDM and, 134�37packet switching, 138�39speech encoding, 107�12time division duplex (TDD)
transmission, 139�40Rainfall attenuation, 99�100
level, 99link budget and, 100
Rayleigh fadingdefined, 92illustrated, 93
Reed-Solomon (RS) codes, 114Reflection, 97�98
defined, 97illustrated, 95materials and, 97
Rental costs, 312Revenue
calculation components, 315, 316division of, 316�17prediction, 313�17spreadsheet, 315
S
Sampling rate, 108, 109Satellite broadcasting, 35Satellite links, 342�43
cost, 342establishing, 342�43
Satellite systems, 10cable vs., 13convergence and, 15See also Broadcasting
SectorizationCDMA, 147illustrated, 356TDMA, 147, 335, 336
Service offeringsCentrex, 294�95
choosing, 291�303components, 292�99data, 293determining, 351�52fax, 293Internet service provision, 297introduction to, 291�92ISDN, 293leased lines, 295�97long-distance and international
services, 297minimum, 351multiple lines, 295operator services, 295POTS, 293supplementary services, 294videophone, 293�94
Shannon�s law, 210, 212Slow fading, 91Spatial diversity, 168Spectral masks, 159Speech coding, 107�12
A-D converter, 108cdmaOne, 185coders, 112complexity, 107�8GSM, 182quantization error, 109�10sampling rate, 108, 109voltage level, 108waveforms, 109
Spreadsheetsnetwork cost, 312ongoing expense, 314predicted revenue, 315subscriber unit calculations, 309summary financial statistics, 319
Standardization, 158�60Subscriber
categories, 313density, 357management costs, 313
Index 399

Subscriber (continued)units, installing, 345�46
Subscriber equipment costs, 307�9example spreadsheet
calculations, 309increase in, 325information, 307�8
Subsidization, 64�65business of, 64�65unsubstainability of, 65
Supplementary services, 294Switch costs, 311
T
Tariffspolicies, 322rebalancing of, 271related to call minutes, 326
Technical advancesin access techniques, 367�68in WLL, 366�67
Technologiesaccess, 23�40broadband, 83, 85, 205�36capacity comparison, 240cellular, 156, 179�91choosing, 239�45competitive situations
and, 244�45constraints as filters, 242�44cordless, 156, 165�77cost comparison, 241�42frequency band availability
and, 243functionality
comparison, 242, 243matching, to
requirements, 161�62overview of, 155�63
proprietarynarrowband, 156, 193�203
segmenting, 160�61spectrum limits of, 239standardization, 158�60subscriber densities and, 244
Telecommunications, 11�13bandwidth, 16cellular and, 13environment, 45�47PTOs and, 12�13system economics, 67�68twisted-pair copper
and, 11�12, 13Teledensity, 45�46
developing countries, 47Eastern Europe, 50East/West Germany, 61First World countries, 53GDP and, 46, 262�63, 265income levels and, 78
Telescicom, 232Terrestrial broadcasting, 35Time division duplex (TDD)
transmission, 139�40DECT, 168�69defined, 139transmission efficiency
advantages, 139Time division multiple access
(TDMA), 8, 122�24, 335advantages, 124bandwidth flexibility, 149�50burst structure, 123capacity, 142CDMA debate with, 141�52cells, 149cluster size, 144cost, 149DCA, 144�45defined, 120
400 Introduction to Wireless Local Loop
frequency planning, 148illustrated, 120inefficiencies, 123ISI and, 123operation in unlicensed
bands, 148range, 146�47sectorization, 147, 335, 336system overhead, 123technologies, 194�96use of, 124user access, 123See also Multiple access
Total access communications system(TACS), 180�81
channels, 181comparison, 191defined, 180frequency, 180parameters, 181problems, 181See also Cellular systems
Trading, 285�86advantages/disadvantages, 285�86application of, 283defined, 282goals, 285transitional steps, 285See also Radio spectrum allocation/
assignmentTraffic matrix, 362�63Traffic routing, 352�53
calculating, 353case study, 362�63distribution, 353factors, 352�53illustrated, 352
Tree-and-branch architecture, 32Twisted-pair copper, 11�12
access via, 25�32as convergence factor, 13
technology summary, 31
U
United Kingdom, 53British Telecom, 58, 59competition, 56ISDN, 56liberalization, 53, 58marketplace, 57�60market share predictions, 60Oftel, 59RPI x-regime, 59WLL operator licensing, 58See also First World countries
Universal ADSL (U-ADSL), 30Universal Mobile
Telecommunications System(UMTS), 187�90
broadband mode within, 205cells, 188characteristics, 188chipsets, 190comparison, 191defined, 187features, 187�88timescale, 188See also Cellular systems
Universal service obligation(USO), 271�72
User demand, changing, 369�72
V
V5.1 protocol, 344V5.2 interface, 249�52, 344
defined, 249link sets, 251protocol flow, 250
Index 401
V5.2 interface (continued)See also CdmaOne; Wireless access
module (WAM)Vendor selection, 355Very high-rate digital subscriber line
(VDSL), 27, 29Video on demand (VoD), 12, 367Videophone, as service offering
component, 293�94Viterbi decoder, 115Voiceband modems, 25�26
advantages/disadvantages, 26defined, 25standards, 25summary, 26
W
Walsh codes, 133Wavefronts, 98Wideband channels, 100�101WiLL. See Wireless local loop (WLL)Wired access, costs, 68�71Wireless access
advantages, 61beginning of, 60boost to, 60�61
Wireless access module(WAM), 252�53
capacity, 252components, 248, 252defined, 248, 252interconnection, 249�52interworking unit (IWU), 253transponder (XCDR), 253V5.2 interface, 249�52wireless system controller
(WiSC), 252See also CdmaOne
Wireless Information Networks, 88
Wireless LAN systems, 229�30Wireless local loop (WLL)
access via, 37�38advances, 366�67advantages, 4, 57broadband, 19, 38costs, 71�74coverage, 103�5defined, 3, 7developments from 1950
to 1990, 62�63disadvantages, 57equipment, 273as fixed-loop telephony
replacement, 300frequencies, 101�3future, 372�73as generic category, 7growth of, 62history of, 60�64maintenance costs, 73market predictions, 372narrowband, 18, 38radio spectrum for, 267�73reasons for book on, 5�6role of, 3�4spectrum management and, 287standards and, 5through-life costs, 73See also WLL markets; WLL
systemsWireless transparency, 292WLL markets, 81�86
equipment sales, 82, 85financing and, 83, 85forecasts, 75�78future changes, 84�86introduction to, 81pricing information and, 85regulatory environments and, 86See also Wireless local loop (WLL)
402 Introduction to Wireless Local Loop
WLL systemsbroadband, 205�36capacity comparison, 240cellular, 156, 179�91cordless, 156, 165�77cost comparison, 241�42functionality comparison, 242, 243grade of service (GOS), 353�54impact on USO, 271�72measurements of, 211network schematic, 329proprietary
narrowband, 156, 193�203
X
xDSL, 17, 27�32, 367ADSL, 27, 28, 29, 30advantages/disadvantages, 31defined, 27HDSL, 27, 28implementation, 29modems, 29problem, 30required modifications for, 30success, 367VDSL, 27, 29
Index 403


