
Introduction to Supply Chain Management - …campus360.iift.ac.in/Secured/Resource/108/II/MST...
34
Introduction to Supply Chain Management Dr. Nitin Seth Associate Professor, IIFT, New Delhi CHANGES TO WORLD ECONOMY • Globalization • Accelerated Pace of Change • Transition to Market Driven • Rapid Growth of Knowledge based service sector • Change in demographic profile
Transcript of Introduction to Supply Chain Management - …campus360.iift.ac.in/Secured/Resource/108/II/MST...

Introduction to Supply Chain Management
Dr. Nitin Seth
Associate Professor,
IIFT, New Delhi
CHANGES TO WORLD ECONOMY
• Globalization
• Accelerated Pace of Change
• Transition to Market Driven
• Rapid Growth of Knowledge based service sector
• Change in demographic profile

What is Operations Management?
What is Operations Management?Management of day-to-day activities of a company
Commonly, Operations is separated into two broad groups:– Production Ops: manufactured goods
– Service Ops: immaterial; transfer of information, non-substantive
Production OperationsExamples of industries involved in Production Ops:• Autos/Airlines• Computer chips• Print• Electronics• Furniture
Examples of jobs in Production Ops:• Plant management• Materials planning• Supply chain• Logistics• Process improvement• Consulting
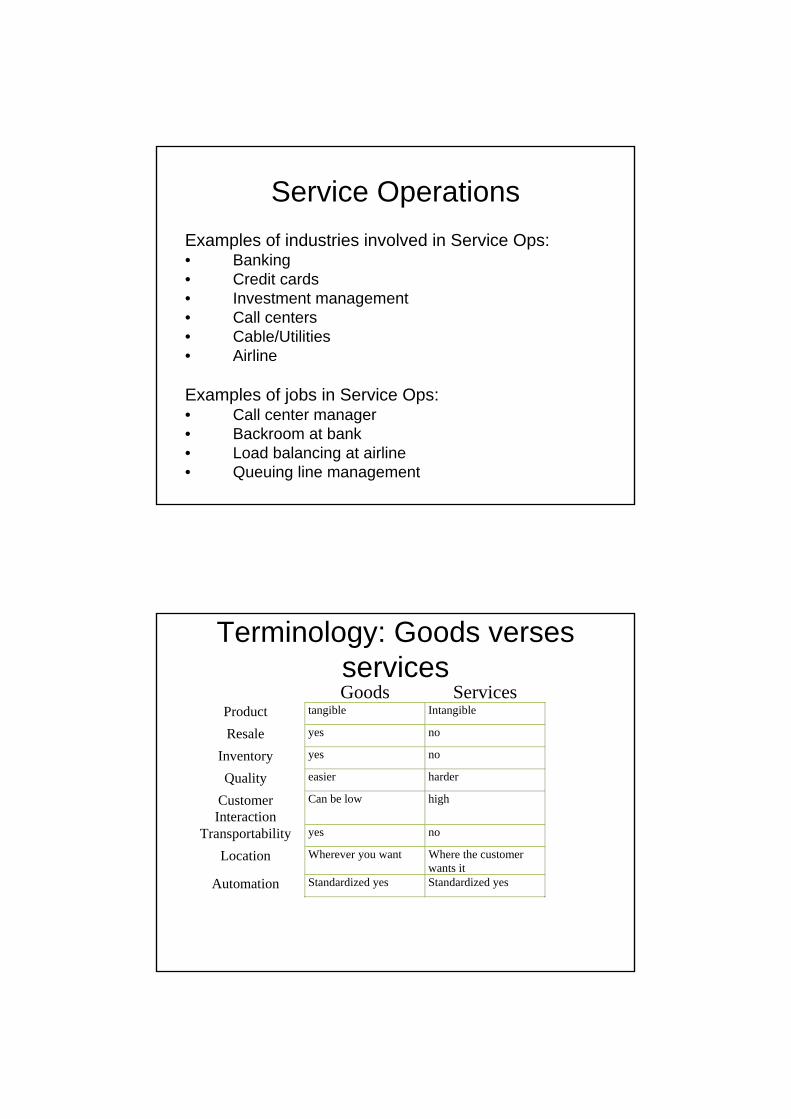
Service Operations
Examples of industries involved in Service Ops:• Banking• Credit cards• Investment management• Call centers• Cable/Utilities• Airline
Examples of jobs in Service Ops:• Call center manager• Backroom at bank• Load balancing at airline• Queuing line management
Terminology: Goods verses services
Goods Services Product tangible Intangible
Resale yes no
Inventory yes no
Quality easier harder
Customer Interaction
Can be low high
Transportability yes no
Location Wherever you want Where the customer wants it
Automation Standardized yes Standardized yes

Manufacturing and Service Operations
• Manufacturing organization = produces physical goods
• Service organization = produces non-physical outputs that require customer involvement and cannot be stored in inventory.
A Supply Chain
Suppliers CustomersOperations
Logistics Logistics
Information Information
Supply Chain Model

THE SUPPLY CHAIN
Supply chain is network of various business entities and processes linking Suppliers, Operations and Customers
Suppliers Operations Customers
Objective is to optimize the over all performance of the entire network
Need For Managing Supply Chain
• Gaining competitiveness
• Pressures from Privatization & Globalization
• Changing customer demands
• Knowledgeable Customers
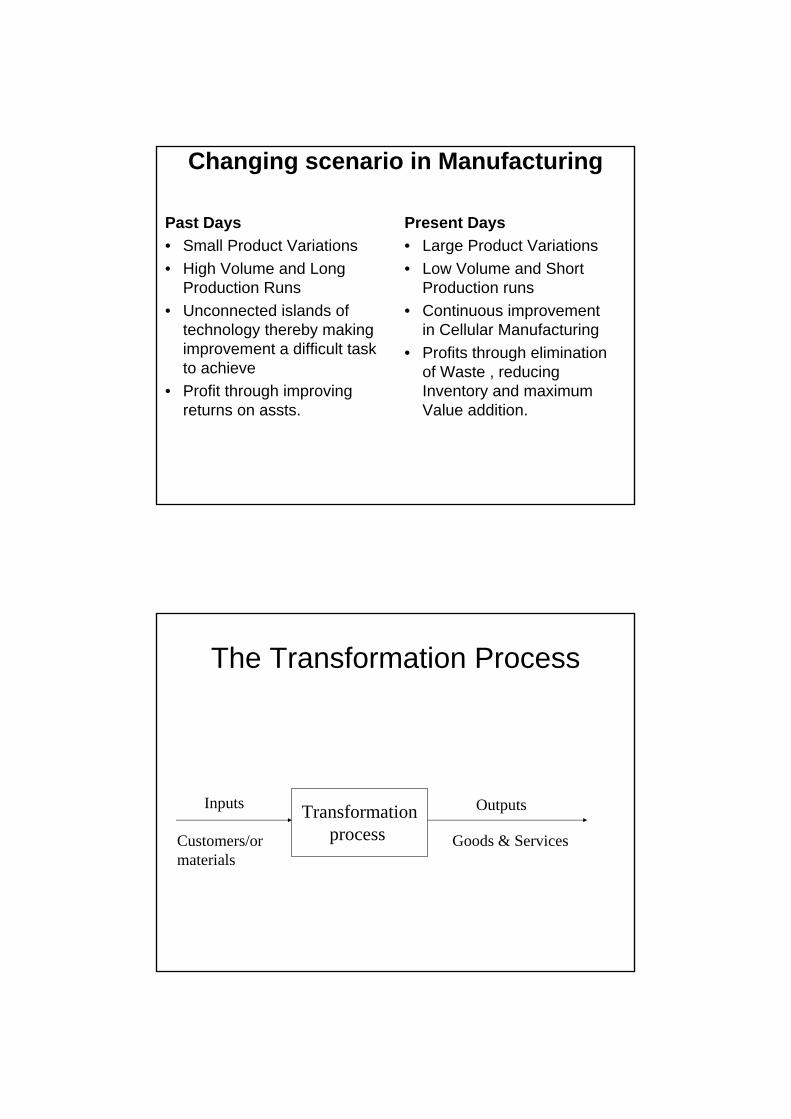
Changing scenario in Manufacturing
Past Days
• Small Product Variations
• High Volume and Long Production Runs
• Unconnected islands of technology thereby making improvement a difficult task to achieve
• Profit through improving returns on assts.
Present Days
• Large Product Variations
• Low Volume and Short Production runs
• Continuous improvement in Cellular Manufacturing
• Profits through elimination of Waste , reducing Inventory and maximum Value addition.
The Transformation Process
Inputs
Customers/or materials
Transformation
Process
Transformation process
Outputs
Goods & Services
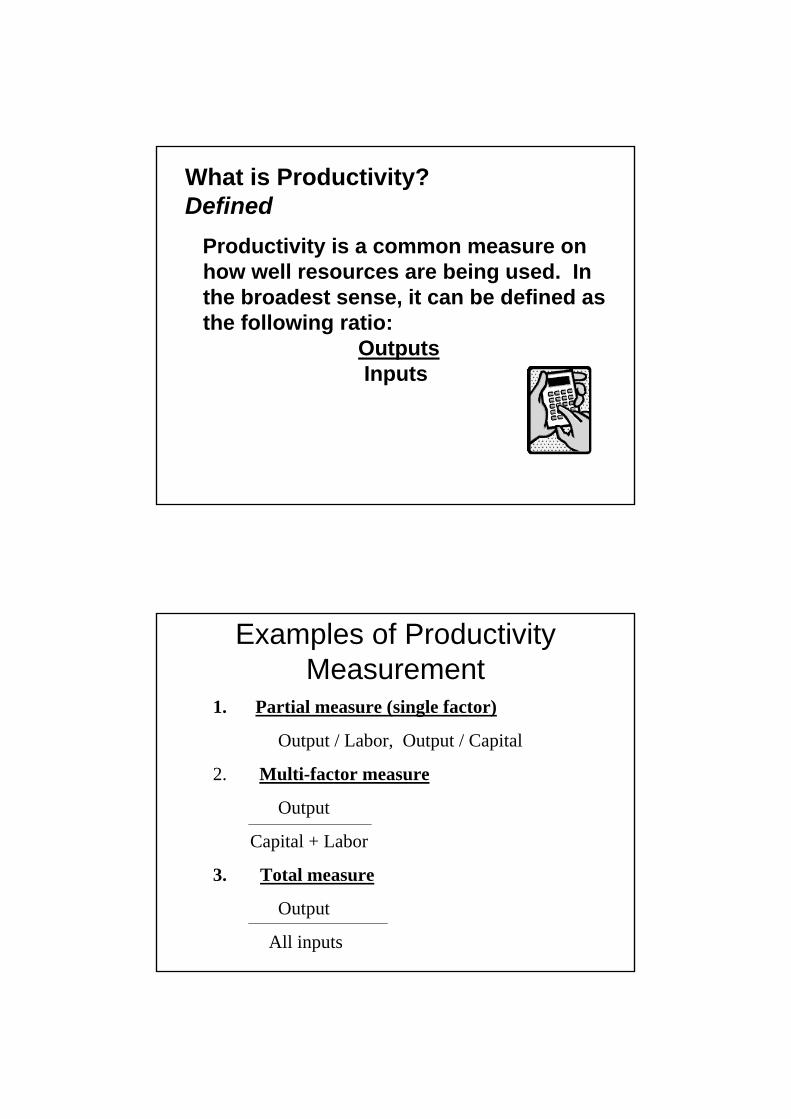
What is Productivity?Defined
Productivity is a common measure on how well resources are being used. In the broadest sense, it can be defined as the following ratio:
OutputsInputs
Examples of Productivity Measurement
1. Partial measure (single factor)
Output / Labor, Output / Capital
2. Multi-factor measure
Output
Capital + Labor
3. Total measure
Output
All inputs

Examples of Partial Measures
Business Measure
Restaurant……………..Customers / labor hour
Retail Store…………….Sales / square foot
Chicken Farm…………..lb. Of meat / lb of feed
Utility Plant…………….Kw / ton of coal
Paper Mill………………tons of paper / cord of wood
Types of Decisions
1. Strategic or long-range decisions
2. Tactical or medium- range decisions
3. Operational planning and control or short-range decisions

Facilities Location• Critical Decision – long lasting impact on
financial, employment and distribution patterns.
• Factors affecting Location Decision-– Capital –Banking facilities , loans etc– Raw Material – Availability, suppliers– Labor – supply , skills , costs– Competition –– Economic aspects – Wages to staff, taxes profits– Non economic impacts- Ecological , environmental and
social.– Political Considerations
Facility Location
• Cost/benefit analysis for each location
• Sophisticated techniques can help
- Linear programming
- Payoff matrix
- Decision tree analysis.

Plant Location
Many factors may be employed for determining the proper location. Some of them are:
Nearness to ultimate consumers Nearness to suppliers Nearness to raw materials Proximity to major transportation facilities Availability of a trained labor force Room for growth and expansion
Lessons • Managing supply chain is treated as
strategic weapon.
• This era can be referred as a business war between “supply chains and supply chains” not between organizations and organizations

Production systems and supply chain forecasting
Dr. Nitin Seth
Associate Professor,
IIFT, New Delhi
Typical Production Systems
• Mass Production
• Batch Production
• Job Shop Production
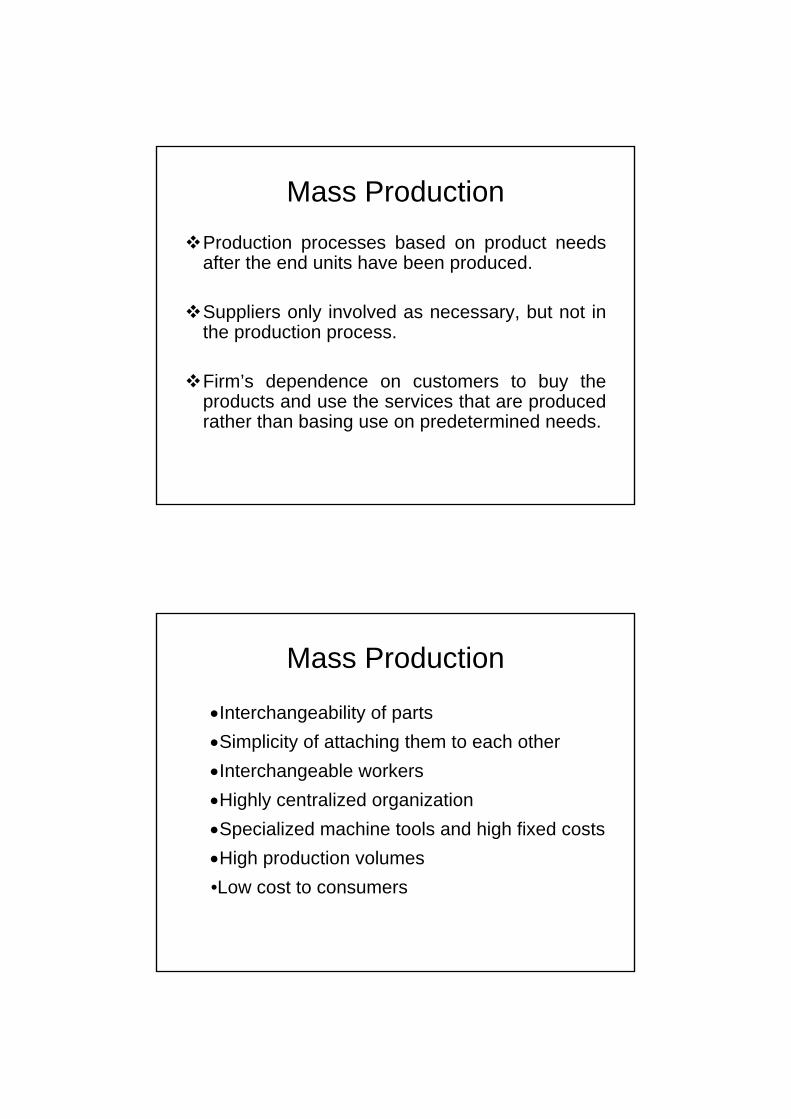
Mass Production
Production processes based on product needs after the end units have been produced.
Suppliers only involved as necessary, but not in the production process.
Firm’s dependence on customers to buy the products and use the services that are produced rather than basing use on predetermined needs.
Mass Production
Interchangeability of parts
Simplicity of attaching them to each other
Interchangeable workers
Highly centralized organization
Specialized machine tools and high fixed costs
High production volumes
•Low cost to consumers
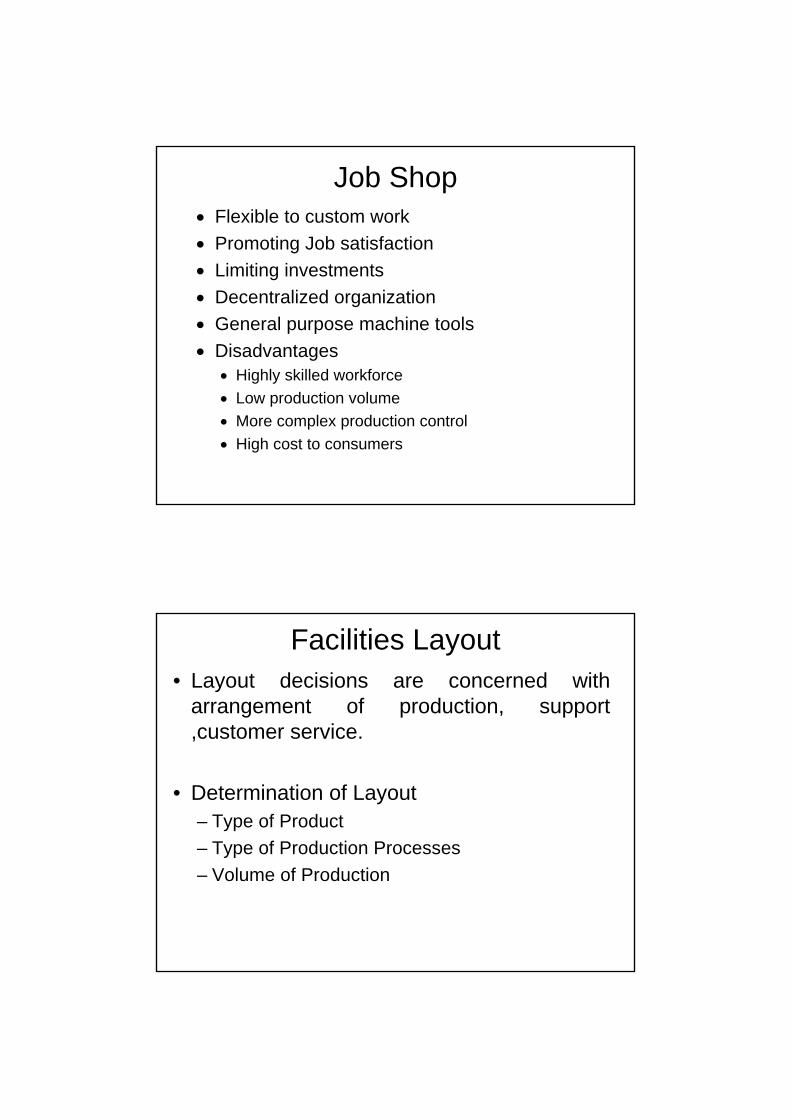
Job Shop Flexible to custom work
Promoting Job satisfaction
Limiting investments
Decentralized organization
General purpose machine tools
Disadvantages Highly skilled workforce
Low production volume
More complex production control
High cost to consumers
Facilities Layout• Layout decisions are concerned with
arrangement of production, support ,customer service.
• Determination of Layout– Type of Product
– Type of Production Processes
– Volume of Production

Types of Facility Layout
1. Process layout
2. Product layout
3. Fixed-position layout
Process Layout
Machines that perform the same function are grouped together in one location.
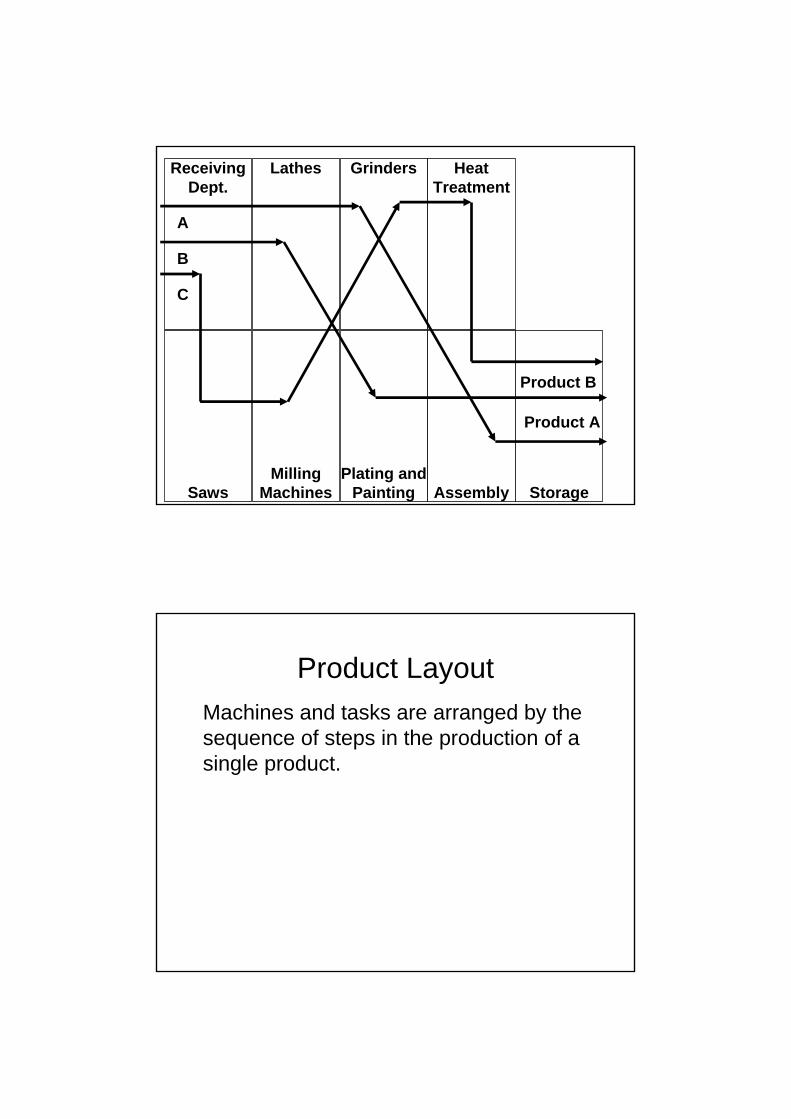
ReceivingDept.
Lathes Grinders HeatTreatment
MillingMachinesSaws
Plating andPainting Assembly Storage
A
Product A
B
C
Product B
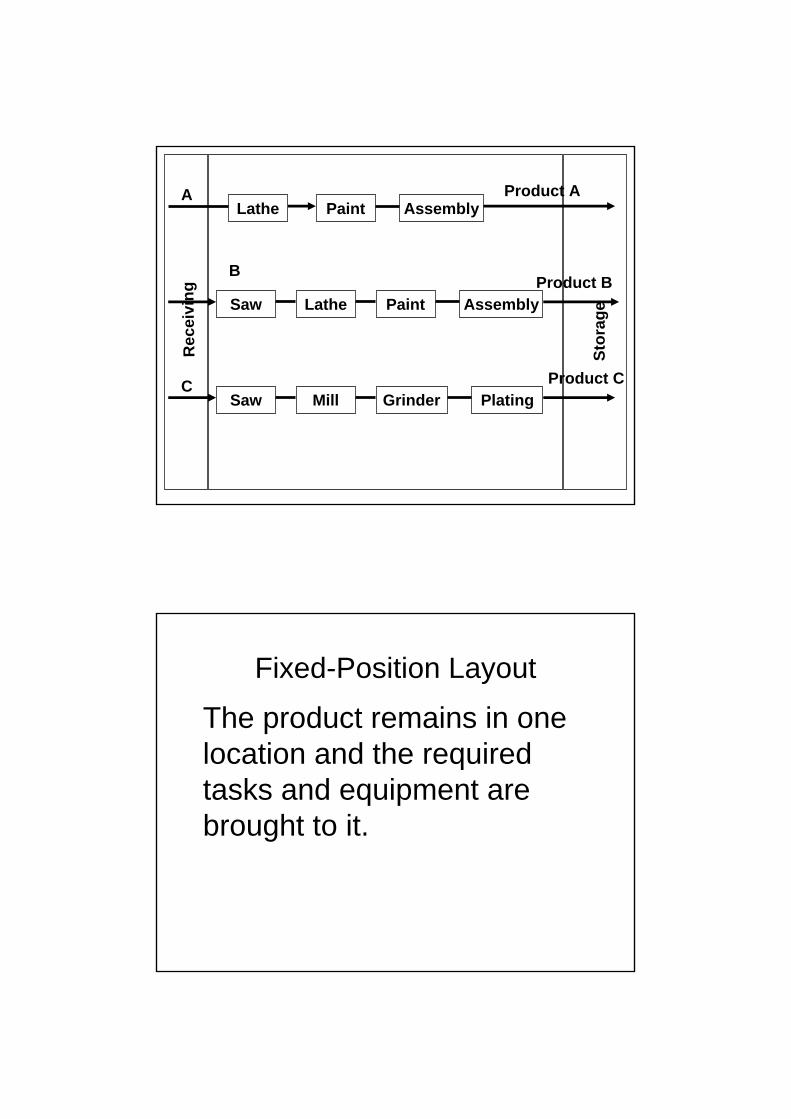
Product Layout
Machines and tasks are arranged by the sequence of steps in the production of a single product.
Re
ceiv
ing
Sto
rag
e
Lathe Paint Assembly
Saw Lathe Paint Assembly
Saw Mill Grinder Plating
A
B
C
Product A
Product B
Product C
Fixed-Position Layout
The product remains in one location and the required tasks and equipment are brought to it.

Ship
Materials
Supplies
Machines
Labor
Equipment
Forecasting … Definition
• Forecasting is the art of predicting the future value of a random variable (i.e., a variable with more than one possible outcome).
Aim of Forecasting
• In short, forecasting aims to predict the future values of a random variable as accurately as possible.
• We usually prepare these forecasts using all (or any part of) the relevant information available when the forecast is being prepared.
Other Important Criteria for Evaluating Forecasts
• Forecasts need to be:
• timely;
• cost effective;
• consistent; and,
• comprehensible by decision makers.

Quantitative and Qualitative Forecasting Techniques
Quantitative Techniques
• Statistically based
• Predictions based on observations of historic data
• Extrapolative or Causative
Qualitative Techniques
• Judgemental, subjective
• Predictions based on conjecture about the future
Extrapolative
• Time Series Analysis
Causative
• Regression Techniques
• Expert Opinion and Delphi Techniques
• Scenario Planning and War Gaming
Delphi Technique
– A Delphi Manager is appointed to coordinate and facilitate the creation of a consensus forecast
– The experts provide their opinions anonymously to the Delphi Manager to avoid the social pitfalls of committees
• The manager also provides structured, anonymous feedback such as one expert’s forecast relative to the others, along with any justifications
– The process is repeated with experts either converging towards a consensus view, as they revise their opinions based on the feedback from other experts, or more than one possible outcome is identified
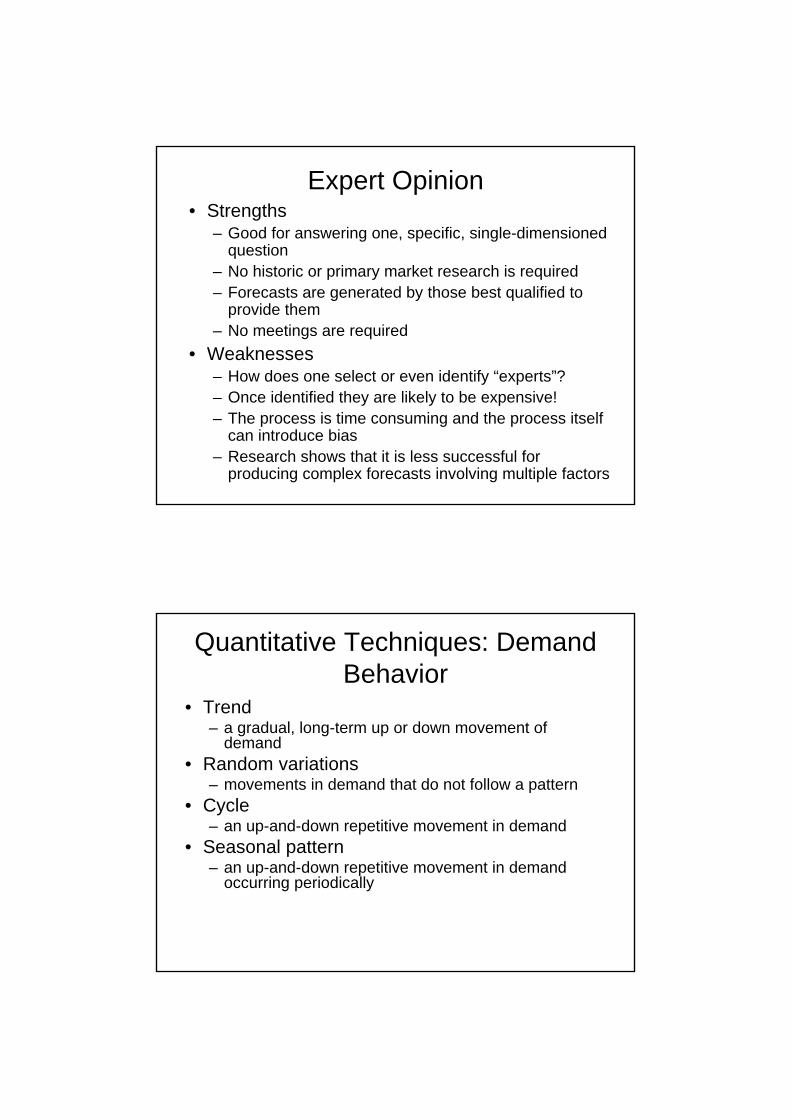
Expert Opinion• Strengths
– Good for answering one, specific, single-dimensioned question
– No historic or primary market research is required– Forecasts are generated by those best qualified to
provide them– No meetings are required
• Weaknesses– How does one select or even identify “experts”?– Once identified they are likely to be expensive!– The process is time consuming and the process itself
can introduce bias– Research shows that it is less successful for
producing complex forecasts involving multiple factors
Quantitative Techniques: Demand Behavior
• Trend– a gradual, long-term up or down movement of
demand• Random variations
– movements in demand that do not follow a pattern• Cycle
– an up-and-down repetitive movement in demand• Seasonal pattern
– an up-and-down repetitive movement in demand occurring periodically

Time(a) Trend
Time(d) Trend with seasonal pattern
Time(c) Seasonal pattern
Time(b) Cycle
Dem
and
Dem
and
Dem
and
Dem
and
Random movement
Forms of Forecast Movement
3-month Simple Moving Average
Jan 120Feb 90Mar 100Apr 75May 110June 50July 75Aug 130Sept 110Oct 90Nov -
ORDERSMONTH PER MONTH
MA3 =
3
i = 1 Di
3
=90 + 110 + 130
3
= 110 ordersfor Nov
–––
103.388.395.078.378.385.0
105.0110.0
MOVING AVERAGE
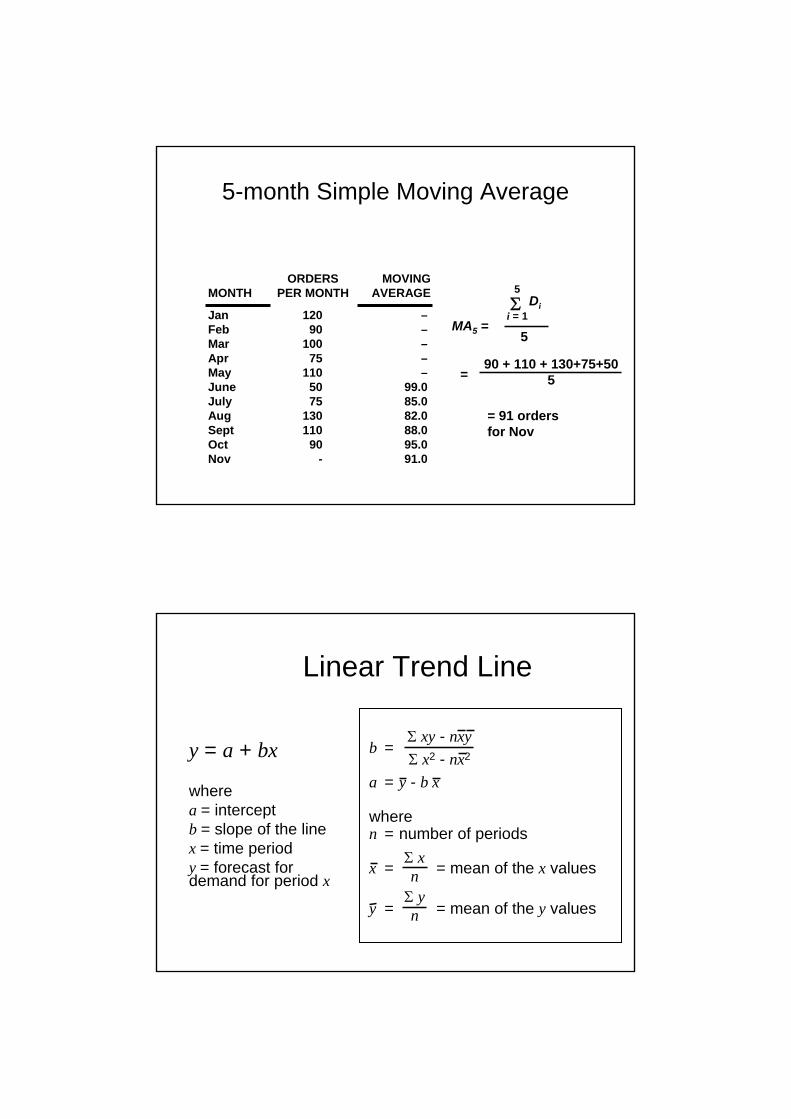
5-month Simple Moving Average
Jan 120Feb 90Mar 100Apr 75May 110June 50July 75Aug 130Sept 110Oct 90Nov -
ORDERSMONTH PER MONTH
MA5 =
5
i = 1 Di
5
=90 + 110 + 130+75+50
5
= 91 ordersfor Nov
–––––
99.085.082.088.095.091.0
MOVING AVERAGE
y = a + bx
wherea = interceptb = slope of the linex = time periody = forecast for demand for period x
Linear Trend Line
b =
a = y - b x
wheren = number of periods
x = = mean of the x values
y = = mean of the y values
xy - nxy
x2 - nx2
xnyn
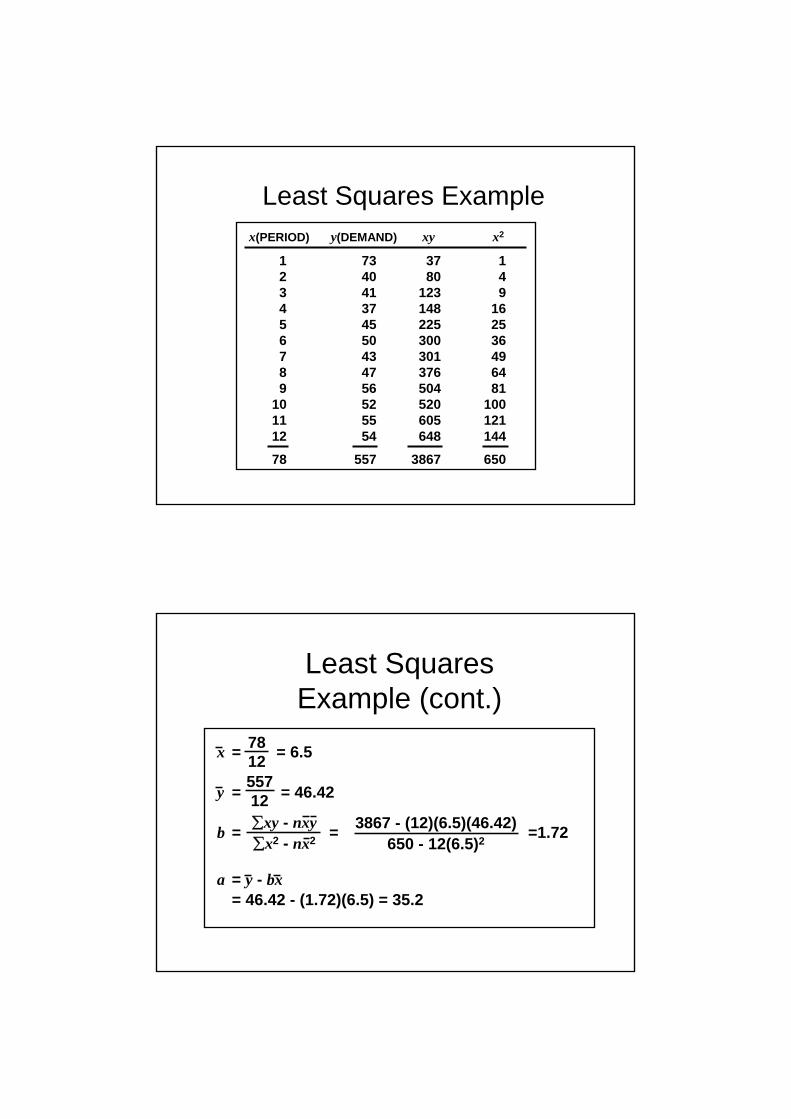
Least Squares Examplex(PERIOD) y(DEMAND) xy x2
1 73 37 12 40 80 43 41 123 94 37 148 165 45 225 256 50 300 367 43 301 498 47 376 649 56 504 81
10 52 520 10011 55 605 12112 54 648 144
78 557 3867 650
x = = 6.5
y = = 46.42
b = = =1.72
a = y - bx= 46.42 - (1.72)(6.5) = 35.2
3867 - (12)(6.5)(46.42)650 - 12(6.5)2
xy - nxyx2 - nx2
781255712
Least Squares Example (cont.)

Linear trend line y = 35.2 + 1.72x
Forecast for period 13 y = 35.2 + 1.72(13) = 57.56 units
70 –
60 –
50 –
40 –
30 –
20 –
10 –
0 –
| | | | | | | | | | | | |1 2 3 4 5 6 7 8 9 10 11 12 13
Actual
Dem
and
Period
Linear trend line
Learning’s• Layout decisions are based on:
• a) Type of product
• b) Type of production systems and
• c) Volume of production.
• Supply chain forecasting helps in efficient and effective utilization of resources.

Aggregate Production Planning
Dr. Nitin Seth
Associate Professor,
IIFT, New Delhi
• Long-range plans– Product and service design
– Location / layout
– Long term capacity
• Intermediate plans (General levels)– Employment
– Output and inventories
– Subcontracting and backorders
• Short-range plans (Detailed plans)– Machine loading
– Job assignments
– Production lot size and order quantities
Overview of Planning Levels
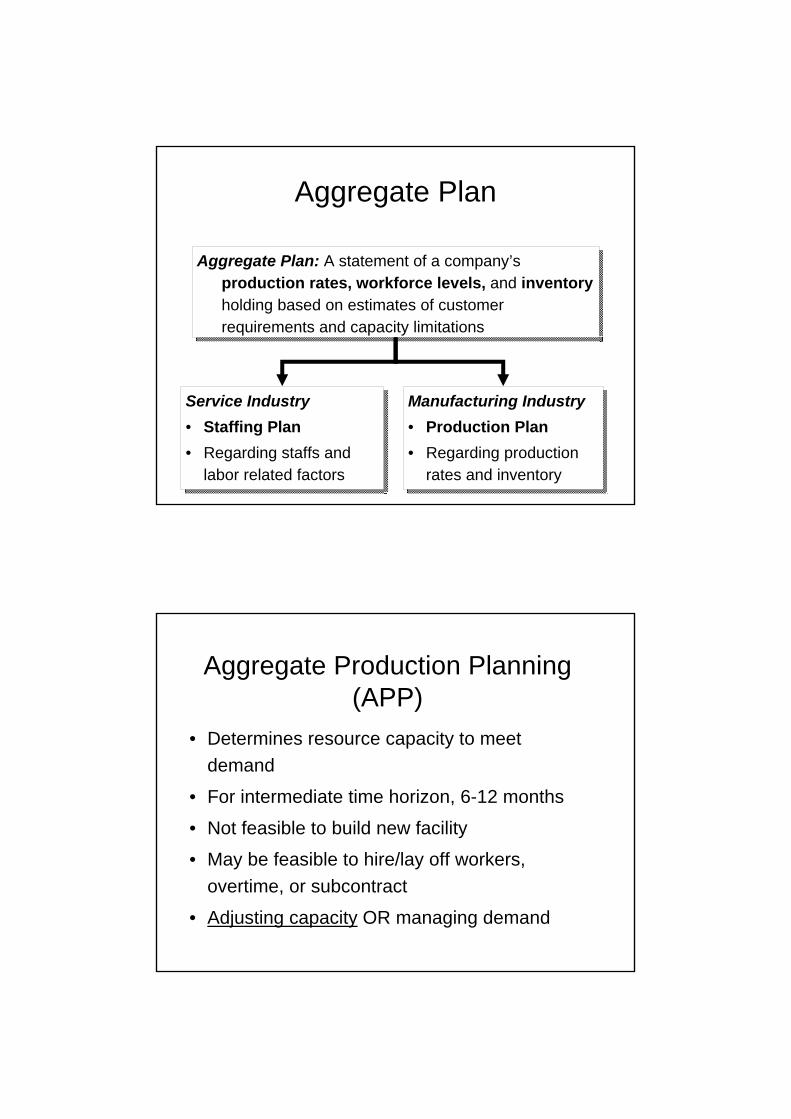
Aggregate Plan
Aggregate Plan: A statement of a company’s production rates, workforce levels, and inventoryholding based on estimates of customer requirements and capacity limitations
Service Industry
• Staffing Plan
• Regarding staffs and labor related factors
Manufacturing Industry
• Production Plan
• Regarding production rates and inventory
Aggregate Production Planning (APP)
• Determines resource capacity to meet
demand
• For intermediate time horizon, 6-12 months
• Not feasible to build new facility
• May be feasible to hire/lay off workers,
overtime, or subcontract
• Adjusting capacity OR managing demand

Aggregate Plan – Managerial Inputs
Supplier capabilities Storage capacity Materials availability
Materials
Current machine capacities Plans for future capacities Workforce capacities Current staffing level
Operations
New products Product design changes Machine standards
EngineeringLabor-market conditions Training capacity
Human resources
Cost data Financial condition of firm
Accounting and financeAggregate
plan
Customer needs Demand forecasts Competition behavior
Distribution and marketing
Aggregate Plan – Outputs
Units or dollars
subcontracted
Size ofWorkforce and
Workforce Adjustment
Productionper month
(in units or $)
InventoryLevels
Aggregate plan
Units or dollarsOf Backlogs,
backorders , or stockout
Reactive Alternatives
ComplementaryProducts
Competitive Pricing
Aggressive Alternatives

Aggregate Planning Strategies• Proactive
– Alter demand to match capacity
• Reactive
– Alter capacity to match demand
• Mixed
– Some of eachBalancing demand and capacity over the entire planning horizon
• Pricing
• Promotion
• Back orders
• New demand
Demand Options
• Hire and layoff workers
• Overtime/slack time
• Part-time workers
• Inventories
• Subcontracting
Capacity Options
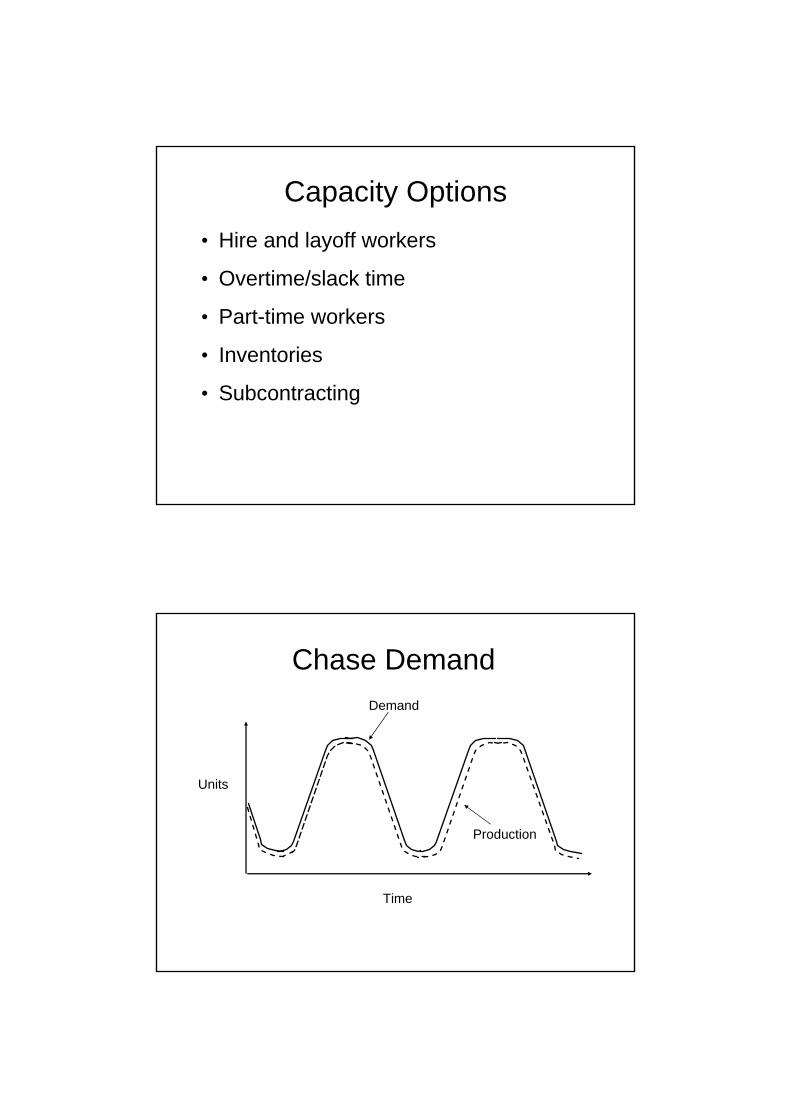
Chase Demand
Time
Units
Production
Demand
Chase Approach
• Advantages
– Investment in inventory is low
– Labor utilization in high (overtime)
• Disadvantages
– The cost of adjusting output rates and/or workforce levels
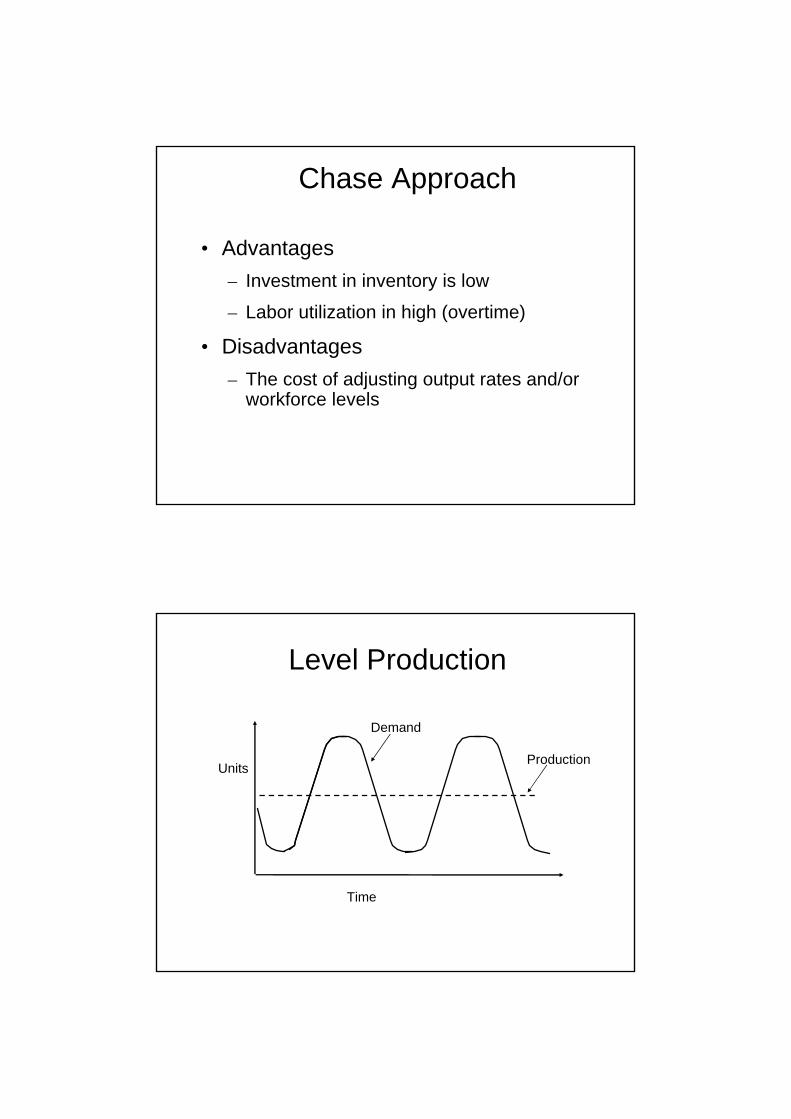
Level Production
Time
Production
Demand
Units
Level Approach
• Advantages
– Stable output rates and workforce
• Disadvantages
– Greater inventory costs
– Increased overtime and idle time
– Resource utilizations vary over time
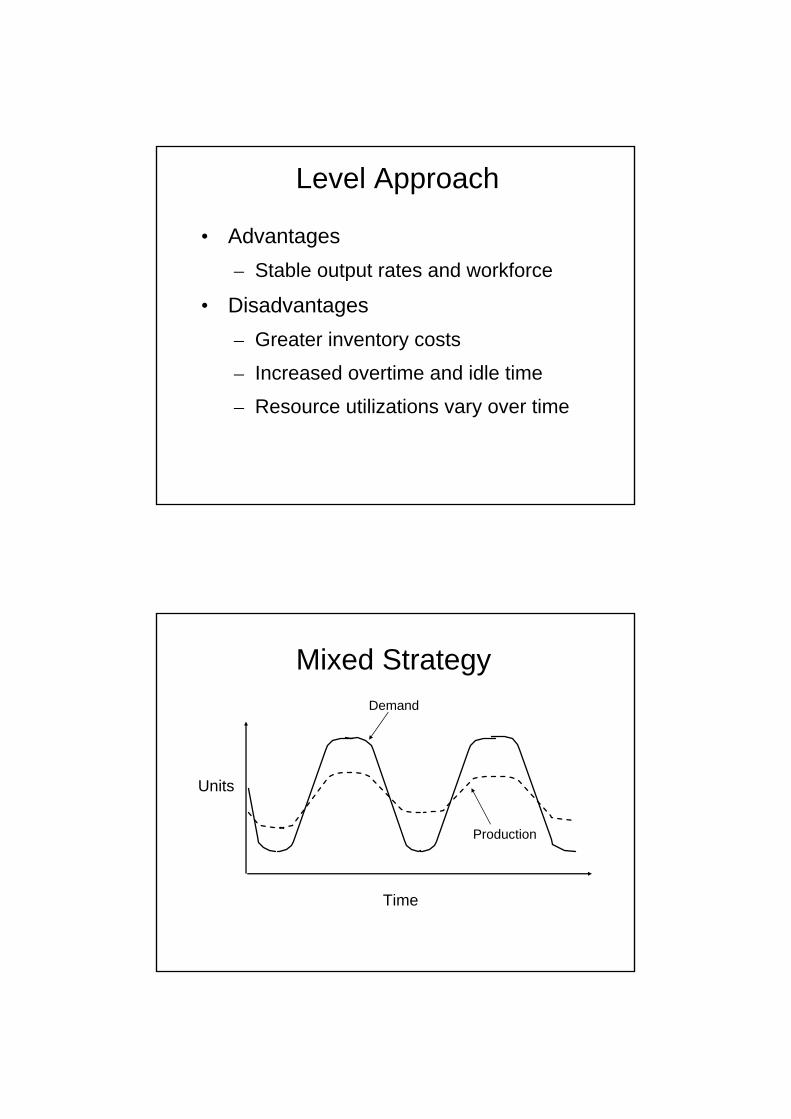
Mixed Strategy
Time
Units
Production
Demand

Aggregate Planning Strategies
Possible Alternatives Possible AlternativesStrategy during Slack Season during Peak Season
1. Chase #1: vary workforce Layoffs Hiringlevel to match demand
2. Chase #2: vary output Layoffs, undertime, Hiring, overtime,rate to match demand vacations subcontracting
3. Level #1: constant No layoffs, building No hiring, depletingworkforce level anticipation inventory, anticipation inventory,
undertime, vacations overtime, subcontracting,backorders, stockouts
4. Level #2: constant Layoffs, building antici- Hiring, depleting antici-output rate pation inventory, pation inventory, over-
undertime, vacations time, subcontracting,backorders, stockouts
Aggregate Plan to Master Schedule
AggregatePlanning
Disaggregation
MasterSchedule

Disaggregating the Aggregate Plan
• Master schedule: The result of
disaggregating an aggregate plan; shows
quantity and timing of specific end items for a
scheduled horizon.
• Rough-cut capacity planning: Approximate
balancing of capacity and demand to test the
feasibility of a master schedule.
Disaggregating the Aggregate Plan

Lessons
• Aggregate production planning is a powerful tool for resources management
• Suitable aggregate production planning strategy for an organization depends on various organizational and environmental factors
Thank You


![[PPT]MANAGEMENT: A GLOBAL PERSPECTIVE …campus360.iift.ac.in/Secured/Resource/118/I/MGT 01... · Web viewMANAGEMENT: A GLOBAL AND ENTREPRENEURIAL PERSPECTIVE by Weihrich, Cannice,](https://static.fdocuments.us/doc/165x107/5b2fa0ba7f8b9a55208d0eac/pptmanagement-a-global-perspective-01-web-viewmanagement-a-global-and.jpg)


