Introduction to Statistical Methods for Clinical Trials · Introduction to Statistical Methods for...
29
Introduction to Statistical Methods for Clinical Trials Amy Liu Systematic reviews Statistical methods for meta-analysis Example 29-1 Introduction to Statistical Methods for Clinical Trials Amy Liu Cancer Care Ontario [email protected] November 13, 2014
Transcript of Introduction to Statistical Methods for Clinical Trials · Introduction to Statistical Methods for...

Introduction toStatistical
Methods forClinical Trials
Amy Liu
Systematicreviews
Statisticalmethods formeta-analysis
Example
29-1
Introduction to Statistical Methods forClinical Trials
Amy Liu
Cancer Care Ontario
November 13, 2014

Introduction toStatistical
Methods forClinical Trials
Amy Liu
Systematicreviews
Statisticalmethods formeta-analysis
Example
29-2
Meta-analysis of trial evidence
Introduction toStatistical
Methods forClinical Trials
Amy Liu
Systematicreviews
Statisticalmethods formeta-analysis
Example
29-3
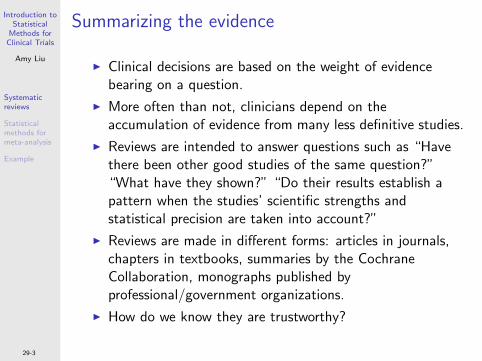
Summarizing the evidence
I Clinical decisions are based on the weight of evidencebearing on a question.
I More often than not, clinicians depend on theaccumulation of evidence from many less definitive studies.
I Reviews are intended to answer questions such as “Havethere been other good studies of the same question?”“What have they shown?” “Do their results establish apattern when the studies’ scientific strengths andstatistical precision are taken into account?”
I Reviews are made in different forms: articles in journals,chapters in textbooks, summaries by the CochraneCollaboration, monographs published byprofessional/government organizations.
I How do we know they are trustworthy?

Introduction toStatistical
Methods forClinical Trials
Amy Liu
Systematicreviews
Statisticalmethods formeta-analysis
Example
29-4
Narrative reviews
I An expert in the field summarizes evidence and makesrecommendations.
I Advantage: they address broad-gauged topics, e.g.management of the small renal masses, on a wide range ofissues.
I Disadvantage: recommendations/evidence may becoloured by value judgements that are not made explicit.
Introduction toStatistical
Methods forClinical Trials
Amy Liu
Systematicreviews
Statisticalmethods formeta-analysis
Example
29-5
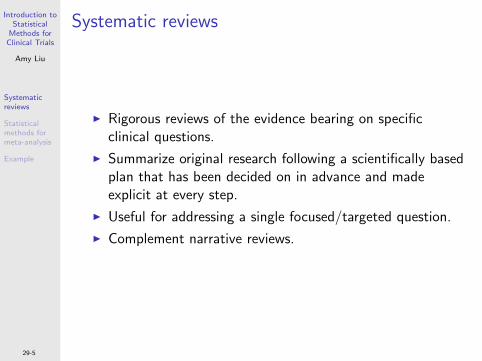
Systematic reviews
I Rigorous reviews of the evidence bearing on specificclinical questions.
I Summarize original research following a scientifically basedplan that has been decided on in advance and madeexplicit at every step.
I Useful for addressing a single focused/targeted question.
I Complement narrative reviews.

Introduction toStatistical
Methods forClinical Trials
Amy Liu
Systematicreviews
Statisticalmethods formeta-analysis
Example
29-6
How to perform a systematic review?

Introduction toStatistical
Methods forClinical Trials
Amy Liu
Systematicreviews
Statisticalmethods formeta-analysis
Example
29-7
Are published studies a biased sample of allcompleted research?
I Articles cited in a systematic review should include allscientifically strong studies of the questions, regardless ofwhether they have been published.
I In general, published studies are more likely to find aneffect for several reasons.
I Funnel plots are a graphical way of detecting bias in theselection of studies.

Introduction toStatistical
Methods forClinical Trials
Amy Liu
Systematicreviews
Statisticalmethods formeta-analysis
Example
29-8
Funnel plots to identify publication bias
Generated from 35 simulated studies (top) and same data with five missing studies showing a typicalmanifestation of publication bias (bottom), from http://dx.doi.org/10.1136/bmj.320.7249.1574

Introduction toStatistical
Methods forClinical Trials
Amy Liu
Systematicreviews
Statisticalmethods formeta-analysis
Example
29-9
Meta-analysis
I Authors of a systematic review ask a specific clinicalquestion, perform a comprehensive literature search,eliminate the poorly done studies and attempt to makepractice recommendations based on the well-done studies.
I A meta-analysis is a systematic review that combines theresults of all the studies into a single statistical analysis ofresults.
I Pooling of the results must always be preceded by asystematic review (as opposed to a narrative review).
I Any meta-analysis is ultimately limited by the quality ofthe original studies (GIGO: garbage in, garbage out).

Introduction toStatistical
Methods forClinical Trials
Amy Liu
Systematicreviews
Statisticalmethods formeta-analysis
Example
29-10
Forest plot (first use in meta-analysis)

Introduction toStatistical
Methods forClinical Trials
Amy Liu
Systematicreviews
Statisticalmethods formeta-analysis
Example
29-11
Forest plot (modern)

Introduction toStatistical
Methods forClinical Trials
Amy Liu
Systematicreviews
Statisticalmethods formeta-analysis
Example
29-12
Forest plot elements (binary outcomes)
Introduction toStatistical
Methods forClinical Trials
Amy Liu
Systematicreviews
Statisticalmethods formeta-analysis
Example
29-13
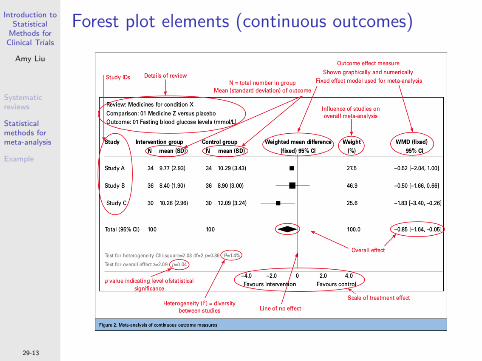
Forest plot elements (continuous outcomes)
Introduction toStatistical
Methods forClinical Trials
Amy Liu
Systematicreviews
Statisticalmethods formeta-analysis
Example
29-14
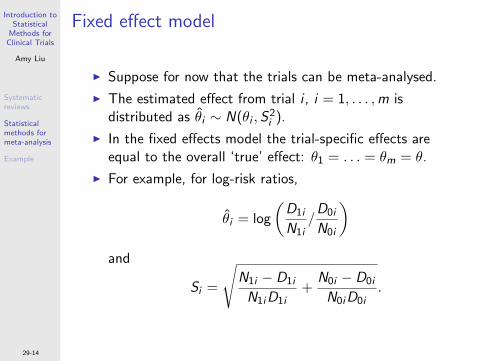
Fixed effect model
I Suppose for now that the trials can be meta-analysed.
I The estimated effect from trial i , i = 1, . . . ,m isdistributed as θ̂i ∼ N(θi ,S
2i ).
I In the fixed effects model the trial-specific effects areequal to the overall ‘true’ effect: θ1 = . . . = θm = θ.
I For example, for log-risk ratios,
θ̂i = log
(D1i
N1i/D0i
N0i
)and
Si =
√N1i − D1i
N1iD1i+
N0i − D0i
N0iD0i.

Introduction toStatistical
Methods forClinical Trials
Amy Liu
Systematicreviews
Statisticalmethods formeta-analysis
Example
29-15
Combining the results
I The overall point estimate must be a weighted average ofthe trial-specific estimates:
θ̂ =
∑mi=1 wi θ̂i∑mi=1 wi
.
I How to choose the weights?
I Obviously, these have to somehow reflect the sizes of theoriginal trials.
Introduction toStatistical
Methods forClinical Trials
Amy Liu
Systematicreviews
Statisticalmethods formeta-analysis
Example
29-16
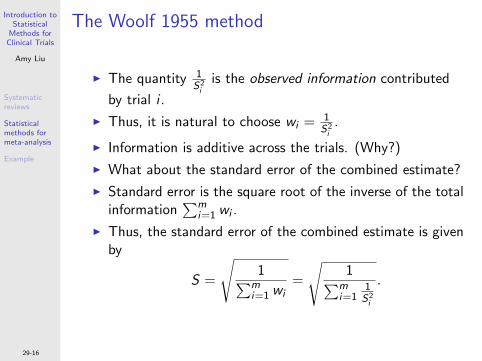
The Woolf 1955 method
I The quantity 1S2i
is the observed information contributed
by trial i .
I Thus, it is natural to choose wi = 1S2i
.
I Information is additive across the trials. (Why?)
I What about the standard error of the combined estimate?
I Standard error is the square root of the inverse of the totalinformation
∑mi=1 wi .
I Thus, the standard error of the combined estimate is givenby
S =
√1∑m
i=1 wi=
√1∑m
i=11S2i
.
Introduction toStatistical
Methods forClinical Trials
Amy Liu
Systematicreviews
Statisticalmethods formeta-analysis
Example
29-17
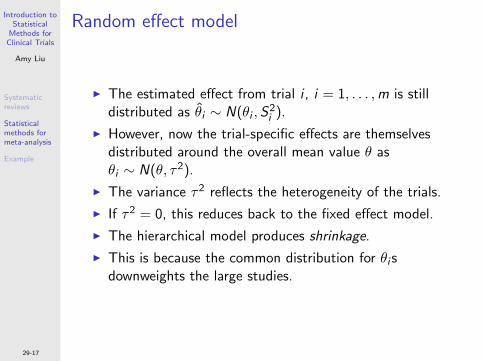
Random effect model
I The estimated effect from trial i , i = 1, . . . ,m is stilldistributed as θ̂i ∼ N(θi ,S
2i ).
I However, now the trial-specific effects are themselvesdistributed around the overall mean value θ asθi ∼ N(θ, τ2).
I The variance τ2 reflects the heterogeneity of the trials.
I If τ2 = 0, this reduces back to the fixed effect model.
I The hierarchical model produces shrinkage.
I This is because the common distribution for θi sdownweights the large studies.
Introduction toStatistical
Methods forClinical Trials
Amy Liu
Systematicreviews
Statisticalmethods formeta-analysis
Example
29-18
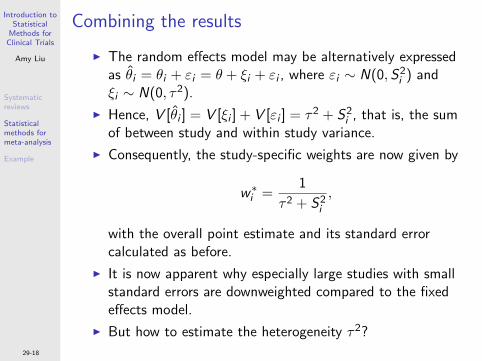
Combining the results
I The random effects model may be alternatively expressedas θ̂i = θi + εi = θ + ξi + εi , where εi ∼ N(0,S2
i ) andξi ∼ N(0, τ2).
I Hence, V [θ̂i ] = V [ξi ] + V [εi ] = τ2 + S2i , that is, the sum
of between study and within study variance.
I Consequently, the study-specific weights are now given by
w∗i =
1
τ2 + S2i
,
with the overall point estimate and its standard errorcalculated as before.
I It is now apparent why especially large studies with smallstandard errors are downweighted compared to the fixedeffects model.
I But how to estimate the heterogeneity τ2?

Introduction toStatistical
Methods forClinical Trials
Amy Liu
Systematicreviews
Statisticalmethods formeta-analysis
Example
29-19
Estimating the heterogeneity
I The total variability of the trial-specific estimates ismeasured by the Q-statistic
Q =m∑i=1
wi (θ̂i − θ̂)2,
where again wi = 1S2i
and θ̂ =∑m
i=1 wi θ̂i∑mi=1 wi
.
I Under the null of no heterogeneity, this has thedistribution Q ∼ χ2
m−1. (Why?)
I This provides a statistical test for the presence ofheterogeneity.
I The expectation m − 1 of the null distributioncharacterises the variance in the absence of heterogeneity.

Introduction toStatistical
Methods forClinical Trials
Amy Liu
Systematicreviews
Statisticalmethods formeta-analysis
Example
29-20
Estimating the heterogeneity (cont.)
I Consequently, the additional variance component due toheterogeneity may be estimated as
τ̂2 =Q − (m − 1)∑mi=1 wi −
∑mi=1 w
2i∑m
i=1 wi
,
where the denominator is a scaling factor, seehttp://en.wikipedia.org/wiki/Weighted_
arithmetic_mean#Weighted_sample_variance
I Another widely used measure of heterogeneity is
I 2 =Q − (m − 1)
Q,
which may be interpreted as the proportion of the totalvariance due to heterogeneity. According to a rule ofthumb, values of around 25%, 50% and 75% correspondto ‘low’, ‘moderate’ and ‘large’ heterogeneity, respectively.
Introduction toStatistical
Methods forClinical Trials
Amy Liu
Systematicreviews
Statisticalmethods formeta-analysis
Example
29-21
Which model to use?
I Using the fixed effects model in the presence ofheterogeneity will underestimate uncertainty.
I Reasons for heterogeneity:I Different inclusion criteria for patients in the trials.I Different outcomes (say, different definition of
progression-free survival in cancer patients).I Different reported statistics (cf. rate ratio, odds ratio, risk
ratio).I Intervention itself or the placebo are not exactly the same
between the trials.
I Can such factors be characterized as random noise?
I It may be that the trials just do not have a commonparameter, such as screening trials with different screeningregimens and/or follow-up periods.
I Should they be meta-analysed regardless?
Introduction toStatistical
Methods forClinical Trials
Amy Liu
Systematicreviews
Statisticalmethods formeta-analysis
Example
29-22
How to assess systematic heterogeneity?
I Suppose we have a covariate Xi that we suspect to be aneffect modifier or other source of systematic variationbetween the studies.
I In the model θ̂i = θi + εi , we could parametrizeθi = α + βXi to get the meta-regression model
θ̂i = α + βXi + εi .
I Here εi ∼ N(0, S2i ), so the model can not be fitted using
standard linear regression procedures. (Why?)
I If β = 0, then α = θ, the overall fixed effect.
I If β 6= 0, there may be systematic heterogeneity, and itwould be questionable to try to summarize the treatmenteffect with a single number.
I However, this kind of analysis has limited power if thenumber of studies m is small, so meta-regression shouldnot be exploratory.

Introduction toStatistical
Methods forClinical Trials
Amy Liu
Systematicreviews
Statisticalmethods formeta-analysis
Example
29-23
Forest plot
Introduction toStatistical
Methods forClinical Trials
Amy Liu
Systematicreviews
Statisticalmethods formeta-analysis
Example
29-24
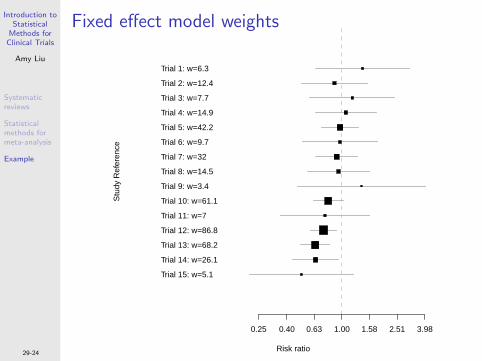
Fixed effect model weights
Risk ratio
Stu
dy R
efer
ence
0.25 0.40 0.63 1.00 1.58 2.51 3.98
Trial 1: w=6.3
Trial 2: w=12.4
Trial 3: w=7.7
Trial 4: w=14.9
Trial 5: w=42.2
Trial 6: w=9.7
Trial 7: w=32
Trial 8: w=14.5
Trial 9: w=3.4
Trial 10: w=61.1
Trial 11: w=7
Trial 12: w=86.8
Trial 13: w=68.2
Trial 14: w=26.1
Trial 15: w=5.1

Introduction toStatistical
Methods forClinical Trials
Amy Liu
Systematicreviews
Statisticalmethods formeta-analysis
Example
29-25
Fixed effect model summary estimate
Risk ratio
Stu
dy R
efer
ence
0.25 0.40 0.63 1.00 1.58 2.51 3.98
Trial 1: w=6.3
Trial 2: w=12.4
Trial 3: w=7.7
Trial 4: w=14.9
Trial 5: w=42.2
Trial 6: w=9.7
Trial 7: w=32
Trial 8: w=14.5
Trial 9: w=3.4
Trial 10: w=61.1
Trial 11: w=7
Trial 12: w=86.8
Trial 13: w=68.2
Trial 14: w=26.1
Trial 15: w=5.1
Summary = 0.799 (0.724, 0.882)
Introduction toStatistical
Methods forClinical Trials
Amy Liu
Systematicreviews
Statisticalmethods formeta-analysis
Example
29-26
Heterogeneity estimates
I On the log-risk ratio scale we have Q = 14.7 with 14degrees of freedom, giving a p-value of 0.47.
I This corresponds to I 2 = 5%.
I The between studies variance component estimates toτ̂2 = 0.002.
I The two largest trials had variances of S212 = 0.012 and
S213 = 0.015, so adding the between trials variance
component will not shrink the weights much.

Introduction toStatistical
Methods forClinical Trials
Amy Liu
Systematicreviews
Statisticalmethods formeta-analysis
Example
29-27
Random effect model weights
Risk ratio
Stu
dy R
efer
ence
0.25 0.40 0.63 1.00 1.58 2.51 3.98
Trial 1: w*=6.2
Trial 2: w*=12.1
Trial 3: w*=7.6
Trial 4: w*=14.4
Trial 5: w*=38.8
Trial 6: w*=9.5
Trial 7: w*=30
Trial 8: w*=14.1
Trial 9: w*=3.3
Trial 10: w*=54.3
Trial 11: w*=6.9
Trial 12: w*=73.6
Trial 13: w*=59.8
Trial 14: w*=24.8
Trial 15: w*=5

Introduction toStatistical
Methods forClinical Trials
Amy Liu
Systematicreviews
Statisticalmethods formeta-analysis
Example
29-28
Random effect model summary estimate
Risk ratio
Stu
dy R
efer
ence
0.25 0.40 0.63 1.00 1.58 2.51 3.98
Trial 1: w*=6.2
Trial 2: w*=12.1
Trial 3: w*=7.6
Trial 4: w*=14.4
Trial 5: w*=38.8
Trial 6: w*=9.5
Trial 7: w*=30
Trial 8: w*=14.1
Trial 9: w*=3.3
Trial 10: w*=54.3
Trial 11: w*=6.9
Trial 12: w*=73.6
Trial 13: w*=59.8
Trial 14: w*=24.8
Trial 15: w*=5
Summary = 0.803 (0.725, 0.891)

Introduction toStatistical
Methods forClinical Trials
Amy Liu
Systematicreviews
Statisticalmethods formeta-analysis
Example
29-29
References
I Fletcher RH, Fletcher SW, Fletcher GS (2012). Clinical Epidemiology: TheEssentials. Lippincott Williams & Wilkins.
I Lewis S, Clarke M (2001). Forest plots: trying to see the wood and thetrees. BMJ 322:1479–1480.
I Ried K (2008). Interpreting and understanding meta-analysis graphs.Australian Family Physician 35.
I Sutton AJ (2000). Empirical assessment of effect of publication bias onmeta-analyses. BMJ 320:1574–1577.