Introduction to Soilbuild REIT - Singapore Exchange...This presentation should be read in...
31
Introduction to Soilbuild REIT 27 May 2017 REITS SYMPOSIUM 2017
Transcript of Introduction to Soilbuild REIT - Singapore Exchange...This presentation should be read in...
Introduction to Soilbuild REIT
27 May 2017
REITS SYMPOSIUM 2017

2
This presentation should be read in conjunction with the financial statements of Soilbuild Business Space REIT for the first quarter from 1 January 2017 to 31 March 2017 (hereinafter referred to 1Q FY2017).
This presentation is for information only and does not constitute an offer or solicitation of an offer to subscribe for, acquire, purchase, dispose of or sell any units in Soilbuild Business Space REIT (“Soilbuild REIT”, and units in Soilbuild REIT, “Units”) or any other securities or investment.
Nothing in this presentation should be construed as financial, investment, business, legal or tax advice and you should consult your own independent professional advisors.
This presentation may contain forward-looking statements that involve risks, uncertainties and assumptions. Future performance, outcomes and results may differ materially from those expressed in forward-looking statements as a result of a number of risks, uncertainties and assumptions. You are cautioned not to place undue reliance on these forward-looking statements, which are based on the current view of management of future events.
The value of Units and the income derived from them, if any, may fall or rise. Units are not obligations of, deposits in, or guaranteed by, the Manager or any of its affiliates. An investment in Units is subject to investment risks, including the possible loss of the principal amount invested.
Investors should note that they will have no right to request the Manager to redeem or purchase their Units for so long as the Units are listed on Singapore Exchange Securities Trading Limited (the “SGX-ST”). It is intended that holders of Units may only deal in their Units through trading on the SGX-ST. The listing of the Units on the SGX-ST does not guarantee a liquid market for the Units.
The past performance of Soilbuild REIT is not indicative of the future performance of Soilbuild REIT. Similarly, the past performance of SB REIT Management Pte. Ltd. (“Manager”) is not indicative of the future performance of the Manager.
Disclaimer
3
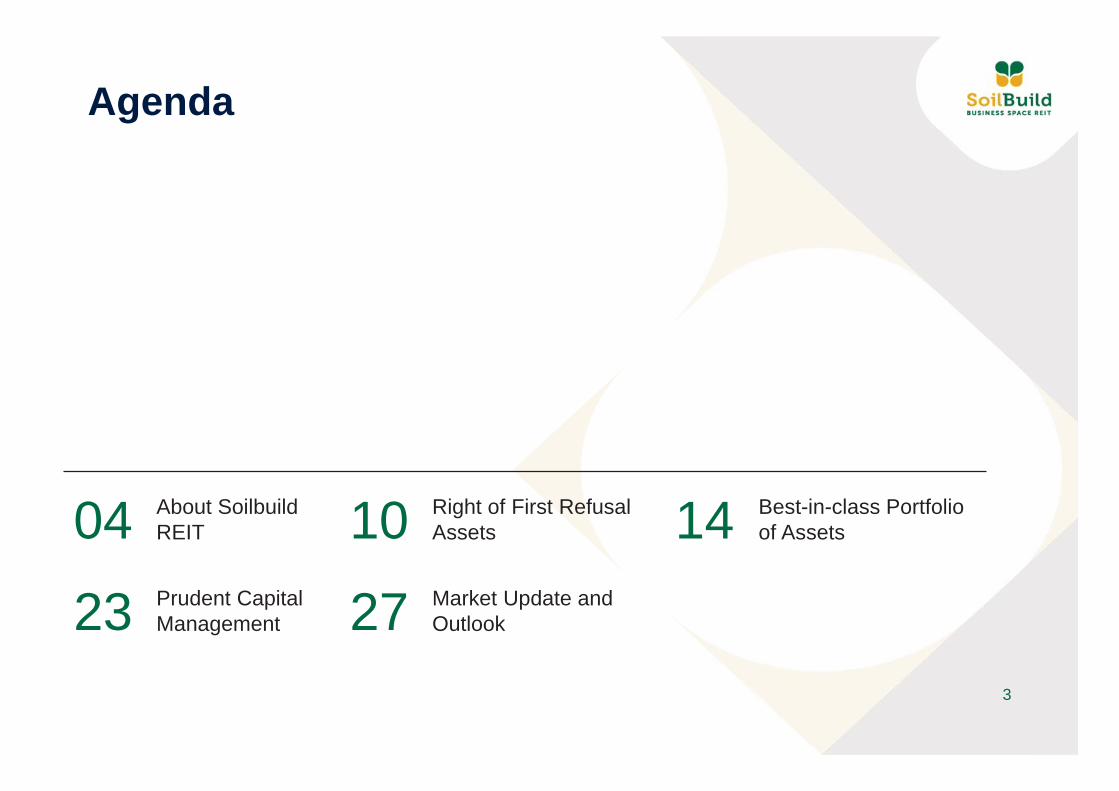
Agenda
04 About Soilbuild REIT 10 Right of First Refusal
Assets 14 Best-in-class Portfolio of Assets
23 Prudent Capital Management 27 Market Update and
Outlook

About Soilbuild REIT
5
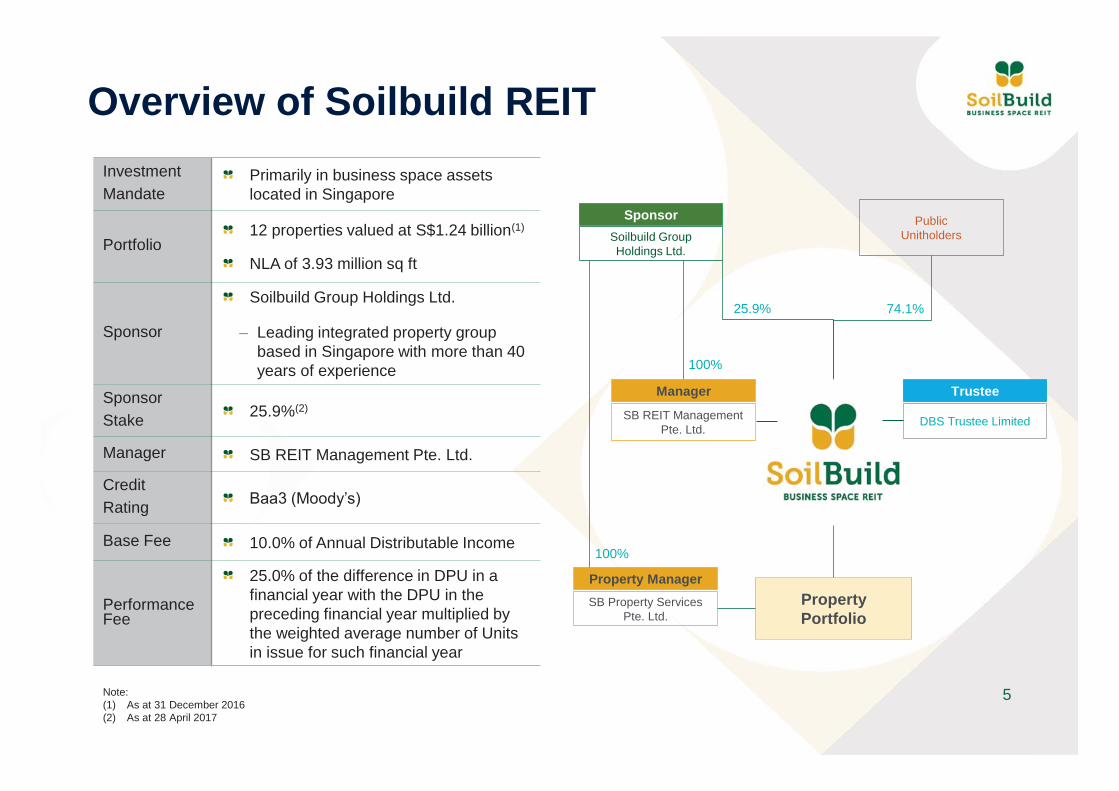
Overview of Soilbuild REIT
Note: (1) As at 31 December 2016 (2) As at 28 April 2017
Investment Mandate
Primarily in business space assets located in Singapore
Portfolio 12 properties valued at S$1.24 billion(1)
NLA of 3.93 million sq ft
Sponsor
Soilbuild Group Holdings Ltd.
– Leading integrated property group based in Singapore with more than 40 years of experience
Sponsor Stake 25.9%(2)
Manager SB REIT Management Pte. Ltd.
Credit Rating Baa3 (Moody’s)
Base Fee 10.0% of Annual Distributable Income
Performance Fee
25.0% of the difference in DPU in a financial year with the DPU in the preceding financial year multiplied by the weighted average number of Units in issue for such financial year
Sponsor Soilbuild Group Holdings Ltd.
Public Unitholders
Manager
SB REIT Management Pte. Ltd.
25.9% 74.1%
100%
Trustee
DBS Trustee Limited
Property Portfolio
Property Manager SB Property Services
Pte. Ltd.
100%

6
Roadmap since IPO
16 Aug 2013: Listed on SGX-ST
22 Jan 2014: Assigned BBB- corporate investment grade credit rating
26 May 2014: Completed maiden acquisition of Tellus Marine for S$18.2 million
16 Jul 2014: Awarded “Best Investor Relations” and “Best Annual Report”
31 Oct 2014: Completed KTL Offshore acquisition for S$55.7 million
23 Dec 2014: Completed Speedy-Tech acquisition for S$24.3 million
27 May 2015: Completed Technics acquisition for S$98.1 million
11 Feb 2015: Solaris Greenmark Platinum award renewed
25 Apr 2015: Established a S$500 million Medium Term Notes (“MTN”) Programme
21 May 2015: First issuance of S$100 million 3.45% Fixed Rate Notes Due 2018 under the MTN Programme
22 Apr 2015: Soilbuild REIT’s first equity fund raising of S$90 million at issuance price of S$0.805 per Unit via private placement
25 Sep 2015: Completed refinancing of S$185 million Club Loan to March 2020
22 Mar 2016: Assigned Baa3 investment grade issuer rating
8 April 2016: Second issuance of S$100 million 3.60% Fixed Rate Notes Due 2021 under the MTN Programme
27 May 2016: Withdrawal of S&P corporate credit rating. S&P reaffirmed the final “BBB-” long term corporate credit rating with a stable outlook
27 September 2016: Completed Acquisition of Bukit Batok Connection (“BBC”) and Entry into of The Master Lease Agreement in relation to BBC
26 September 2016: Successfully raised S$59.4 million gross proceeds at issuance price of S$0.630 per Unit from the Preferential Offering
10 October 2016: Awarded “Best REIT in Asia”
17 November 2016: Awarded “Highly Commended Winner for Best Financing Solution”
25 November 2016: Completion of a New Annex Block at Tellus Marine (Phase 2)

7
Steady Growth Since IPO Growing NPI
Stable DPU
6.9
13.7 14.2 14.0 14.2 14.9 15.8 16.7 17.8 17.5 17.2 17.3 17.3
18.9 19.2
5.0
10.0
15.0
20.0
3Q 2013 4Q 2013 1Q 2014 2Q 2014 3Q 2014 4Q 2014 1Q 2015 2Q 2015 3Q 2015 4Q 2015 1Q 2016 2Q 2016 3Q 2016 4Q 2016 1Q 2017
Net Property Income (S$ million)
6.1
12.2 12.6 12.1 12.5 12.9 13.3 14.3
15.2 15.1 14.6 14.7 14.6
16.4 15.6
1.533 1.539
0.760
1.510 1.562 1.500 1.546 1.585 1.633 1.615 1.625 1.614 1.557 1.565
1.399
1.570 1.489
0.0
0.2
0.4
0.6
0.8
1.0
1.2
1.4
1.6
4.0
6.0
8.0
10.0
12.0
14.0
16.0
18.0
20.0
3Q 2013 4Q 2013 1Q 2014 2Q 2014 3Q 2014 4Q 2014 1Q 2015 2Q 2015 3Q 2015 4Q 2015 1Q 2016 2Q 2016 3Q 2016 4Q 2016 1Q 2017
Distributable Income Adjusted DPU Actual DPU
Distributable Income (S$ million)
Actual DPU (cents)
(1)
Note: (1) The adjustment excludes the issuance of 94,353,672 new Units pursuant to the Preferential Offering and 1,528,571 new Units for the payment of acquisition fee at an issuance price
of S$0.63 per unit, as well as the revenue and associated borrowing costs relating to the acquisition of Bukit Batok Connection which was completed on 27 September 2016. (2) Assuming property and lease management fees for 1Q FY2017 remained payable in Units, the adjusted DPU would have been 1.539 cents.
(2)

8
Steady Growth Since IPO Cumulative DPU of 22.53 cents
Note: (1) Based on closing price on last day of each quarter; (2) Based on cumulative distribution per unit against IPO price of S$0.78. (3) Based on annualised FY2017 DPU of 5.956 cents and Unit price of $0.675 as at 31 March 2017. Source: Bloomberg
Price(1) (S$)
Cumulative DPU (cents)
Cumulative Distribution Returns(2) (%)
3Q 2013 0.745 0.760 0.97 4Q 2013 0.770 2.270 2.91
1Q 2014 0.780 3.832 4.91
2Q 2014 0.800 5.332 6.84
3Q 2014 0.795 6.878 8.82
4Q 2014 0.790 8.463 10.85
1Q 2015 0.810 10.096 12.94
2Q 2015 0.850 11.711 15.01
3Q 2015 0.805 13.336 17.1 4Q 2015 0.770 14.95 19.17
1Q 2016 0.730 16.507 21.16
2Q 2016 0.685 18.072 23.17
3Q 2016 0.700 19.471 24.96
4Q 2016 0.640 21.041 26.98
1Q 2017 0.675 22.530 28.88
Distribution Yield = 8.8%(3)
0.55
0.60
0.65
0.70
0.75
0.80
0.85
0.90
70
80
90
100
110
120
130
Aug
-13
Sep
-13
Oct
-13
Nov
-13
Dec
-13
Jan-
14Fe
b-14
Mar
-14
Apr
-14
May
-14
Jun-
14Ju
l-14
Aug
-14
Sep
-14
Oct
-14
Nov
-14
Dec
-14
Jan-
15Fe
b-15
Mar
-15
Apr
-15
May
-15
Jun-
15Ju
l-15
Aug
-15
Sep
-15
Oct
-15
Nov
-15
Dec
-15
Jan-
16Fe
b-16
Mar
-16
Apr
-16
May
-16
Jun-
16Ju
l-16
Aug
-16
Sep
-16
Oct
-16
Nov
-16
Dec
-16
Jan-
17Fe
b-17
Mar
-17
FTSE ST Index FTSE ST REIT Index Soilbuild REIT Unit Price
Index Closing
price (S$)
9
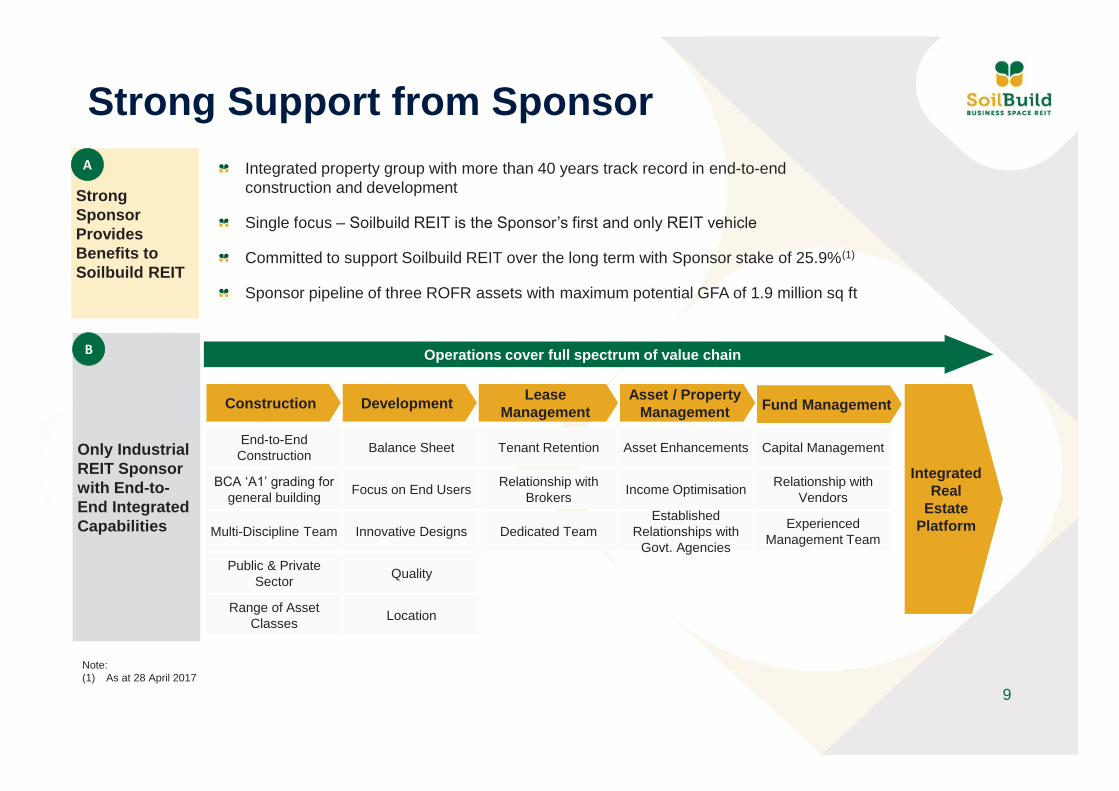
Strong Support from Sponsor
Only Industrial REIT Sponsor with End-to-End Integrated Capabilities
B
Strong Sponsor Provides Benefits to Soilbuild REIT
Integrated property group with more than 40 years track record in end-to-end construction and development
Single focus – Soilbuild REIT is the Sponsor’s first and only REIT vehicle
Committed to support Soilbuild REIT over the long term with Sponsor stake of 25.9%(1)
Sponsor pipeline of three ROFR assets with maximum potential GFA of 1.9 million sq ft
A
Construction
End-to-End Construction
BCA ‘A1’ grading for general building
Multi-Discipline Team
Public & Private Sector
Range of Asset Classes
Balance Sheet
Focus on End Users
Innovative Designs
Quality
Location
Tenant Retention
Relationship with Brokers
Dedicated Team Established
Relationships with Govt. Agencies
Asset Enhancements
Income Optimisation
Experienced Management Team
Capital Management
Relationship with Vendors
Operations cover full spectrum of value chain
Development Lease Management
Asset / Property Management Fund Management
Integrated Real
Estate Platform
Note: (1) As at 28 April 2017

Right of First Refusal Assets
11
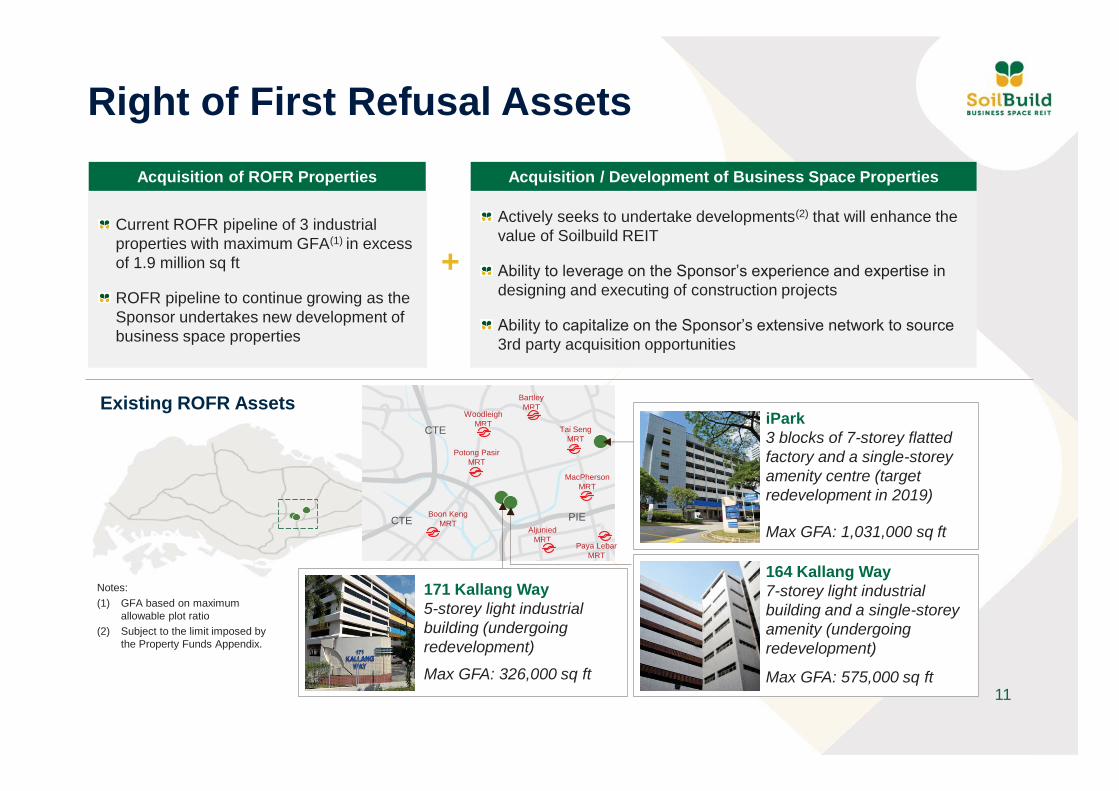
Right of First Refusal Assets Acquisition of ROFR Properties
Current ROFR pipeline of 3 industrial properties with maximum GFA(1) in excess of 1.9 million sq ft
ROFR pipeline to continue growing as the Sponsor undertakes new development of business space properties
Acquisition / Development of Business Space Properties
Actively seeks to undertake developments(2) that will enhance the value of Soilbuild REIT
Ability to leverage on the Sponsor’s experience and expertise in designing and executing of construction projects
Ability to capitalize on the Sponsor’s extensive network to source 3rd party acquisition opportunities
CTE
CTE PIE
Bartley MRT
Tai Seng MRT
MacPherson MRT
Paya Lebar MRT
Aljunied MRT
Boon Keng MRT
Potong Pasir MRT
Woodleigh MRT iPark
3 blocks of 7-storey flatted factory and a single-storey amenity centre (target redevelopment in 2019) .
Max GFA: 1,031,000 sq ft
171 Kallang Way 5-storey light industrial building (undergoing redevelopment)
Max GFA: 326,000 sq ft
164 Kallang Way 7-storey light industrial building and a single-storey amenity (undergoing redevelopment) .
Max GFA: 575,000 sq ft
+
Existing ROFR Assets
Notes:(1) GFA based on maximum
allowable plot ratio (2) Subject to the limit imposed by
the Property Funds Appendix.

12
Sponsor’s Redevelopment Plan at 164 Kallang Way
OLD NEW

13
Sponsor’s Redevelopment Plan at 164 Kallang Way
NEW

Best-in-class Portfolio of Assets
15
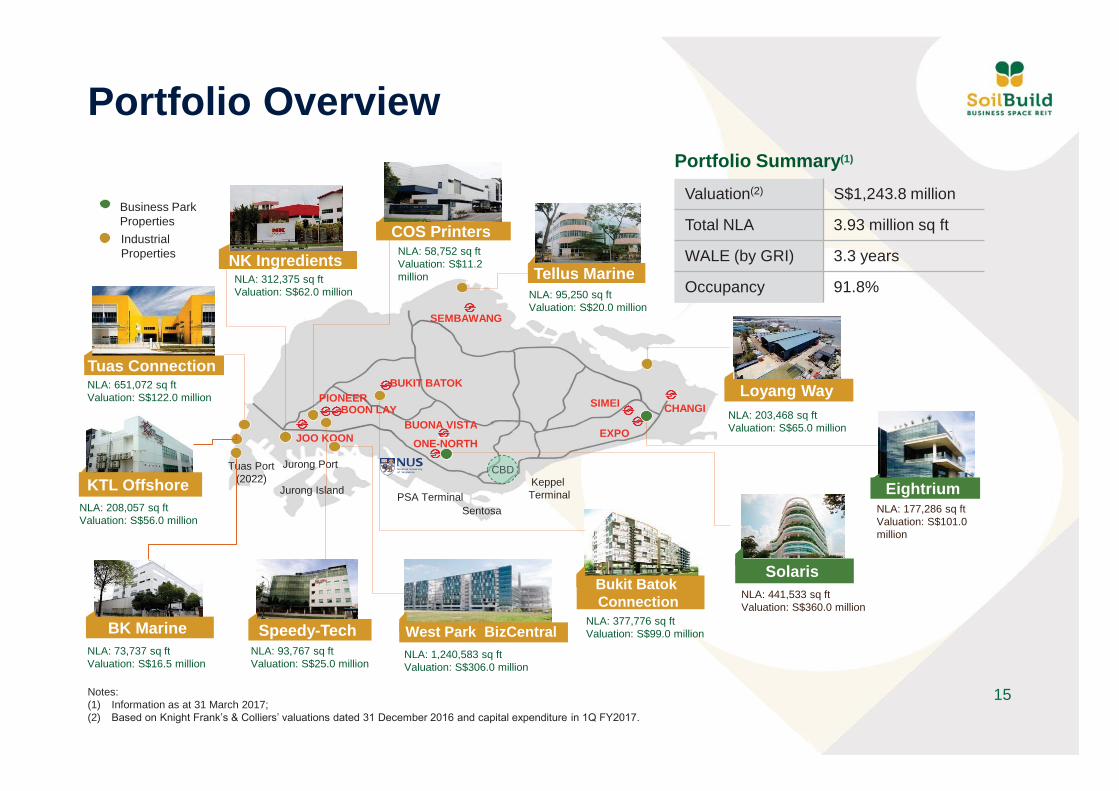
Portfolio Overview
SEMBAWANG
JOO KOON
BOON LAY BBPIONEER
ONE-NORTH
BUONA VISTA
Sentosa
Jurong Island
Jurong Port
PSA Terminal
Tuas Port (2022) Keppel
Terminal
CHANGI SIMEI
EXPO
CBD
BUKIT BATOK BBB
Tellus Marine NLA: 95,250 sq ft Valuation: S$20.0 million
COS Printers
NLA: 312,375 sq ft Valuation: S$62.0 million
NK Ingredients
NLA: 203,468 sq ft Valuation: S$65.0 million
Loyang Way
Eightrium NLA: 177,286 sq ft Valuation: S$101.0 million
Solaris NLA: 441,533 sq ft Valuation: S$360.0 million
NLA: 377,776 sq ft Valuation: S$99.0 million
Bukit Batok Connection
NLA: 1,240,583 sq ft Valuation: S$306.0 million
West Park BizCentral NLA: 93,767 sq ft Valuation: S$25.0 million
Speedy-Tech BK Marine NLA: 73,737 sq ft Valuation: S$16.5 million
NLA: 208,057 sq ft Valuation: S$56.0 million
KTL Offshore
NLA: 58,752 sq ft Valuation: S$11.2 million
Tuas Connection NLA: 651,072 sq ft Valuation: S$122.0 million
Business Park Properties Industrial Properties
Valuation(2) S$1,243.8 million
Total NLA 3.93 million sq ft
WALE (by GRI) 3.3 years
Occupancy 91.8%
Portfolio Summary(1)
Notes: (1) Information as at 31 March 2017; (2) Based on Knight Frank’s & Colliers’ valuations dated 31 December 2016 and capital expenditure in 1Q FY2017.
16
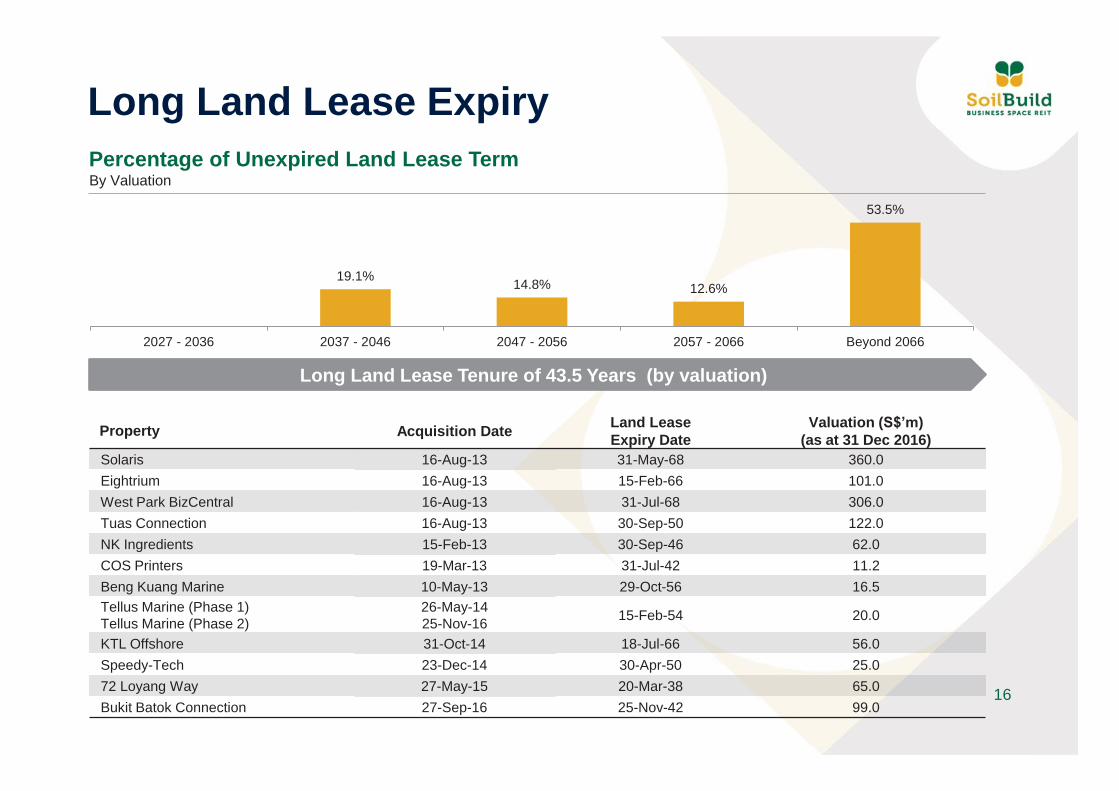
Long Land Lease Expiry
Property Acquisition Date Land Lease Expiry Date
Valuation (S$’m) (as at 31 Dec 2016)
Solaris 16-Aug-13 31-May-68 360.0 Eightrium 16-Aug-13 15-Feb-66 101.0 West Park BizCentral 16-Aug-13 31-Jul-68 306.0 Tuas Connection 16-Aug-13 30-Sep-50 122.0 NK Ingredients 15-Feb-13 30-Sep-46 62.0 COS Printers 19-Mar-13 31-Jul-42 11.2 Beng Kuang Marine 10-May-13 29-Oct-56 16.5 Tellus Marine (Phase 1) Tellus Marine (Phase 2)
26-May-14 25-Nov-16 15-Feb-54 20.0
KTL Offshore 31-Oct-14 18-Jul-66 56.0 Speedy-Tech 23-Dec-14 30-Apr-50 25.0
72 Loyang Way 27-May-15 20-Mar-38 65.0 Bukit Batok Connection 27-Sep-16 25-Nov-42 99.0
Percentage of Unexpired Land Lease Term By Valuation
Long Land Lease Tenure of 43.5 Years (by valuation)
19.1% 14.8% 12.6%
53.5%
2027 - 2036 2037 - 2046 2047 - 2056 2057 - 2066 Beyond 2066

17
Portfolio Occupancy
97.4
100.0 100.0
97.9
86.3 86.3
93.0
100.0
92.3 90.7 92.9
99.7
94.8
89.6 91.8 92.7
90.1 89.5 89.4
80.0
85.0
90.0
95.0
100.0
3QFY2013
4QFY2013
1QFY2014
2QFY2014
3QFY2014
4QFY2014
1QFY2015
2QFY2015
3QFY2015
4QFY2015
1QFY2016
2QFY2016
3QFY2016
4QFY2016
1QFY2017
Occupancy (%)
Eightrium
TuasConnection
West ParkBizCentral
Portfolio
IndustrialAverage
3Q 2013
4Q 2013
1Q 2014
2Q 2014
3Q 2014
4Q 2014
1Q 2015
2Q 2015
3Q 2015
4Q 2015
1Q 2016
2Q 2016
3Q 2016
4Q 2016
1Q 2017
Eightrium 97.4% 98.5% 100.0% 100.0% 100.0% 100.0% 100.0% 100.0% 100.0% 100.0% 100.0% 100.0% 100.0% 100.0% 97.9%
Tuas Connection 100.0% 100.0% 100.0% 93.2% 100.0% 100.0% 100.0% 100.0% 93.5% 93.5% 86.3% 89.5% 86.3% 86.3% 93.0%
West Park BizCentral 100.0% 100.0% 100.0% 99.8% 99.8% 100.0% 100.0% 99.3% 99.6% 94.2% 92.3% 82.7% 90.8% 90.7% 92.9%
Portfolio 99.8% 99.9% 100.0% 98.5% 99.9% 100.0% 100.0% 99.8% 98.7% 96.8% 94.8% 92.0% 94.8% 89.6% 91.8%(1)
Industrial Average (2) 92.7% 91.9% 91.6% 90.7% 90.9% 90.9% 90.7% 91.0% 90.8% 90.6% 90.1% 89.4% 89.1% 89.5% 89.4%
Notes: (1) Inclusive of 9.9% occupancy at 72 Loyang Way. (2) Source: JTC statistics as at 1Q 2017

18
7.6%
3.1% 1.5%
5.6%
4.7%
Solaris Master Lease Expiry (by GRI)
< Aug 2018> Aug 201820192020>2020
16.1% 16.0%
11.2% 22.5%
1.9% 1.4% 5.3% 4.8%
12.6%
27.3%
8.3% 8.5% 9.0%
26.1%
12.5%
38.5%
7.6% 8.1% 8.3%
25.0%
0%
5%
10%
15%
20%
25%
30%
35%
40%
2017 2018 2019 2020 2021 >2021
KTL Offshore Expiry byGross Rental Income
KTL Offshore Expiry byNLA
Beng Kuang MarineExpiry by Gross RentalIncomeBeng Kuang MarineExpiry by NLA
Solaris Expiry by GrossRental Income
Solaris Expiry by NLA
Lease Expiry Profile ByGross Rental Income
Lease Expiry Profile ByNLA
Well Staggered Lease Expiry WALE (by NLA) 3.4 years
Note: (1) Information as at 31 March 2017.
WALE (by Gross Rental Income) 3.3 years
WALE of new leases which commenced in 1Q FY2017 was 5.0 years (by GRI)
WALE of new leases signed in 1Q FY2017 was 3.8 years (by GRI)
19
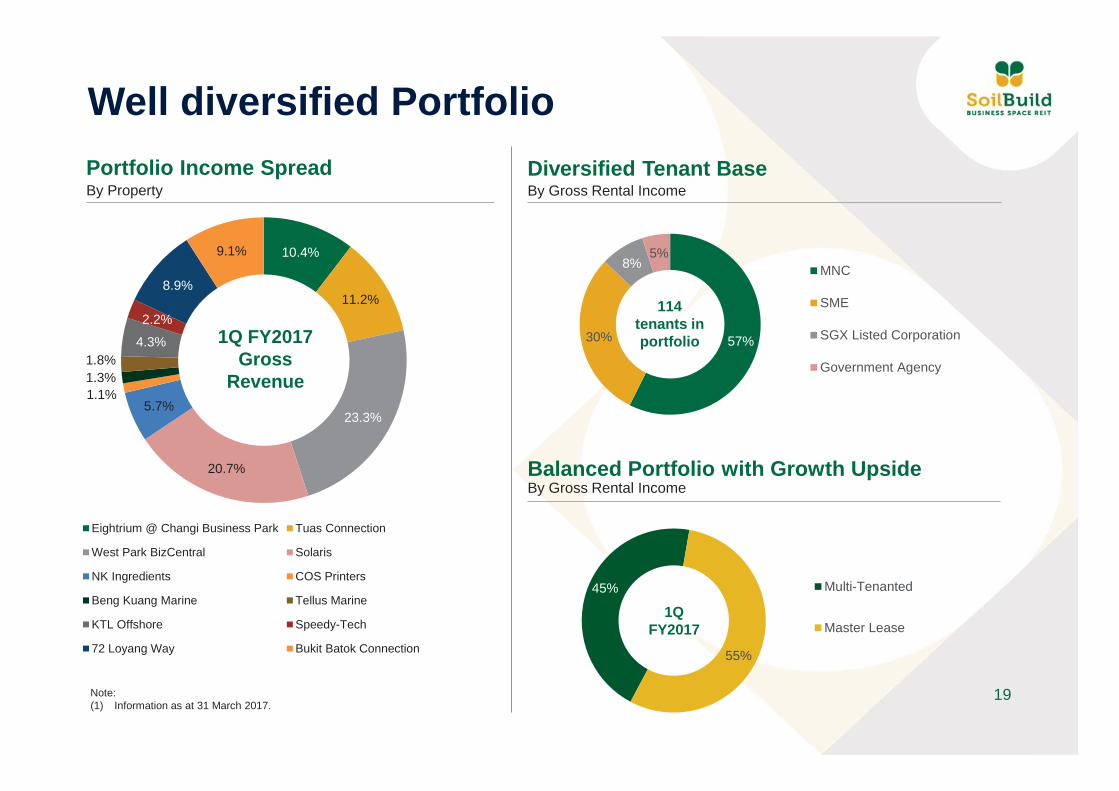
57% 30%
8% 5%
MNC
SME
SGX Listed Corporation
Government Agency
10.4%
11.2%
23.3%
20.7%
5.7% 1.1% 1.3% 1.8%
4.3%
2.2%
8.9%
9.1%
Eightrium @ Changi Business Park Tuas Connection
West Park BizCentral Solaris
NK Ingredients COS Printers
Beng Kuang Marine Tellus Marine
KTL Offshore Speedy-Tech
72 Loyang Way Bukit Batok Connection
45%
55%
Multi-Tenanted
Master Lease
Well diversified Portfolio Portfolio Income Spread By Property
Balanced Portfolio with Growth Upside By Gross Rental Income
Diversified Tenant Base By Gross Rental Income
1Q FY2017 Gross
Revenue
114 tenants in portfolio
1Q FY2017
Note: (1) Information as at 31 March 2017.

20
11.1% 2.3%
14.1%
10.9%
9.7% 8.8% 4.9%
4.4%
4.8%
4.0%
2.9%
10.6%
11.5%
Marine Offshore
Oil & Gas
Precision Engineering, Electrical and Machinery Products
Information Technology
Electronics
Chemicals
Government Agency
Publishing, Printing & Reproduction of Recorded Media
Fabricated Metal Products
Food Products & Beverages
Supply Chain Management, 3rd Party Logistics, Freight Forwarding
Real Estate and Construction
Others
Well diversified Portfolio Well-spread Trade Sectors By Gross Rental Income
4.3%
2.8% 2.6% 1.8% 1.3%
0.3% 0.3%
KTL Offshore Tuas Connection West Park BizCentral Tellus Marine Beng Kuang Marine Solaris 72 Loyang Way
Diversified Exposure by Property – Marine Offshore and Oil & Gas By Gross Rental Income
Multi-Tenanted Master Lease
% of Monthly Gross Rental
Income
Note: (1) Information as at 31 March 2017.

21
Diverse Tenant Base
Top 10 tenants contribute 42.4%(1) of monthly gross rental income.
Note: (1) Inclusive of underlying tenants in Solaris
9.1%
5.8%
4.9%
4.3%
3.9%
3.8%
3.3%
2.7%
2.4%
2.2%
SB (Westview) Investment Pte. Ltd.
NK Ingredients Pte Ltd
SPRING Singapore
KTL Offshore Pte Ltd
Mediatek Singapore Pte Ltd
Autodesk Asia Pte Ltd
Nestle Singapore (Pte) Ltd
John Wiley & Sons (Singapore) Pte Ltd
Dyson Operations Pte Ltd
Speedy-Tech
22
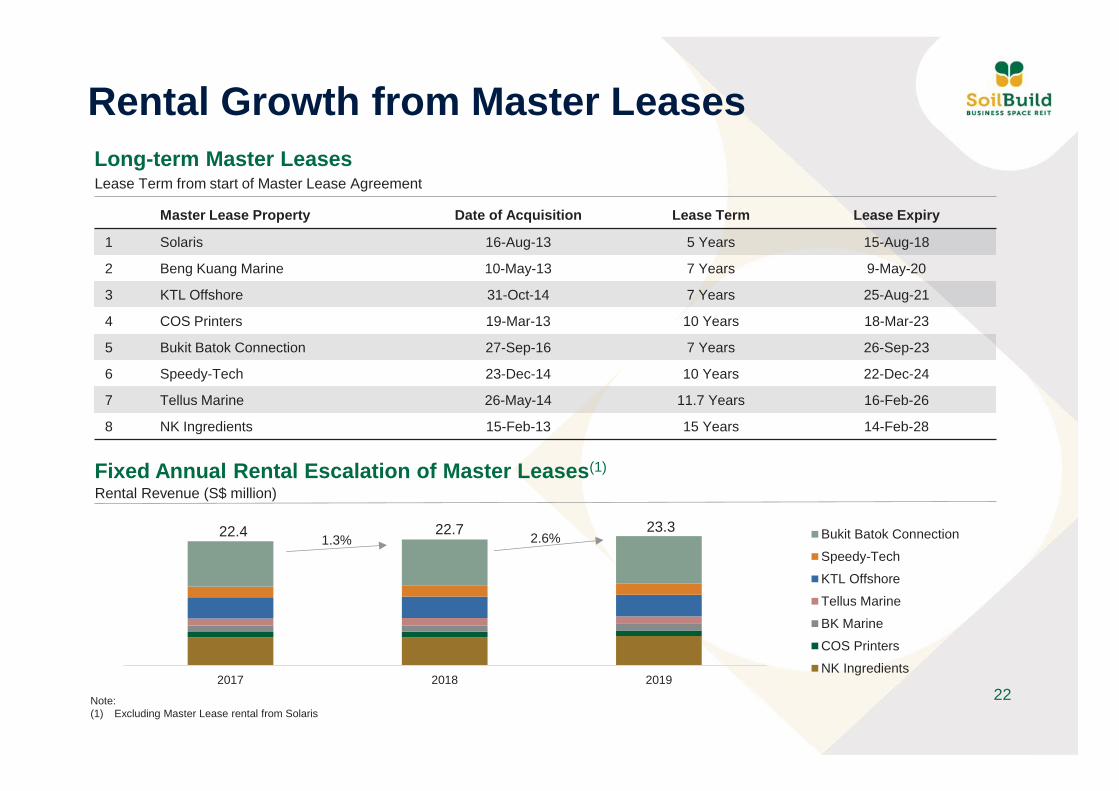
Rental Growth from Master Leases Long-term Master Leases Lease Term from start of Master Lease Agreement
Fixed Annual Rental Escalation of Master Leases(1) Rental Revenue (S$ million)
2017 2018 2019
Bukit Batok Connection
Speedy-Tech
KTL Offshore
Tellus Marine
BK Marine
COS Printers
NK Ingredients
1.3% 2.6% 22.4 22.7 23.3
Master Lease Property Date of Acquisition Lease Term Lease Expiry
1 Solaris 16-Aug-13 5 Years 15-Aug-18
2 Beng Kuang Marine 10-May-13 7 Years 9-May-20
3 KTL Offshore 31-Oct-14 7 Years 25-Aug-21
4 COS Printers 19-Mar-13 10 Years 18-Mar-23
5 Bukit Batok Connection 27-Sep-16 7 Years 26-Sep-23
6 Speedy-Tech 23-Dec-14 10 Years 22-Dec-24
7 Tellus Marine 26-May-14 11.7 Years 16-Feb-26
8 NK Ingredients 15-Feb-13 15 Years 14-Feb-28
Note: (1) Excluding Master Lease rental from Solaris
Prudent Capital Management
24
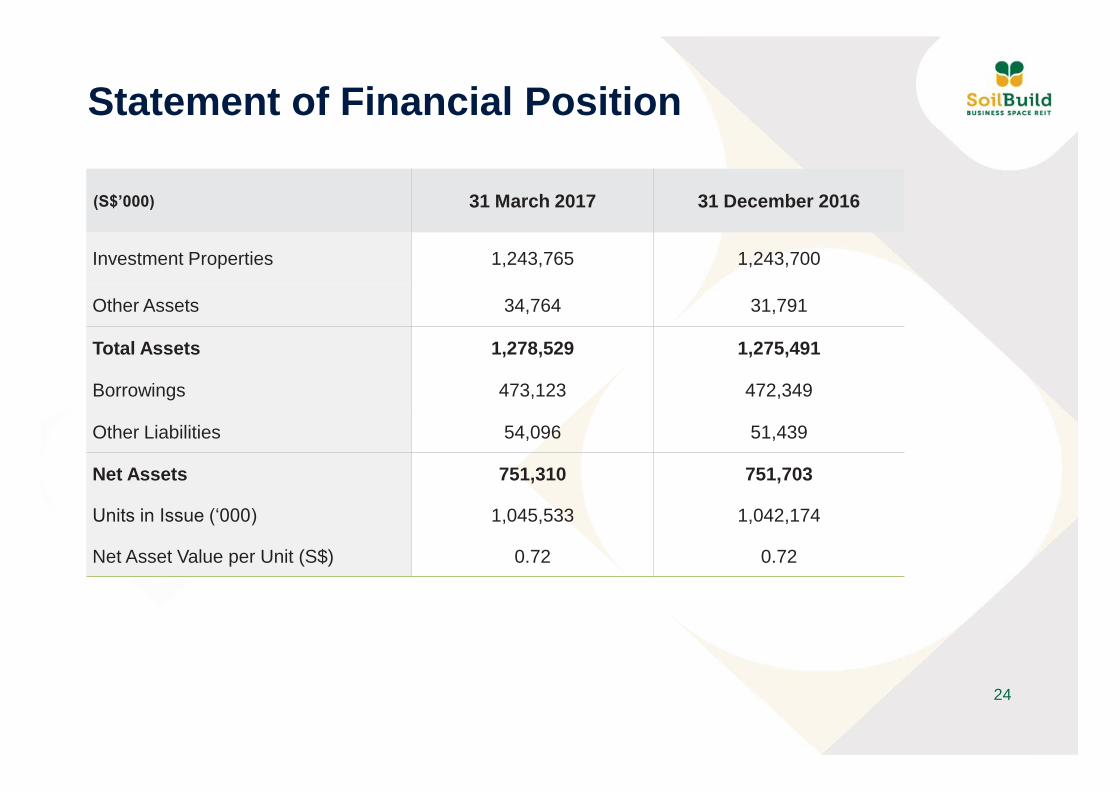
Statement of Financial Position
(S$’000) 31 March 2017 31 December 2016
Investment Properties 1,243,765 1,243,700
Other Assets 34,764 31,791
Total Assets 1,278,529 1,275,491
Borrowings 473,123 472,349
Other Liabilities 54,096 51,439
Net Assets 751,310 751,703
Units in Issue (‘000) 1,045,533 1,042,174
Net Asset Value per Unit (S$) 0.72 0.72

25
1) Soilbuild REIT is rated Baa3/negative by Moody’s.
Prudent Capital Management 3) Aggregate leverage of 37.5%(1) allows headroom
of S$52 million(2)
31 March 2017
Total Bank Financing Facilities S$230 million
Total Bank Debt Drawn Down S$225 million
Multicurrency Debt Issuance Programme drawn down S$200 million
Interest-free Loan S$55 million
Unencumbered Investment Properties S$883 million
Secured leverage (3) 14.5%
Average All-in Interest Cost(4) 3.37% p.a.
Interest Coverage Ratio(5) 5.0x
Weighted Average Debt Maturity (1) 2.6 years
Notes: (1) Includes interest free loan in relation to the Solaris upfront land premium. (2) Based on target aggregate leverage of 40%. (3) Secured Debt/Total Assets. (4) Excludes interest-free loan. (5) Computed based on 1Q FY2017 EBITDA/Net interest expense (Finance
expense – Interest income).
2) Fixed interest rate for 86.5% of borrowings for a weighted average term of 1.7 years(1).
No refinancing requirements till 2018
55
100
100
40
185
2017 2018 2019 2020 2021
S$'m
illio
ns
Bank Facility drawn down MTN Interest Free Loan
% of Debt Maturing
32.3% 8.4% 38.5% 20.8%

26
Interest Rate Risk Management
Interest Rate Increase
Increase in FY2017 finance expense (S$’000)
As a % of Annualised FY2017 Finance Expenses
As a % of Annualised FY2017 Distributable Income
Impact on Annualised FY2017 DPU (in cents)
Increase in FY2017 Weighted Average Borrowing Cost
0.25% 181 1.1% 0.3% 0.017 0.02%
0.50% 362 2.3% 0.6% 0.035 0.06%
0.75% 543 3.4% 0.9% 0.052 0.11%
1.00% 724 4.5% 1.2% 0.069 0.15%
Assuming no re-financing and entry into new interest rate swaps in FY2017:

Market Update and Outlook

28
Industrial Properties Profile 1Q 2013 vs 1Q 2014 1Q 2014 vs 1Q 2015 1Q 2015 vs 1Q 2016 1Q 2016 vs 1Q 2017
Change y-o-y Vacancy Rate
Rental Index
Vacancy Rate
Rental Index
Vacancy Rate
Rental Index
Vacancy Rate
Rental Index
Multi-user 2.1% 4.5 0.9% 2.0 0.2% 7.2 0.3% 5.0
Single-user 1.1% 4.6 0.8% 1.8 1.0% 3.3 1.3% 6.0
Warehouse 1.8% 0.8 1.1% 1.2 0.4% 3.0 0.5% 5.9
Business Park 0.6% 3.7 0.4% 0.8 1.3% 2.7 2.3% 0.4
Total Industrial Stock (‘million sq m)
Source: JTC Statistics as at 1Q 2017
Increase y-o-y 1Q 2013 vs 1Q 2014 1Q 2014 vs 1Q 2015 1Q 2015 vs 1Q 2016 1Q 2016 vs 1Q 2017
Multi-user 4.1% 5.9% 3.3% 3.9%
Single-user 3.6% 2.6% 2.4% 3.2%
Warehouse 7.1% 7.3% 6.5% 6.2%
Business Park 4.0% 11.1% 15.2% 4.5%
39.4 39.6 40.0 40.3 40.9 41.3 42.0 42.3 42.8 43.2 43.5 44.0 44.5 44.9 45.4 45.8 46.3 46.7
4Q 2012 1Q 2013 2Q 2013 3Q 2013 4Q 2013 1Q 2014 2Q 2014 3Q 2014 4Q 2014 1Q 2015 2Q 2015 3Q 2015 4Q 2015 1Q 2016 2Q 2016 3Q 2016 4Q 2016 1Q 2017
Multi-user Factory Single-user Factory Warehouse Business Park
29
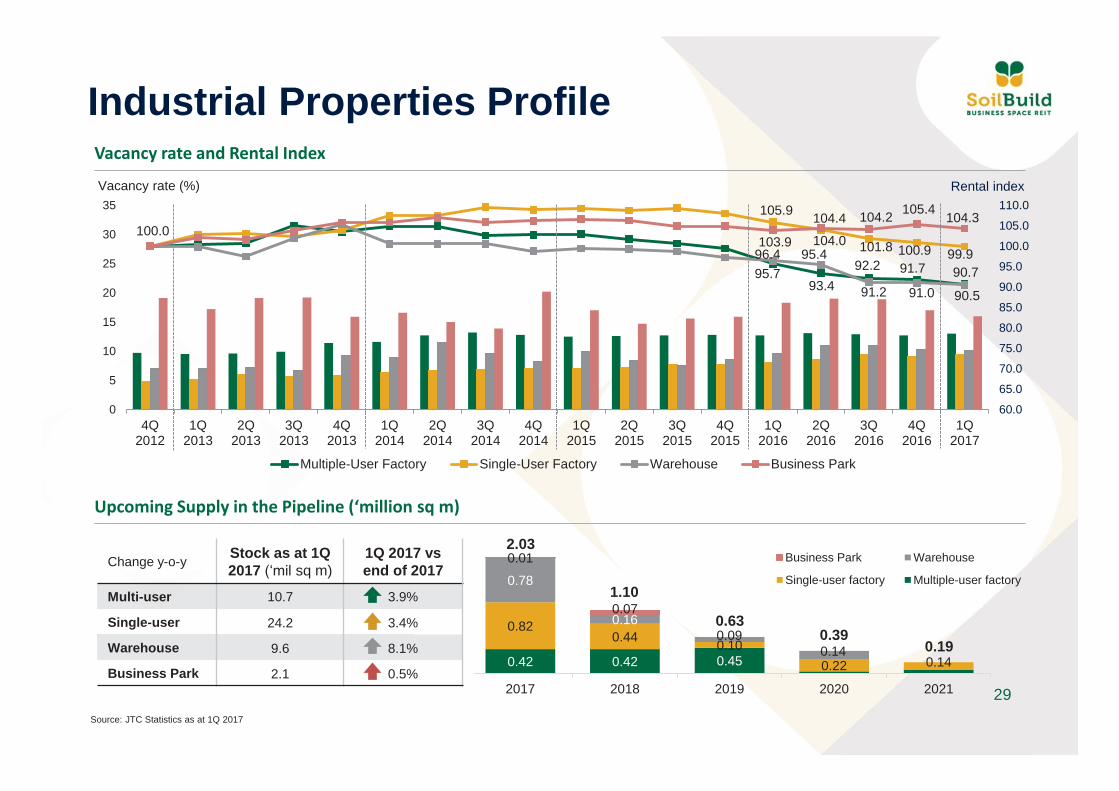
Industrial Properties Profile Vacancy rate and Rental Index
Upcoming Supply in the Pipeline (‘million sq m)
0.42 0.42 0.45
0.82 0.44 0.10
0.22 0.14
0.78
0.16 0.09
0.14
0.01
0.07
-300
200
700
1,200
1,700
2,200
2017 2018 2019 2020 2021
Business Park Warehouse
Single-user factory Multiple-user factory
2.03
1.10
0.63 0.39
0.19
Source: JTC Statistics as at 1Q 2017
95.7 93.4
92.2 91.7 90.7
105.9
104.0 101.8 100.9 99.9 96.4 95.4
91.2 91.0 90.5
100.0 103.9
104.4 104.2 105.4 104.3
0
5
10
15
20
25
30
35
60.0
65.0
70.0
75.0
80.0
85.0
90.0
95.0
100.0
105.0
110.0
4Q2012
1Q2013
2Q2013
3Q2013
4Q2013
1Q2014
2Q2014
3Q2014
4Q2014
1Q2015
2Q2015
3Q2015
4Q2015
1Q2016
2Q2016
3Q2016
4Q2016
1Q2017
Vacancy rate (%) Rental index
Multiple-User Factory Single-User Factory Warehouse Business Park
Change y-o-y Stock as at 1Q 2017 (‘mil sq m)
1Q 2017 vs end of 2017
Multi-user 10.7 3.9%
Single-user 24.2 3.4%
Warehouse 9.6 8.1%
Business Park 2.1 0.5%
30
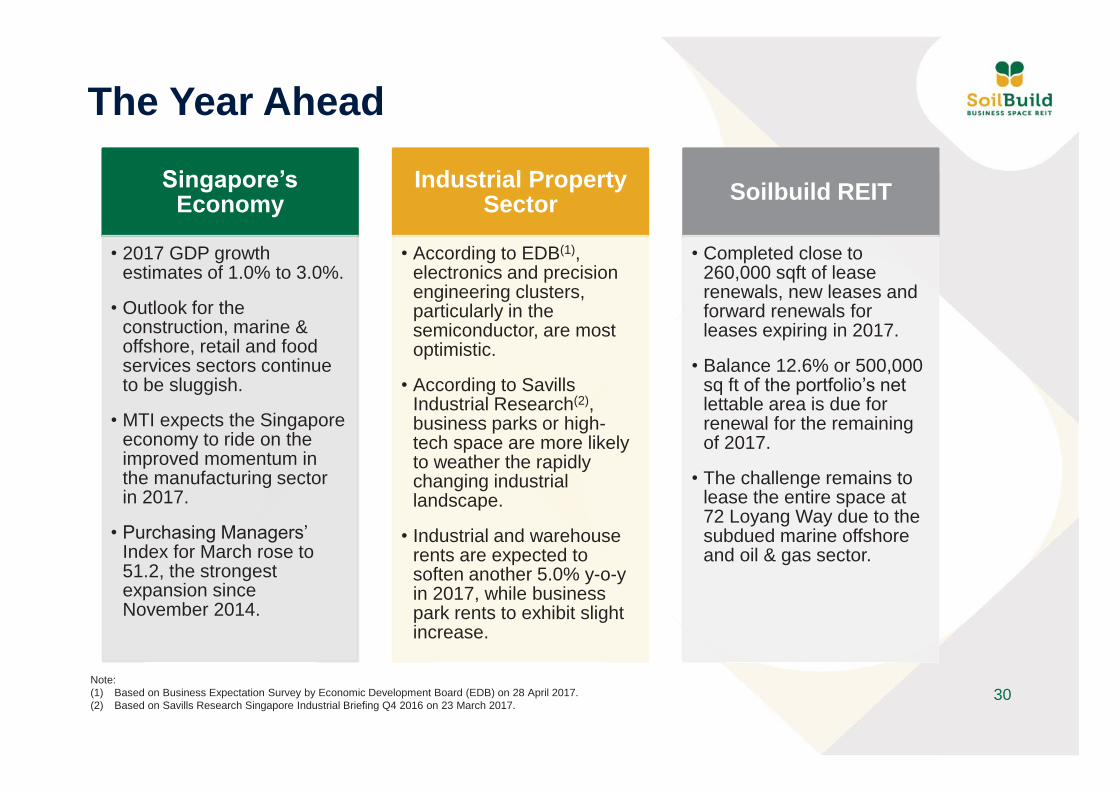
The Year Ahead
Singapore’s Economy
• 2017 GDP growth estimates of 1.0% to 3.0%.
• Outlook for the construction, marine & offshore, retail and food services sectors continue to be sluggish.
• MTI expects the Singapore economy to ride on the improved momentum in the manufacturing sector in 2017.
• Purchasing Managers’ Index for March rose to 51.2, the strongest expansion since November 2014.
Industrial Property Sector
• According to EDB(1), electronics and precision engineering clusters, particularly in the semiconductor, are most optimistic.
• According to Savills Industrial Research(2), business parks or high-tech space are more likely to weather the rapidly changing industrial landscape.
• Industrial and warehouse rents are expected to soften another 5.0% y-o-y in 2017, while business park rents to exhibit slight increase.
Soilbuild REIT
• Completed close to 260,000 sqft of lease renewals, new leases and forward renewals for leases expiring in 2017.
• Balance 12.6% or 500,000 sq ft of the portfolio’s net lettable area is due for renewal for the remaining of 2017.
• The challenge remains to lease the entire space at 72 Loyang Way due to the subdued marine offshore and oil & gas sector.
Note: (1) Based on Business Expectation Survey by Economic Development Board (EDB) on 28 April 2017. (2) Based on Savills Research Singapore Industrial Briefing Q4 2016 on 23 March 2017.

THANK YOU
Key Contacts:
Lim Hui Hua Chief Financial Officer Tel: (65) 6415 5985 Email: [email protected]
Roy Teo Chief Executive Officer Tel: (65) 6415 5983 Email: [email protected]