Introduction to R
10
(I) Statistics– Introduction to R Prof. Dr. Jan Kirenz
-
Upload
prof-dr-jan-kirenz -
Category
Data & Analytics
-
view
197 -
download
0
Transcript of Introduction to R

(I) Statistics– Introduction to RProf. Dr. Jan Kirenz
Statistics
Why we want to use R instead of SPSS
• It is one of the most important tools in statistics (in academia and companies)
• It is a free open source soulution –students can use it at home
• It is far more powerful than SPSS (especially in terms of data explorationand visualisation)
• Students learn to code and acquire basicskills in the field of data science

Statistics
Programming Language R
Companies Using R
• R is a language and environment for statistical computing and graphics.
• It is one of the most important tools for computational statistics, visualization and data science.
Statistics
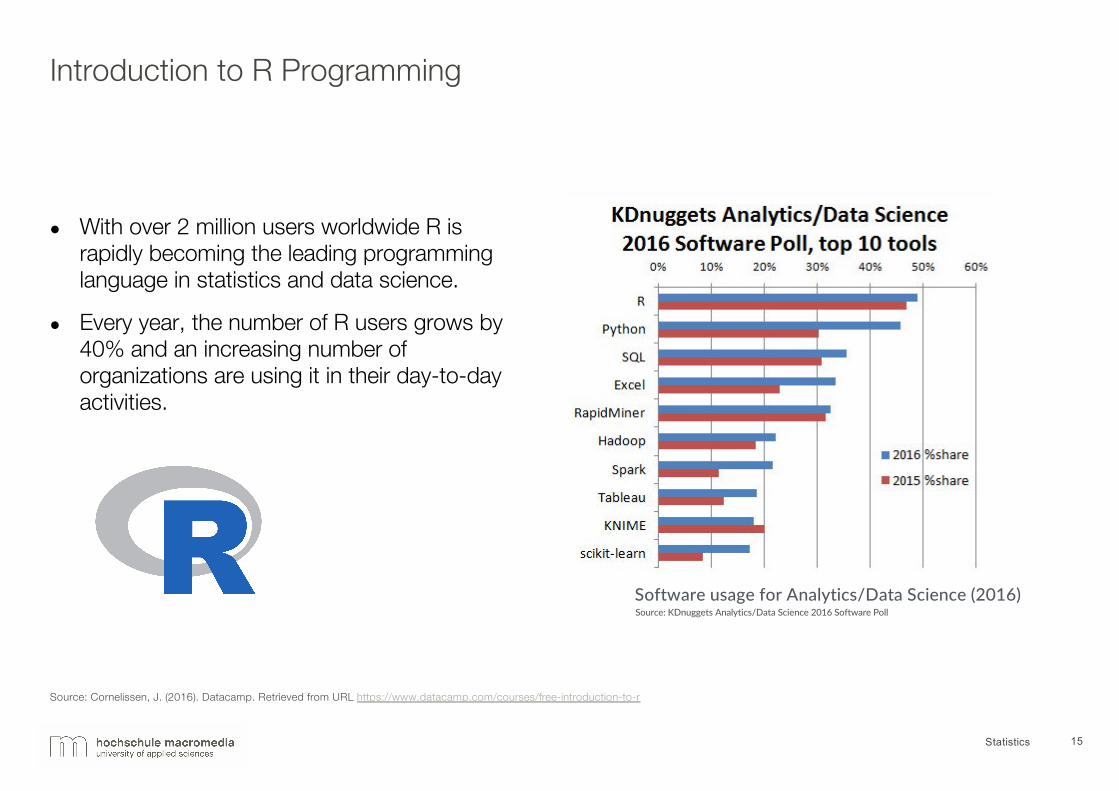
Introduction to R Programming
l With over 2 million users worldwide R israpidly becoming the leading programminglanguage in statistics and data science.
l Every year, the number of R users grows by40% and an increasing number oforganizations are using it in their day-to-dayactivities.
15
Source: Cornelissen, J. (2016). Datacamp. Retrieved from URL https://www.datacamp.com/courses/free-introduction-to-r
Source: KDnuggets Analytics/Data Science 2016 Software PollSoftware usage for Analytics/Data Science (2016)

Statistics
R Data Visualisations

Statistics
R Data Visualisations
Statistics
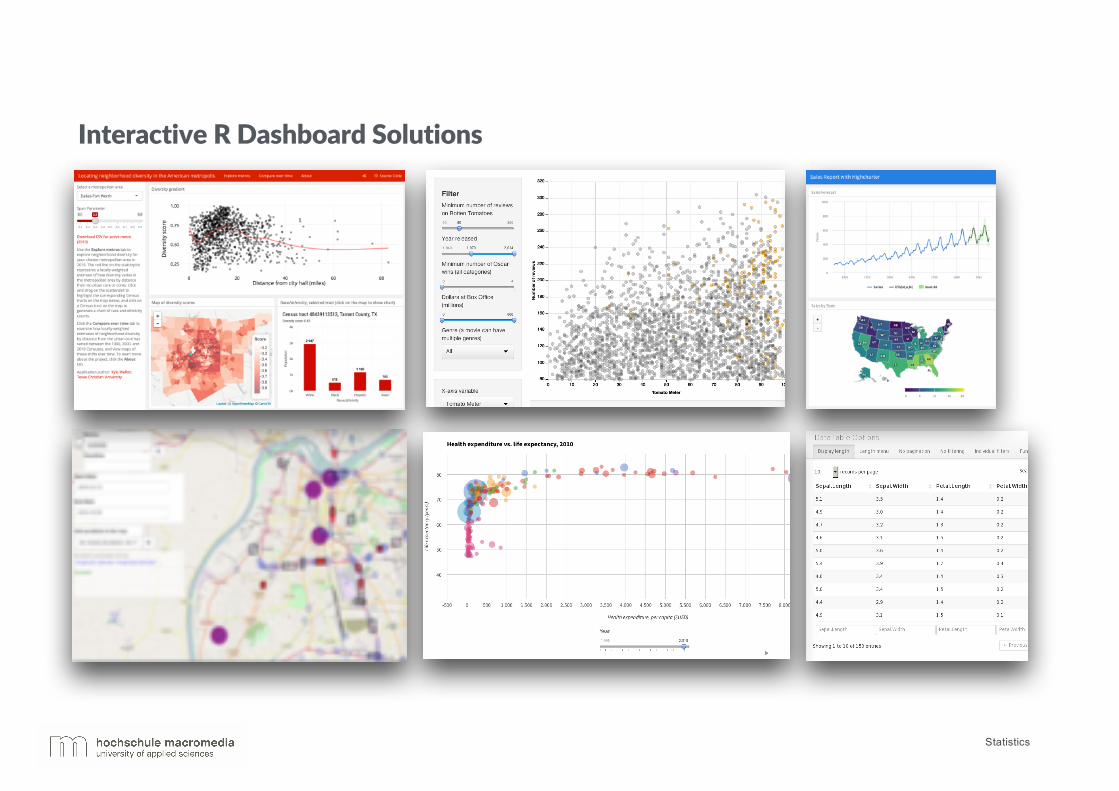
Interactive R Dashboard Solutions
Statistics
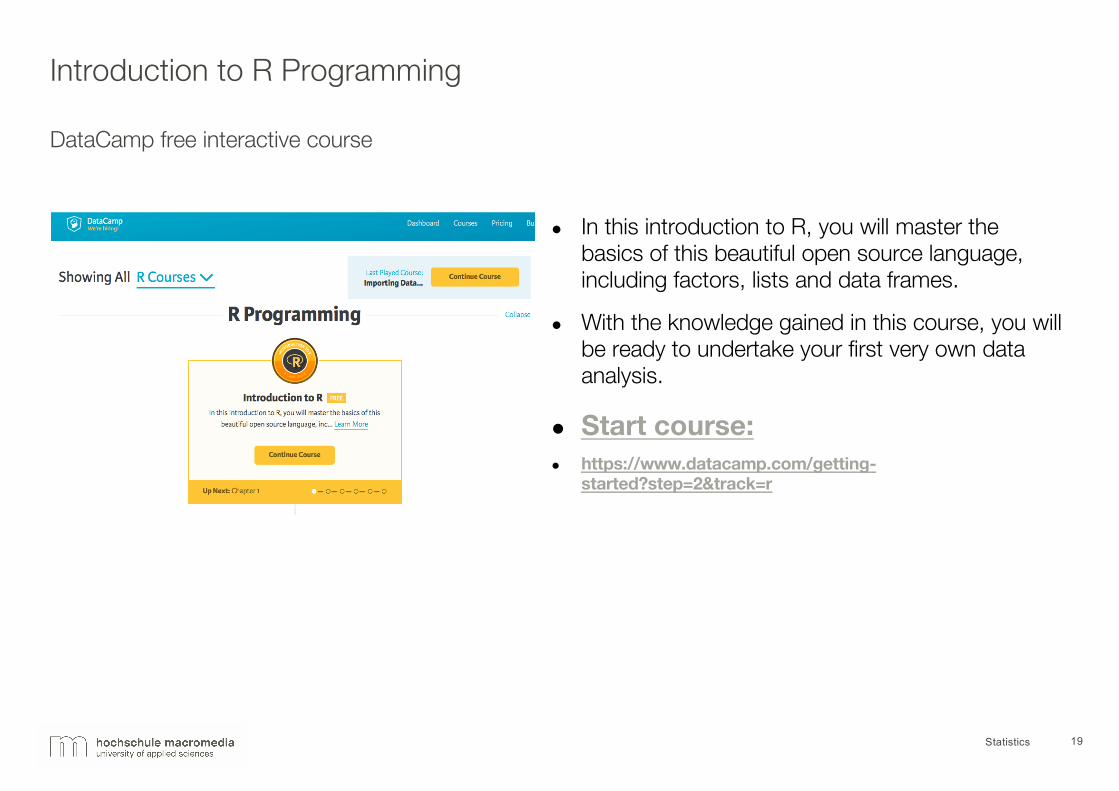
Introduction to R Programming
l In this introduction to R, you will master thebasics of this beautiful open source language, including factors, lists and data frames.
l With the knowledge gained in this course, you will be ready to undertake your first very own dataanalysis.
l Start course:l https://www.datacamp.com/getting-
started?step=2&track=r
19
DataCamp free interactive course
Statistics
Introduction to R Programming
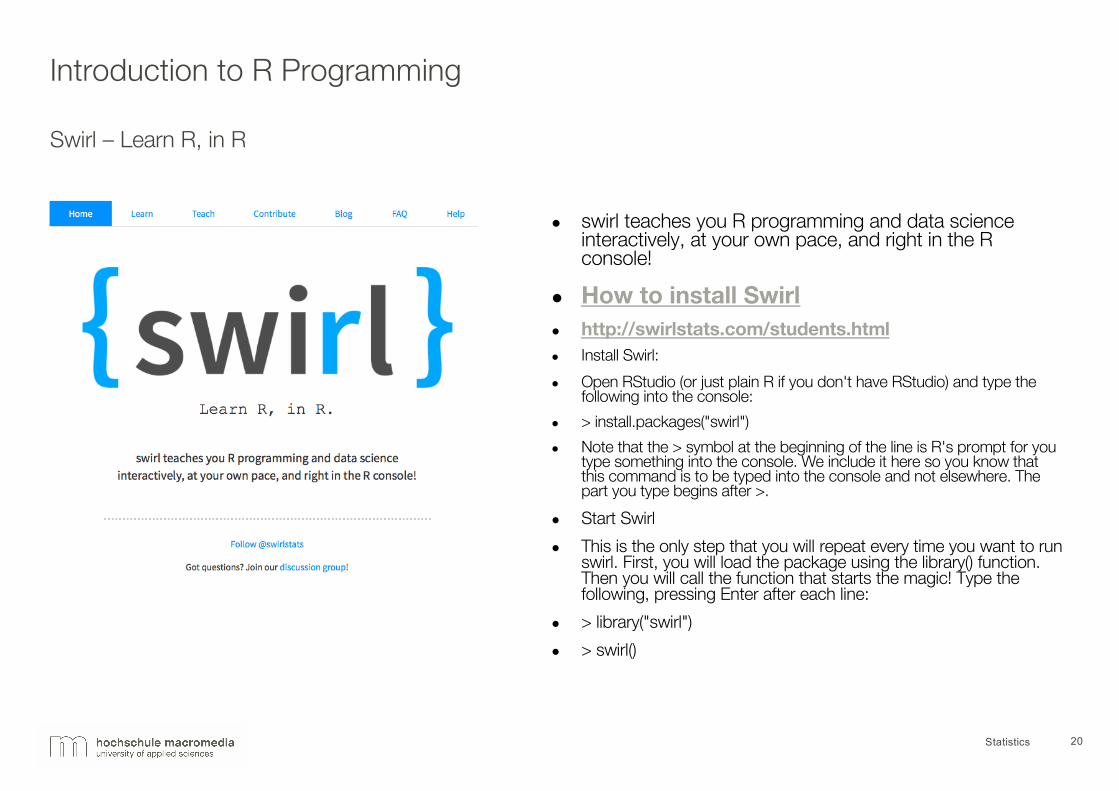
l swirl teaches you R programming and data scienceinteractively, at your own pace, and right in the R console!
l How to install Swirll http://swirlstats.com/students.htmll Install Swirl:l Open RStudio (or just plain R if you don't have RStudio) and type the
following into the console:l > install.packages("swirl")l Note that the > symbol at the beginning of the line is R's prompt for you
type something into the console. We include it here so you know thatthis command is to be typed into the console and not elsewhere. The part you type begins after >.
l Start Swirll This is the only step that you will repeat every time you want to run
swirl. First, you will load the package using the library() function. Then you will call the function that starts the magic! Type thefollowing, pressing Enter after each line:
l > library("swirl")l > swirl()
20
Swirl – Learn R, in R

Statistics
Introduction to R Programming
21
Useful ressources
Grolemund, G & Wickham, H. (2016). R for Data Science. http://r4ds.had.co.nz/introduction.html
Irizarry, R. A. & Love, M. I. (2015). Data Analysis for the Life Sciences. https://leanpub.com/dataanalysisforthelifesciences
Teetor, P. (2011). R Cookbook. Sebastopol, CA: O’Reilly Media. http://ase.tufts.edu/bugs/guide/assets/R%20Cookbook.pdf