Introduction to NHDPlus: A Framework for Advanced Water Applications Cindy McKay Horizon Systems...
34
Introduction to NHDPlus: A Framework for Advanced Water Applications Cindy McKay Horizon Systems Corporation
-
Upload
maria-haynes -
Category
Documents
-
view
214 -
download
1
Transcript of Introduction to NHDPlus: A Framework for Advanced Water Applications Cindy McKay Horizon Systems...

Introduction to NHDPlus: A Framework for
Advanced Water Applications
Introduction to NHDPlus: A Framework for
Advanced Water Applications
Cindy McKay
Horizon Systems Corporation
Cindy McKay
Horizon Systems Corporation
22
NHDPlusNHDPlus
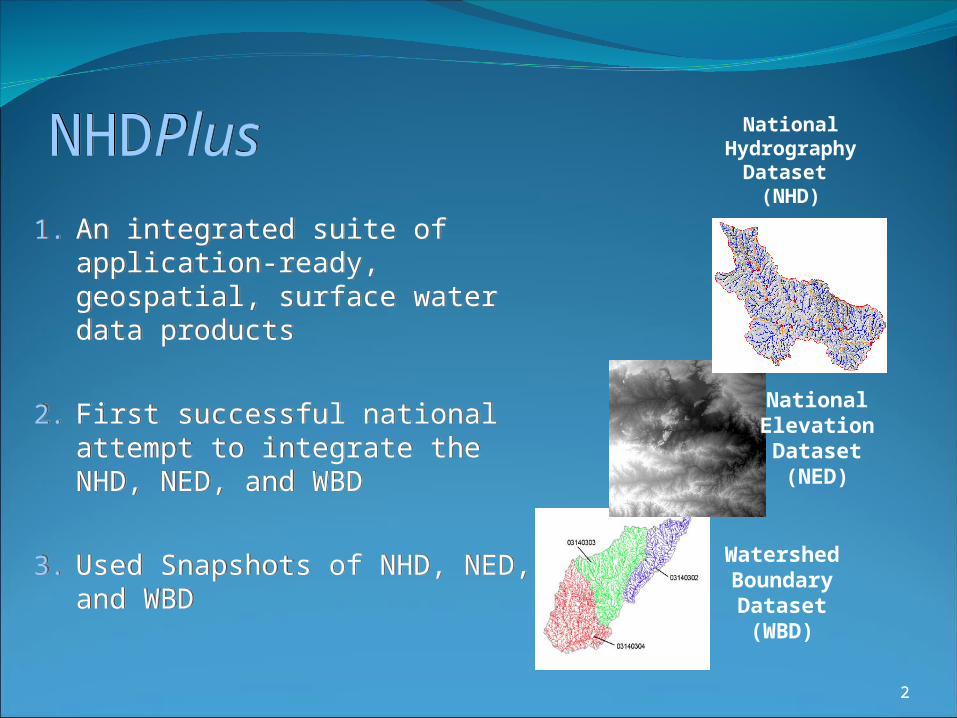
1. An integrated suite of application-ready, geospatial, surface water data products
2. First successful national attempt to integrate the NHD, NED, and WBD
3. Used Snapshots of NHD, NED, and WBD
1. An integrated suite of application-ready, geospatial, surface water data products
2. First successful national attempt to integrate the NHD, NED, and WBD
3. Used Snapshots of NHD, NED, and WBD
National Elevation Dataset (NED)
National Hydrography
Dataset (NHD)
Watershed Boundary Dataset (WBD)
33
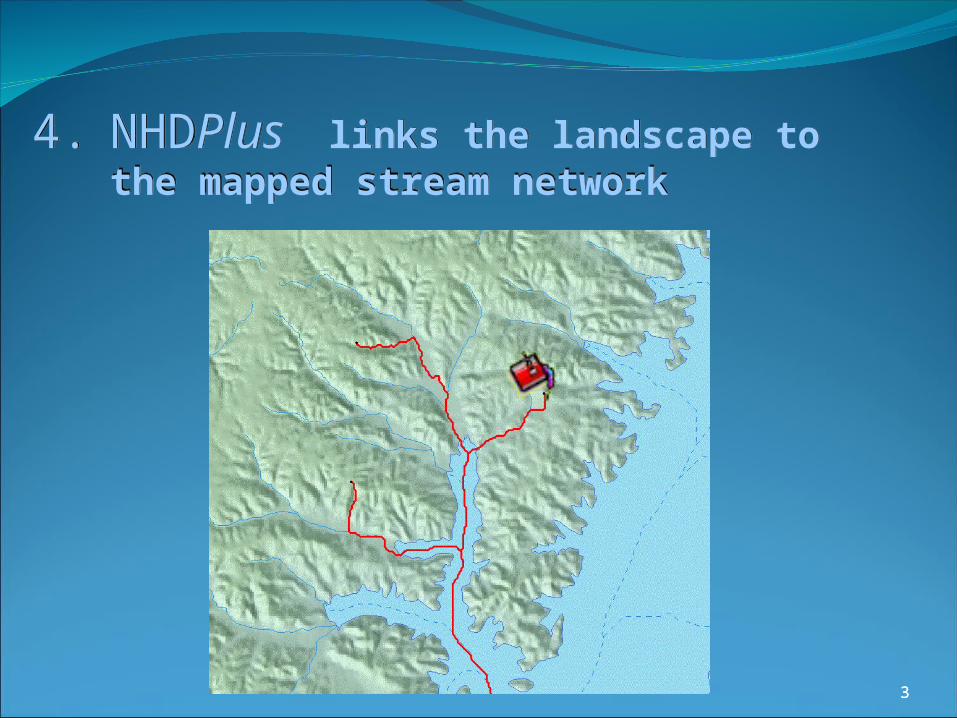
4. NHDPlus links the landscape to the mapped stream network
4. NHDPlus links the landscape to the mapped stream network
44
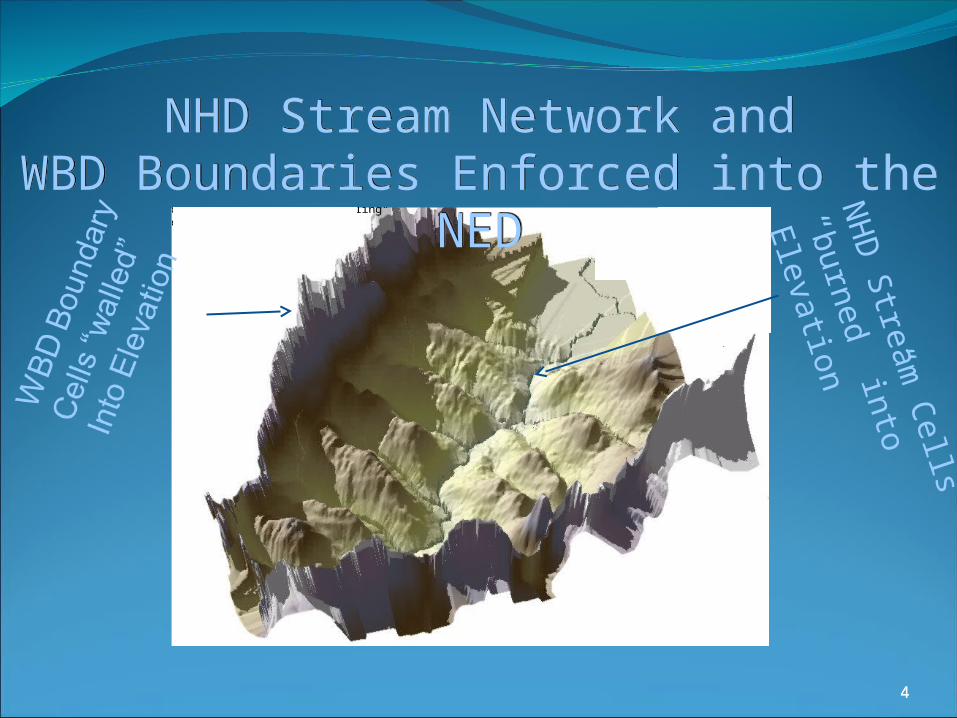
Watershed Boundary Dataset (WBD)added to DEM surface in "walling"technique
NHD stream cellssubtracted fromDEM surface in "burning"technique
NHD Stream Network andWBD Boundaries Enforced into the NED
NHD Stream Network andWBD Boundaries Enforced into the NED
NH
D S
tream C
ells
“burned” into
Elevation
55
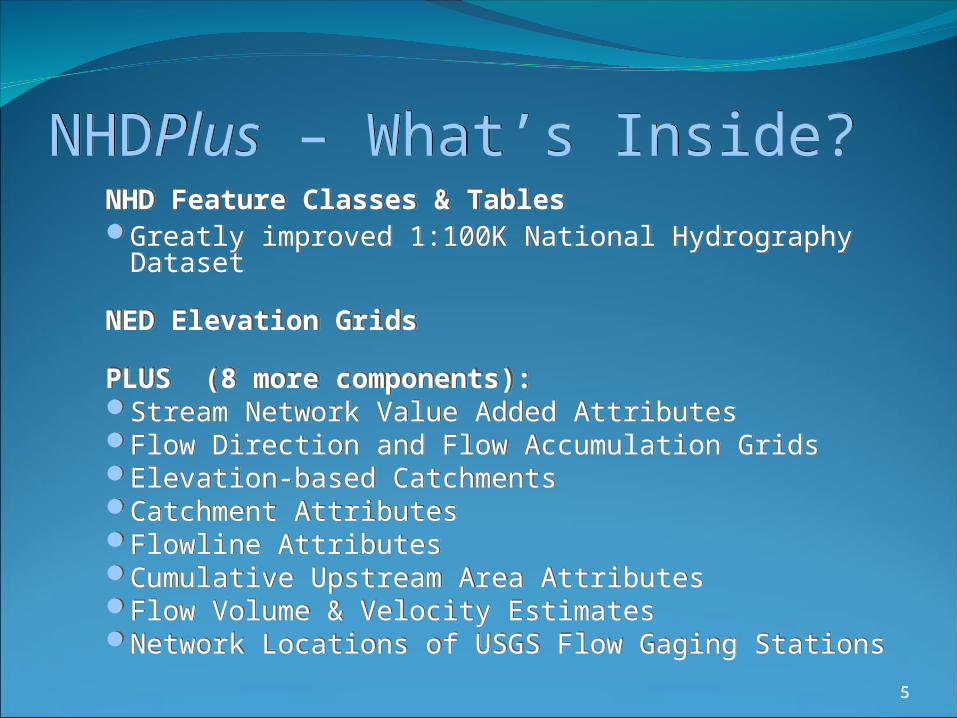
NHDPlus – What’s Inside?NHDPlus – What’s Inside?NHD Feature Classes & TablesGreatly improved 1:100K National Hydrography Dataset
NED Elevation Grids
PLUS (8 more components):Stream Network Value Added AttributesFlow Direction and Flow Accumulation GridsElevation-based CatchmentsCatchment AttributesFlowline AttributesCumulative Upstream Area AttributesFlow Volume & Velocity EstimatesNetwork Locations of USGS Flow Gaging Stations
NHD Feature Classes & TablesGreatly improved 1:100K National Hydrography Dataset
NED Elevation Grids
PLUS (8 more components):Stream Network Value Added AttributesFlow Direction and Flow Accumulation GridsElevation-based CatchmentsCatchment AttributesFlowline AttributesCumulative Upstream Area AttributesFlow Volume & Velocity EstimatesNetwork Locations of USGS Flow Gaging Stations
6
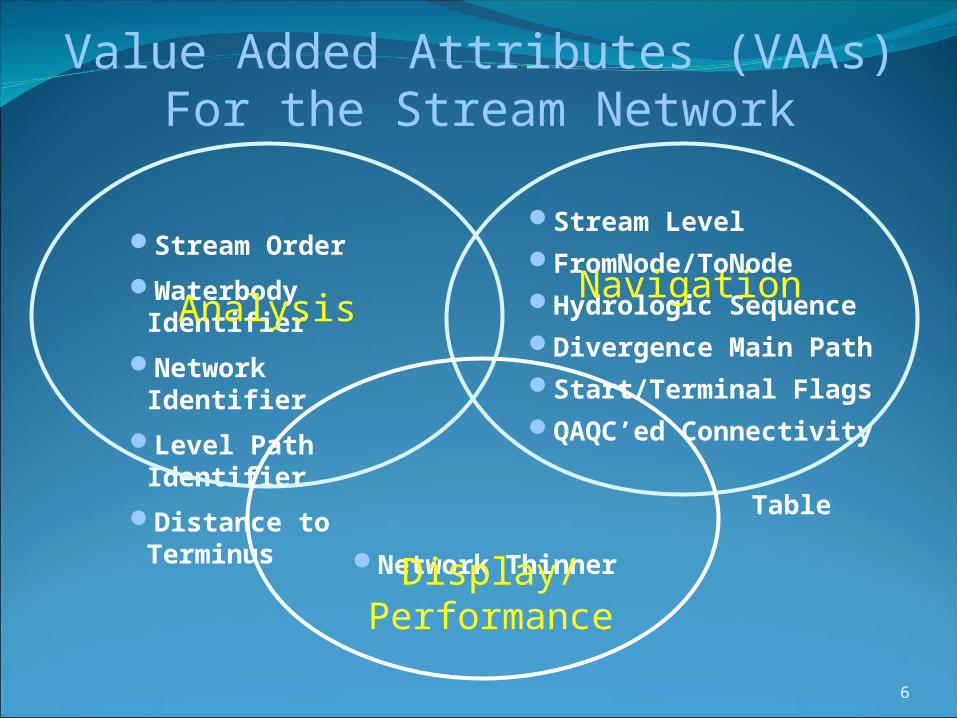
Stream Order
Waterbody Identifier
Network Identifier
Level Path Identifier
Distance to Terminus
Stream Level FromNode/ToNodeHydrologic SequenceDivergence Main PathStart/Terminal FlagsQAQC’ed Connectivity
Table
Network Thinner
NavigationAnalysis
Display/Performance
Value Added Attributes (VAAs)For the Stream Network
7
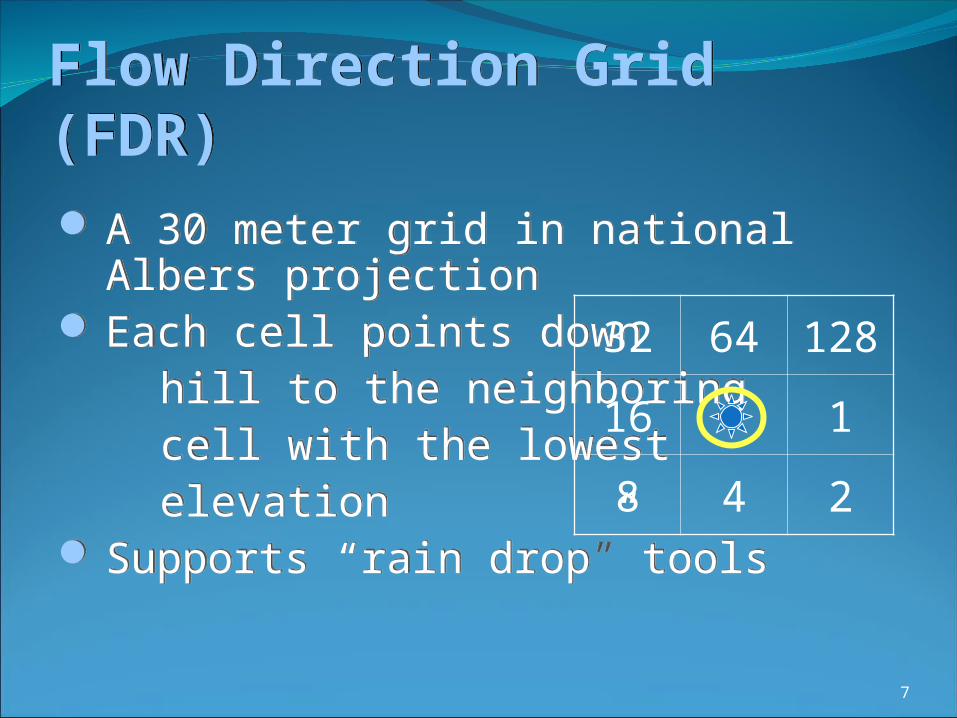
Flow Direction Grid (FDR)Flow Direction Grid (FDR) A 30 meter grid in national Albers
projection Each cell points down hill to the neighboring cell with the lowest elevation Supports “rain drop” tools
A 30 meter grid in national Albers projection
Each cell points down hill to the neighboring cell with the lowest elevation Supports “rain drop” tools
32 64 128
16 1
8 4 2
88
Flow Accumulation Grid (FAC)Flow Accumulation Grid (FAC)
A 30 meter grid in national Albers projection
Each cell contains a count of the number of grid cells that drain to that cell
Used to generate a elevation-based “synthetic” stream network
Used to guide basin delineation
A 30 meter grid in national Albers projection
Each cell contains a count of the number of grid cells that drain to that cell
Used to generate a elevation-based “synthetic” stream network
Used to guide basin delineation
9
Catchments for Each Stream SegmentCatchments for Each Stream Segment
Definition: The portion of the land surface that drains to a network segment
NHDPlus includes catchments in grid format and as polygons
Definition: The portion of the land surface that drains to a network segment
NHDPlus includes catchments in grid format and as polygons

10
Catchments for Each Coastline SegmentCatchments for Each Coastline Segment
1111
Catchment AttributesCatchment Attributes
Mean Annual Temperature (Prism - 4km)
Mean Annual Precipitation (Prism - 4km)
% of each of the 21 land use classifications from the 1992 National Land Cover Dataset (NLCD)
Headwater Node Area
Mean Annual Temperature (Prism - 4km)
Mean Annual Precipitation (Prism - 4km)
% of each of the 21 land use classifications from the 1992 National Land Cover Dataset (NLCD)
Headwater Node Area
1212
Flowline AttributesFlowline Attributes
Raw minimum/maximum elevations
Smoothed minimum/maximum elevations
Slope
Raw minimum/maximum elevations
Smoothed minimum/maximum elevations
Slope
1313
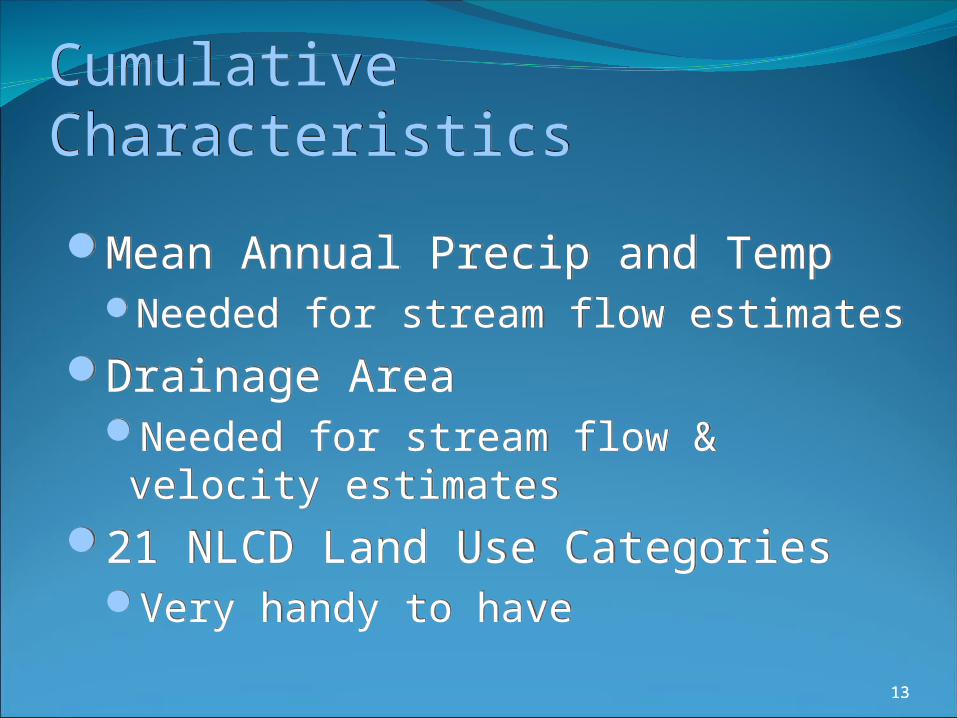
Cumulative CharacteristicsCumulative Characteristics
Mean Annual Precip and TempNeeded for stream flow estimates
Drainage AreaNeeded for stream flow & velocity
estimates
21 NLCD Land Use CategoriesVery handy to have
Mean Annual Precip and TempNeeded for stream flow estimates
Drainage AreaNeeded for stream flow & velocity
estimates
21 NLCD Land Use CategoriesVery handy to have
1414
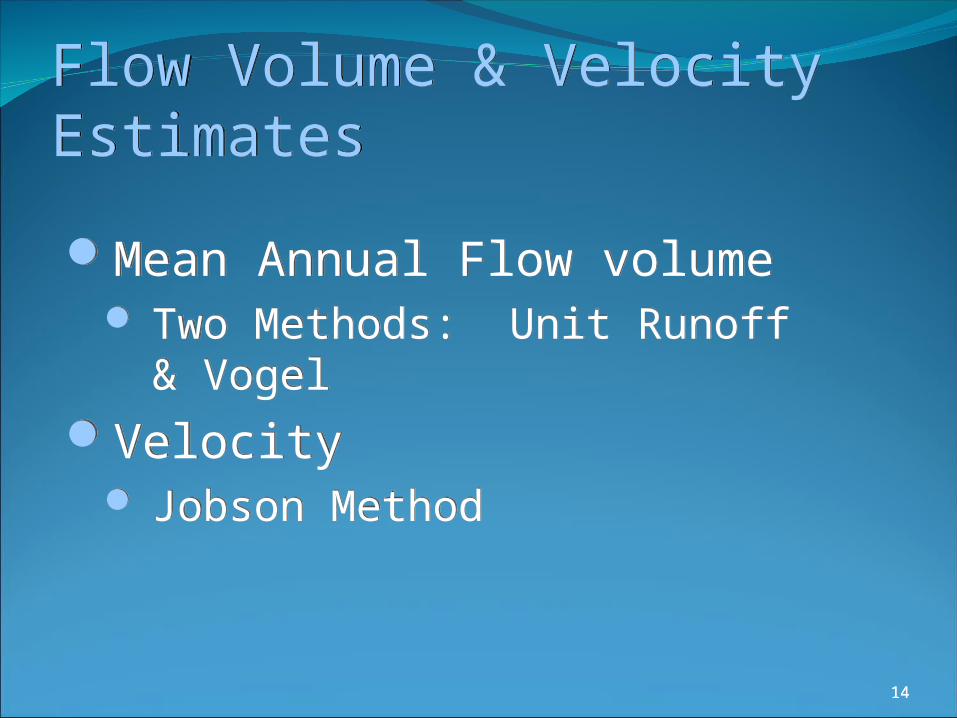
Flow Volume & Velocity EstimatesFlow Volume & Velocity Estimates
Mean Annual Flow volume Two Methods: Unit Runoff &
Vogel
Velocity Jobson Method
Mean Annual Flow volume Two Methods: Unit Runoff &
Vogel
Velocity Jobson Method
15
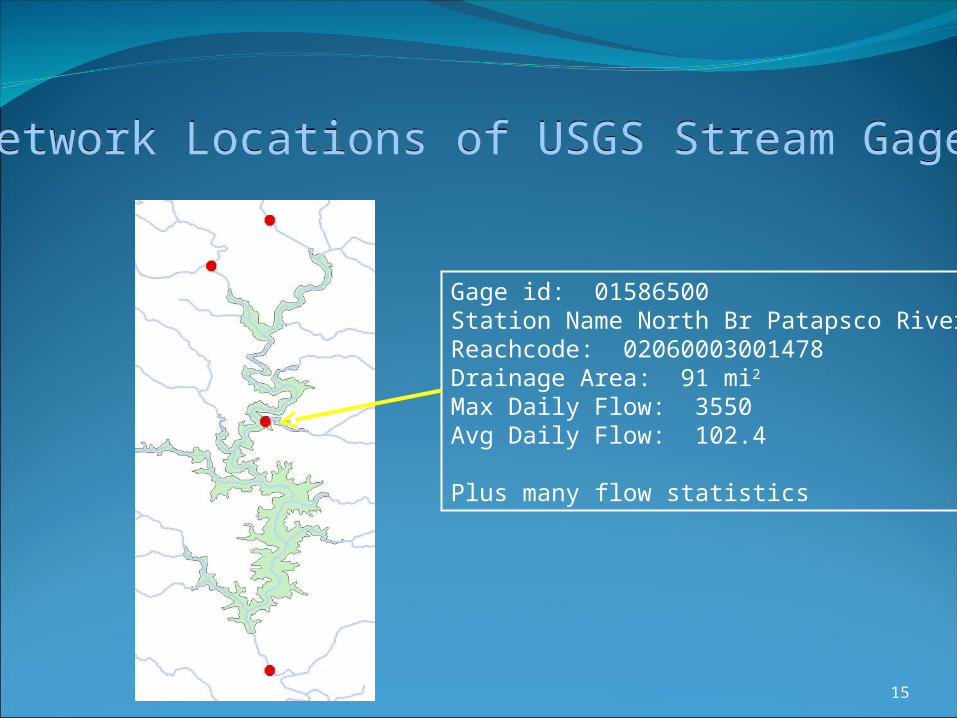
Gage id: 01586500Station Name North Br Patapsco RiverReachcode: 02060003001478Drainage Area: 91 mi2
Max Daily Flow: 3550Avg Daily Flow: 102.4
Plus many flow statistics
Network Locations of USGS Stream GagesNetwork Locations of USGS Stream Gages
16
17
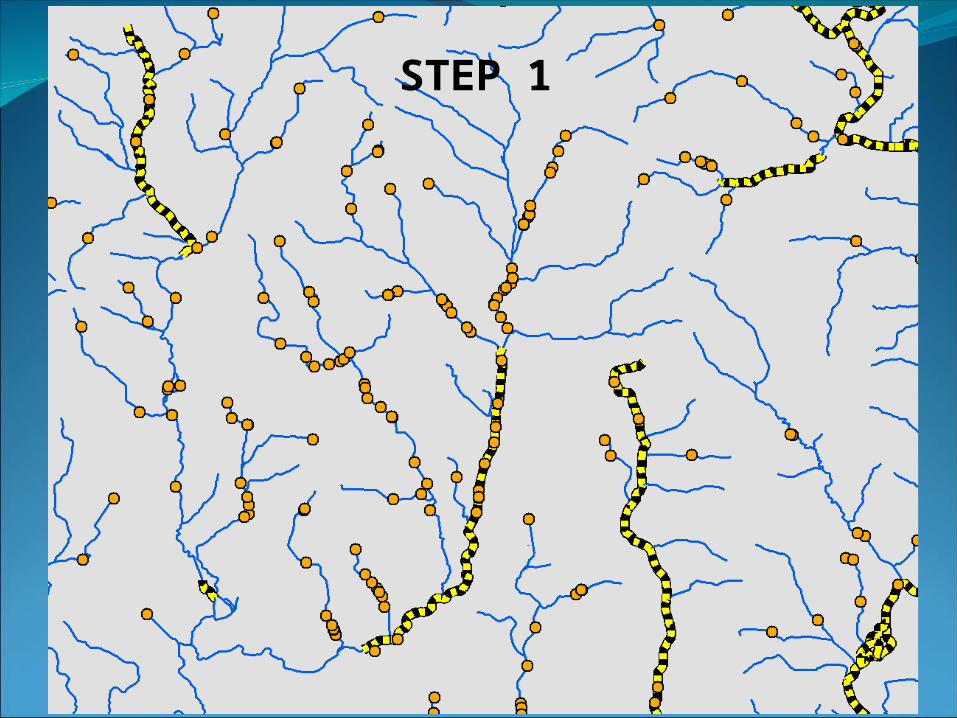
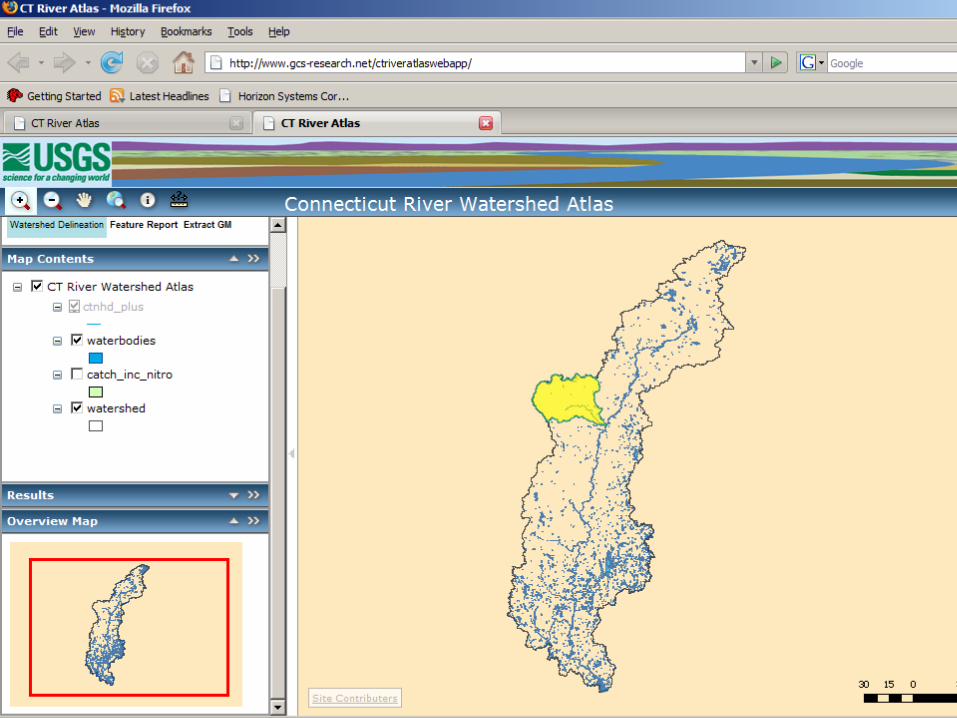
STEP 1
18
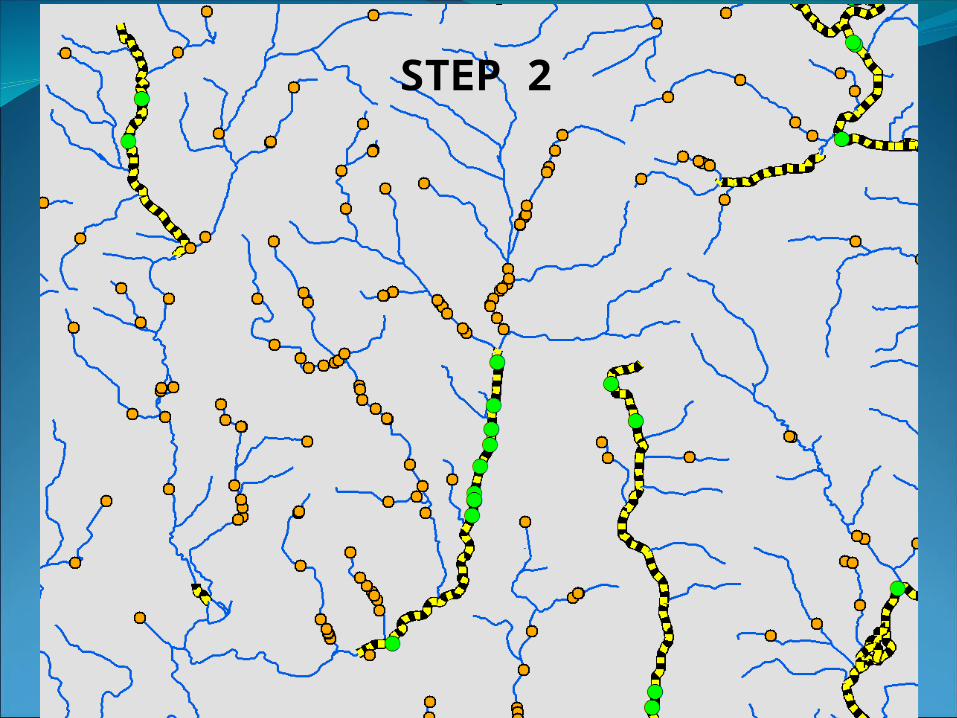
STEP 2
19
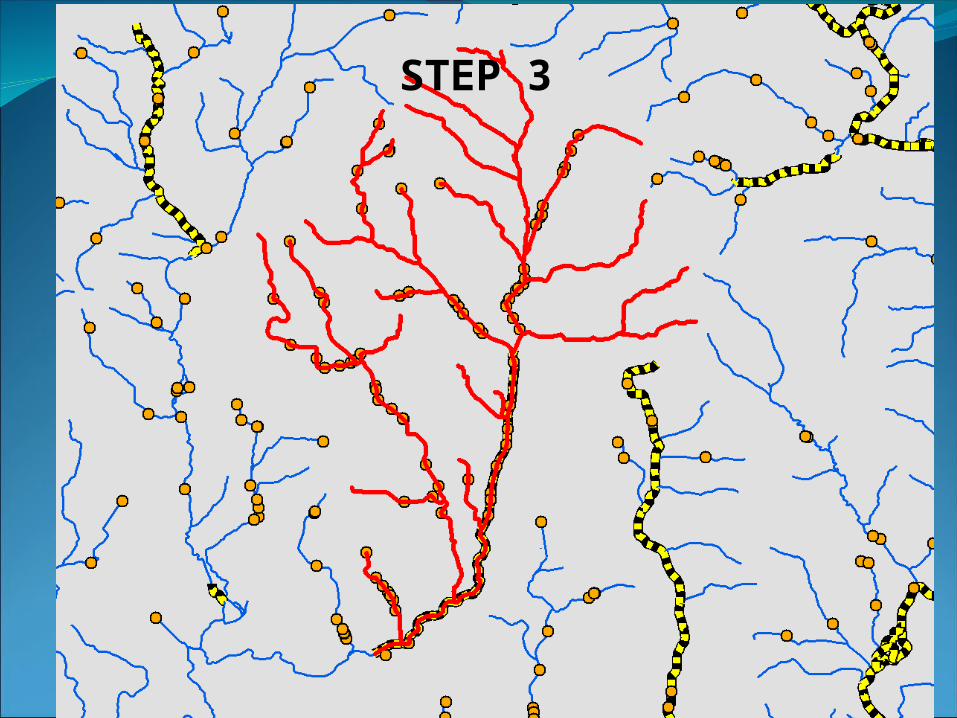
STEP 3
20
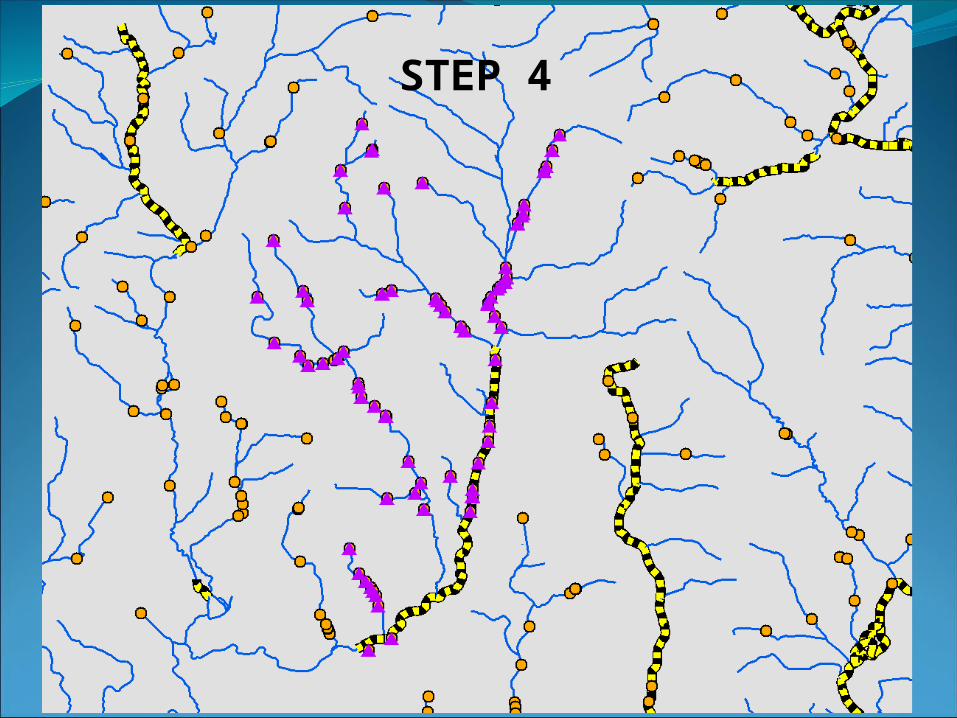
STEP 4

21
STEP 5
22
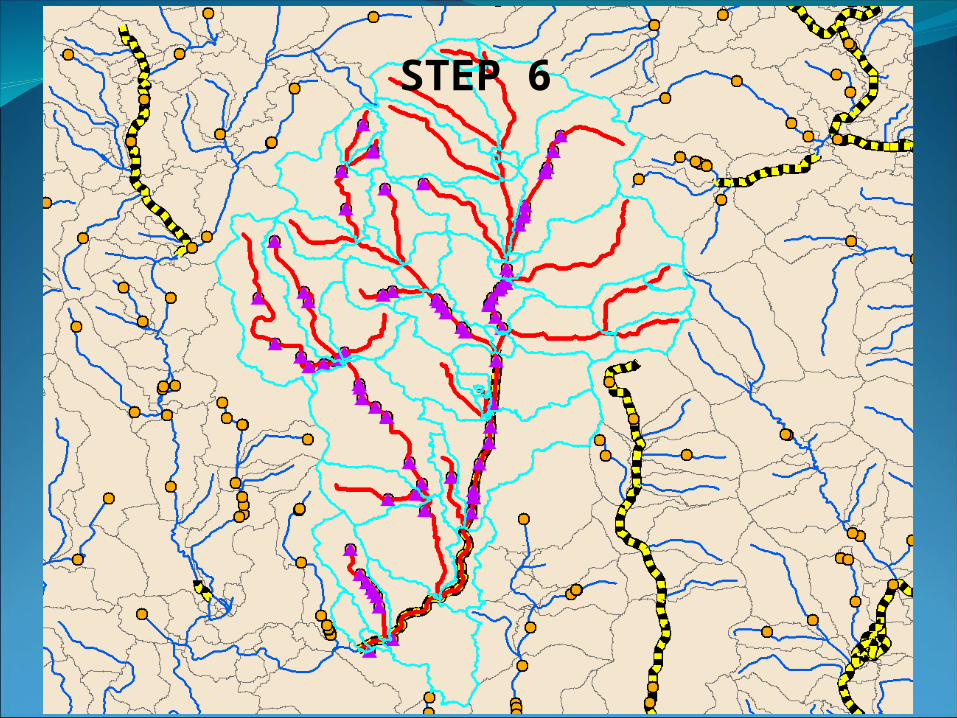
STEP 6
23
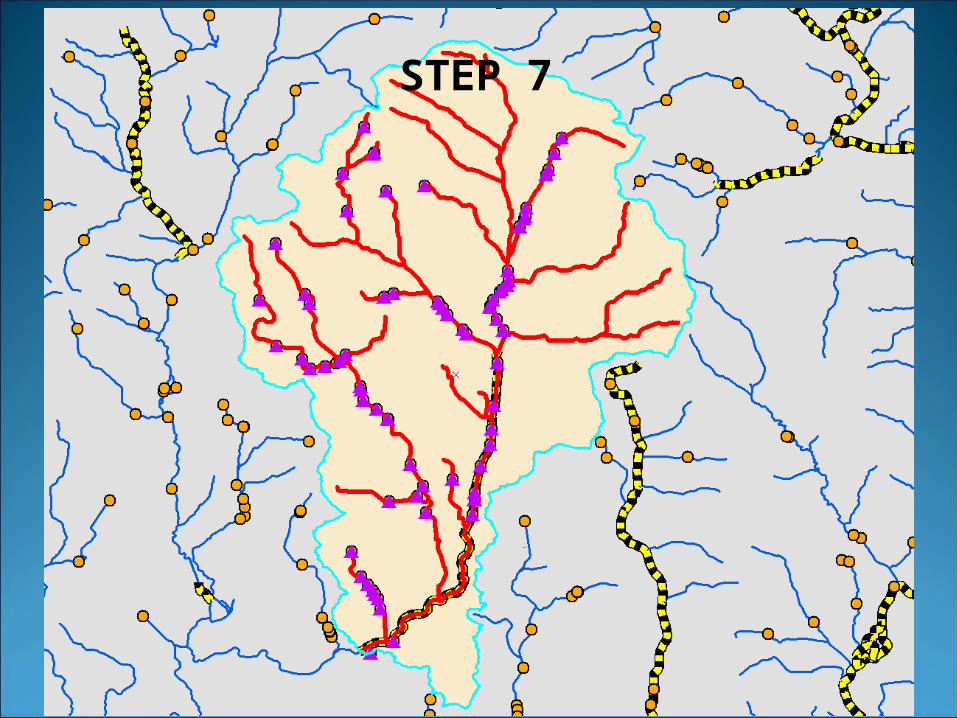
STEP 7
24
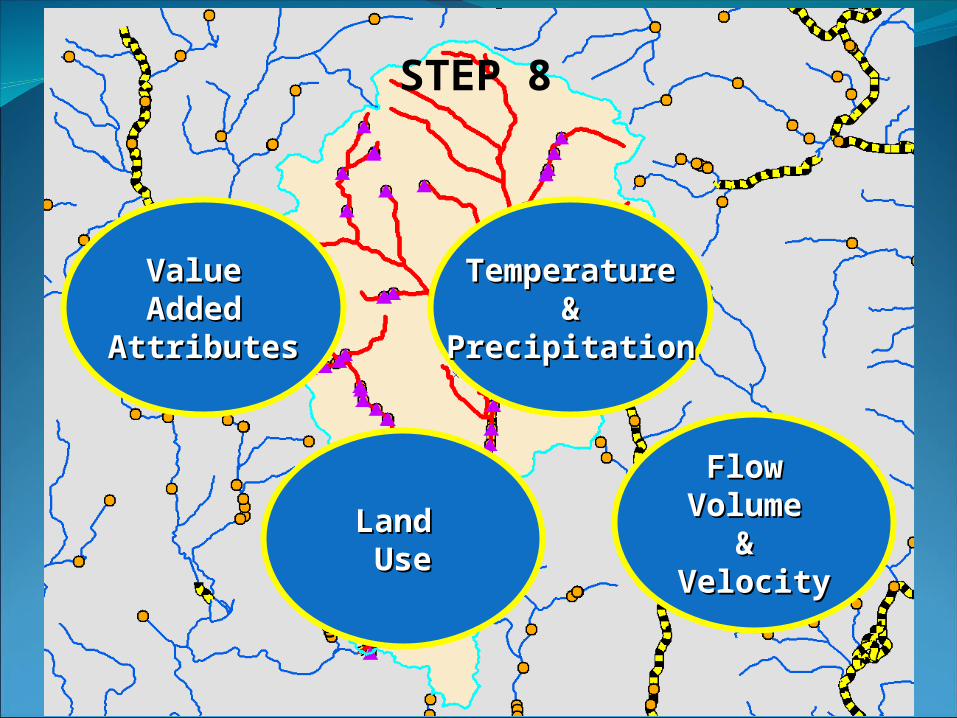
Value Value Added Added
AttributesAttributes
TemperatureTemperature&&
PrecipitationPrecipitation
Land Land UseUse
Flow Flow Volume Volume
& & VelocityVelocity
STEP 8
25
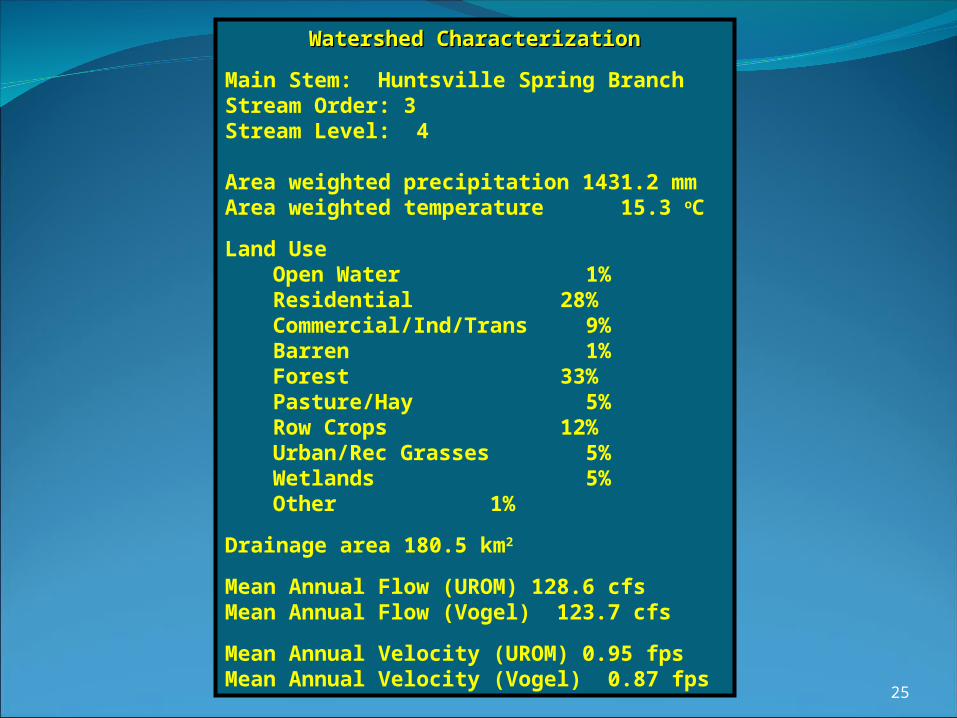
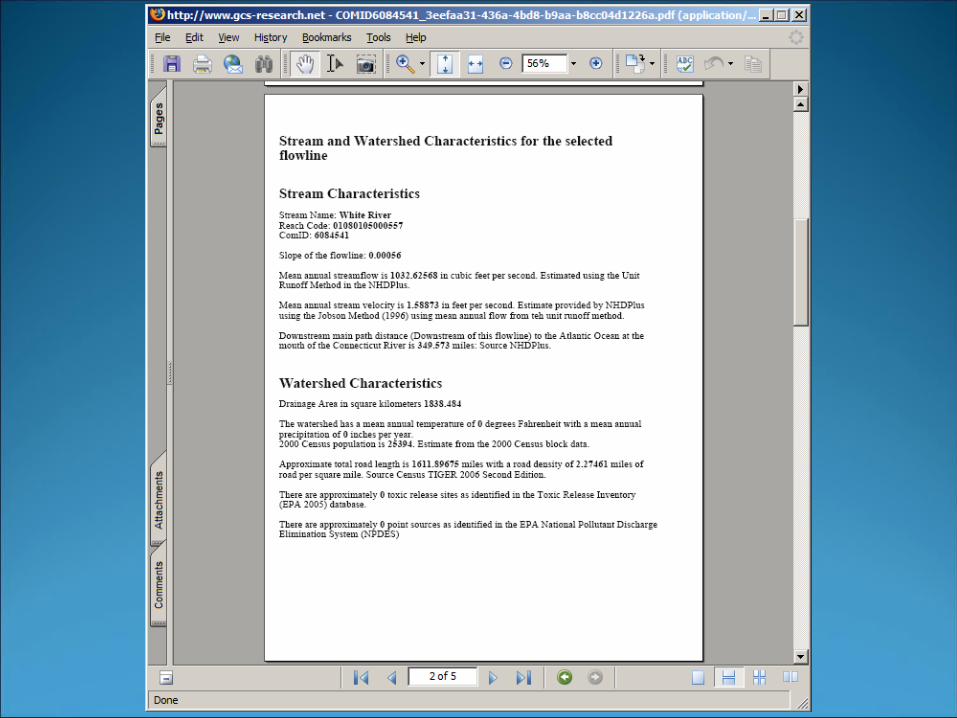
Watershed CharacterizationWatershed Characterization
Main Stem: Huntsville Spring BranchStream Order: 3Stream Level: 4
Area weighted precipitation 1431.2 mmArea weighted temperature 15.3 oC
Land UseOpen Water 1%Residential 28%Commercial/Ind/Trans 9%Barren 1%Forest 33%Pasture/Hay 5%Row Crops 12%Urban/Rec Grasses 5%Wetlands 5%Other 1%
Drainage area 180.5 km2
Mean Annual Flow (UROM) 128.6 cfsMean Annual Flow (Vogel) 123.7 cfs
Mean Annual Velocity (UROM) 0.95 fpsMean Annual Velocity (Vogel) 0.87 fps
26


3434
http://nsdi.epa.gov/waters/Click on the “NHDPlus” Linkhttp://nsdi.epa.gov/waters/Click on the “NHDPlus” Link
Questions?Questions?