Introduction to Microeconomics -...
24
1 Introduction to Microeconomics Dr. Matan (matan [email protected]) Office hours: Tuesdays 16:30-17:30 or by appointment. Lectures: Tuesdays 15:00- 16:30 (HS 14) and Thursdays 11:30-13:00 (HS 6) Tutorials: Fridays 15:00-16:30 (class room changes). You can go to the tutorials of the other group on Wednesdays 15-16:30 (German) Grading: Weekly Quizzes (15%) Midterm exam (36%): 30/04, 08:00-09:30 Final exam (49%): 27/06, 15:00-16:30 Main textbook: Microeconomics by David Besanko and Ronald R. Braeutigam Wiley, 4 th edition. Website: Matan’s homepage, Moodle
Transcript of Introduction to Microeconomics -...
1
Introduction to Microeconomics
Dr. Matan ([email protected])Office hours: Tuesdays 16:30-17:30 or by appointment.
Lectures: Tuesdays 15:00- 16:30 (HS 14) and Thursdays 11:30-13:00 (HS 6)
Tutorials: Fridays 15:00-16:30 (class room changes). You can go to the tutorials of the other group on Wednesdays 15-16:30 (German)
Grading: Weekly Quizzes (15%) Midterm exam (36%): 30/04, 08:00-09:30 Final exam (49%): 27/06, 15:00-16:30
Main textbook: Microeconomics by David Besanko and Ronald R. Braeutigam Wiley, 4th
edition.
Website: Matan’s homepage, Moodle

2
What is Economics?
• “The branch of knowledge concerned with the production, consumption, and
transfer of wealth”
Online dictionary
• “Economics is the study of people in the ordinary business of life”
Marshall
• Economics is the “study of how societies use scarce resources to produce
valuable commodities and distribute them among different people”
Samuelson
• “Economics is organized common sense”
Sargent

3
Introduction to Microeconomics
Microeconomics: start with individual behavior of consumers and producers, and thenstudy markets.
Main Topics:1. Consumer Theory2. Producer Theory3. Competitive Equilibrium4. Monopoly5. Oligopoly
Technical tools: Basic algebra and multivariable calculus

4
Quantity
Price
0
Supply
Demand
•
Q
P
1. Construct demand curve (behavior of consumers)
Course Outline: Roadmap
2. Construct the supply curve (behavior of firms)
3. Study properties of an equilibrium in competitive markets
4. What happens when the market is not competitive?
5
Key questions:
What determines consumer demand? How do consumers make choices?
First Topic: Consumer Demand

6
Consumer Preferences
Units of Food
Units of Clothing
0 3
•
2
7
Bundle A10
Bundle B•
•Bundle C
12
3
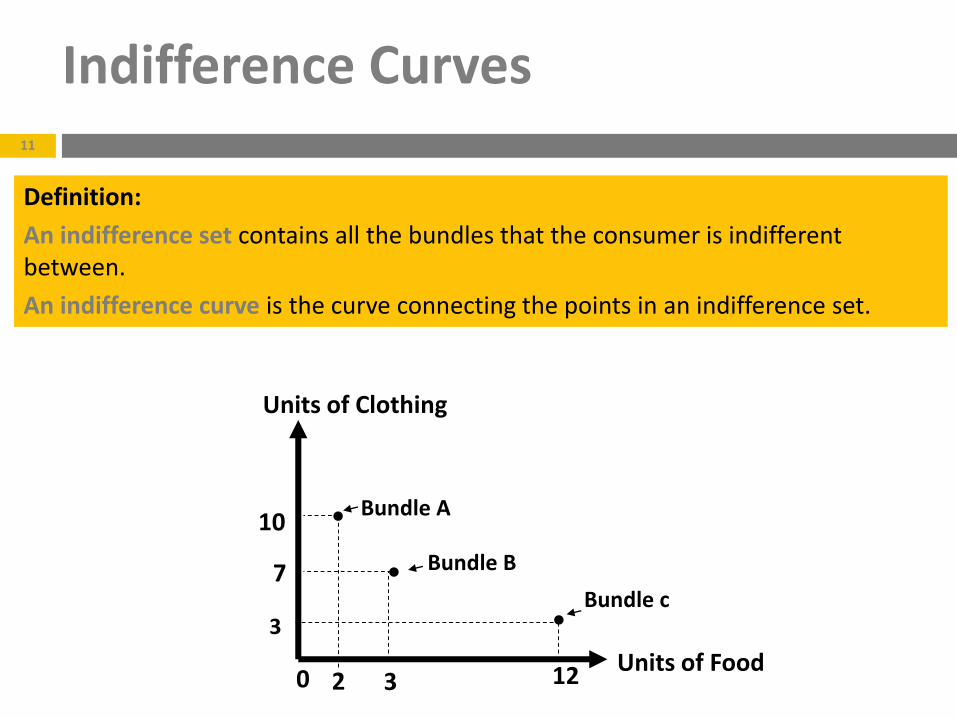
Definition: A bundle of goods (or basket) is a combination of different goods and different quantities.

7
Consumer Preferences
Definition: Consumer preferences tell us how a consumer ranks any two bundles of goods, assuming these bundles are available at no cost.
Preferences are answers to all possible questions like:“Do you prefer 10 apples and 7 oranges, to 7 apples and 10 oranges?”a. Yesb. No, I prefer 7 apples and 10 orangesc. I’m indifferent
Preferences are subjective. Preferences are independent of the price. Preferences are set for a specific time and circumstances.

8
The consumer can rank any two bundles of goods
- A preferred to B;
- B preferred to A;
- Indifferent between A and B.
If a consumer prefers bundle A to bundle B, and bundle B to bundle C, then shemust prefer bundle A to bundle C.
If bundle A has at least as much of each good as bundle B, with more of at least one good,then A is preferred to B: (10 apples, 3 oranges) is preferred to (10 apples, 2 oranges).
Everyone has their own taste, but we assume that preferences satisfy someproperties:
1. Preferences are complete:
2. Preferences are transitive:
3. Preferences are monotonic: “more is better”.
Consumer Preferences

9
Monotonicity
Units of Food
Units of Clothing
0 3
7
•
•
A
•
•
•
B
C E
FMore preferred to A
Less preferred to A
Monotonicity implies “more of all goods is better”

10
Definition: Preferences are rational if they are complete and transitive.
Consumer Preferences
11
Indifference Curves
Units of Food
Units of Clothing
0 3
•
2
7
Bundle A10
Bundle B•
•Bundle c
12
3
Definition:
An indifference set contains all the bundles that the consumer is indifferent between.
An indifference curve is the curve connecting the points in an indifference set.

12
Indifference Curves
Definition:
An indifference set contains all the bundles that the consumer is indifferent between.
An indifference curve is the curve connecting the points in an indifference set.
Units of Food
Units of Clothing
0 3
•
2
7
Bundle A10
Bundle B•
•Bundle c
12
3

13
Indifference Curves
Units of Food
Units of Clothing
0 3
•
7 •
••
••
•
•
•
Definition:
An indifference map is a set of all indifference curves.

14
Indifference Curves
Units of Food
Units of Clothing
0 3
7
•
•
A
•
•
•
B
C E
F
Property 1: Indifference curves are downward-sloping.
More preferred to A
Less preferred to A
Implied by monotonicity (“more is better”)
15
Indifference Curves
Units of Food
Units of Clothing
0
•
•
•
•
•
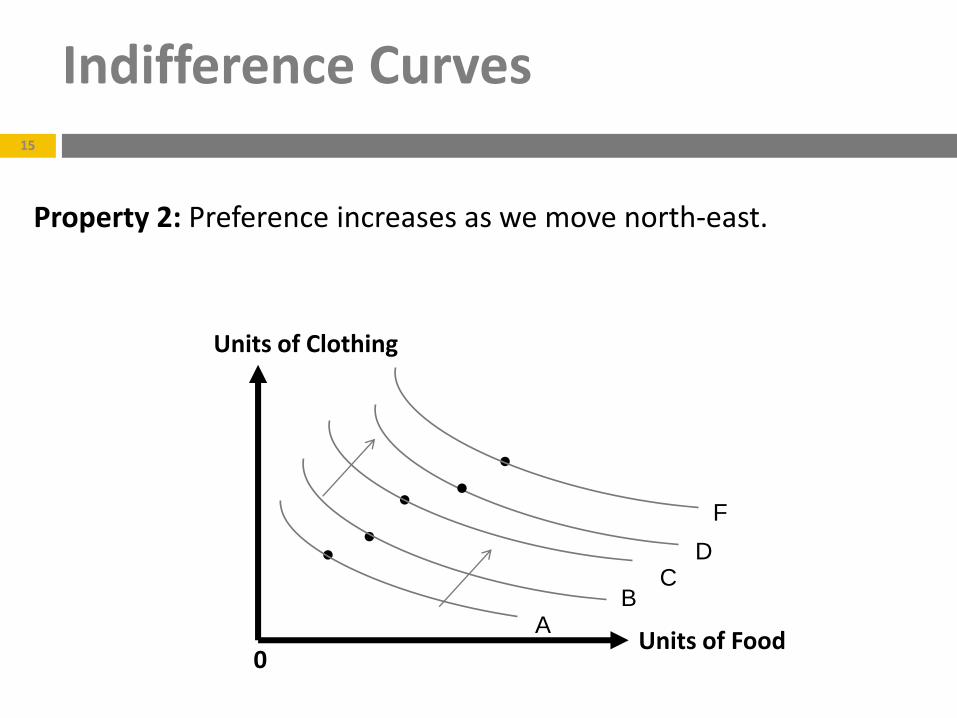
Property 2: Preference increases as we move north-east.
A
D
F
CB
16
Indifference Curves
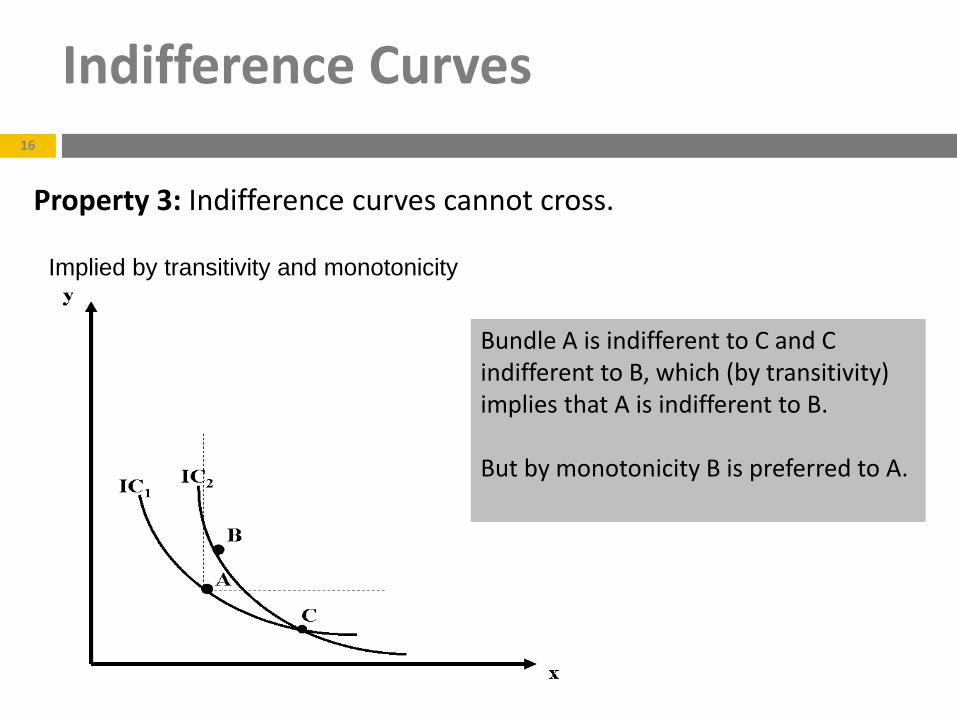
Property 3: Indifference curves cannot cross.
Implied by transitivity and monotonicity
Bundle A is indifferent to C and C indifferent to B, which (by transitivity) implies that A is indifferent to B.
But by monotonicity B is preferred to A.
17
Indifference Curves
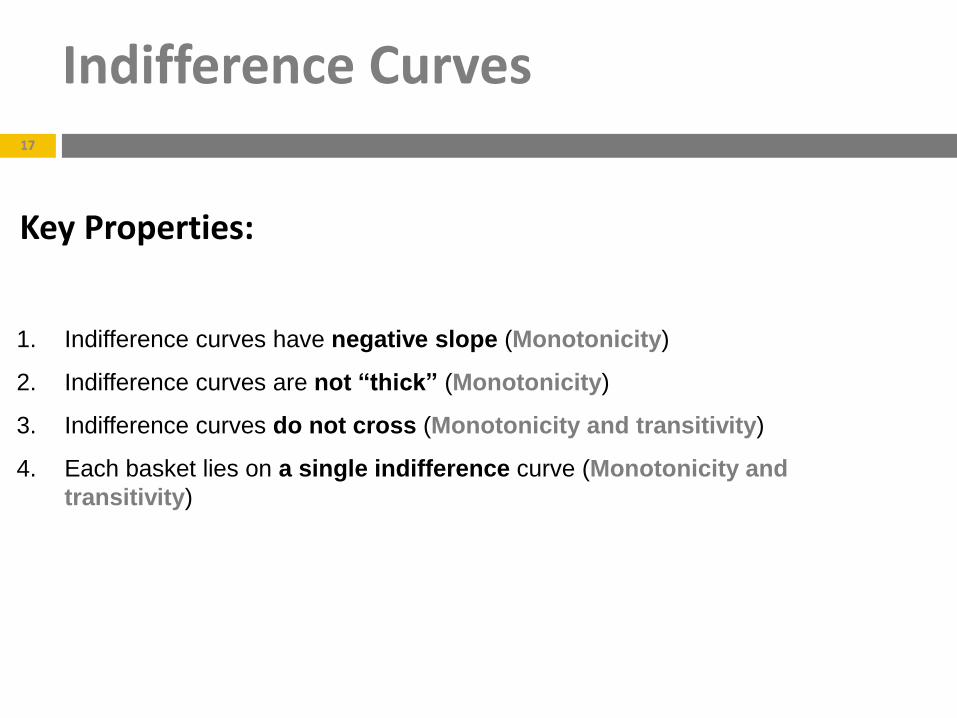
Key Properties:
1. Indifference curves have negative slope (Monotonicity)
2. Indifference curves are not “thick” (Monotonicity)
3. Indifference curves do not cross (Monotonicity and transitivity)
4. Each basket lies on a single indifference curve (Monotonicity and
transitivity)

18
Marginal Rate of Substitution
Key property: the indifference curve tells us how the consumer is willing to
exchange good y for good x (and vice versa). That is, the amount of good y that the
consumer is willing to trade for an additional amount of good x.
Y
X
A∆x
How much Y is the consumer
willing to give up for additional ∆x?
•
∆y
•B

19
Marginal Rate of Substitution
Key property: the indifference curve tells us how the consumer is willing to
exchange good y for good x (and vice versa). That is, the amount of good y that the
consumer is willing to trade for an additional amount of good x.
Y
X
A•
∆x•
∆yB
How much Y is the consumer
willing to give up for additional ∆x?

20
Marginal Rate of Substitution
Key property: the indifference curve tells us how the consumer is willing to
exchange good y for good x (and vice versa). That is, the amount of good y that the
consumer is willing to trade for an additional amount of good x.
Y
X
A∆x
•
∆y
•B
The slope of the line connecting points A and B
is (−∆y∆x)

21
Marginal Rate of Substitution
Definition: At bundle A, the marginal rate of substitution between good x and
good y, denoted MRSx,y(A), is the the negative of the slope of the indifference
curve that goes through bundle A.
Y
X
A∆x•
∆y•BThe slope of the line
connecting points A and B
is (−∆y∆x)

22
Marginal Rate of Substitution
The marginal rate of substitution measures the willingness to exchange good y for
good x at a given bundle
The MRS depends on the level of consumption.

23
Marginal Rate of Substitution
Properties of MRS:
If the MRS diminishes along an indifference curve as we increase the consumption of x, then the more of good x you have, the less of y you are willing to substitute for it.
The indifference curves get “flatter” as we increase x.In other words, ICs are bowed towards the origin.

24
Marginal Rate of Substitution
Properties of MRS:
If averages are preferred to extremes then the MRS diminishes and indifference curves are bowed towards the origin (convex to the origin).