Introduction to MaxQuant Software for Proteomics · PDF fileIntroduction to MaxQuant Software...
24
© 2009 Regents of the University of Minnesota. All rights reserved. Supercomputing Institute for Advanced Computational Research Introduction to MaxQuant Software for Proteomics Pratik Jagtap (MSI) Rongxiao Sa (Department of Chemistry)
Transcript of Introduction to MaxQuant Software for Proteomics · PDF fileIntroduction to MaxQuant Software...
© 2009 Regents of the University of Minnesota. All rights reserved.
Supercomputing Institute for Advanced Computational Research
Introduction to MaxQuant Software for Proteomics
Pratik Jagtap (MSI) Rongxiao Sa (Department of Chemistry)

© 2009 Regents of the University of Minnesota. All rights reserved.
Supercomputing Institute for Advanced Computational Research
“MaxQuant enables high peptide identification rates, individualized p.p.b.-range mass accuracies and proteome-wide protein quantification.” Cox J, Mann M. Nat Biotechnol. 2008; 26(12):1367-1372. http://www.ncbi.nlm.nih.gov/pubmed/19029910
“A practical guide to the MaxQuant computational platform for SILAC-based quantitative proteomics.” Cox J, Matic I, Hilger M, Nagaraj N, Selbach M, Olsen JV, Mann M. Nat Protoc. 2009;4(5):698-705. http://www.ncbi.nlm.nih.gov/pubmed/19373234
“Computational principles of determining and improving mass precision and accuracy for proteome measurements in an Orbitrap.” Cox J, Mann M. J Am Soc Mass Spectrom. 2009;20(8):1477-1485. http://www.ncbi.nlm.nih.gov/pubmed/19553133
“Precision proteomics: the case for high resolution and high mass accuracy.” Mann M, Kelleher NL. Proc Natl Acad Sci U S A. 2008 Nov 25;105(47):18132-8. http://www.ncbi.nlm.nih.gov/pubmed/18818311
• http://www.maxquant.org
• http://groups.google.com/group/maxquant-list
References / Weblinks
Supercomputing Institute for Advanced Computational Research
© 2009 Regents of the University of Minnesota. All rights reserved.
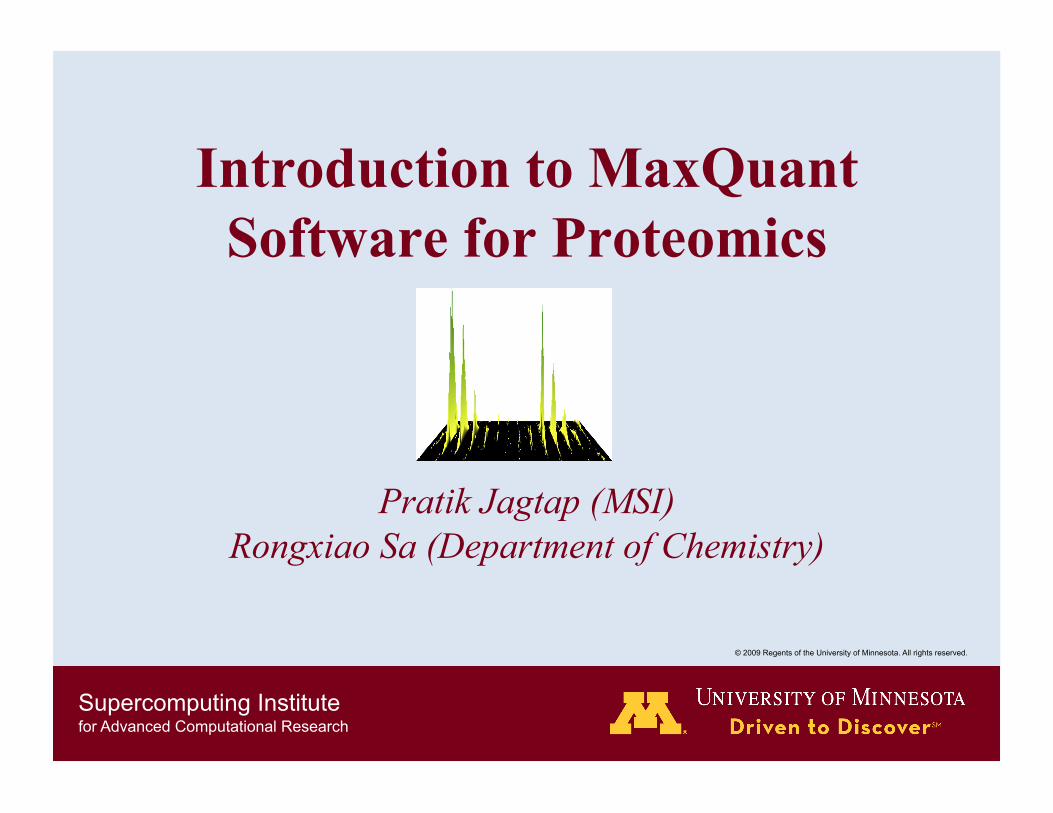
Precision proteomics
“Precision proteomics: The case for high resolution and high mass accuracy”; PNAS (2008) Mann and Kelleher.
Newer approaches to assign peptides by taking advantage of the increase in mass resolution and accuracy of new mass spectrometers.

Supercomputing Institute for Advanced Computational Research
© 2009 Regents of the University of Minnesota. All rights reserved.
Orbitrap
From http://cbsu.tc.cornell.edu
The Orbitrap is capable of very high mass accuracy because of the axial motion and oscillation of ions along the central spindle.
Peptide fragmentation is mostly performed in low-resolution but very sensitive and fast linear ion traps.
© 2009 Regents of the University of Minnesota. All rights reserved.
Supercomputing Institute for Advanced Computational Research
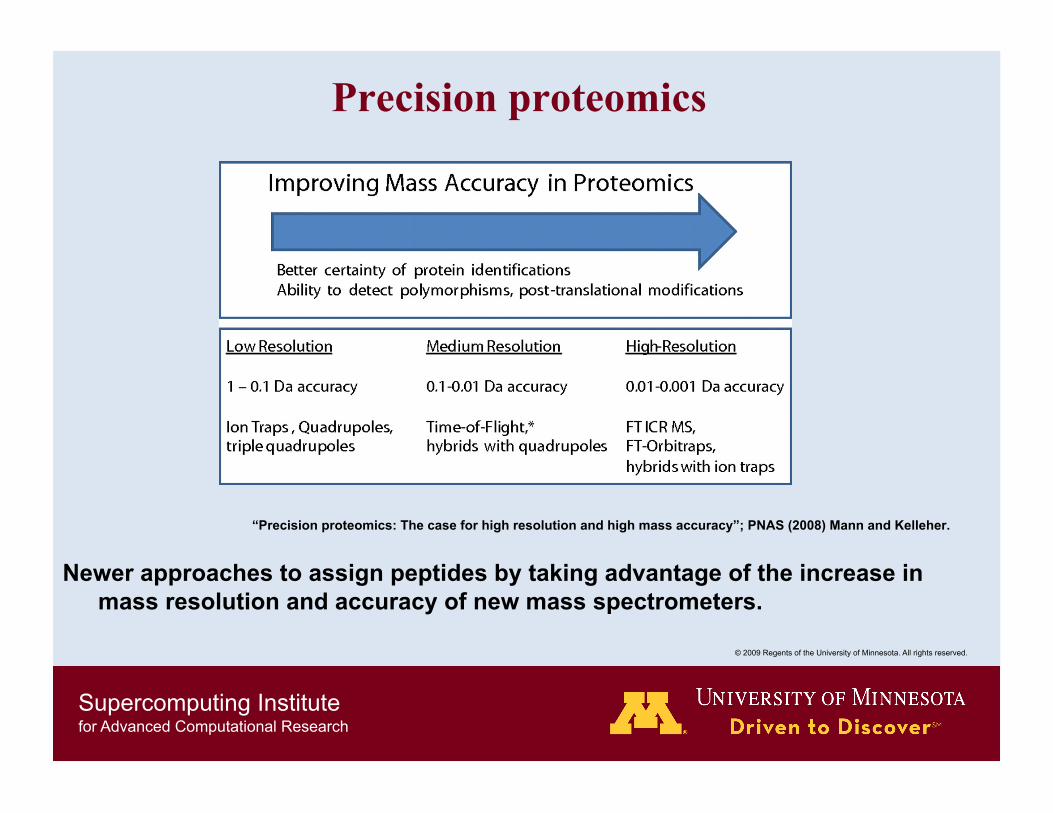
Proteomics workflow
Protein Fragmentation
Search against database.
Peptide
Trypsin
Mass spectrum
Supercomputing Institute for Advanced Computational Research
© 2009 Regents of the University of Minnesota. All rights reserved.
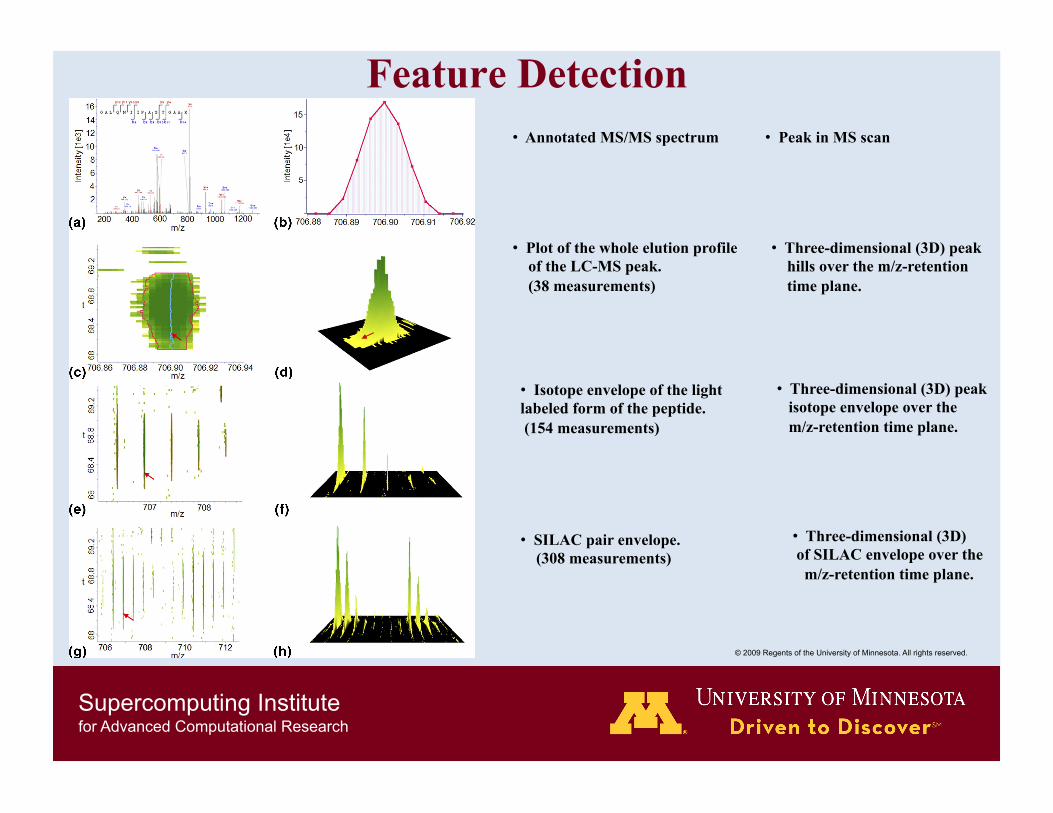
Feature Detection • Annotated MS/MS spectrum • Peak in MS scan
• Plot of the whole elution profile of the LC-MS peak. (38 measurements)
• Three-dimensional (3D) peak hills over the m/z-retention time plane.
• Isotope envelope of the light labeled form of the peptide. (154 measurements)
• Three-dimensional (3D) peak isotope envelope over the m/z-retention time plane.
• SILAC pair envelope. (308 measurements)
• Three-dimensional (3D) of SILAC envelope over the m/z-retention time plane.

Supercomputing Institute for Advanced Computational Research
© 2009 Regents of the University of Minnesota. All rights reserved.
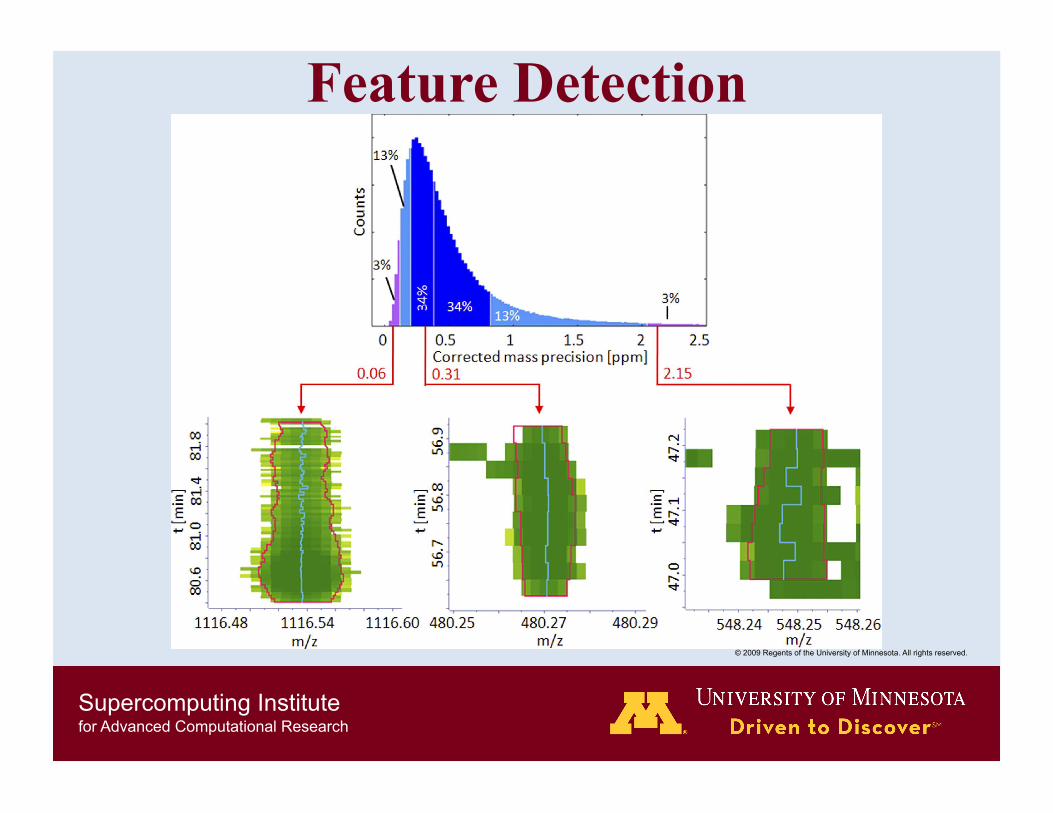
Feature Detection LCMS contour plot in which a particular SILAC pair elutes as well as a three dimensional view.
Peaks together with the determined centroid for each scan.
Relative mass deviation from the weighted mass estimate.
Intensity.
Supercomputing Institute for Advanced Computational Research
© 2009 Regents of the University of Minnesota. All rights reserved.
Feature Detection

Supercomputing Institute for Advanced Computational Research
© 2009 Regents of the University of Minnesota. All rights reserved.
Improving Peptide mass accuracy • Suboptimal mass determination of acquired peak for fragmentation, is
corrected by estimating centroid mass from multiple peaks.
• From the centroid masses a high precision, intensity-weighted estimate of mass for the 3D peak is obtained.
• For each 3D peak an individual mass precision is calculated by bootstrap replication.
• Peptide charge pairs are subjected to nonlinear recalibration of the mass scale to derive an estimate of the mass accuracy (deviation from the true value) from the estimate of the mass precision (repeatability of the measurement).
• The individualized mass accuracies are used in database search filters.
Supercomputing Institute for Advanced Computational Research
© 2009 Regents of the University of Minnesota. All rights reserved.
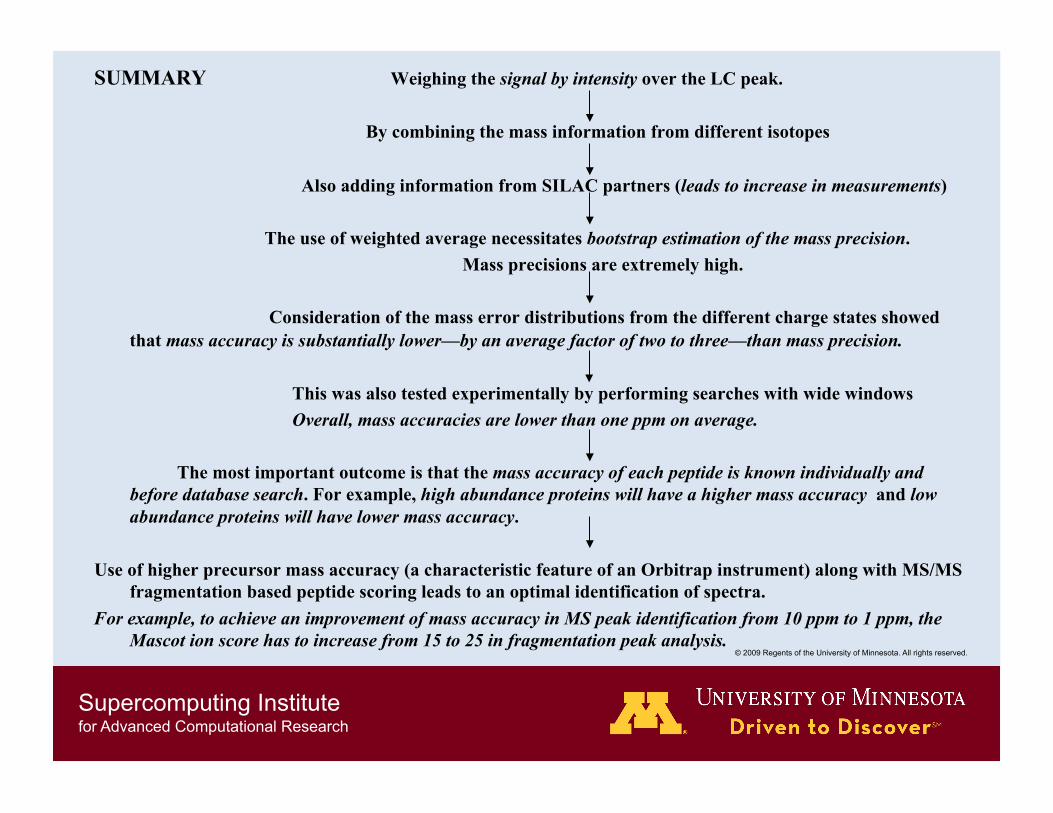
SUMMARY Weighing the signal by intensity over the LC peak.
By combining the mass information from different isotopes
Also adding information from SILAC partners (leads to increase in measurements)
The use of weighted average necessitates bootstrap estimation of the mass precision. Mass precisions are extremely high.
Consideration of the mass error distributions from the different charge states showed that mass accuracy is substantially lower—by an average factor of two to three—than mass precision.
This was also tested experimentally by performing searches with wide windows Overall, mass accuracies are lower than one ppm on average.
The most important outcome is that the mass accuracy of each peptide is known individually and before database search. For example, high abundance proteins will have a higher mass accuracy and low abundance proteins will have lower mass accuracy.
Use of higher precursor mass accuracy (a characteristic feature of an Orbitrap instrument) along with MS/MS fragmentation based peptide scoring leads to an optimal identification of spectra.
For example, to achieve an improvement of mass accuracy in MS peak identification from 10 ppm to 1 ppm, the Mascot ion score has to increase from 15 to 25 in fragmentation peak analysis.

Supercomputing Institute for Advanced Computational Research
© 2009 Regents of the University of Minnesota. All rights reserved.
Improving Peptide mass accuracy
Supercomputing Institute for Advanced Computational Research
© 2009 Regents of the University of Minnesota. All rights reserved.
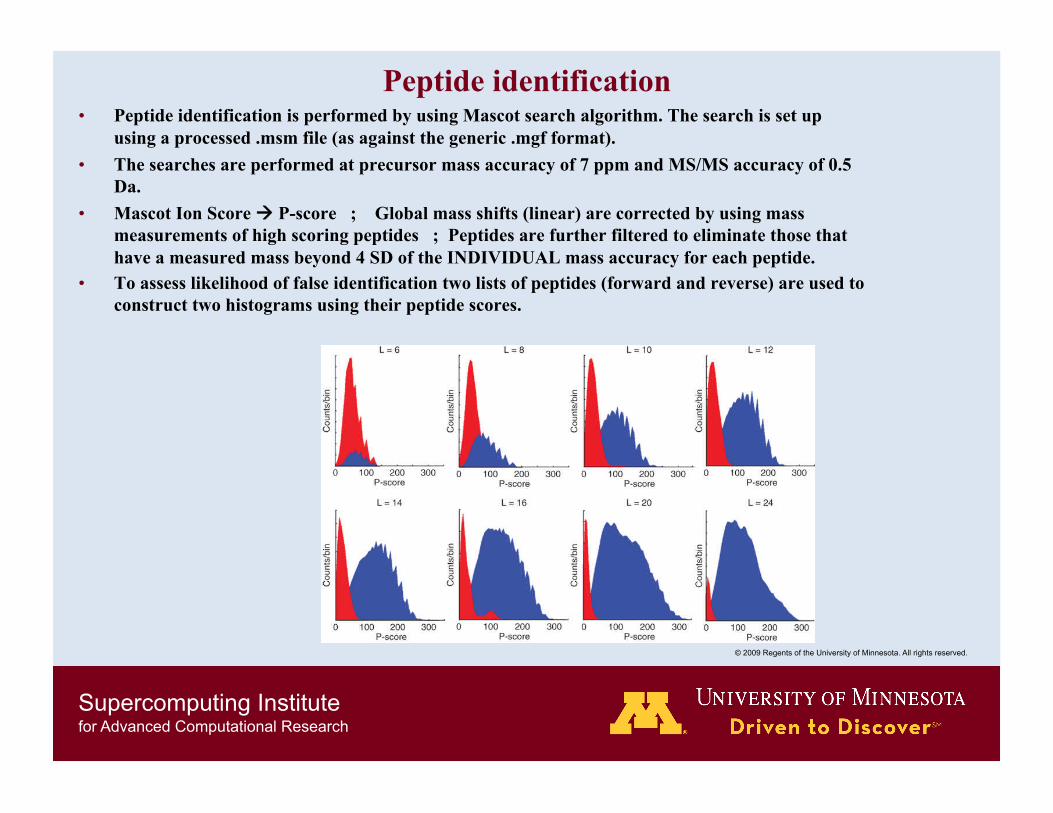
Peptide identification • Peptide identification is performed by using Mascot search algorithm. The search is set up
using a processed .msm file (as against the generic .mgf format). • The searches are performed at precursor mass accuracy of 7 ppm and MS/MS accuracy of 0.5
Da. • Mascot Ion Score P-score ; Global mass shifts (linear) are corrected by using mass
measurements of high scoring peptides ; Peptides are further filtered to eliminate those that have a measured mass beyond 4 SD of the INDIVIDUAL mass accuracy for each peptide.
• To assess likelihood of false identification two lists of peptides (forward and reverse) are used to construct two histograms using their peptide scores.
Supercomputing Institute for Advanced Computational Research
© 2009 Regents of the University of Minnesota. All rights reserved.
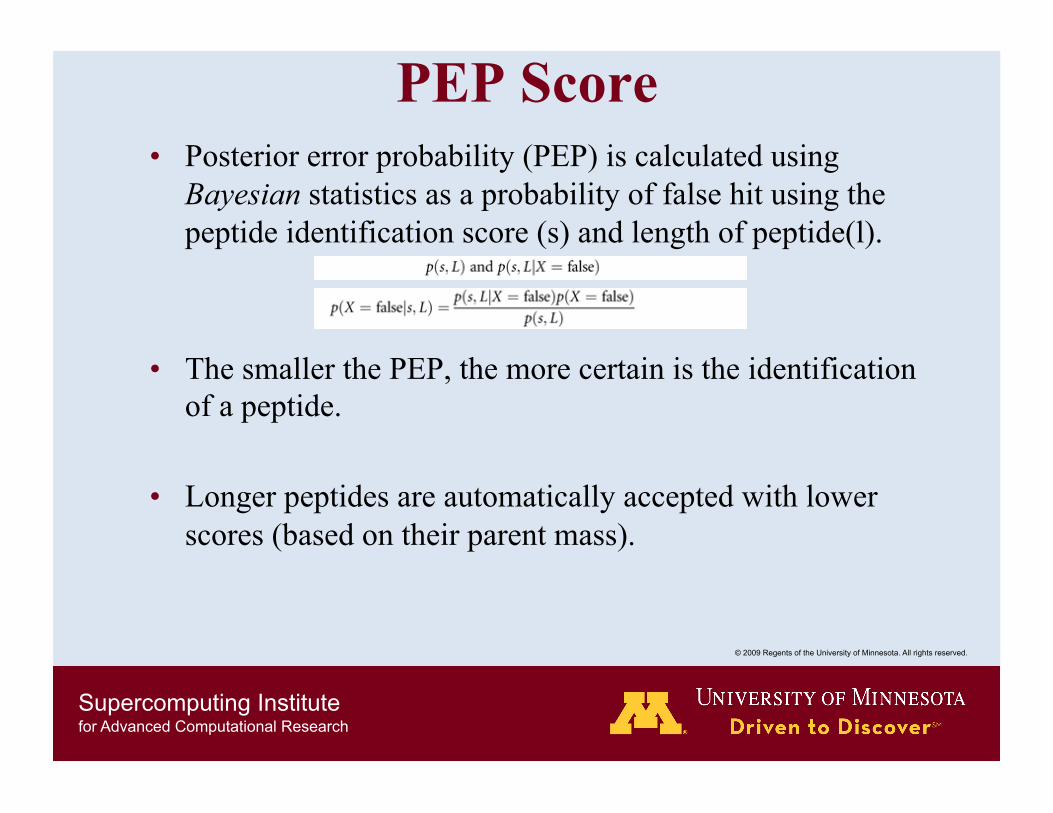
• Posterior error probability (PEP) is calculated using Bayesian statistics as a probability of false hit using the peptide identification score (s) and length of peptide(l).
• The smaller the PEP, the more certain is the identification of a peptide.
• Longer peptides are automatically accepted with lower scores (based on their parent mass).
PEP Score

Supercomputing Institute for Advanced Computational Research
© 2009 Regents of the University of Minnesota. All rights reserved.
Protein identification • Peptide matches are assembled into protein groups using
“Occam’s razor” approach. Protein grouping classifies peptides as unique peptides OR unique and razor peptides. The quantification can be set up by using Unique / Unique and Razor / All peptides.
• The protein group is assigned a PEP score by multiplying their peptide PEPs. Only peptides with distinct sequences and only highest-scoring identified spectra are used.
• Proteins and Peptides, can be filtered at a preset FDR score (0.01 or 0.05) during “Identify” analysis.

Supercomputing Institute for Advanced Computational Research
© 2009 Regents of the University of Minnesota. All rights reserved.
SILAC Quantification
(STABLE ISOTOPE LABELING BY AMINO ACIDS IN CELL CULTURE )
• SILAC labels one or two specific amino acids, making peptide pairs easy to identify by virtue of their known mass differences. • In conjunction with high-resolution MS, SILAC quantitation leads to estimation of accurate protein-expression ratios.

Supercomputing Institute for Advanced Computational Research
© 2009 Regents of the University of Minnesota. All rights reserved.
WorkFlow Raw files are generated by the instrumentation software and transferred to the local computer where they are loaded into the 'Quant' module.
‘Quant’ performs all tasks that can be done before knowing the identity of peptides. -Assembly of isotope patterns into SILAC pairs - 3D peak and isotope pattern detection - Output files are generated containing processed MS/MS spectra ('msm' files) and parameter files (par) from all LC/MS runs.
The 'Identify' module takes the search engine results, the raw files (as well as intermediate results from the 'Quant' module). Performs integration and statistical validation, assembles peptides into proteins, quantifies proteins and writes out several tables containing the results as tab-separated text files (.txt).

Supercomputing Institute for Advanced Computational Research
© 2009 Regents of the University of Minnesota. All rights reserved.
Current availability
• Currently MaxQuant v1.0.13.13 is available on sdvlapp32
• You can Remote login using your MSI password.
• Please store your raw files in U: drive • Transfer your .par and .msm files to the C:
drive after Quant analysis.
Supercomputing Institute for Advanced Computational Research
© 2009 Regents of the University of Minnesota. All rights reserved.
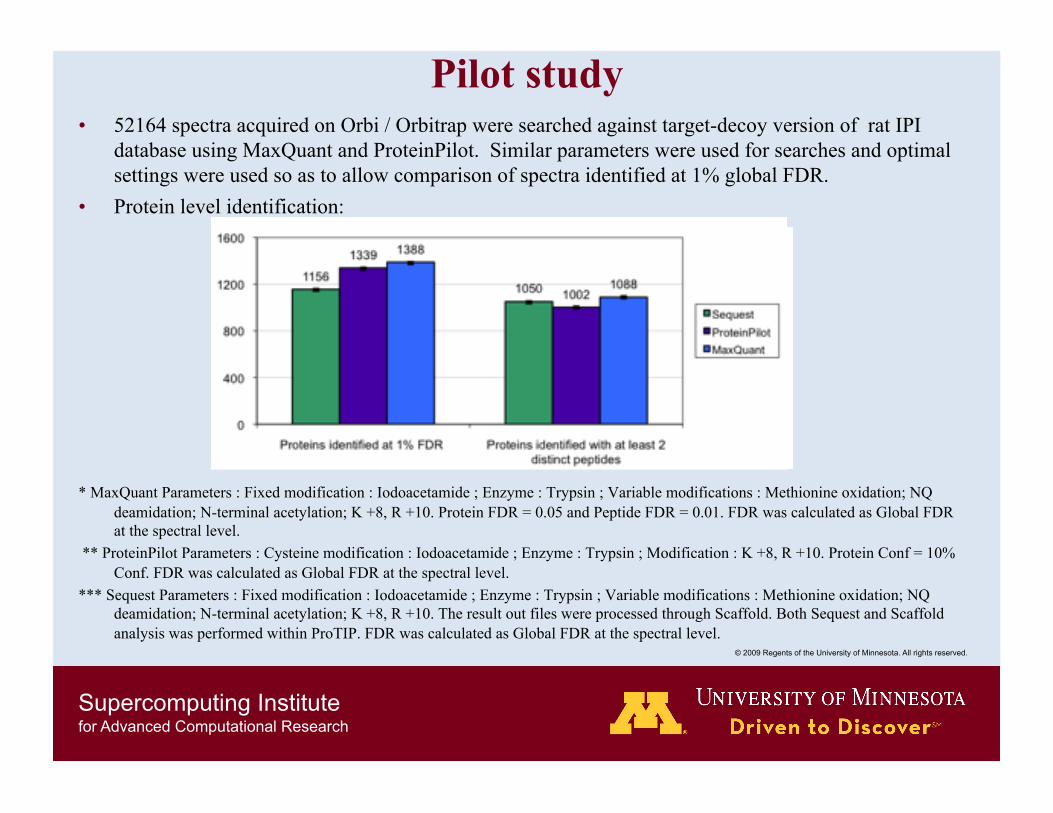
Pilot study • 52164 spectra acquired on Orbi / Orbitrap were searched against target-decoy version of rat IPI
database using MaxQuant and ProteinPilot. Similar parameters were used for searches and optimal settings were used so as to allow comparison of spectra identified at 1% global FDR.
• Protein level identification:
* MaxQuant Parameters : Fixed modification : Iodoacetamide ; Enzyme : Trypsin ; Variable modifications : Methionine oxidation; NQ deamidation; N-terminal acetylation; K +8, R +10. Protein FDR = 0.05 and Peptide FDR = 0.01. FDR was calculated as Global FDR at the spectral level.
** ProteinPilot Parameters : Cysteine modification : Iodoacetamide ; Enzyme : Trypsin ; Modification : K +8, R +10. Protein Conf = 10% Conf. FDR was calculated as Global FDR at the spectral level.
*** Sequest Parameters : Fixed modification : Iodoacetamide ; Enzyme : Trypsin ; Variable modifications : Methionine oxidation; NQ deamidation; N-terminal acetylation; K +8, R +10. The result out files were processed through Scaffold. Both Sequest and Scaffold analysis was performed within ProTIP. FDR was calculated as Global FDR at the spectral level.

Supercomputing Institute for Advanced Computational Research
© 2009 Regents of the University of Minnesota. All rights reserved.
Pilot study (Larger Dataset ; 78 fractions) • 328,067 spectra acquired on LTQ / Orbitrap were searched against target-decoy version of hIPI
database using MaxQuant. • Protein level identification:

Supercomputing Institute for Advanced Computational Research
© 2009 Regents of the University of Minnesota. All rights reserved.
Option 1: Throw Out One-Hit-Wonders » Advantages: Easy, works! » Disadvantages: Loss of sensitivity ! (Pevsner's recent work)
Option 2: Use Multiple Filters Filter 1 - Protein Mode
• ≥2 peptides/protein • moderate spectrum threshold
Filter 2 - Peptide Mode
• 1 peptide/protein • high spectrum threshold
Advantages: More sensitive! Disadvantages: Pretty arbitrary!
Option 3: Use Protein level FDR
Use global FDR (only for proteins > 100) Use local FDR (only for proteins >500)
Reporting Proteins
From Brian Searle’s Talk on “Reporting Proteins” at Baltimore ASMS Fall Workshop.

Supercomputing Institute for Advanced Computational Research
© 2009 Regents of the University of Minnesota. All rights reserved.
Website and group • http://www.maxquant.org • Google discussion group.
Quant.exe Crashes Maximum file size of 2 GB may be exceeded
Record MS/MS spectra in the centroid mode
Problem Possible Reason Solution
Mascot Crashes .msm file may be too big in size Use a maximal msm file size of 350 MB or even small
Unforeseen Unknown First, double check the FAQ on MaxQuant home page. If still unresolved, describe the problems in the MaxQuant
Google group at
http://groups.google.com/group/maxquant-list
http://groups.google.com/group/maxquant-list

Supercomputing Institute for Advanced Computational Research
© 2009 Regents of the University of Minnesota. All rights reserved.
MaxQuant @ UMN
• sdvlapp32 : A testing ground. • Suggestions? • In-lab / core-facility installed copies? • A centralized MaxQuant @MSI that can
be used for large datasets?

Supercomputing Institute for Advanced Computational Research
© 2009 Regents of the University of Minnesota. All rights reserved.
Installing MaxQuant • MaxQuant framework is written in C# in the Microsoft .NET environment. Algorithmic parts of
MaxQuant are available as source code, and the entire program can be freely downloaded as well from www.maxquant.org.
• Runs on 32 bit versions of Windows desktop computers and is compatible with XP and Vista. A personal computer (PC) with at least 2 GB of RAM and a dual-core processor. Most computational parts scale with the number of available computing cores because of parallelization.
• Supports only files produced by LTQ-FT-ICR and LTQ-Orbitrap. Works best with MS in profile mode and MS/MS spectra in the centroid mode, which will keep file size sufficiently small for normal length gradients.
• Mascot Daemon (v2.2) needs to be installed on the computer with an access to Mascot server (For convenient and automatic submission of .msm and .par files generated by Quant).
• Local storage is used for all raw files belonging to a project, and about half of this size for intermediate results. An external disc connected through USB 2.0 would be sufficient.
• Computation times : Processing time is currently about 20 min per raw file and per processing core..Typical values for 72 LC/MS runs are 16 h.
• Additional Requirements : .NET Framework 2.0 ; Thermo Fisher Scientific Xcalibur software; Microsoft Office Excel 2007.
• Critical : Raw files in same folder ; Multiple raw files. • Detailed instructions about installation and support programs are also available http://www.nature.com/nprot/journal/v4/n5/full/nprot.2009.36.html

© 2009 Regents of the University of Minnesota. All rights reserved.
Supercomputing Institute for Advanced Computational Research
• MaxQuant is an integrated suite of algorithms specifically developed for high-resolution, quantitative MS data.
• MaxQuant detects peaks, isotope clusters and stable amino acid isotope-labeled (SILAC) peptide pairs as three-dimensional objects in m/z, elution time and signal intensity space.
• By integrating multiple mass measurements, mass accuracy in the p.p.b. range is achieved.
• MaxQuant quantifies several hundred thousand peptides per SILAC-proteome experiment.
http://www.maxquant.org/
Summary