INTRODUCTION TO INDIAN SOFTWARE INDUSTRY IN GLOBAL … · 2019-03-02 · tremors of the global...
68
1 CHAPTER – I INTRODUCTION TO INDIAN SOFTWARE INDUSTRY IN GLOBAL PERSPECTIVE TOPICS COVERED – 1) INTRODUCTION. 2) MAJOR CONSTRAINTS RELATED TO SOFTWARE DEVELOPMENT. 3) DIFFERENT TRENDS RELATED TO SOFTWARE INDUSTRY. 4) NASSCOM. 5) IMPACT OF CURRENT RESSESION ON IT – INDUSTRY. 6) FUTURE ASPECTS AND EXPECTATIONS.
Transcript of INTRODUCTION TO INDIAN SOFTWARE INDUSTRY IN GLOBAL … · 2019-03-02 · tremors of the global...

1
CHAPTER – I
INTRODUCTION TO INDIAN SOFTWARE INDUSTRY
IN GLOBAL PERSPECTIVE
TOPICS COVERED –
1) INTRODUCTION.
2) MAJOR CONSTRAINTS RELATED TO SOFTWARE DEVELOPMENT.
3) DIFFERENT TRENDS RELATED TO SOFTWARE INDUSTRY.
4) NASSCOM.
5) IMPACT OF CURRENT RESSESION ON IT – INDUSTRY.
6) FUTURE ASPECTS AND EXPECTATIONS.

2
I. 1) INTRODUCTION
It’s not the incident of recent time when the software industry taking a better place in the
global community. It’s already having been started in the early 80’s and after the revolution in
the telecommunication field and the introduction of the Internet. Today we are totally
surrounded by the software solutions either directly or indirectly it’s become a part of our life.
A small device like our cell phone doesn’t work without the proper implementation of a
mobile software .We requires automated software for our washing machine. Every part of our
nation’s economy working on a platform which is given by MNC’s in the form of software.
There are several challenges for the software companies either they made a small software of
the work or large projects. There are many constraints associated with the development of
software, within their boundary the companies have to achieve their target. If they fail to
manage and predict these constraints they cannot survive in the crowd. So it is essential for
the modern and comparatively a large software sector that it has to manage the different
constraints as well as their development plans and methods. The dynamic risk estimation
plays a crucial role in the whole story of success and failure. If we become more certain about
our project risks related to the different phases of working model we can survive easily than
others. There is a view of our quickly developing software industry.
Fig 1: Scenario of Software Industry in India
0
50,000
1,00,000
1,50,000
2,00,000
2,50,000
3,00,000
1996-97 1997-98 1998-99 1999-2000
The Indian Software Industry - A Snapshot
1996-97
1997-98
1998-99
1999-2000
3
We can see the success story easily; that by every year it become doubled then the previous,
so it is more challenging for the software sector to continues improvements and maintain the
ratio of success and failure. We need to add some procedures and methods which can really
help us to find the optimum solution.
I) 2) MAJOR CONSTRAINTS RELATED TO THE SOFTWARE
DEVELOPMENT
When software developed by a team of developers they are given some deadlines related to
the different aspects, those can be:
Time
Budget
Quality
Working hours per person
Resources utilization
Personnel management
These are some major constraints; there can be more areas which should be maintained as per
the development plan but these are essential part of development whose ignorance can be
drastic for our software development.
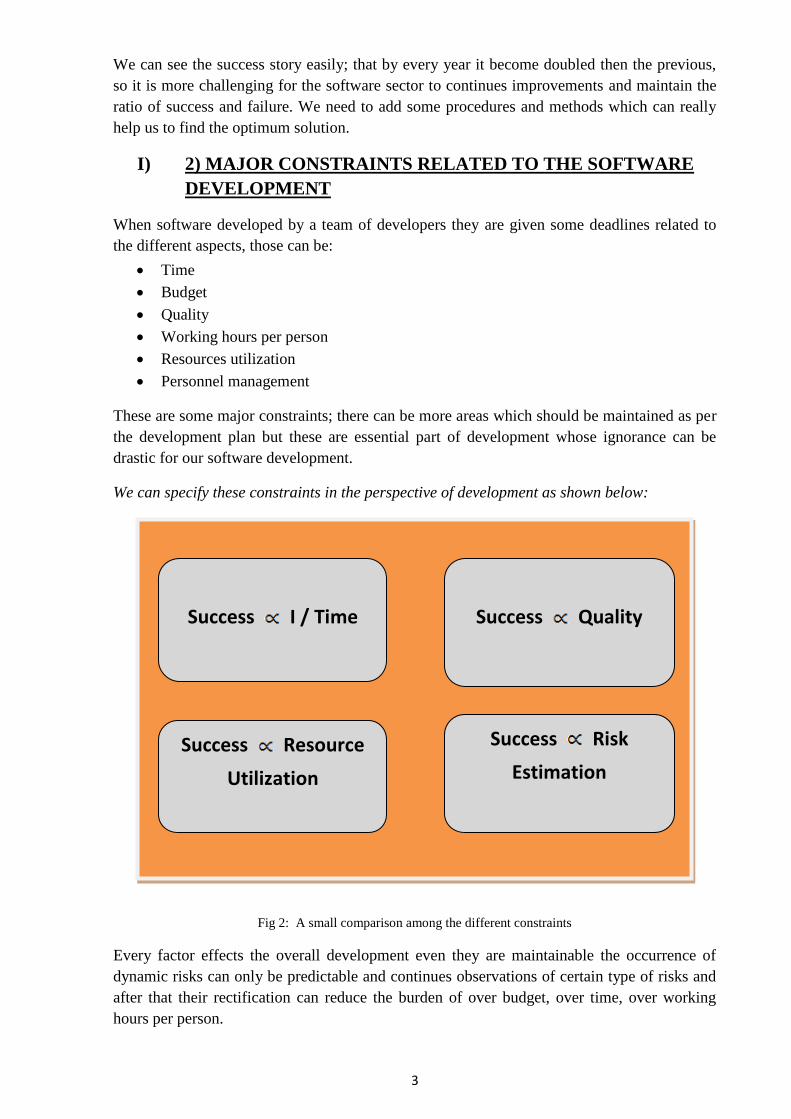
We can specify these constraints in the perspective of development as shown below:
Fig 2: A small comparison among the different constraints
Every factor effects the overall development even they are maintainable the occurrence of
dynamic risks can only be predictable and continues observations of certain type of risks and
after that their rectification can reduce the burden of over budget, over time, over working
hours per person.
Success Quality
Success I / Time
Success Resource
Utilization
Success Risk
Estimation

4
1.2.1 TIME: Time is a very crucial factor during the whole project development. It is the
most probable risk arises during the project development and its impact makes an overall
effect on the project completion. Our most emphasis should be on time factor during the every
activity of project development because if we not considered it seriously it could make more
budget cost and manpower which could further increase of certainty and project success rate.
1.2.2 BUDGET: The second most factors are money which always makes an effect on overall
procedure. The most important thing to maintain the budget factor because a Developer work
for a good amount of profit as well as the customer satisfaction, but in today’s scenario the
competition level is very high and vendors are forced to reduce their profit as well as
customer satisfaction on time. So the maintenance of this factor is also important. If we handle the risks related to budget and resolve them we can improve our profits and maintain a
good ratio of money and manpower / development.
1.2.3 QUALITY: The outcome of the development is a final product and the vendors have to
maintain the quality of that last outcome / Product. In a great competitive industry it is
mandatory to maintain the quality of products. It further increases our business growth and
benefits. Give a quality product in certain time limit and in budget is also a crucial task to
complete.
1.2.4 RESOURCE MANAGEMENT: The proper resource utilization is also necessary for
manage budget issues. Excessive use of resources makes an indirect effect on project budget
as well as resources utilization. If we manage the resources effectively we can improve the
performance as well as we can reduce the ideal time for different phases of development.
1.2.5RISK ESTIMATION AND HANDLING: The key factor of the project success and
improvement over whole profit is the right risk estimation as well as the handling of the risks.
Every organization has a strong backbone for risk management because the improper
management of risks can increase our project failures and make a loss which is not bearable in
the organizations at a huge level. A proper risk management can solve every bugs faced
during the development.
I) 3) DIFFERENT TRENDS RELATED TO THE SOFTWARE
INDUSTRY
In this section two scenarios have been discussed by which we can easily understand the
powerful impact of software industry in global perspective as well as in Indian view.
EARLY HISTORY - The global market for computer services was estimated by IDC
(International Data Corporation) in 1995 about $220 billion. Which is further classified
according to different categories as the software development and maintenance process:
Custom software development was estimated about - $16 billion, systems integration was -
$32 billion, IT consulting at - $11 billion, and business service outsourcing at - $9 billion?
In the given figure we can see the early days of software industry’s growth in different
countries.

5
Source: http://www.nber.org/chapters/c10805
Fig 3: IT Spend as a % of GDP
0
1
2
3
4
5
6
7
IT SPEND AS A % OF GDP
IT SPEND AS A % OF GDP

6
By the above figure we can easily see the situation in early days of growth India was at a 9th
place and UK, USA, CANADA developed countries were at top but that was the only
beginning , in the current situation INDIA have been reached in top 5 countries of the world.
CURRENT SCENARIO – According to the NASSCOM report 2013 the things have been
changed in INDIA and in global perspective. I have tried to describe these report outcomes
with the help of graphs managed by NASSCOM.
I) 4) NASSCOM: National Association of Software and Service Companies (NASSCOM) is
the joint venture for the IT-BPM companies in India. A non-profit organization funded by the
industry.
OBJECTIVE: To build a growth led sustainable, technology and business services
segment in the country.
HISTORY: Established in 1988, NASSCOM’s membership has grown over the last
20 -25 years and currently stands at over 1400.
The member organizations have a part of 95 per cent of industry revenues and have
enabled the association to forefront initiatives in the country and globally.
NASSCOM members are vigorous participants in the new global economy and are
trendy for their innovative business goals, and thrust on emerging opportunities.
NASSCOM is headquartered in New Delhi, India, and has offices in seven other cities
Mumbai, Pune, Thiruvananthapuram, Bengaluru, Chennai, Hyderabad, and Kolkata.
To become and engaging global trade organization, complimented by the pillars of
trust and credibility. NASSCOM’s mission is to focus on the IT-BPM industry’s
Footprint in its business markets and beyond, building strategic partnership and good
relationship to customers. It seeks to establish India as a hub for innovation and
professional services.
NASSCOM’s aim is also to increase the country’s pool of relevant and skilled talent
and harness the benefits of ICT to drive inclusive and balanced growth.
‘Transform Business, Transform India’ is the overall objective of NASSCOM and its
member organizations.[4]
NASSCOM members are organizations in India occupied in the business of IT
Services, BPM, Software Products, Engineering Design, Internet, E-commerce and
Gaming.
NASSCOM is governing body in INDIA which has been working closely with both the union
and state governments of India to create a regulatory climate which is essential to the growth
of the IT-BPM industry in the country.
7
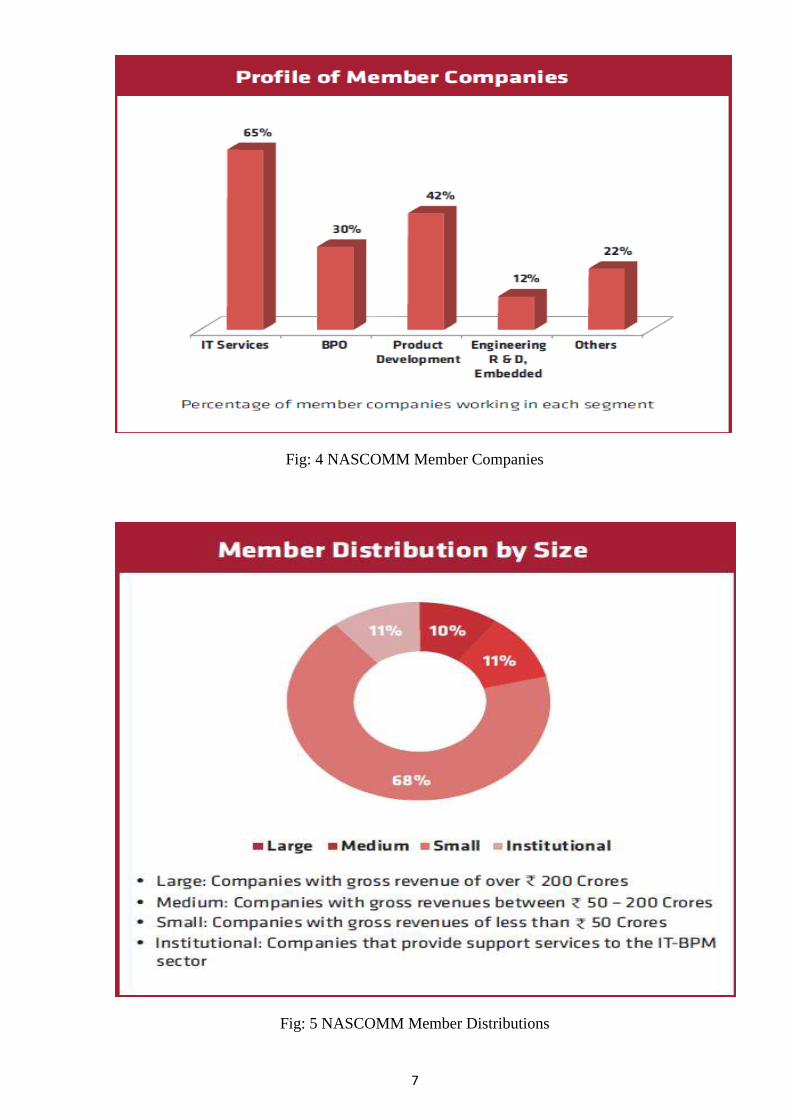
Fig: 4 NASCOMM Member Companies
Fig: 5 NASCOMM Member Distributions
8
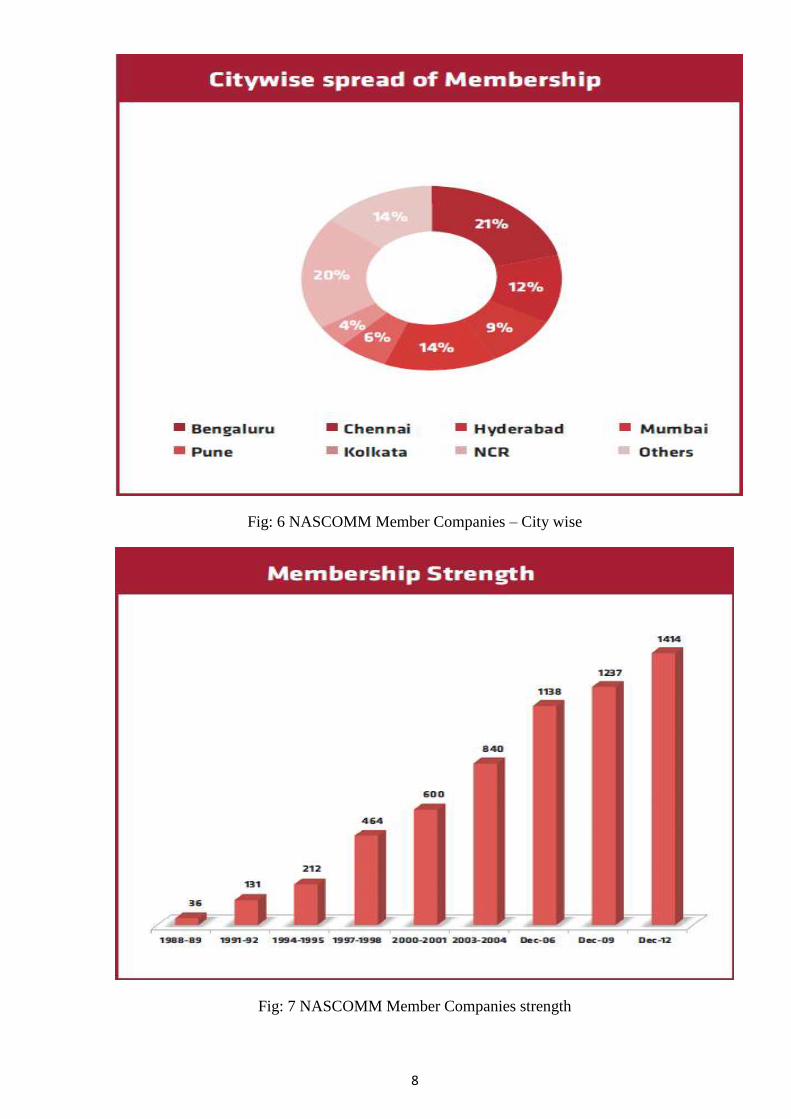
Fig: 6 NASCOMM Member Companies – City wise
Fig: 7 NASCOMM Member Companies strength

9
I) 5) IMPACT OF CURRENT RECESSION ON IT INDUSTRY The current global economic slowdown has its impact on every country and every
economic class which is related to any of the field. The IT industry is also included in that
at a very great extent.
It has the start from the United States (US) but the infection is
being spread in all major economies of the world. Many countries are facing rapid fall
down in their Global Domestic Product, rising unemployment levels and an overall
slowdown in the market investments. India is little bit on upper level then the rest of the
world because India’s economy bone has been fuelled by the growth in the IT sector in the
recent past.
A large
part of this business benefit is dependent on the “outsourcing” or “off shoring” of business
processes and software development activity (and related services) by large global
corporations and other companies. Hence, the global recession crisis has also affected the
business climate within India and the growth rate of the Information Technology (IT) and
Information Technology Enabled Services (ITES) sector. These sectors are also facing the
tremors of the global recession.
SOME FACTS – WHY GLOBAL RECESSION MAKES AND IMPACT ON IT
INDUSTRY IN INDIA:
The Indian IT software and services industry which has seen a Compounded Annual
Growth Rate (CAGR) of around - 30%
But now it is projected to grow at 20%.
Indian IT sector’s holds just about 61% revenues from the US based clients.
The revenue contribution from US customers to the top five Indian IT companies is
approximately 58%.
Hence, the bang of the slowdown in the US is obviously to have a deep impact on the
prospects of the Indian IT sector.
Nearly 41% of the IT industry revenues in India are estimated to be from financial
services. Since this sector has been pretentious most severely in the current environment.
1.5.1 GLOBAL STRUCTURE OF IT INDUSTRY:
Growth of global IT economy – The global IT industry has emerged over the last few years
and became the major contributor to the global economic growth.
The major field consisted by IT sector are:
1) ITES( IT enabled services)
2) Hardware segment.
These fields have gradual growth with a continuous rise in revenues as experienced in the past
few years. The global software industry and services has achieved USD 967 billion target
with a growth rate of 6.3%.

10
STRUCTURE OF INDIAN IT INDUSTRY:
As we have already discussed about global scenario of IT industry during the financial crisis.
The Asia pacific region showed tremendous growth and INDIA is the one of that countries.
Value factor for growth:
Cost advantage.
Breadth of service offering and innovation.
Quality of process.
Ease of scalability.
PERFORMANCE OF INDIAIN INDUSTRIES:
The India is the major stakeholder in global market the 7 % share shows the credibility of this
industry in INDIA.4% is from IT segment and 2% from ITES segment. We can conclude the
success story by the financial report in which the revenue generated has grown from 1.2% in
year 1998 to 5.8% in 2009. The net value became 3.5- 4% for 2009
Global Scenario – IT purchases: As we have already seen that US market accounts major part in global software economy as
well as purchases of IT goods and services. The situation of US market in 2005 was at 37%
which fall down in next year and shrink to 33% in 2008. On the other hand the share of
western and central Europe fluctuates to 26% and 28%.
Fig: 9 Region wise distributions
11
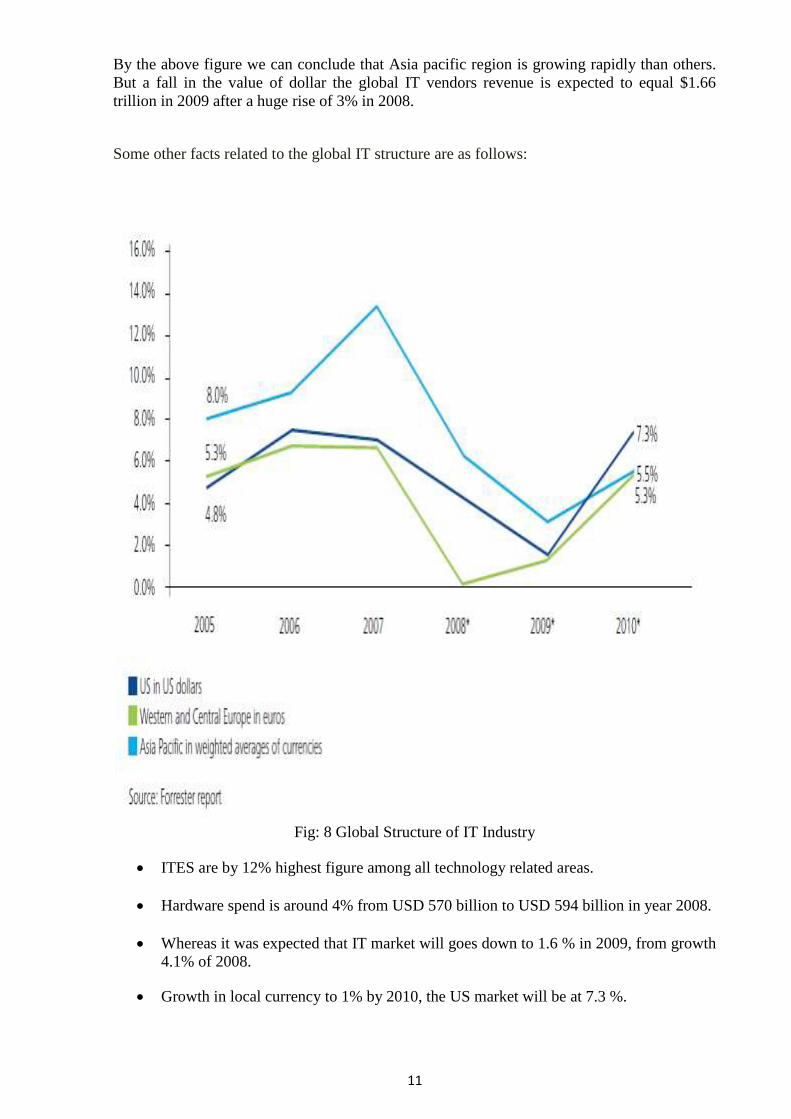
By the above figure we can conclude that Asia pacific region is growing rapidly than others.
But a fall in the value of dollar the global IT vendors revenue is expected to equal $1.66
trillion in 2009 after a huge rise of 3% in 2008.
Some other facts related to the global IT structure are as follows:
Fig: 8 Global Structure of IT Industry
ITES are by 12% highest figure among all technology related areas.
Hardware spend is around 4% from USD 570 billion to USD 594 billion in year 2008.
Whereas it was expected that IT market will goes down to 1.6 % in 2009, from growth
4.1% of 2008.
Growth in local currency to 1% by 2010, the US market will be at 7.3 %.

12
9.5% other Americas.
5.5% Asia Pacific.
5.3% western and central Europe.
It shows that Asia pacific region is like a turbo engine for IT industry.
India becoming an IT- heaven for the MNC’S to back end their IT
operations in INDIA owing to its strong position.
13
CHAPTER – II
RISK IDENTIFICATION AND MANAGEMENT
METHODS
TOPICS COVERED:
1) INTRODUCTION TO RISKS RELATED TO PROJECTS.
2) IDENTIFICATION AND MANAGEMENT MODELS.
3) MONTE – CHARLO METHOD OF ESTIMATION.
4) THE RESEARCHES PROPOSED IN THIS DIRECTION.
5) IMPORTANCE OF RISK ANALYSIS IN PROJECT DEVELOPMENT.

14
2.1RESEARCHES DONE IN THIS DIRECTION
2.1.1 RISKS IDENTIFIED DURING PROJECTS MAINTENANCE
There is different type of risks facing during the projects development. According to a
research by “JANNE ROPPONEN AND KALLE LYYTINEN” there are mainly 6 factors
related to the risks those are as follows:
1) Scheduling and timing risks.
2) System functionality risks.
3) Subcontracting risks.
4) Requirement management risks.
5) Resource usage and performance risks.
6) Personnel management risks.
According to this research the author define a risk as a state or property of a development
task or environment, which cannot be ignored otherwise it leads to project failure. Now we
will discuss these factors in detail.
2.1.1.1SCHEDULING AND TIMING RISKS:
Scheduling and timing risks are named on its behavior since variables loading strong enough
to this factor relate to difficulties in scheduling the project correctly.
Ex:
Time table changes.
Actual v/s Estimated.
Managing project complexity.
Estimations for personnel needs.
2.1.1.2SYSTEM FUNCTIONALITY RISKS:
The second factor describes the risks associated with getting the system functionality right in
different point of view.
Ex:
Satisfaction with user interaction.
Core functions.
Properties correct.
Estimation of hardware and software capabilities.
2.1.1.3SUBCONTRACTING RISKS:
The third factor called as “Subcontracting” risk because success in managing externally
performed tasks. The poor management of subcontracting easily leads the requirement of
personnel.

15
2.1.1.4REQUIRENMENT MANAGEMENT:
This risk component deals with project manager capability to manage the requirement and
avoid. The frequent changes in requirement increase the project complexity as well as
increase the cost of the product. The uncontrolled changes in requirement leads to changes in
time table and make it difficult to keep resource consumption steady. So collecting the
requirements correctly could make a big difference.
2.1.1.5RESOURCE USAGE AND PERFORMANCE RISKS:
The utilization of resources is also a concern which can make an impression on the success
ration of the project. The optimum use of resources can be helpful in cost reduction of the
project. The performance is also related to the resources because performance is directly
affected by the resource utilization.
2.1.1.6PERSONNEL MANAGEMENT RISKS:
The most and challenging factor is management of personnel. There are several questions
those answers can be find out by this factor. Every work is done by the team of members if
there are certain increments in the work it leads to the increment in personnel which further
make an impact on the overall planning.
2.1.2 RISK IDENTIFICATION AND MANAGEMENT MODELS:
There are lots of researches have been done in the field of risk identification and management
and several models are proposed by the research scholars. The traditional models are not so
much effective for handling and management of risks. So a requirement of dynamic and
parallel processing risk handler is much on demand. Some popular models are discussed in
detail in the latter half of this chapter. The risk can be divided in three basic phases:
Analysis: This is the basic and foremost requirement of a risk handling model. A proper
analysis of risks on the present trends as well as on the previous results is very useful data for
estimation and identification of risks. The risk registers and reports should be maintained for
this purpose in which we keep track of every possible chance of risk can be introduced during
the development. So risk analysis is a very mind storming task for the team but everything is
depended on its usability. Better the analysis produce better the results.
Analysis
Management
Rectification
16
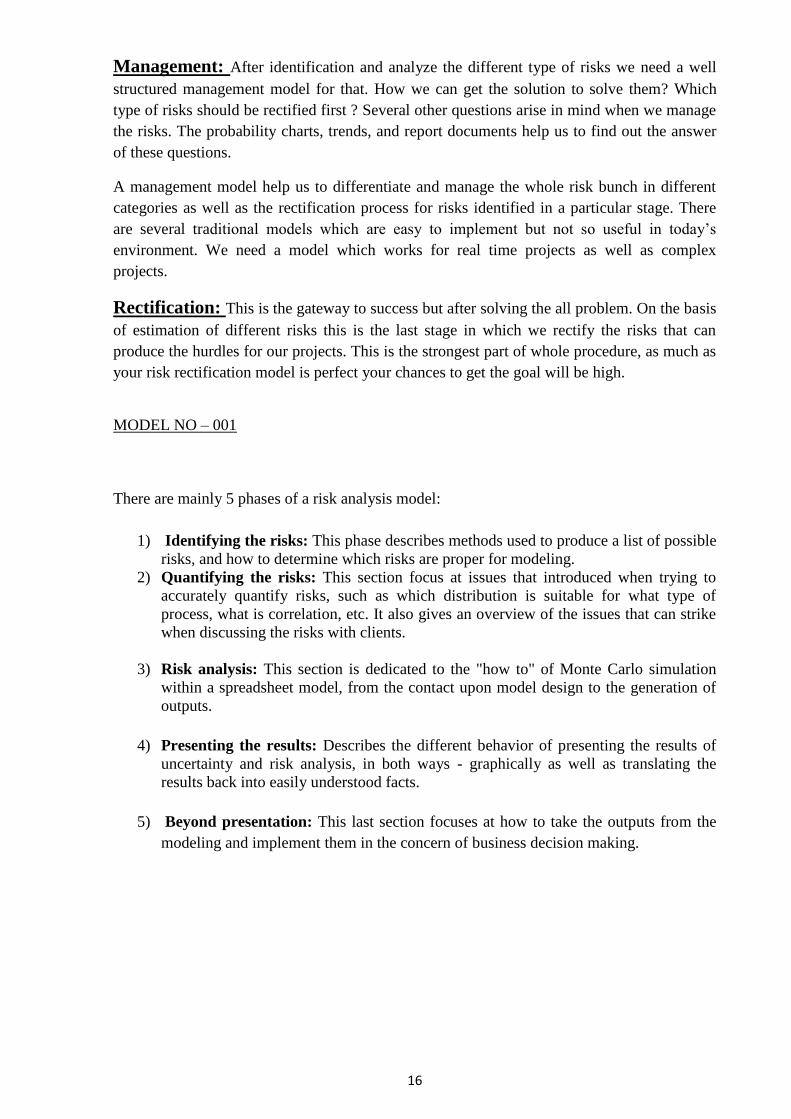
Management: After identification and analyze the different type of risks we need a well
structured management model for that. How we can get the solution to solve them? Which
type of risks should be rectified first ? Several other questions arise in mind when we manage
the risks. The probability charts, trends, and report documents help us to find out the answer
of these questions.
A management model help us to differentiate and manage the whole risk bunch in different
categories as well as the rectification process for risks identified in a particular stage. There
are several traditional models which are easy to implement but not so useful in today’s
environment. We need a model which works for real time projects as well as complex
projects.
Rectification: This is the gateway to success but after solving the all problem. On the basis
of estimation of different risks this is the last stage in which we rectify the risks that can
produce the hurdles for our projects. This is the strongest part of whole procedure, as much as
your risk rectification model is perfect your chances to get the goal will be high.
MODEL NO – 001
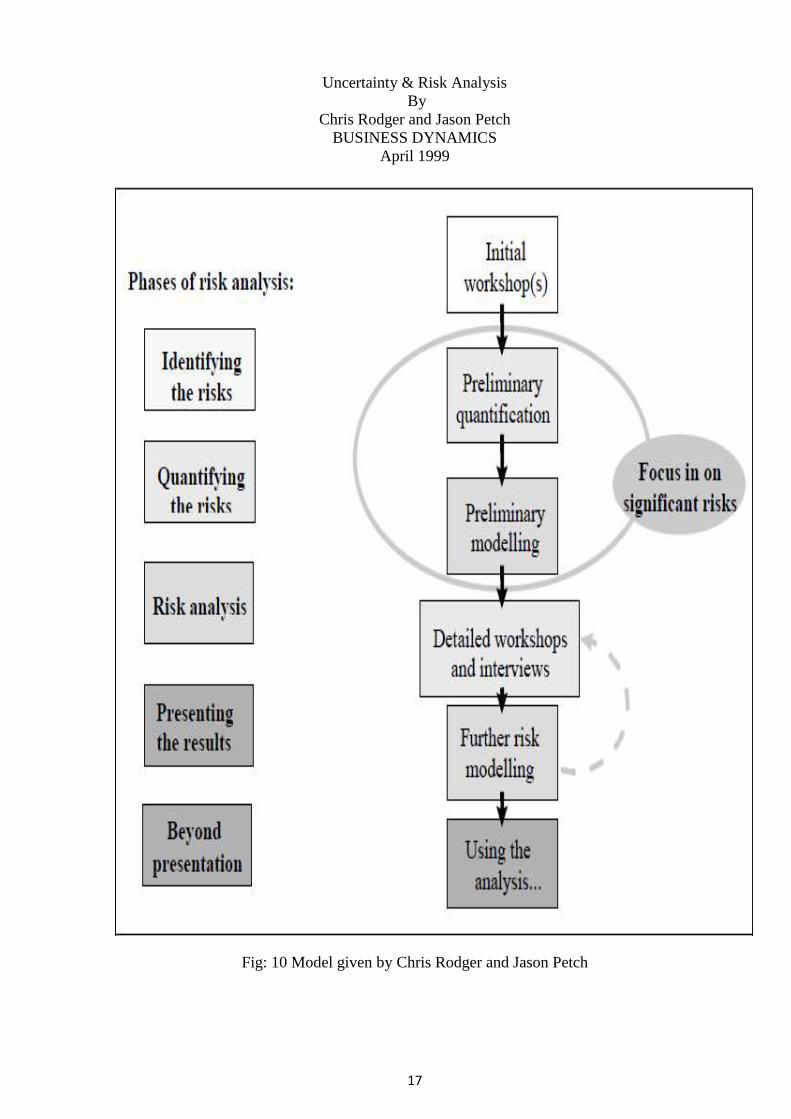
There are mainly 5 phases of a risk analysis model:
1) Identifying the risks: This phase describes methods used to produce a list of possible
risks, and how to determine which risks are proper for modeling.
2) Quantifying the risks: This section focus at issues that introduced when trying to
accurately quantify risks, such as which distribution is suitable for what type of
process, what is correlation, etc. It also gives an overview of the issues that can strike
when discussing the risks with clients.
3) Risk analysis: This section is dedicated to the "how to" of Monte Carlo simulation
within a spreadsheet model, from the contact upon model design to the generation of
outputs.
4) Presenting the results: Describes the different behavior of presenting the results of
uncertainty and risk analysis, in both ways - graphically as well as translating the
results back into easily understood facts.
5) Beyond presentation: This last section focuses at how to take the outputs from the
modeling and implement them in the concern of business decision making.
17
Uncertainty & Risk Analysis
By
Chris Rodger and Jason Petch
BUSINESS DYNAMICS
April 1999
Fig: 10 Model given by Chris Rodger and Jason Petch
18
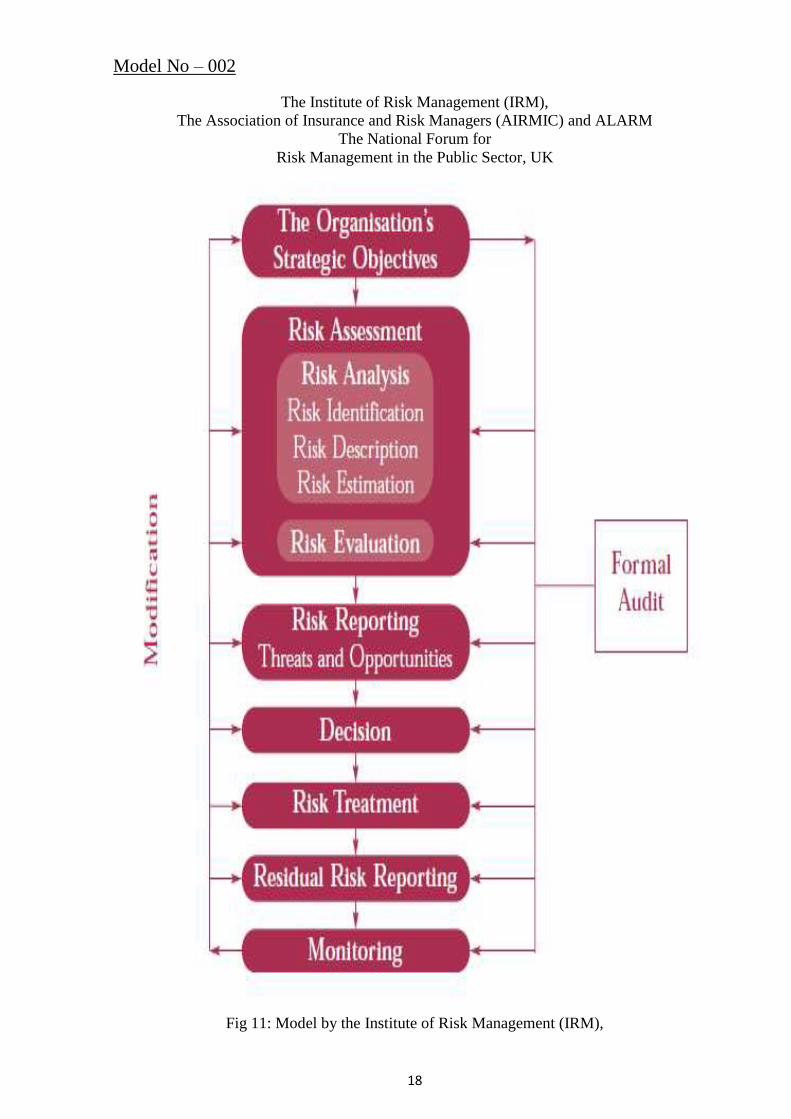
Model No – 002
The Institute of Risk Management (IRM),
The Association of Insurance and Risk Managers (AIRMIC) and ALARM
The National Forum for
Risk Management in the Public Sector, UK
Fig 11: Model by the Institute of Risk Management (IRM),

19
Risk management protects and increase value to the organization and its stakeholders through:
Implementing a framework for an organization that enables future procedures to take
place in a consistent and controlled manner.
Improvisation on decision making, planning and prioritization by complete and
structured and thoughtful business activity.
Contributing to more proficient allocation of capital and resources within the
organization.
Dropping volatility in the non essential fields of the business.
Shielding and enhancing resources and company image
Developing and underneath people and the organization’s knowledge base.
Risk handling is the route of selecting and implementing measures to rectify the risk. Risk
handling includes as its major element, risk control, but extends further to, for example: risk
avoidance, risk transfer, risk financing, etc.
Any structure of risk treatment should provide as a minimum:
• Effective and efficient function of the organization.
• Effective inner controls.
• Compliance with laws and rules.
The risk analysis process is the first and main exercise which assists the effective and efficient
operation of the organization .In this exercise it focuses on risks which require attention by
management. Usefulness of internal control is the maximum degree to which the risk will
either be rectified or decreased by the proposed control method. They need prioritize risk
control model in terms of their intensity to benefit the organization. Cost usefulness of inner
control relates to the cost of implementing the control rather than the risk reduction profit
expected. The planned controls need to be measured in terms of potential economic effect
Monitoring and Review of the Risk Management Model:
Reporting and review structure: Successful risk management always need a reporting and review structure to confirm that
risks are effectively identified and managed and that suitable controls and responses are
implemented.
Regular audits and standards: Continue audits of policy and standards observance should be carried out and standards
performance reviewed to identify fields for improvement. It should be known that
organization’s nature are dynamic and operate in dynamic environments. So changes in the
organization’s environment in which it operates must be identified and suitable modifications
made to systems. The observing process should provide guarantee that there are appropriate
20
controls in place for the organization’s behavior and that the procedures are understood and
followed.
Any monitoring and review process should also determine whether:
The measures introduced resulted in what was proposed
The procedures implemented and data gathered for undertaking the assessment were
appropriate and suitable.
Enhanced knowledge would have helped to reach better end and identify what other
lessons could be learned for future modifications and management of risks.
MODEL NO: 003
Quantitative Risk Assessment and Risk Management of a Large
Transportation Project
By A. McGoey-Smith, A. Poschmann and L. Campbell
Risk management is becoming increasingly used for managing projects within government
agencies and major corporations in the western world. These organizations have recognized
the importance of managing risk as part of their everyday business and have implemented
policies such as the Government of Canada’s Integrated Risk Management Framework
(IRMF).
IMRF addresses the need for Federal government agencies to demonstrate greater
transparency in decision-making, interact with better educated citizens, deal with uncertainty,
capitalize on opportunities and inform stakeholders to ensure better decisions in the future.
In
addition IRMF is designed to use a systematic approach to risk management, contribute to
building a risk-smart workforce that allows for innovation and responsible risk-taking while
ensuing legitimate precautions are taken to protect the public interest, maintain public trust
and ensure due diligence. Similarly, the UK has developed a framework for business risk
management for use by the central government’s Highways Agency.
The framework is an implementation of the policy shift to a risk-averse culture
involving “well thought out risk taking”. As part of its position on operational risk analysis
the framework includes identification of all risks, evaluation of identified risks (assessment of
likelihood and impact) and evaluation and the appropriateness of mitigation arrangements.

21
Fig 12: Model given by A. McGoey-Smith, A. Poschmann and L. Campbell [3]

22
CHAPTER – III
RISK CATEGORISATION AND
PARELLEL PROCESSING FOR HANDLING THE
RISKS
TOPICS COVERED:
1) RISK CATEGORIZATION AND HANDLING.
2) FACTORS AND THEIR RELATION TO RISKS AS PER MY
RESEARCH.
3) IMPROVIZATION OVER TREDITIONAL METHOD.
4) OOP’S CONCEPTS USED AND IMPLEMENTED.
5) INTRODUCTION TO PARELLEL PROCESSING.
6) PROPOSED MODEL.
23
3.1 RISK CATEGORIZATION AND HANDLING:
In simple words we can define the “risk as a hurdle which can chock our process or can be
harmful for the target which we want to achieve”.
Risk estimation is more important factor in overall process of management. “Risk estimation
can be identified as a process which helps the project analysts to predict the occurrence of
different type of risks at various levels of the project development”. After the identification of
different type or risks according to their probability of occurrence a risk management
procedure should be followed which help to maintain and rectify the risks, so that we can
continue our process.
There are mainly 3 type of risks identified during my research:
Static risks:
1) Based on formal review of planning document – These types of risks are
basically identified during the early phase during planning with formal reviews of planning
documents.
2) Based on the previous trends – The previous trends based on projects completed
also helpful to identify the frequently occurred risks.
Dynamic risks:
1) Sudden death - Most dangerous in nature which completely destructs the project.
Probabilities of these types of risks are low.
2) Short circuit – Which comes suddenly but can be diverted so that not makes an effect
on the overall process?
Humanly generated: 1) Improper decision making.
2) Lake of proper planning.
3) Lake of resource utilization.
4) Less maturity of commonsense.
To handle the different type of risks we can follow a conceptual method of implementation of
bins with different labels. On the basis of bin concept we can categorize them as follows:
I have given the names of risks related to our real life examples like our physical problems so
that we can easily classify them. According to my observations there mainly 3 types of risks
found during the each phase we can classify them according to their priority.
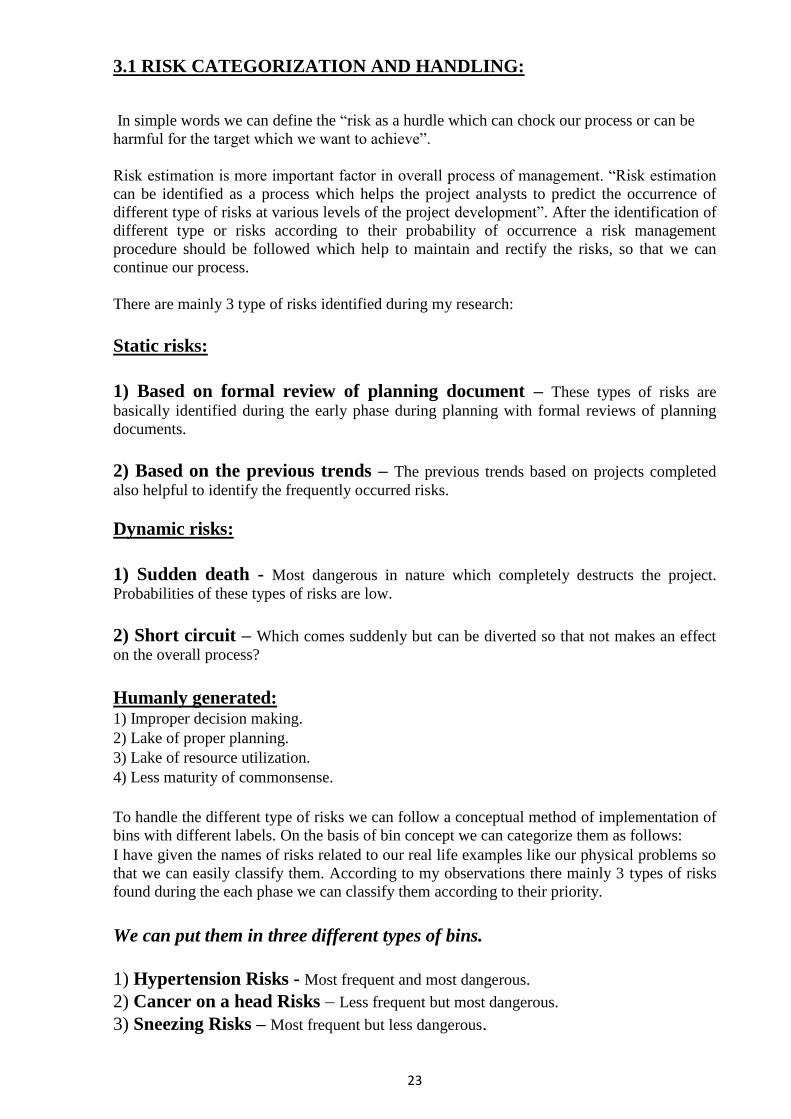
We can put them in three different types of bins.
1) Hypertension Risks - Most frequent and most dangerous.
2) Cancer on a head Risks – Less frequent but most dangerous.
3) Sneezing Risks – Most frequent but less dangerous.

24
Fig 13: Risk Categorization
Red got resolved first then Orange and at last stage bin with sky blue color should be
resolved. After implementing the given modal at the last stage we calculate the average value
for the risks occurred during the phase and compared with the initial value.
Cases according to the probability

25
Fig 14: Ladder Model
Given 3 conditions are checked during the every stare of ladder, if condition 1st and
2nd found during the estimation we move 1 step forward without any problem. But if
we found the 3rd condition then we have to pay our attention for further processing.
This concept is inspired with the real life example when we climb on a ladder we
ensure the strength of ladder with every step moved in forward direction. In the same
way we check our estimated values with the initial values if the estimated average
value is become high then movement without sort out it can be harmful for the
remaining phases and we fall down without achieving our target.
3.2 RISK FACTORS AS PER MY RESEARCH:
Before discussing the actual problem we have to understand the various constraints
which are introduced during the whole process. There are a relationship among them
one can affect the others.
26
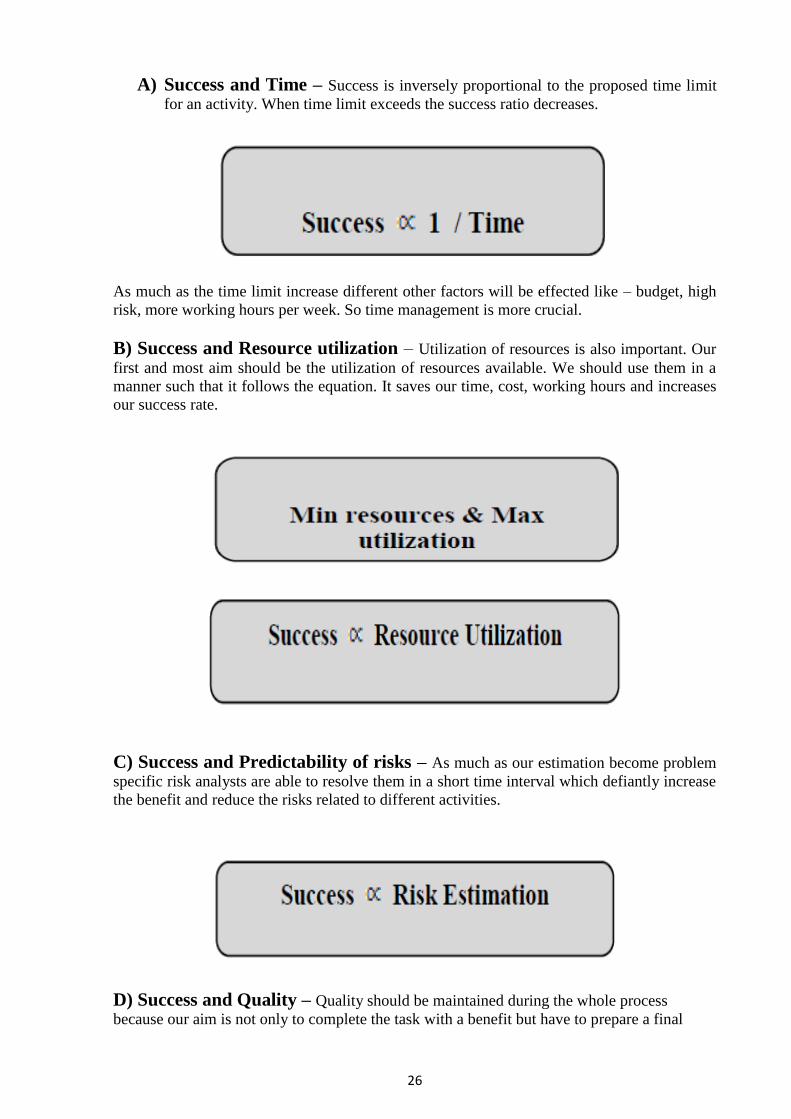
A) Success and Time – Success is inversely proportional to the proposed time limit
for an activity. When time limit exceeds the success ratio decreases.
As much as the time limit increase different other factors will be effected like – budget, high
risk, more working hours per week. So time management is more crucial.
B) Success and Resource utilization – Utilization of resources is also important. Our
first and most aim should be the utilization of resources available. We should use them in a
manner such that it follows the equation. It saves our time, cost, working hours and increases
our success rate.
C) Success and Predictability of risks – As much as our estimation become problem
specific risk analysts are able to resolve them in a short time interval which defiantly increase
the benefit and reduce the risks related to different activities.
D) Success and Quality – Quality should be maintained during the whole process
because our aim is not only to complete the task with a benefit but have to prepare a final
27
outcome which is according to our expectations and remove the unwanted and harmful factors
from the risk estimation process.
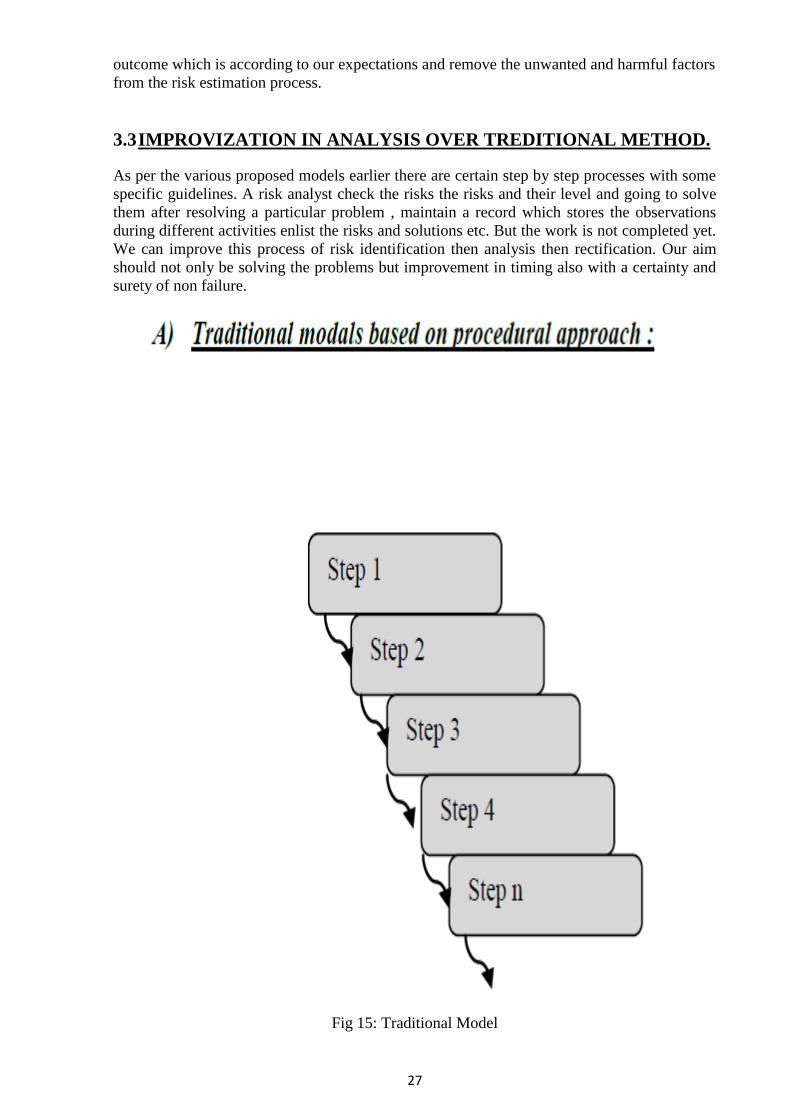
3.3 IMPROVIZATION IN ANALYSIS OVER TREDITIONAL METHOD.
As per the various proposed models earlier there are certain step by step processes with some
specific guidelines. A risk analyst check the risks the risks and their level and going to solve
them after resolving a particular problem , maintain a record which stores the observations
during different activities enlist the risks and solutions etc. But the work is not completed yet.
We can improve this process of risk identification then analysis then rectification. Our aim
should not only be solving the problems but improvement in timing also with a certainty and
surety of non failure.
Fig 15: Traditional Model

28
Fig 16: Risk Resolution Model – Invented

29
The given modal above has some improvements over the traditional one. This modal is very
useful for parallel implementation as well. Before going in the detailed implementation first
have look at the task of every step.
1) Initial estimation for different constraints – On the basis of previous reports and present
circumstances we estimate a value for the every constraint. Which works as a base value
for the whole process it can be different for the different activity levels.
2) Contribution of different type of risks – After the first step we can easily classify the risks
according to their frequency, nature and by their resolution capability.
3) Indicators – There can be different type of risks in a phase activity so after classification
we can give them an indicator by which they are recognized and resolved.
4) Treatment – When the various types of risks are arranged in way that they can easily
identified such that which can be resolved first? More the priority gets more preference.
3.3.1 OOP’S CONCEPTS IMPLEMENTED
Basic concepts of OOP’s used in this research are:
Class / Object.
Inheritance.
Neural Network.
CLASS / OBJECT: Class and objects are the main concepts implemented in the OOP’s
methodology. We can describe the class and object as a logical entity and physical reality. In
an easy term we can say that a class a logical map which shows the basic logic and the object
is its physical reality which implements the real logic. We can make no. of object and can
implement at different place. In the same way in this research I have implemented the class
object concept to utilize our resources as well as improve the efficiency of project.
INHERITANCE: In simple words inheritance can be described as the concept by which one
class can use the properties of the other class. Inheritance can be implemented in different
structures. I have implemented the basic idea of reusing the properties not going in detail.
NEURAL NETWORK: It is a type of network in which the information exchange held among
the different nodes of a network in the same manner in which our neurons travel in our brain
the same concept of exchange the information is implemented here.

30
In the diagram given above the main / super class is Risk under which 4 classes are working
these are the 4 risk analysts working in the team and reports are the instances used by other
classes when transition is being implemented.
Fig 18: Traditional procedure to handle the projects

31
Project - 1
Project – 2
Project – 3
Project – 4
Project - n
Fig 19: Parallel Processing model
Member
Member
Member
Member
Member
Risk Analyst -Head
Team - 1 Team - 2 Team – n
Analysis /Review Report
Problem Solution / DM
Proceed to next level

32
Fig 20: Transition of Personnel during handling
The red lines shows transitions of personnel among different projects.

33
MAIN LOGIC STARTS HERE:
The proposed modal is implementable for the parallel processing more than “n” number of
projects. With implement it in parallel approach we defiantly increase our performance and
manpower as well as we can rectify the risks arise during the project’s various phases.
Fig 21: Main concept

34
Necessary condition for every phase: The no of people for every phase must be
N/2.
Reason: It is necessary for a project that it should be completed otherwise there could be a
situation where nobody left for a project and free people shifted to other projects.
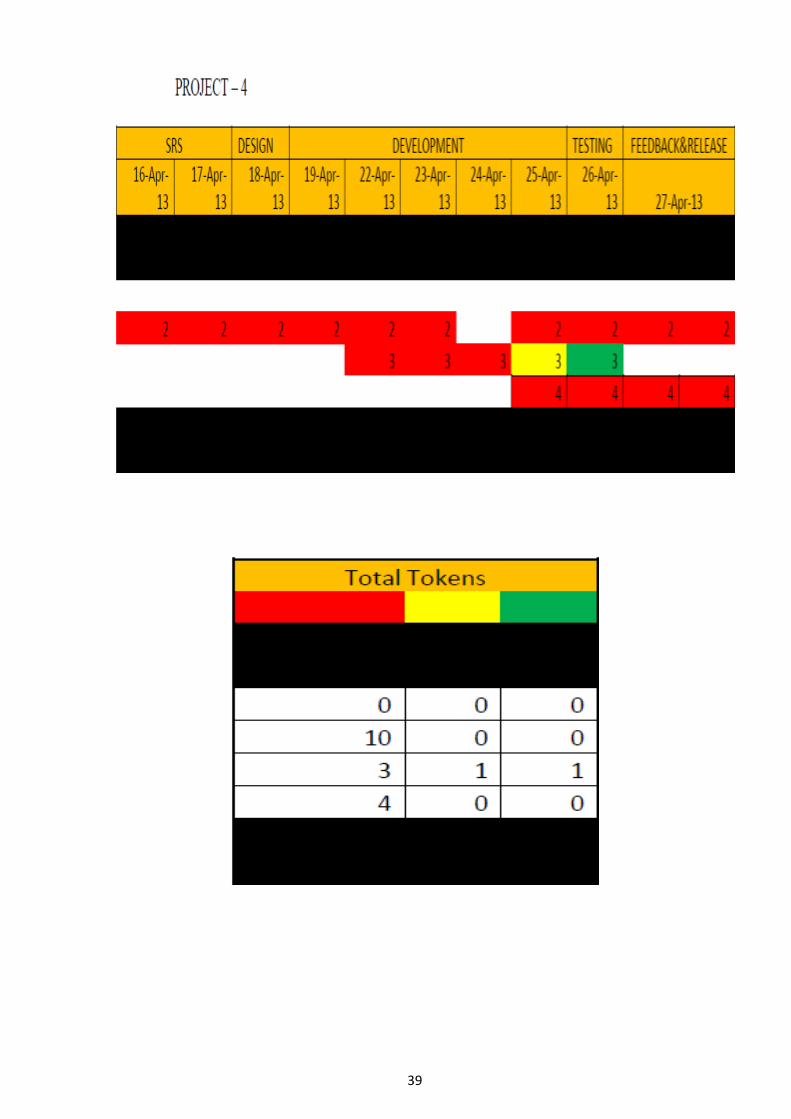
Suppose there are initially 4 people for each project their starting time is same.
1) After phase 1 two members shifted to 2nd project by getting a red token because they have
done their work on 1st project.
2) After phase 2nd 3 members of project no 2 got green tokens and 1 member from project no.
3 got a green these members now shifted to project 1 and got a red token.
3) This process of allotting and submitting of tokens remains continue until the project not
ends.
4) They have a special token according to their working condition there can be 3 conditions –
Advantages of this approach:
I. We can improve overall process.
II. Proper personnel management.
III. Less time consuming.
IV. Risk handling now easy and fast.
V. More a team member gets red tokens more he able to show his performance.
VI. Performance of every team member now easily measured.
VII. Improved predictability about the different risks.
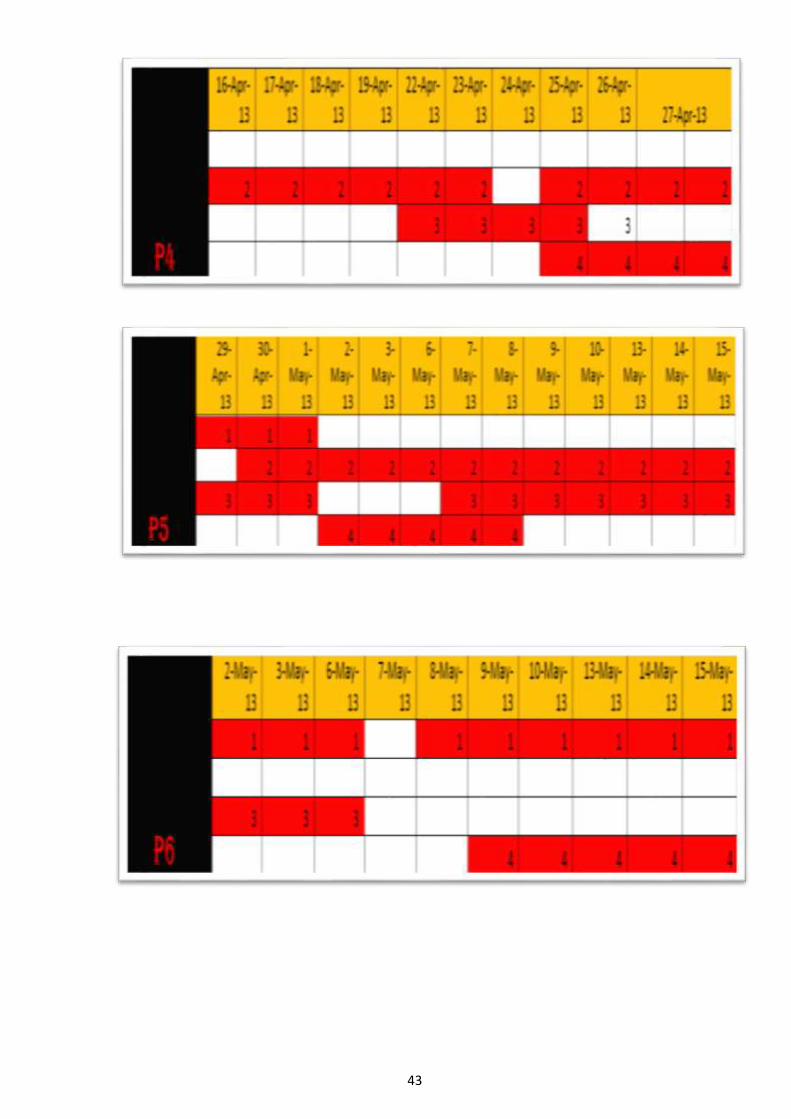
Red token: For the people those are working for a phase and not free at that
time.
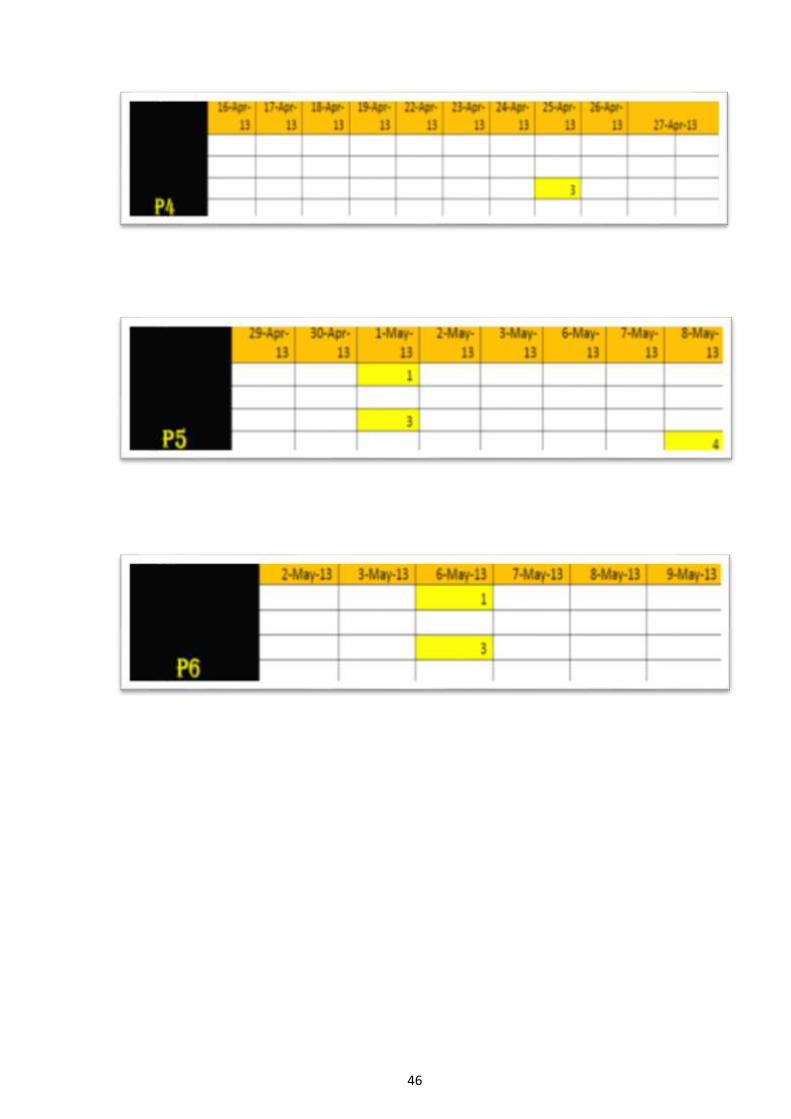
Yellow token: For the people those are near to complete his job.
Green token: Ready to take a task and completely free.

35
CHAPTER – IV
INVESTIGATION REPORTS AND RESULTS
COMPARISION
TOPICS COVERED:
1) REPORTS MAINTAINED DURING IMPLEMENTATION.
2) TOKEN ARRENGEMENT.
3) PROJECT REPORTS.
CATEGORY WISE.
RISK COMPARISION.
PHASE WISE ANALYSIS.
4) RISK REGISTER.
5) RISK BINS.
6) CONCLUSION.

36
4.1 REPORTS MAINTAINED DURING RESEARCH

37

38
39

40

41

42
4.2 TOKEN ARRENGEMENT
43

44

45
46

47
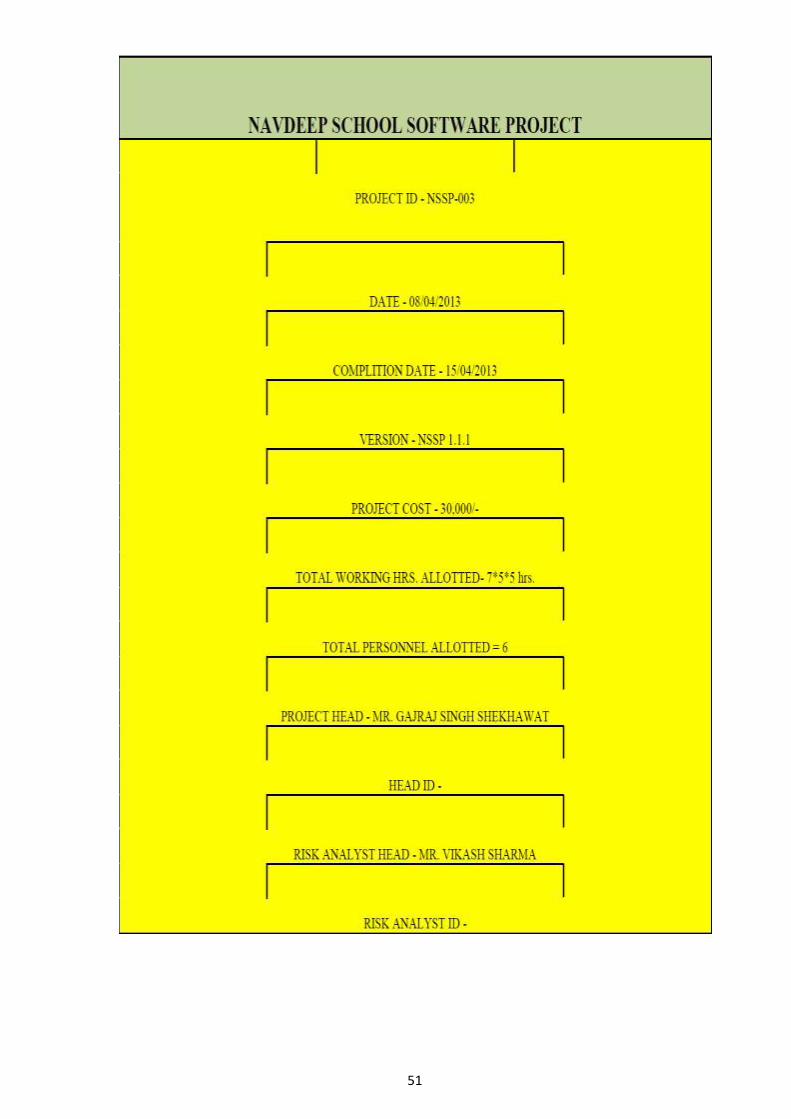
4.3 PROJECT REPORTS MAINTAINED

48

49

50
51

52

53

54

55

56

57

58
4.4 PROBABILITY CHART

59
Fig 22: Probability distribution chart
0%
1 RESOURCE RISK31%
2 PERSONNEL MANAGEMENT
15%3 COST
RISK6%
4 TECHNICAL RISK15%
5 TIMING RISK15%
6 COMMUNICATIO
N RISK18%
Probability distribution

60
4.5 RISK COMPARISION
Fig 23: Risk comparison graph

61
4.6 RISK COMPARISION PHASEWISE
Fig 24: Risk Comparison –Phase wise

62
4.7 RISK REGISTER
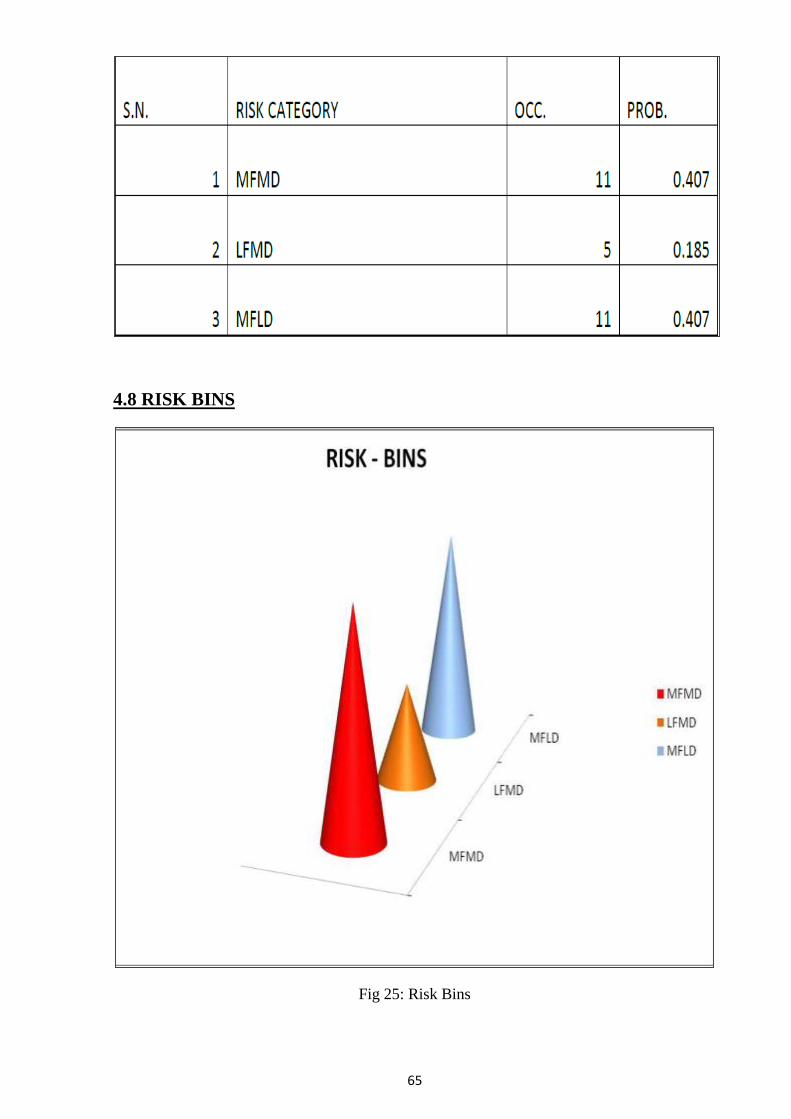
MFMD – most frequent most dangerous
LFMD – less frequent most dangerous
MFLD – most frequent less dangerous

63

64
65
4.8 RISK BINS
Fig 25: Risk Bins
66
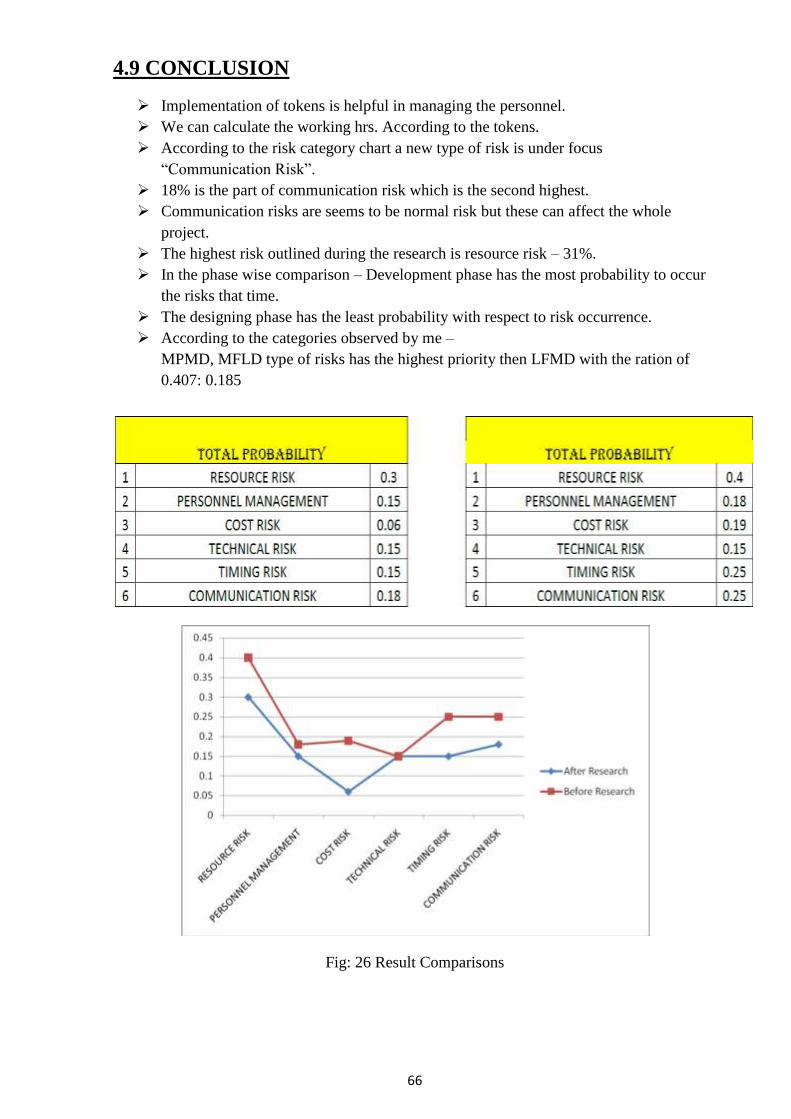
4.9 CONCLUSION
Implementation of tokens is helpful in managing the personnel.
We can calculate the working hrs. According to the tokens.
According to the risk category chart a new type of risk is under focus
“Communication Risk”.
18% is the part of communication risk which is the second highest.
Communication risks are seems to be normal risk but these can affect the whole
project.
The highest risk outlined during the research is resource risk – 31%.
In the phase wise comparison – Development phase has the most probability to occur
the risks that time.
The designing phase has the least probability with respect to risk occurrence.
According to the categories observed by me –
MPMD, MFLD type of risks has the highest priority then LFMD with the ration of
0.407: 0.185
Fig: 26 Result Comparisons
67
REFERENCES
1. http://www.ferma.eu/wp-content/uploads/2011/11/a-risk-management-
standard-english-version.pdf
2. Uncertainty & Risk Analysis a practical guide from Business Dynamics
PricewaterhouseCoopers, MCS.
3. Quantitative Risk Assessment and Risk Management of a Large
Transportation Project by A. McGoey-Smith1, A. Poschmann2 and L.
Campbell3
4. NASSCOM Report released in 2001.
5. Risk Analysis for Large Engineering Projects: Modeling Cost Uncertainty
for Ship Production Activities(Journal of Engineering Valuation and Cost
Analysis, Vol. 2, pp. 285-301)
6. Decision support system for risk management : A case study by “P.K.
Dey”
7. Effect of Task Mental Models on Software Developer’s Performance: An
Experimental Investigation (2012 45th Hawaii International Conference
on System Sciences)
8. A Stochastic Model of Fault Introduction & Removal During Software
Development -Martin A. Stutzke and Carol S. Smidts
9. Holistic Framework for Establishing lnteroperability of Heterogeneous
Software Development Tools and Models
10. Combining Models for Business Decisions and Software Development- I
Christina Wallin, 2Stig Larsson, 3FredrikEkdahl, lIvica Crnkovic
11. Integrating Business and Software Development Models - Christina
Wallin, Fredrik Ekdahl, and Stig Larsson.
12. A Comparison of Software Project Overruns—Flexible versus Sequential
Development Models - Kjetil Moløkken-Østvold, Member, IEEE, and
Magne Jørgensen

68
13. Focusing Graphical User Interfaces in Model-Driven Software
Development - Stefan Link1, Thomas Schuster2, Philip Hoyer1, Sebastian
Abeck1
14. Error Estimation Models Integrating Previous Models and Using Artificial
- Neural Networks for Embedded Software Development Projects(2008
20th IEEE International Conference on Tools with Artificial Intelligence)
15. UMDD: User Model Driven Software Development(2008 IEEE/IFIP
International Conference on Embedded and Ubiquitous Computing)
16. Journal of Engineering Valuation and Cost Analysis, Vol. 2, pp. 285-301
Risk Analysis for Large Engineering Projects: Modeling Cost Uncertainty
for Ship Production Activities M.R. DUFFEY1 and J. R. VAN DORP
School of Engineering and Applied Science The George Washington
University Washington, DC.
17. The evolution tree : A maintenance – oriented software development
model – Amir Tomer, Stephen R. Schach.