Chapter 4: Congruent Triangles Lesson 1: Classifying Triangles.

Delta-X Research Inc
Introduction toDuval's Diagnostic Triangles
Presented atThe Chemlab Conference
Calgary AB -- Sep 9-10 2010
Dr. Jim DukarmDelta-X Research Inc.Victoria BC Canada
250-592-2998
Delta-X Research Inc
Topics
The original triangle for oil-filled transformers Tricks for visualizing fault evolution LTC DGA diagnostic triangle Transformer DGA triangles for silicone & esters Triangles for low-energy transformer faults
Delta-X Research Inc
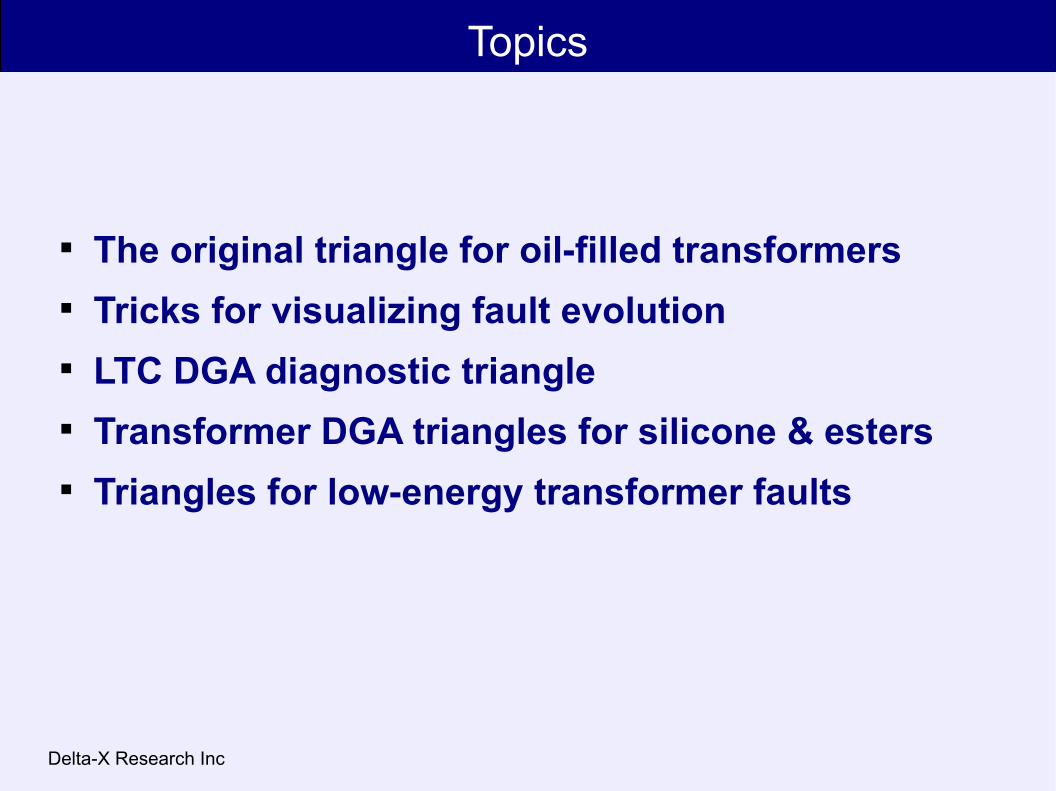
Basic Triangle Chart
Each side of the triangle chart is a coordinate axis going from 0% to 100%.
Points (x, y, z) plotted in the chart must have x+y+z=100%.
These charts are used in soil science for classifying soil texture by clay, sand, and silt content.
Michel Duval has pioneered their use in DGA.

Delta-X Research Inc
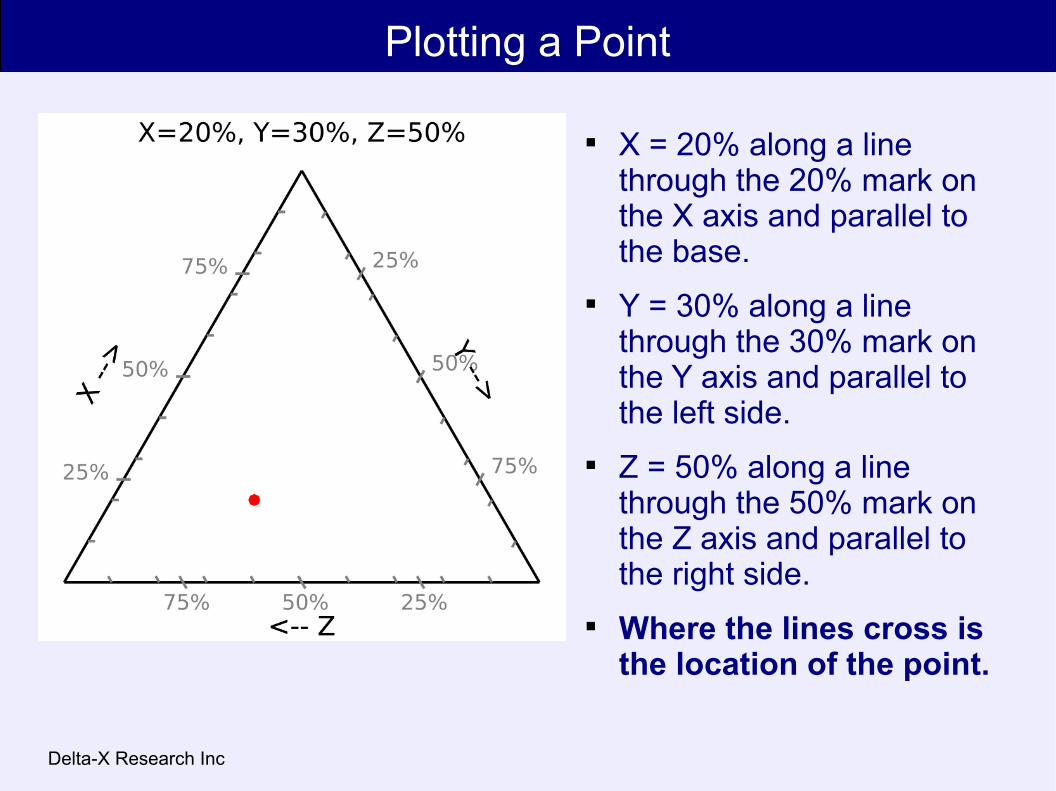
Plotting a Point
X = 20% along a line through the 20% mark on the X axis and parallel to the base.

Delta-X Research Inc
Plotting a Point
X = 20% along a line through the 20% mark on the X axis and parallel to the base.
Y = 30% along a line through the 30% mark on the Y axis and parallel to the left side.

Delta-X Research Inc
Plotting a Point
X = 20% along a line through the 20% mark on the X axis and parallel to the base.
Y = 30% along a line through the 30% mark on the Y axis and parallel to the left side.
Z = 50% along a line through the 50% mark on the Z axis and parallel to the right side.
Delta-X Research Inc
Plotting a Point
X = 20% along a line through the 20% mark on the X axis and parallel to the base.
Y = 30% along a line through the 30% mark on the Y axis and parallel to the left side.
Z = 50% along a line through the 50% mark on the Z axis and parallel to the right side.
Where the lines cross is the location of the point.

Delta-X Research Inc
Michel Duval
Michel Duval, a chemist at Hydro Quebec's IREQ research institute, invented the original Duval Triangle for transformer DGA, which was included in IEC 60599-1999.
Duval published the triangles 2-5 in IEEE Electrical Insulation Magazine, Vol 24 No 6, Nov-Dec 2008. Triangles 6 and 7 were developed in connection with Duval's work for CIGRE.

Delta-X Research Inc
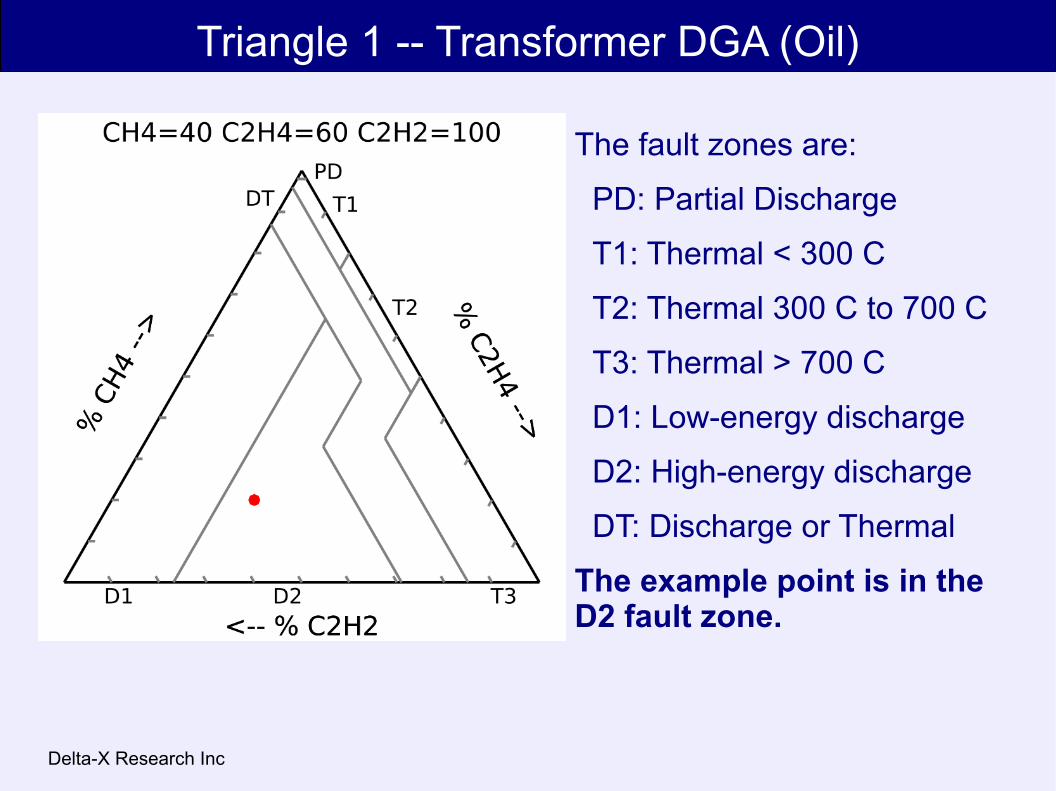
Triangle 1 -- Transformer DGA (Oil)
This is the "classic" Duval Triangle for DGA in oil-filled transformers.
X, Y, and Z are Methane, Ethylene, and Acetylene, expressed as percentages of their sum (ppm).
The triangle's interior is subdivided into fault zones.
This chart only identifies fault types corresponding to gas patterns. It cannot indicate whether a fault is actually present.

Delta-X Research Inc
Triangle 1 -- Transformer DGA (Oil)
Suppose an oil sample has:
40 ppm methane,
60 ppm ethylene, and
100 ppm acetylene.
T = 40 + 60 + 100 = 200
methane = 40/200 = 20%
ethylene = 60/200 = 30%
acetylene = 100/200 = 50%
The point is plotted as in the "plain triangle" example.
Delta-X Research Inc
Triangle 1 -- Transformer DGA (Oil)
The fault zones are:
PD: Partial Discharge
T1: Thermal < 300 C
T2: Thermal 300 C to 700 C
T3: Thermal > 700 C
D1: Low-energy discharge
D2: High-energy discharge
DT: Discharge or Thermal
The example point is in the D2 fault zone.
Delta-X Research Inc
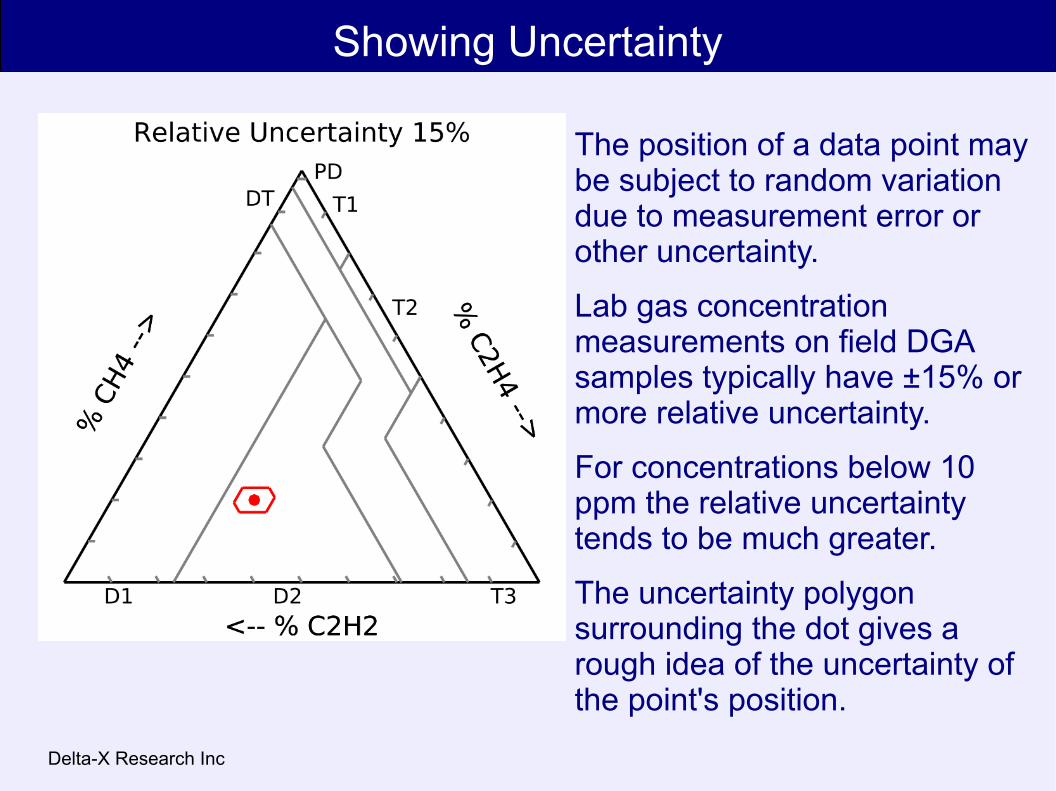
Showing Uncertainty
The position of a data point may be subject to random variation due to measurement error or other uncertainty.
Lab gas concentration measurements on field DGA samples typically have ±15% or more relative uncertainty.
For concentrations below 10 ppm the relative uncertainty tends to be much greater.
The uncertainty polygon surrounding the dot gives a rough idea of the uncertainty of the point's position.

Delta-X Research Inc
Showing Uncertainty
For points where all 3 gas concentrations are 10 ppm or more, the 15% uncertainty zone is about the same size.
The red dot is 40, 60, 100 ppm.
The blue dot is 2000, 800, 1200 ppm.
For points where any gases are below 10 ppm, the uncertainty zone will be larger, making the corresponding diagnosis more ambiguous.
The black dot is 3, 5, 2 ppm.

Delta-X Research Inc
Using Gas Increments
In this example, the "baseline" sample, representing residual gas, has 62 ppm methane, 35 ppm ethylene, and 3 ppm acetylene (plus sign in T2).

Delta-X Research Inc
Using Gas Increments
In this example, the "baseline" sample, representing residual gas, has 62 ppm methane, 35 ppm ethylene, and 3 ppm acetylene (plus sign in T2).
The next sample has 72 ppm methane, 41 ppm ethylene, and 7 ppm acetylene (red dot near T2).
These samples look sort of similar, but the acetylene has doubled. What does the recently formed gas indicate?

Delta-X Research Inc
Using Gas Increments
In this example, the "baseline" sample, representing residual gas, has 62 ppm methane, 35 ppm ethylene, and 3 ppm acetylene (plus sign in T2).
The next sample has 72 ppm methane, 41 ppm ethylene, and 7 ppm acetylene (red dot near T2).
These samples look sort of similar, but the acetylene has doubled. What does the recently formed gas look like?
Subtracting the baseline from sample 2 gives us the "delta" in D2.

Delta-X Research Inc
Visualizing Fault Evolution
Sometimes it is useful to plot pre-fault samples on the triangle to get an idea how a fault has developed over time.
The black plus sign is the "baseline" sample from 2000, and the black dot next to it is a very similar sample from 2001.
The small red dot in DT is a 2002 sample with somewhat increased gases, and the large red dot in T3 is a 2004 sample with greatly increased gases.
Could we have figured out already in 2002 what was going on?

Delta-X Research Inc
Visualizing Fault Evolution
The "delta" point in T3 with the uncertainty region plotted around it represents the difference between the 2002 sample and the baseline.
By looking at the gas increment in 2002, when a significant increase was noticed, the T3 fault type fitting the gas generated between 2000 and 2002 could already be identified.

Delta-X Research Inc
Triangle 2 -- LTC DGA (Oil)
The LTC DGA triangle is for LTC compartments with arcing contacts in oil.
Fault zones:
N: Normal operation
T3: Thermal > 700 C, coking
T2: Thermal 300-700 C, coking
X3: D2 or transition to T2, T3
D1: Abnormal arcing
X1: D1 or thermal
For Vacuum-type LTCs, use the classic Triangle 1.

Delta-X Research Inc
TLH Population Data in LTC Triangle
Model TLH tapchangers have a single oil compartment with arcing in oil and use reactive bridging.
All the samples in the TLH database having nonzero methane, ethylene, and acetylene are plotted here.
Black dots are samples with moderate gas concentrations.
Red dots are samples where methane, ethylene, or acetylene exceeds an outlier limit.
DGA results from "normal" TLHs tend to cluster in the lower part of the N zone.

Delta-X Research Inc
TLH Population Data in LTC Triangle
How far can a DGA sample stray from the N zone before we care about it?
The blue lines represent the 95% and 99% lognormal limits for the ethylene/acetylene ratio.
The cyan lines represent the 95% and 99% lognormal limits for the methane/acetylene ratio.
Plotting the model-specific ratio limits on the LTC triangle shows when a DGA sample has a ratio value which is exceptional for that LTC model. The fault zone suggests the possible fault type.
Delta-X Research Inc
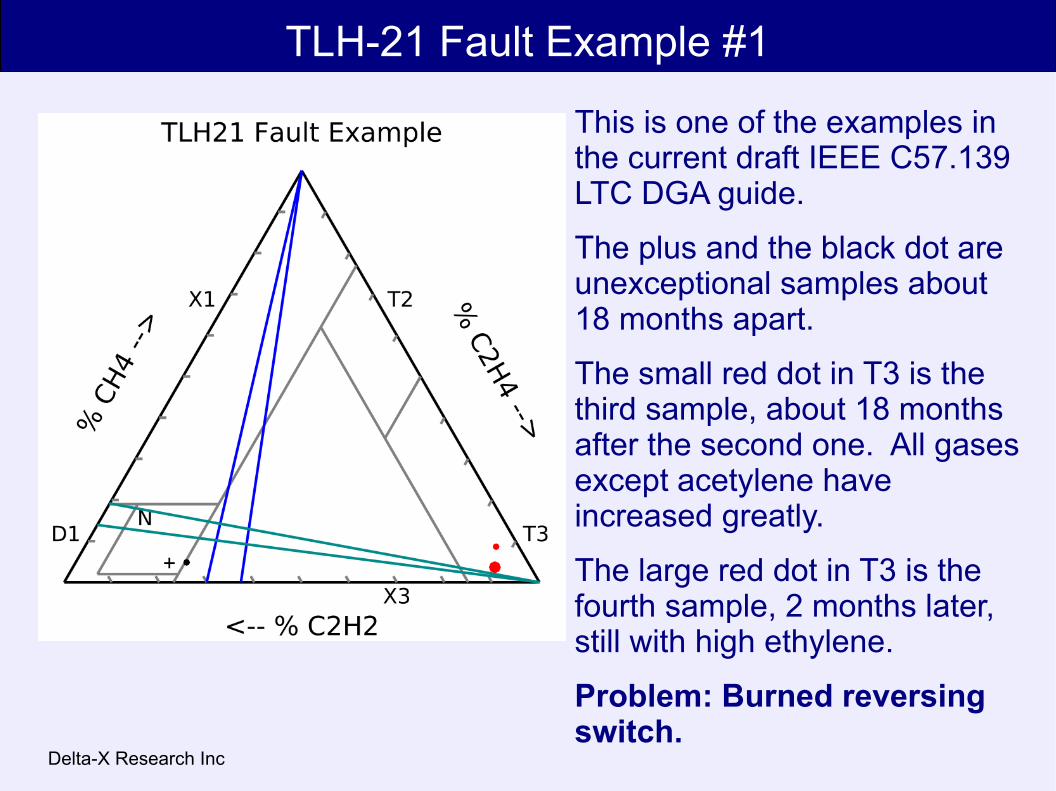
TLH-21 Fault Example #1
This is one of the examples in the current draft IEEE C57.139 LTC DGA guide.
The plus and the black dot are unexceptional samples about 18 months apart.
The small red dot in T3 is the third sample, about 18 months after the second one. All gases except acetylene have increased greatly.
The large red dot in T3 is the fourth sample, 2 months later, still with high ethylene.
Problem: Burned reversing switch.

Delta-X Research Inc
TLH-21 Fault Example #2
This TLH was sampled quarterly after installation.
(The first sample had zero acetylene and almost no gas, so it is on the right edge at the T2-T3 boundary).
Ethylene/acetylene ratios were marginal.
Something evidently went wrong as of the fourth sample (red dot in X3).
Records show that this LTC was put back into service a few months later with fresh oil. (See next example).

Delta-X Research Inc
TLH-21 No-Fault Example
After repairs, the TLH from Example #2 operated normally for several years, with sampling every 3 to 6 months.
The initial sample (plus in T3) and one other sample (dot in T2) have gas concentrations too low for calculating ratios, so they would not indicate any fault.
The last few samples clustered near the final one (large dot) appear to be on the verge of exceeding the ratio caution limits. This may be a sign of gradual contact coking.

Delta-X Research Inc
Triangle 3 -- Transformer DGA (Silicone)
Triangle 3 is an adaptation of the classic Triangle 1 for alternative insulating fluids.
The fault zones are the same, but their proportions are different for each fluid.
This is the triangle for silicone fluid (polydimethylsiloxane).
Delta-X Research Inc
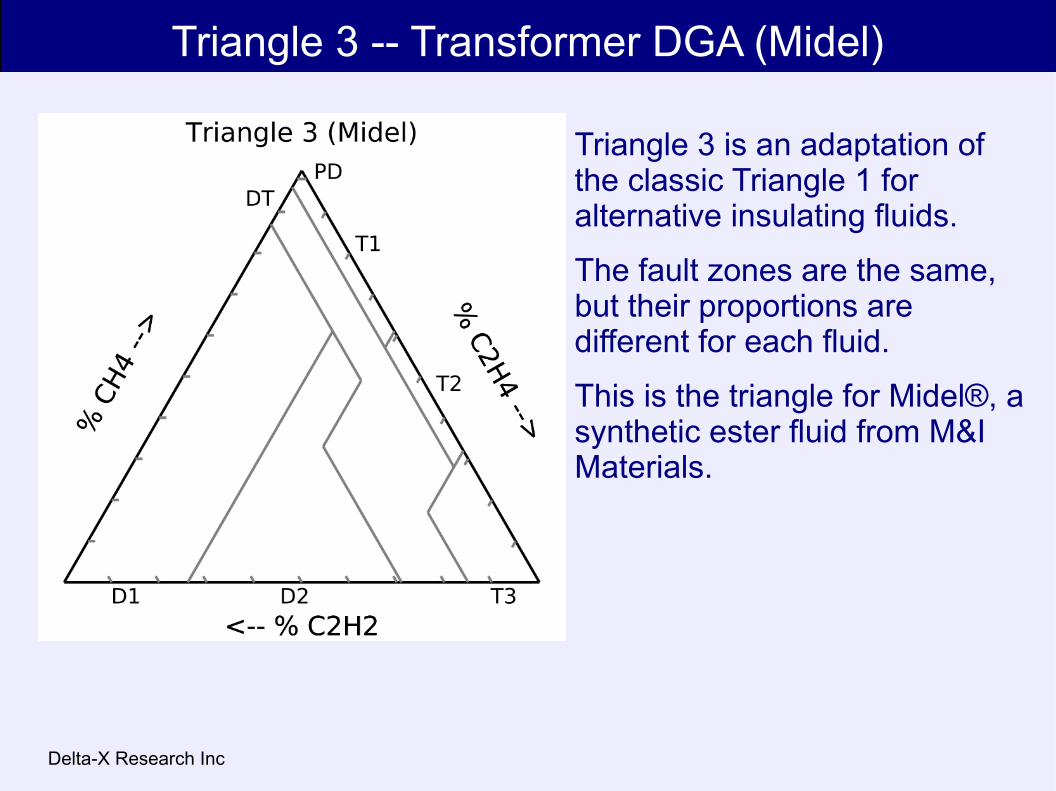
Triangle 3 -- Transformer DGA (Midel)
Triangle 3 is an adaptation of the classic Triangle 1 for alternative insulating fluids.
The fault zones are the same, but their proportions are different for each fluid.
This is the triangle for Midel®, a synthetic ester fluid from M&I Materials.

Delta-X Research Inc
Triangle 3 -- Transformer DGA (FR3)
Triangle 3 is an adaptation of the classic Triangle 1 for alternative insulating fluids.
The fault zones are the same, but their proportions are different for each fluid.
This is the triangle for Envirotemp® FR3™, a natural ester fluid from Cooper Power Systems.

Delta-X Research Inc
Triangle 3 -- Transformer DGA (BIOTEMP)
Triangle 3 is an adaptation of the classic Triangle 1 for alternative insulating fluids.
The fault zones are the same, but their proportions are different for each fluid.
This is the triangle for BIOTEMP®, a natural ester fluid from ABB.

Delta-X Research Inc
Triangle 4 -- Low Temperature Faults (Oil)
Triangle 4 is for diagnosis of low temperature faults in oil-filled transformers. It is for use only when Triangle 1 indicates PD, T1, or T2 or can't be used.
Triangle 4 uses Hydrogen, Methane, and Ethane.
Fault zones:
PD: Partial discharge
S: Stray gassing
C: Hot spots w/ carbonization
O: Overheating < 250 C
ND: Not determined

Delta-X Research Inc
Triangle 4 -- Stray Gassing Example
In this example we have four samples at 0, 60, 120, and 180 days, with only 2-3 ppm of methane and ethylene and no acetylene. Ethane is about 25 ppm, and hydrogen goes from 149 to 284, 388, then 407 ppm.
This triangle indicates that the hydrogen formation seems to be stray gassing.
NOTE: Duval says that the upper boundary between C and S may change after more cases of C are observed.

Delta-X Research Inc
Triangle 5 -- Low Temperature Faults (Oil)
Triangle 5 is also for diagnosis of low temperature faults in oil-filled transformers. It is for use only when Triangle 1 indicates PD, T1, or T2 or can't be used.
Triangle 5 uses Methane, Ethylene, and Ethane.
Fault zones:
PD: Partial discharge
S: Stray gassing
C: Hot spots w/ carbonization
O: Overheating < 250 C
T3: Thermal > 700 C
ND: Not determined

Delta-X Research Inc
Triangle 6 -- Low Temperature Faults (FR3)
Triangle 6 is similar to Triangle 4, except that it is configured for FR3. It is for use only when Triangle 3 indicates PD, T1, or T2 or can't be used.
Triangle 6 uses Hydrogen, Methane, and Ethane.
Fault zones:
PD: Partial discharge
S: Stray gassing
C: Hot spots w/ carbonization
O: Overheating < 250 C
ND: Not determined

Delta-X Research Inc
Triangle 7 -- Low Temperature Faults (FR3)
Triangle 7 for FR3 corresponds to triangle 5 for mineral oil. It is for use only when Triangle 3 indicates PD, T1, or T2 or can't be used.
Triangle 7 uses Methane, Ethylene, and Ethane.
Fault zones:
PD: Partial discharge
S: Stray gassing
C: Hot spots w/ carbonization
O: Overheating < 250 C
T3: Thermal > 700 C
ND: Not determined

Advice on DGA Diagnosis
Recognize and reject bad data. Solve data problems before attempting interpretation.
Don't even look at the triangle unless some combustible gases have increased significantly.
Watch for migration towards a different fault type or "homing in" on a particular fault type while gas levels are increasing.
While gas levels are increasing, subtract background levels to get results for recently-generated gas.
An uncertainty region overlapping multiple fault zones indicates ambiguity in the diagnosis.
Beware of unusual situations.
Delta-X Research Inc
Questions and Discussion


![· Web viewWays to Prove Triangles Congruent [SSS, SAS, ASA, AAS, HL] Inequalities of Triangles Isosceles Triangles Triangle Inequality Theorem Similar Triangles & Polygons Sum of](https://static.fdocuments.us/doc/165x107/5e58c6277f1152553133146d/web-view-ways-to-prove-triangles-congruent-sss-sas-asa-aas-hl-inequalities.jpg)