Introduction To Data Mining & Probabilistic Reasoning · Precision-recall curves, break-even-point...
23
RETRIEVAL EVALUATION Dr. Gjergji Kasneci | Introduction to Information Retrieval | WS 2012-13 1
Transcript of Introduction To Data Mining & Probabilistic Reasoning · Precision-recall curves, break-even-point...

RETRIEVAL EVALUATION
Dr. Gjergji Kasneci | Introduction to Information Retrieval | WS 2012-13 1

Outline
Intro
Basics of probability and information theory
Retrieval models
Retrieval evaluation Basic measures: precision, recall Combined measures Measures for integrating user ratings Ranking measures
Link analysis
From queries to top-k results Social search
Dr. Gjergji Kasneci | Introduction to Information Retrieval | WS 2012-13 2
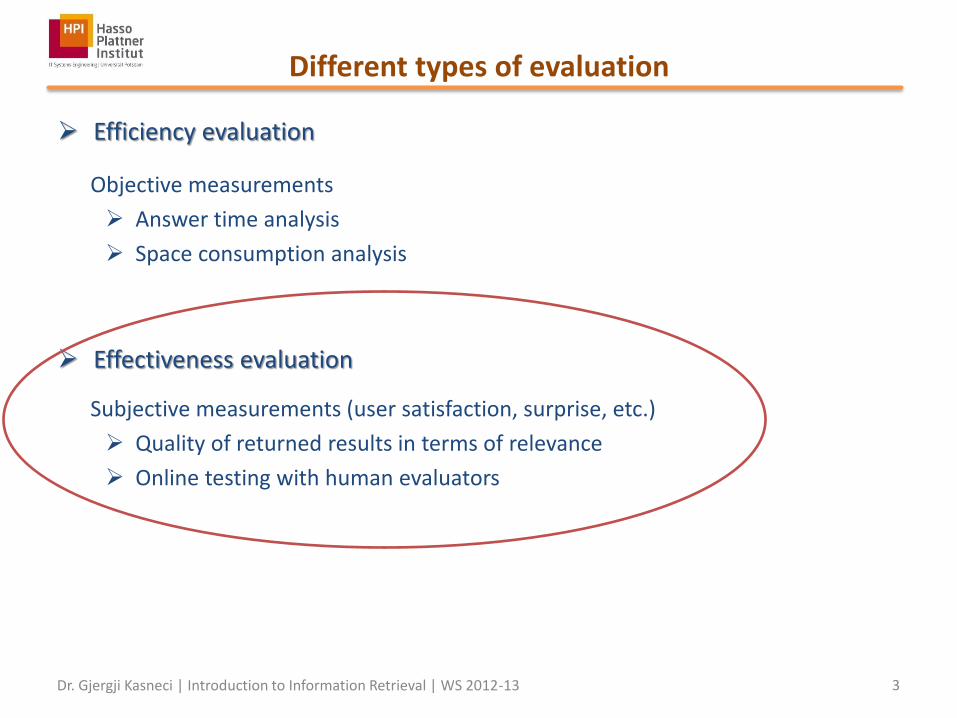
Different types of evaluation
Efficiency evaluation
Objective measurements
Answer time analysis
Space consumption analysis
Effectiveness evaluation
Subjective measurements (user satisfaction, surprise, etc.)
Quality of returned results in terms of relevance
Online testing with human evaluators
Dr. Gjergji Kasneci | Introduction to Information Retrieval | WS 2012-13 3
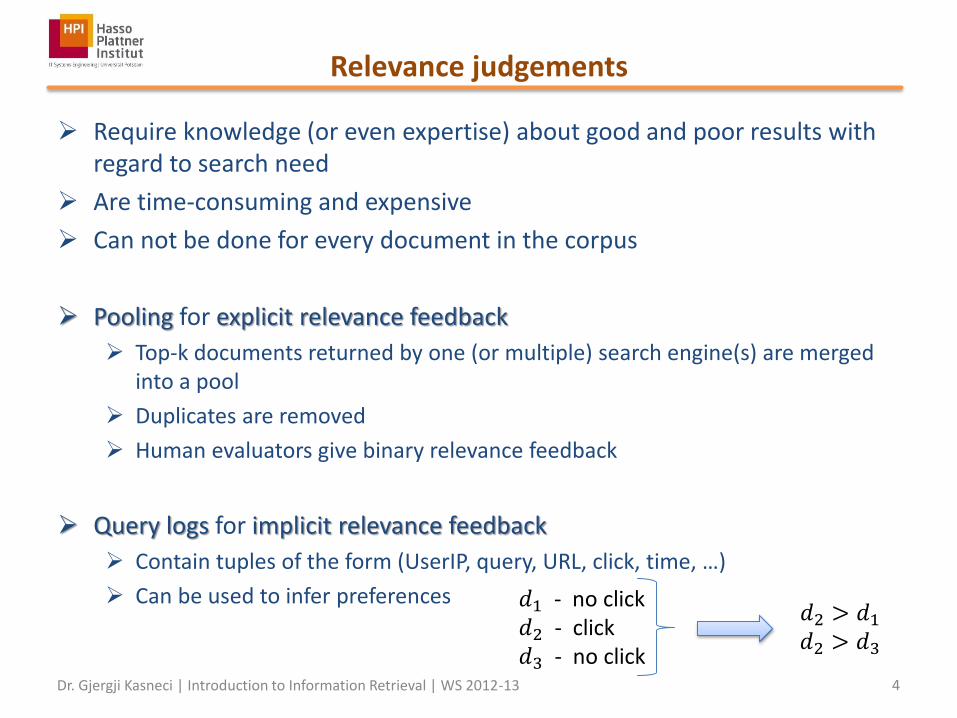
Relevance judgements
Require knowledge (or even expertise) about good and poor results with regard to search need
Are time-consuming and expensive
Can not be done for every document in the corpus
Pooling for explicit relevance feedback
Top-k documents returned by one (or multiple) search engine(s) are merged into a pool
Duplicates are removed
Human evaluators give binary relevance feedback
Query logs for implicit relevance feedback
Contain tuples of the form (UserIP, query, URL, click, time, …)
Can be used to infer preferences
Dr. Gjergji Kasneci | Introduction to Information Retrieval | WS 2012-13 4
𝑑1 - no click 𝑑2 - click 𝑑3 - no click
𝑑2 > 𝑑1 𝑑2 > 𝑑3

Precision & recall
Dr. Gjergji Kasneci | Introduction to Information Retrieval | WS 2012-13 5
𝐶: Corpus
𝐴: Answers
𝑅: Relevant docs
𝑃𝑟𝑒𝑐𝑖𝑠𝑖𝑜𝑛 =|𝑅 ∩ 𝐴|
𝐴 𝑅𝑒𝑐𝑎𝑙𝑙 =
|𝑅 ∩ 𝐴|
𝑅
False positive: non-relevant document in the answer set (analogous for true negative) False negative: relevant document not in the answer set (analogous for true positive) Optimizing for precision ⟺ increasing the probability of a result (in the answer set) being relevant Optimizing for recall ⟺ increasing the probability of a relevant doc being in the answer set
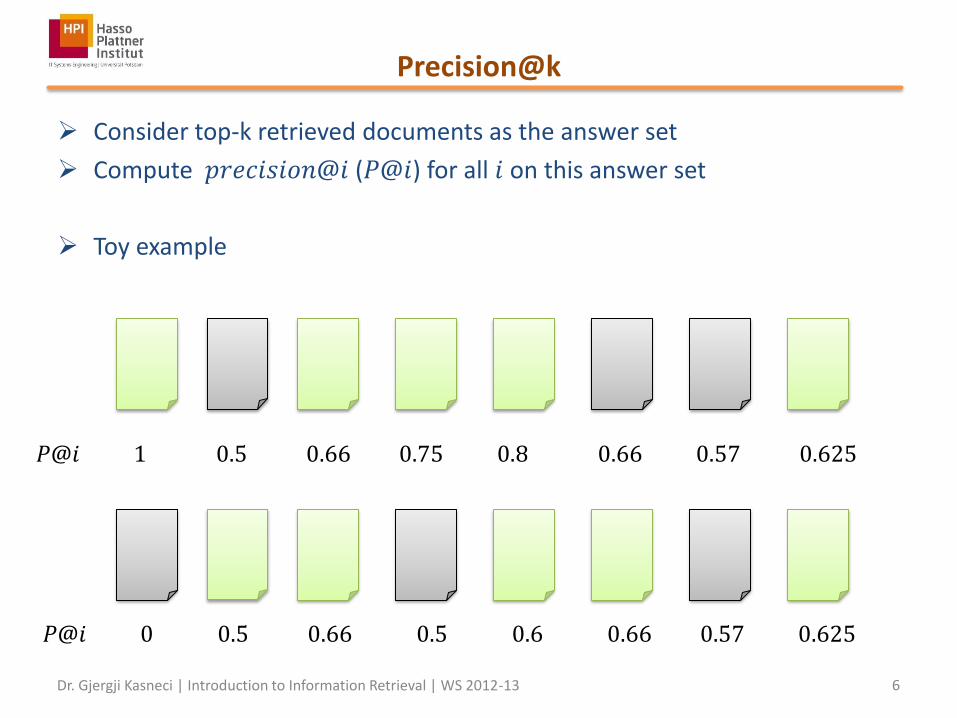
Precision@k
Consider top-k retrieved documents as the answer set
Compute 𝑝𝑟𝑒𝑐𝑖𝑠𝑖𝑜𝑛@𝑖 (𝑃@𝑖) for all 𝑖 on this answer set
Toy example
𝑃@𝑖 1 0.5 0.66 0.75 0.8 0.66 0.57 0.625
𝑃@𝑖 0 0.5 0.66 0.5 0.6 0.66 0.57 0.625
Dr. Gjergji Kasneci | Introduction to Information Retrieval | WS 2012-13 6

Precision-recall curves (1)
Toy example: suppose we have found all relevant documents
𝑃@𝑖 1 0.5 0.66 0.75 0.8 0.66 0.57 0.625 𝑅𝑒𝑐𝑎𝑙𝑙 0.2 0.2 0.4 0.6 0.8 0.8 0.8 1
Pre
cisi
on
Recall
1.0
1.0
Dr. Gjergji Kasneci | Introduction to Information Retrieval | WS 2012-13 7
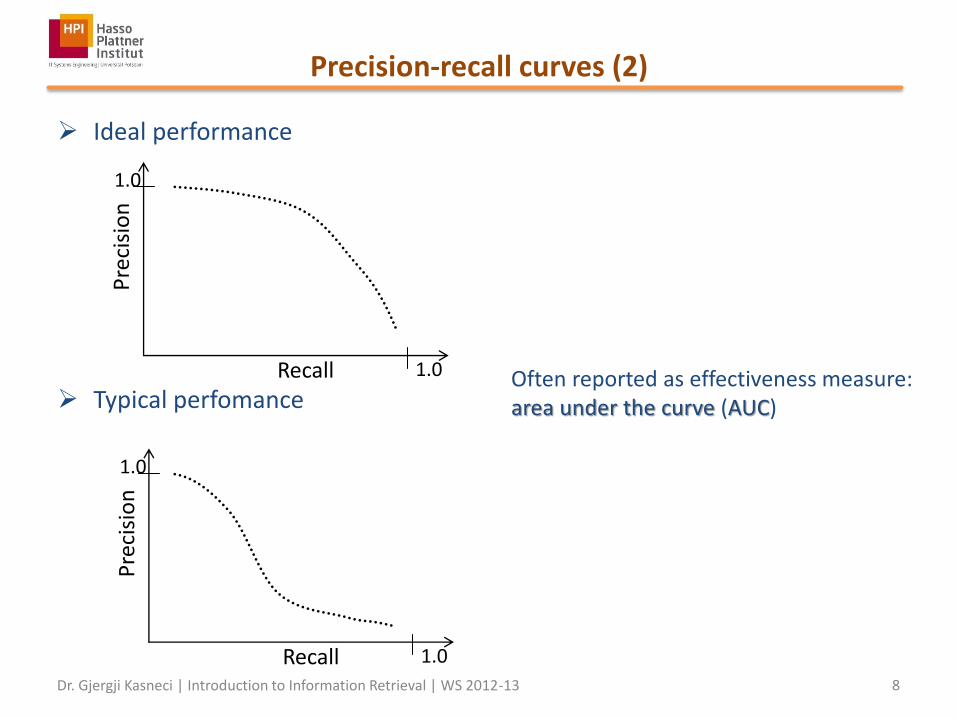
Precision-recall curves (2)
Ideal performance
Typical perfomance
Pre
cisi
on
Recall
1.0
1.0
Pre
cisi
on
Recall
1.0
1.0
Often reported as effectiveness measure: area under the curve (AUC)
Dr. Gjergji Kasneci | Introduction to Information Retrieval | WS 2012-13 8

Break-even-point of precision and recall
𝑃𝑟𝑒𝑐𝑖𝑠𝑖𝑜𝑛 = 𝑣 = 𝑅𝑒𝑐𝑎𝑙𝑙
worse performance
better performance
BreakEvenPoint=0.66
Dr. Gjergji Kasneci | Introduction to Information Retrieval | WS 2012-13 9

True-positive rate vs. false-positive rate
𝑇𝑟𝑢𝑒 𝑃𝑜𝑠𝑖𝑡𝑖𝑣𝑒 𝑅𝑎𝑡𝑒 𝑇𝑃𝑅 = 𝑅𝑒𝑐𝑎𝑙𝑙 =|𝐴 ∩ 𝑅|
𝑅
𝐹𝑎𝑙𝑠𝑒 𝑃𝑜𝑠𝑡𝑖𝑡𝑖𝑣𝑒 𝑅𝑎𝑡𝑒 𝐹𝑃𝑅 = 𝐹𝑎𝑙𝑙𝑜𝑢𝑡 =|𝐴 ∩ 𝑅 |
𝑅
Dr. Gjergji Kasneci | Introduction to Information Retrieval | WS 2012-13 10
ROC (receiver-operating characteristics) curves
tpr
fpr
1.0
1.0

ROC (receiver-operating characteristics) curves
Plotting true-positive rate vs. false-positive rate
Ranking Relevant Source: I.Witten, E. Frank, M. Hall: Data Mining –
Practical Machine Learning Tools and Techniques
Often reported as effectiveness measure: area under the curve (AUC)
Dr. Gjergji Kasneci | Introduction to Information Retrieval | WS 2012-13 11
F-measure
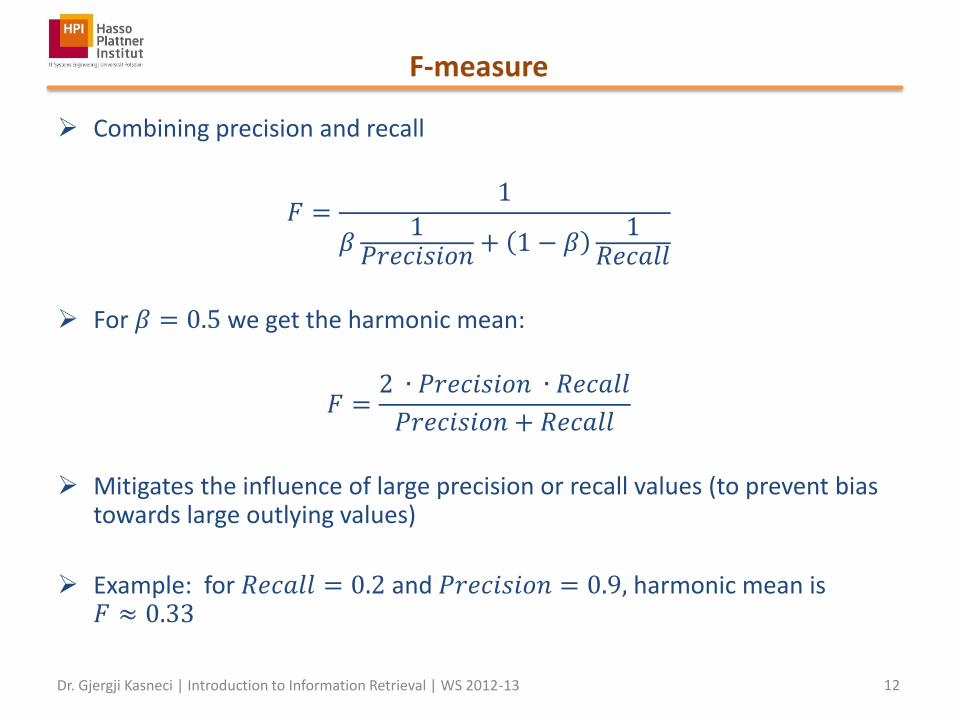
Combining precision and recall
𝐹 =1
𝛽1
𝑃𝑟𝑒𝑐𝑖𝑠𝑖𝑜𝑛+ 1 − 𝛽
1𝑅𝑒𝑐𝑎𝑙𝑙
For 𝛽 = 0.5 we get the harmonic mean:
𝐹 =2 ∙ 𝑃𝑟𝑒𝑐𝑖𝑠𝑖𝑜𝑛 ∙ 𝑅𝑒𝑐𝑎𝑙𝑙
𝑃𝑟𝑒𝑐𝑖𝑠𝑖𝑜𝑛 + 𝑅𝑒𝑐𝑎𝑙𝑙
Mitigates the influence of large precision or recall values (to prevent bias towards large outlying values)
Example: for 𝑅𝑒𝑐𝑎𝑙𝑙 = 0.2 and 𝑃𝑟𝑒𝑐𝑖𝑠𝑖𝑜𝑛 = 0.9, harmonic mean is 𝐹 ≈ 0.33
Dr. Gjergji Kasneci | Introduction to Information Retrieval | WS 2012-13 12
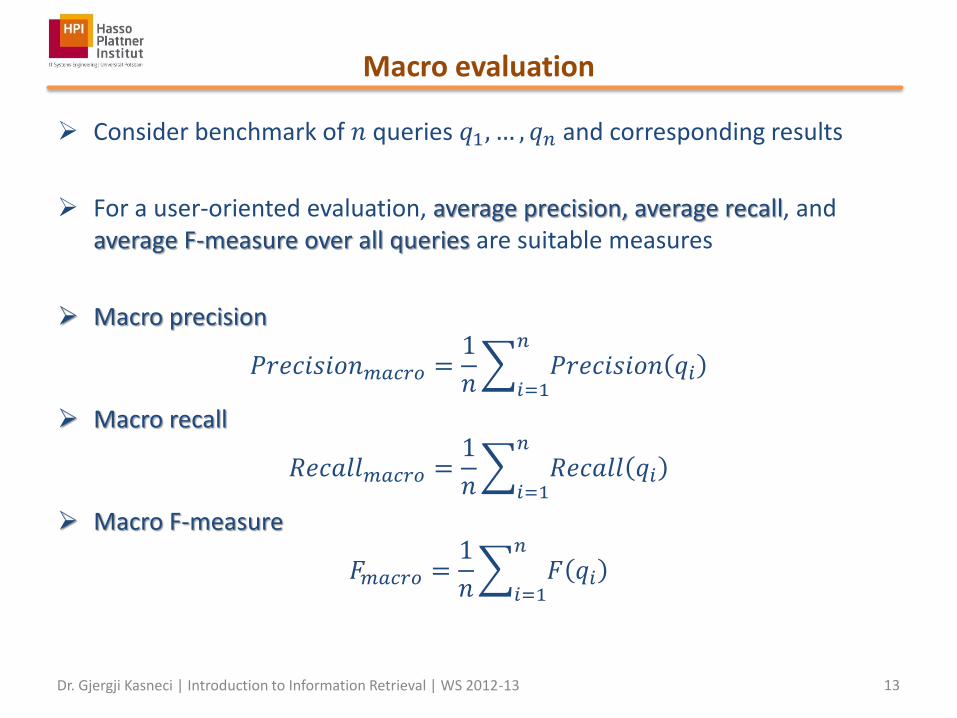
Macro evaluation
Consider benchmark of 𝑛 queries 𝑞1, … , 𝑞𝑛 and corresponding results
For a user-oriented evaluation, average precision, average recall, and average F-measure over all queries are suitable measures
Macro precision
𝑃𝑟𝑒𝑐𝑖𝑠𝑖𝑜𝑛𝑚𝑎𝑐𝑟𝑜 =1
𝑛 𝑃𝑟𝑒𝑐𝑖𝑠𝑖𝑜𝑛 𝑞𝑖
𝑛
𝑖=1
Macro recall
𝑅𝑒𝑐𝑎𝑙𝑙𝑚𝑎𝑐𝑟𝑜 =1
𝑛 𝑅𝑒𝑐𝑎𝑙𝑙 𝑞𝑖
𝑛
𝑖=1
Macro F-measure
𝐹𝑚𝑎𝑐𝑟𝑜 =1
𝑛 𝐹 𝑞𝑖
𝑛
𝑖=1
Dr. Gjergji Kasneci | Introduction to Information Retrieval | WS 2012-13 13
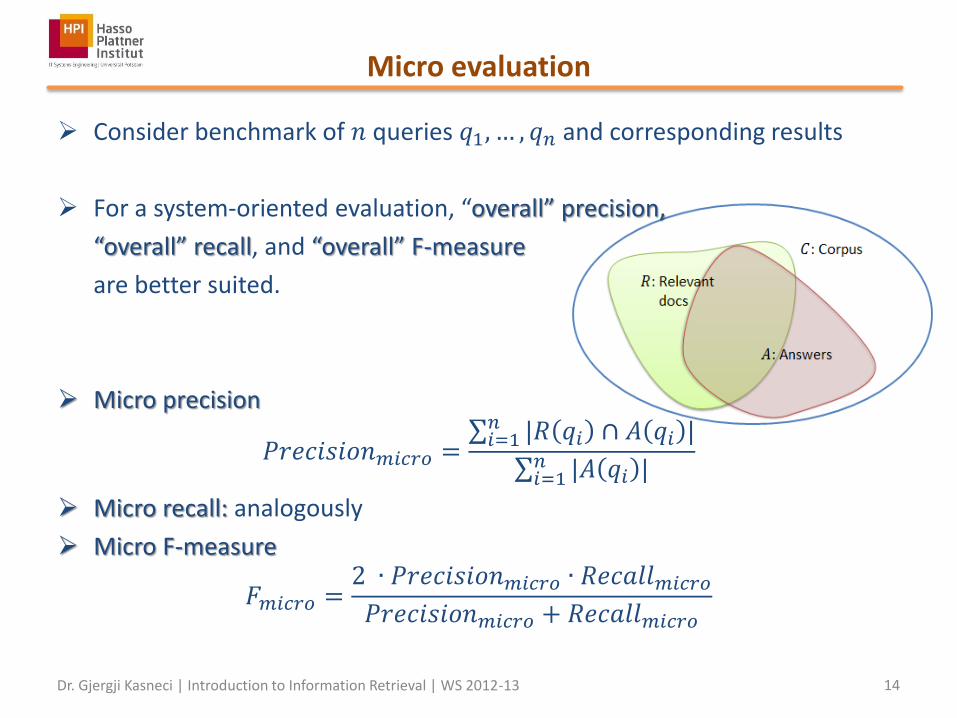
Micro evaluation
Consider benchmark of 𝑛 queries 𝑞1, … , 𝑞𝑛 and corresponding results
For a system-oriented evaluation, “overall” precision,
“overall” recall, and “overall” F-measure
are better suited.
Micro precision
𝑃𝑟𝑒𝑐𝑖𝑠𝑖𝑜𝑛𝑚𝑖𝑐𝑟𝑜 = |𝑅 𝑞𝑖 ∩ 𝐴 𝑞𝑖 |𝑛𝑖=1
|𝐴 𝑞𝑖 |𝑛𝑖=1
Micro recall: analogously
Micro F-measure
𝐹𝑚𝑖𝑐𝑟𝑜 =2 ∙ 𝑃𝑟𝑒𝑐𝑖𝑠𝑖𝑜𝑛𝑚𝑖𝑐𝑟𝑜 ∙ 𝑅𝑒𝑐𝑎𝑙𝑙𝑚𝑖𝑐𝑟𝑜
𝑃𝑟𝑒𝑐𝑖𝑠𝑖𝑜𝑛𝑚𝑖𝑐𝑟𝑜 + 𝑅𝑒𝑐𝑎𝑙𝑙𝑚𝑖𝑐𝑟𝑜
Dr. Gjergji Kasneci | Introduction to Information Retrieval | WS 2012-13 14
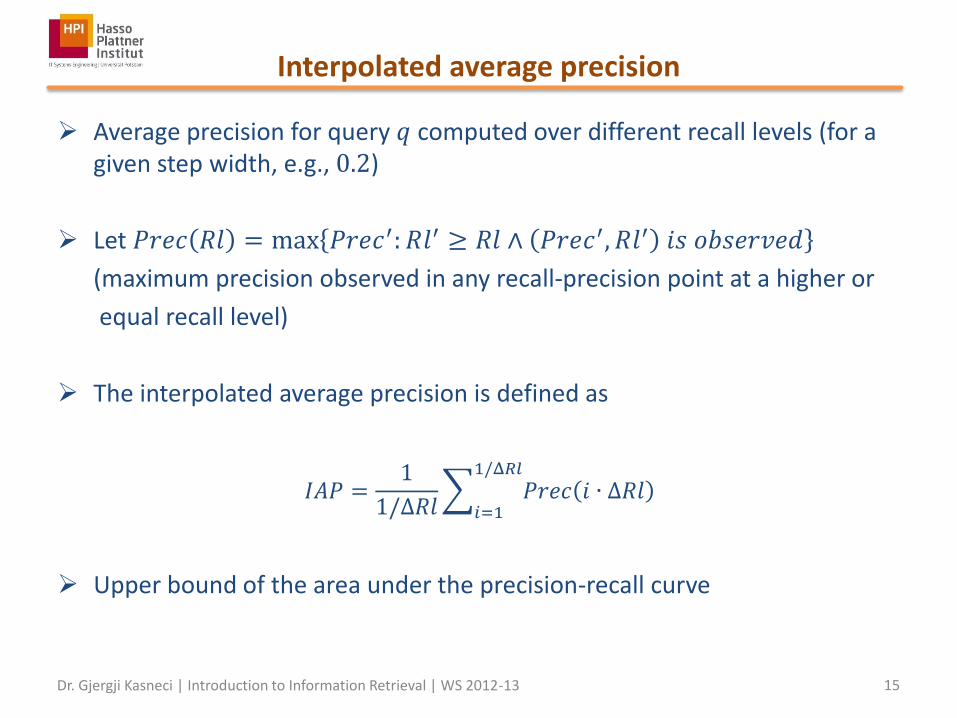
Interpolated average precision
Average precision for query 𝑞 computed over different recall levels (for a given step width, e.g., 0.2)
Let 𝑃𝑟𝑒𝑐 𝑅𝑙 = max 𝑃𝑟𝑒𝑐′: 𝑅𝑙′ ≥ 𝑅𝑙 ∧ 𝑃𝑟𝑒𝑐′, 𝑅𝑙′ 𝑖𝑠 𝑜𝑏𝑠𝑒𝑟𝑣𝑒𝑑
(maximum precision observed in any recall‐precision point at a higher or
equal recall level)
The interpolated average precision is defined as
Upper bound of the area under the precision-recall curve
𝐼𝐴𝑃 =1
1/Δ𝑅𝑙 𝑃𝑟𝑒𝑐 𝑖 ∙ Δ𝑅𝑙
1/Δ𝑅𝑙
𝑖=1
Dr. Gjergji Kasneci | Introduction to Information Retrieval | WS 2012-13 15
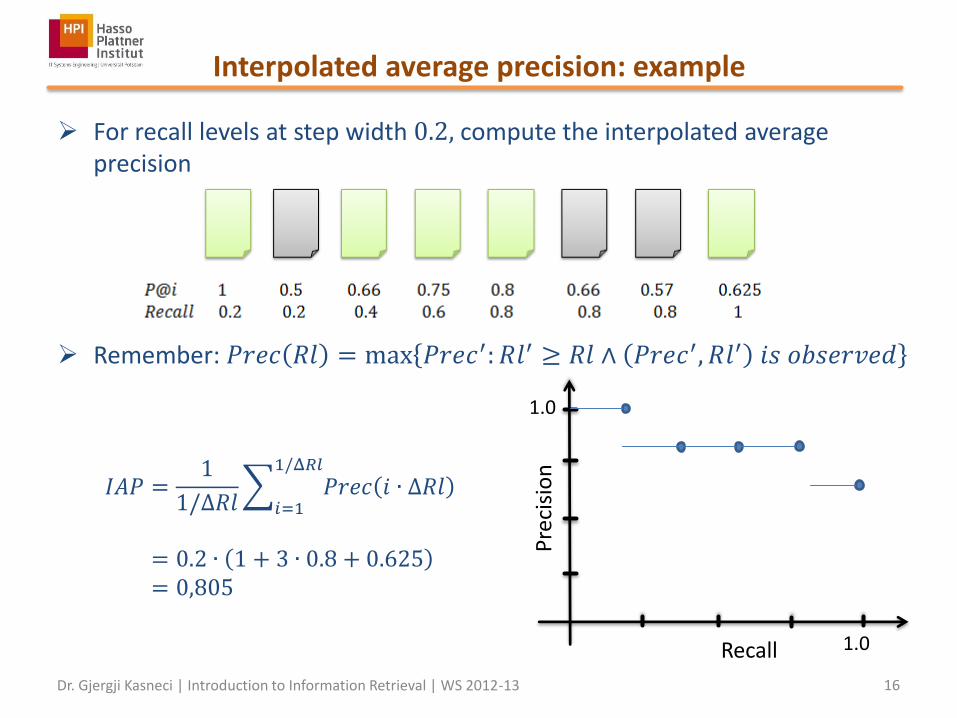
Interpolated average precision: example
For recall levels at step width 0.2, compute the interpolated average precision
Remember: 𝑃𝑟𝑒𝑐 𝑅𝑙 = max 𝑃𝑟𝑒𝑐′: 𝑅𝑙′ ≥ 𝑅𝑙 ∧ 𝑃𝑟𝑒𝑐′, 𝑅𝑙′ 𝑖𝑠 𝑜𝑏𝑠𝑒𝑟𝑣𝑒𝑑
Pre
cisi
on
Recall
𝐼𝐴𝑃 =1
1/Δ𝑅𝑙 𝑃𝑟𝑒𝑐 𝑖 ∙ Δ𝑅𝑙
1/Δ𝑅𝑙
𝑖=1
= 0.2 ∙ 1 + 3 ∙ 0.8 + 0.625 = 0,805
Dr. Gjergji Kasneci | Introduction to Information Retrieval | WS 2012-13 16
1.0
1.0

Mean average precision (MAP)
Consider benchmark of 𝑛 queries 𝑞1, … , 𝑞𝑛 and corresponding results
Generally:
𝑀𝐴𝑃 =1
𝑛 𝐴𝑣𝑒𝑃𝑟𝑒𝑐𝑖𝑠𝑖𝑜𝑛 𝑞𝑖
𝑞𝑖
=1
2
1 + 0.66 + 0.75 + 0.8 + 0.625
5+
0.5 + 0.66 + 0.6 + 0.66 + 0.625
5
Other possibility:
𝑀𝐴𝑃𝐼 =1
𝑛 𝐼𝐴𝑃 𝑞𝑖
𝑞𝑖
Note: 𝑀𝐴𝑃𝐼 corresponds to the macro-average of per-query interpolated average precision (with standard step width between recall levels 0.01)
Answers for 𝑞1:
Answers for 𝑞2:
Dr. Gjergji Kasneci | Introduction to Information Retrieval | WS 2012-13 17

Mean reciprocal rank (MRR)
How effectively does a search system retrieve the first relevant result?
Consider queries 𝑞1, … , 𝑞𝑛 and corresponding ranked result lists
𝑓𝑟𝑟 𝑞𝑖 denotes the rank of the first relevant result for any 𝑞𝑖
The mean reciprocal rank is defined as
𝑀𝑅𝑅 =1
𝑛
1
𝑓𝑟𝑟 𝑞𝑖
𝑛
𝑖=1
Variations are possible (e.g., summand is 0 if 𝑓𝑟𝑟 𝑞𝑖 > 𝑡ℎ𝑟𝑒𝑠ℎ𝑜𝑙𝑑)
Dr. Gjergji Kasneci | Introduction to Information Retrieval | WS 2012-13 18

Discounted cumulative gain (DCG)
Previous evaluation measures were based on binary relevance feedback (i.e., result is either relevant or non-relevant)
Is it possible to integrate ratings for degree of relevance into evaluation of effectiveness?
Consider query 𝑞 with ranked results, where 𝑟𝑒𝑠(𝑖) stands for the result at rank 𝑖
𝐷𝐶𝐺 = 2𝑟𝑎𝑡𝑖𝑛𝑔 𝑟𝑒𝑠 𝑖 − 1
log 1 + 𝑖𝑖
where, for example
𝑟𝑎𝑡𝑖𝑛𝑔 𝑟𝑒𝑠 𝑖 =
0, 𝑖𝑓 𝑟𝑒𝑠 𝑖 𝑖𝑠 𝑖𝑟𝑟𝑒𝑙𝑒𝑣𝑎𝑛𝑡
1, 𝑖𝑓 𝑟𝑒𝑠 𝑖 𝑖𝑠 𝑜𝑘
2, 𝑖𝑓 𝑟𝑒𝑠 𝑖 𝑖𝑠 𝑟𝑒𝑙𝑒𝑣𝑎𝑛𝑡
Punishes result lists with many relevant results ranked lower than less relevant ones
Dr. Gjergji Kasneci | Introduction to Information Retrieval | WS 2012-13 19

Normalized discounted cumulative gain (NDCG)
Normalize DCG by the DCG of the optimal ranking (of the query results)
Example
Actual ranking
Optimal ranking
𝐷𝐶𝐺 =22 − 1
log 2+20 − 1
log 3+21 − 1
log 4+22 − 1
log 5+22 − 1
log 6+20 − 1
log 7+20 − 1
log 8+21 − 1
log 9
𝑜𝐷𝐶𝐺 =22 − 1
log 2+22 − 1
log 3+22 − 1
log 4+21 − 1
log 5+21 − 1
log 6+20 − 1
log 7+20 − 1
log 8+20 − 1
log 9
𝑁𝐷𝐶𝐺 =𝐷𝐶𝐺
𝑜𝐷𝐶𝐺
Dr. Gjergji Kasneci | Introduction to Information Retrieval | WS 2012-13 20

Result diversity
Results should cover different aspects of the user’s search need
For ambiguous query (e.g., Paris), diversify results and hope that top-k results will satisfy the user’s search need
Important in sponsored search, e.g., giant could be a good term for “Giant Company Software”, the movie “Giant”, or Giant bikes
General measure for result diversity
𝐷𝑖𝑣@𝑘 = 𝜆 𝑟𝑒𝑙𝑒𝑣𝑎𝑛𝑐𝑒 𝑑𝑑 ∈ 𝑡𝑜𝑝_𝑘
+ 1 − 𝜆 𝑑𝑖𝑠𝑠𝑖𝑚𝑖𝑙𝑎𝑟𝑖𝑡𝑦(𝑑, 𝑑′)𝑑,𝑑′∈ 𝑡𝑜𝑝_𝑘
Dr. Gjergji Kasneci | Introduction to Information Retrieval | WS 2012-13 21

Comparing rankings
For two rankings 𝜋1, 𝜋2 of results to the same query 𝑂𝑣𝑒𝑟𝑙𝑎𝑝@𝑘 (similarity measure)
𝑂𝑣𝑒𝑟𝑙𝑎𝑝@𝑘 𝜋1, 𝜋2 =𝑡𝑜𝑝_𝑘 𝜋1 ∩ 𝑡𝑜𝑝_𝑘 𝜋2
𝑘
Footrule distance Let 𝑆:= 𝑡𝑜𝑝_𝑘 𝜋1 ∪ 𝑡𝑜𝑝_𝑘 𝜋2
𝐹𝑅𝐷𝑖𝑠𝑡 𝜋1, 𝜋2 =1
𝑆 𝜋1 𝑒 − 𝜋2 𝑒
𝑒∈𝑆
Kendall’s 𝜏 measure (distance measure) 𝐾𝜏 𝜋1, 𝜋2 =
𝑎, 𝑏 ∈ 𝑆 × 𝑆 | 𝑎 ≠ 𝑏 ⋀
𝜋1 𝑎 > 𝜋1 𝑏 ⋀ 𝜋2 𝑎 < 𝜋2 𝑏 ⋁ 𝜋1 𝑎 < 𝜋1 𝑏 ⋀ 𝜋2 𝑎 > 𝜋2 𝑏
𝑆 𝑆 − 1
Note: 𝐹𝑅𝐷𝑖𝑠𝑡 𝜋1, 𝜋2 ≥ 𝐾𝜏 𝜋1, 𝜋2 ≥1
2𝐹𝑅𝐷𝑖𝑠𝑡 𝜋1, 𝜋2
Dr. Gjergji Kasneci | Introduction to Information Retrieval | WS 2012-13 22
Summary
Basic measures Precision (@k), recall
Precision-recall curves, break-even-point
ROC curves
Area under the curve (AUC)
Combined measures F-Measure
Micro, macro average (of precision, recall, F-measure)
Interpolated precision
Mean average precision (MAP)
Measures for integrating user ratings (Normalized) discounted cumulative gain ((N)DCG)
Diversification
Ranking measures Overlap@k, Footrule distance, Kendall’s 𝜏
Dr. Gjergji Kasneci | Introduction to Information Retrieval | WS 2012-13 23


![Immune cell infiltration as a biomarker for the diagnosis ... · (ROC) curve and time-dependent ROC [25] curve, respec-tively, and quantified by the area under the ROC curve (AUC).](https://static.fdocuments.us/doc/165x107/5dd11baad6be591ccb64428b/immune-cell-infiltration-as-a-biomarker-for-the-diagnosis-roc-curve-and-time-dependent.jpg)