Introduction to Charpy Testing - CaltechTHESIS · 17 Chapter 2 – Effects of Processing and...
30
17 Chapter 2 – Effects of Processing and Temperature on Charpy Impact Toughness in Metallic Glasses and Metallic Glass Matrix Composites Introduction to Charpy Testing Charpy impact testing (CIT) is an ASTM standard fracture mechanics technique used to measure a material’s notch toughness at moderately high strain rates. It is defined by the ASTM standard E23 1 , requiring a 55x10x10 mm beam with a 45°, 2 mm deep notch cut into the midpoint of the 55 mm side (Figure 2-1). The testing apparatus consists of a weighted hammer mounted at the end of a pendulum. The hammer can be raised to a known height and the sample to be tested placed in the path of the hammer’s swing, with the notch facing away from the impact surface (Figure 2-2). By measuring the height of the hammer’s swing after impacting the sample, a measurement of the energy absorbed by a sample can be taken. ) ( i f h h mg E − = ∆ (1) The lost potential energy is converted into work, which fractures the sample by driving a crack initiating at the notch. The sample geometry, with the notch facing away from the hammer’s impact, is used to cause a stress concentration at the tip of the notch to ensure the sample fails instead of bending along the rest of the bar. While the results obtained from a CIT are not necessarily quantitative by nature, it is a useful tool to make qualitative comparisons between different materials or conditions on a material’s toughness. It will not provide a measurement of a quantitative property, such as plane-strain fracture toughness, K Ic .
Transcript of Introduction to Charpy Testing - CaltechTHESIS · 17 Chapter 2 – Effects of Processing and...

17
Chapter 2 – Effects of Processing and Temperature on Charpy Impact
Toughness in Metallic Glasses and Metallic Glass Matrix Composites
Introduction to Charpy Testing
Charpy impact testing (CIT) is an ASTM standard fracture mechanics technique used to
measure a material’s notch toughness at moderately high strain rates. It is defined by the ASTM
standard E231, requiring a 55x10x10 mm beam with a 45°, 2 mm deep notch cut into the
midpoint of the 55 mm side (Figure 2-1). The testing apparatus consists of a weighted hammer
mounted at the end of a pendulum. The hammer can be raised to a known height and the
sample to be tested placed in the path of the hammer’s swing, with the notch facing away from
the impact surface (Figure 2-2). By measuring the height of the hammer’s swing after impacting
the sample, a measurement of the energy absorbed by a sample can be taken.
)( if hhmgE −=∆ (1)
The lost potential energy is converted into work, which fractures the sample by driving a crack
initiating at the notch. The sample geometry, with the notch facing away from the hammer’s
impact, is used to cause a stress concentration at the tip of the notch to ensure the sample fails
instead of bending along the rest of the bar.
While the results obtained from a CIT are not necessarily quantitative by nature, it is a
useful tool to make qualitative comparisons between different materials or conditions on a
material’s toughness. It will not provide a measurement of a quantitative property, such as
plane-strain fracture toughness, KIc.

18
Figure 2-1: Geometry required for an ASTM standard Charpy impact test.1 Type A is the geometry modified for our testing due to limitation in casting thickness in BMG alloys.

19
Figure 2-2: A schematic of a Charpy impact test.2
Some materials, upon cooling below a critical temperature, will exhibit a rapid decrease
in their measured impact toughness. This change is called a ductile to brittle transition (DTBT).
The CIT provides a rapid and reliable method to measure the relative change in impact
toughness of a material as it becomes more brittle. This is primarily because the CIT test can be
performed in a matter of seconds after removing a test specimen from a cryogenic bath or oven,
allowing the entire test to be performed isothermally. In contrast, a plane-strain fracture
toughness test would have to be performed in an environmental chamber for non-ambient
temperature testing. It is known that fcc materials do not undergo a DTBT, while bcc and hcp
metals do. Some cryogenic work has been done on BMGs to assess their ambient impact
toughness, as well as their elevated and cryogenic toughness. Two Charpy studies were
performed by Raghavan et al.3,4 where in one study the BMG Vitreloy 1 was tested from 100 K to
450 K, and in the other the samples were annealed and then tested from 100 K to 600 K.
Toughness was shown to dramatically decrease with increasing temperature in both studies. H
Li et al.5 performed compression tests of a Zr-based BMG at 77 K and observed an increase in

20
the compressive yield strength compared to room temperature, while Huang et al.6 saw both an
increase in compressive strength and plasticity at 123 K. Yu et al.7 studied the temperature
dependence of the various elastic moduli at cryogenic temperatures. Qiao et al. 8 summarized
the ultimate tensile strength of BMGs from 75 to 300 K. Not surprisingly, the properties of BMGs
remain relatively unchanged even at cryogenic temperatures. The toughness does decrease with
temperature, but in a linear fashion similar to fcc metals, instead of the sharp order-of-
magnitude drop associated with bcc metals and those with a DTBT.
Although the toughness of BMGs doesn’t decrease significantly at cryogenic
temperatures, their initial toughness is fairly low compared with most high-performance
engineering materials (e.g. titanium, steel, and aluminum alloys). To address this shortcoming,
bulk metallic glass matrix composites (BMGMCs) have been developed to offer significantly
higher toughness at room temperature due to the ability of a soft, bcc crystalline phase to stop
shear band propagation. Qiao et al8 performed compression tests on two BMGMCs to observe if
the embedded bcc crystalline dendrites exhibited an expected DTBT temperature. In both alloys
there was significant compressive plasticity at room temperature, but at 77 K the sample was
brittle. Unfortunately, only two temperatures were measured (room temperature and 77 K), so
there was not enough information to confirm or reject the existence of a DTBT in BMGMCs. In
this chapter, measurements were performed at ten different temperatures ranging from 100 K
to 300 K to allow for a more complete view of how impact toughness varies with temperature.
Using impact testing instead of compressive testing is also preferred, as plasticity can be
influenced by frictional forces during compression tests. Compression tests are also slow,
making it difficult to maintain isothermal conditions throughout the test.

21
Charpy tests were also performed on a variety of BMGs and BMGMCs that were
prepared using different processing conditions. This was done to provide a baseline for further
Charpy testing of both BMGs and BMGMCs that cannot be formed into the shapes required for
larger mechanical tests. This chapter also represents the first Charpy study of BMGMCs, done to
compliment work done in the literature with quasistatic and dynamic mechanical testing.9–14
Experimental This chapter focuses on comparing the impact behavior of three BMGMCs to Vitreloy 1
(a monolithic BMG) as well as some traditional crystalline alloys. The first BMGMC tested is a
titanium-based alloy DV1 (Ti48Zr20V12Cu5Be15), with 40% crystal volume fraction. The second is a
zirconium-titanium-based alloy DH3 (Zr39.9Ti33.9Nb7.6Cu6.4Be12.5), with 67% crystal volume fraction.
LM2 (Zr71.9Ti9.3Nb6Cu6.15Ni4.6Be1.6), a commercially available zirconium-based composite material,
is 40% crystalline. Vitreloy 1 (Zr41.2Ti13.8Cu12.5Ni10Be22.5) is the BMG used for comparison, and is
the most widely commercially used BMG (under the trade name LM1). Several crystalline alloys
were also used for comparison with the BMG alloys. These include Ti-6Al-4V, Al-7075, Al-2024,
and SS 304. To measure ductile to brittle transitions, both 99.9% pure tin and DH3-Matrix
(Zr35Ti30Cu8.25Be26.75), a BMG with composition equivalent to that of the glass matrix in DH3, are
used. A summary of their properties can be seen in Table 2-1.
BMG alloys were produced by arc melting high purity elements in a Ti-gettered argon
atmosphere. Suction cast (SC) samples were then remelted in a mini-arc melter and cast into
3x3x30 mm beams. A notch 0.5 mm deep, 1 mm wide, 90° cut was made using an endmill. Semi-
Solid Forged (SSF) samples were held isothermally above their solidus temperatures prior to
forging to allow for dendrite coarsening before being formed into 3 mm thick plates. The plates
were then sectioned on a laboratory saw and notched with an endmill similar to the SC samples.

22
Commercial alloys were procured as 3 mm thick plates, sectioned, and notched in a similar
manner.
Charpy tests were performed on a modified Riehle Impact Testing Machine, which was
instrumented to detect small changes in hammer velocity (Figure 2-3). Standard Charpy
machines operate from two drop heights, 61 and 122 cm (24 and 48 in), with two hammer
masses so that four maximum impact energies can be obtained: 41, 81, 163, and 325 J.
Unfortunately, full-sized Charpy testing on Zr-Be-based BMGs from literature indicate only 1-5 J
of energy is absorbed, whereas Zr-Be-based BMGMCs absorb 25-45J.3,4,15–17 Full sized Charpy
specimens can be very difficult to fabricate out of various BMGs. A very large critical casting
thickness is required, and ingots of at least 30 g would be required (very difficult with
laboratory-scale equipment). Changing the sample geometry to 30x3x3 mm allows for rapid
fabrication through suction casting in a mini arc melter. In the future, poor glass formers can
also be directly compared, since this is an easier geometry for fabrication. Since the impact
toughness of the BMG alloys is relatively low, plane-stress effects are absent even in the smaller
beams, which means comparisons to tests done in larger specimens are proportional. The cross-
sectional area of the compact samples in the current work is approximately 10 times smaller
than full-sized samples, so the amount of energy absorbed would be nearly undectable using
standard drop heights and hammer masses. Therefore, the Charpy tester was modified by
reducing the drop height and the hammer mass, and the impact energy was measured both by
dial and by instrumentation. Equating the potential energy of the hammer at the drop height
(PE=mgh) with the kinetic energy of the hammer at impact ( 22mvKE = ), the initial velocity (v0)
of the hammer before the impact is found to be a function only of the initial drop height.
ghv 20 = (2)

23
To instrument the machine, a 1 cm diameter cylindrical magnet was attached to a
plastic arm on the side of the hammer pendulum. Two 1 cm diameter copper coils were
mounted on a plate 70 mm apart, with their midpoint located at the impact location
Figure 2-3a. The coils were wired to a digital oscilloscope connected to a computer. When the
magnet attached to the hammer passes the first coil, a voltage that registers as a sinusoidal
peak on the oscilloscope is created. During the impact with the specimen, the hammer slows
down before it passes the second coil, creating a difference in the width of the sinusoidal peak.
The energy absorbed by the sample can then be determined through
( )2202
1fvvmE −= (3)
The velocity of the hammer can be determined by txv ∆∆= , where t∆ is the width of
the sinusoidal pulse (the transit time of the magnet across the coil) and x∆ is the width of the
coil. Using the known standard drop height of the hammer, the initial velocity was calculated to
be 3.46 m/s; using this known velocity, x∆ was calculated to be ~1.0 cm for each coil by
measuring the peak width. Using the known original impact energy and hammer height, the
original effective mass of the hammer was calculated as 6.8 kg. An example of this procedure is
demonstrated in Figure 2-3d. To accommodate the small-scale specimens, the energy of the
hammer was reduced by decreasing the hammer mass to 2.7 kg and the initial velocity to 2.0
m/s. The new drop height was calculated to be 21 cm (from the measured velocity) and, thus,
the total energy of the hammer was reduced from 41 to 5.6 J. For samples requiring more than
5 J to fracture, a second drop height was calibrated at 83 cm, imparting 22.2 J of energy at
impact. A modified fixture to support the shorter samples was built as an insert into the existing

24
Charpy fixture, as shown in Figure 2-3b. The span length was thereby reduced from 50 to 20 mm
for the small-scale tests.
Figure 2-3: Instrumented small-scale Charpy testing. (a) The pendulum hammer has been stripped of excess mass to reduce the impact energy. A plastic extension has been built to hold the magnet. As the pendulum swings, the magnet passes a coil before and after impact, which registers a current. (b) The modified sample holder has a shorter span length of 20 mm for compact Charpy samples. (c) Suction cast (SC) samples of the alloy DV1. (d) Induced current obtained from an impact test on DH3 using a digital oscilloscope. The hammer’s speed is reduced during impact, which broadens the second peak. The width of the coils and magnets are known to be dx = 1 cm, so the velocity of the hammer can be determined
through v = dx/dt. The energy during the impact is 221 mvE = .

25
To calibrate the impact temperatures for the DTBT measurements, a series of heating
curves was measured for each alloy. This was done by attaching a thermocouple to a specimen,
holding the sample in liquid nitrogen until it reached equilibrium, quickly loading the sample
into the testing setup, and then recording the temperature as a function of time as the sample
heated due to contact with air and the sample fixture. This was repeated several times for each
sample, so a plot of temperature vs. time could be obtained for each sample. The heating curve
for DH3 is shown in Figure 2-4. The validity of the testing setup for measuring DTBT was verified
by measuring an accurate DTBT temperature for 99.9% Sn.
Microstructures of the samples were analyzed through x-ray diffraction, backscattered
scanning electron microscopy (QBSD-SEM), Rockwell hardness testing, acoustical
measurements, and optical microscopy.
0
50
100
150
200
250
300
350
0 20 40 60 80 100 120
Tem
pera
ture
[K]
Seconds In Sample Fixture [s]
Figure 2-4: The temperature calibration curve for DH3 (Zr39.9Ti33.9Nb7.6Cu6.4Be12.5).

26
Table 2-1: Physical & mechanical properties of samples measured via Charpy impact testing.
NameVol % of Crystal
Processing Method
CIT 300 K [J]
CIT 100 K [J]
CIT 300 K [J/cm²]
CIT 100 K [J/cm²]
σy [MPa]σmax
[MPa]Hardness
[HRc]ρ [g/cm³] E [GPa] σmax/ρ
Vitreloy 1
0 SC 0.68 0.31 7.6 3.4 1700 1700 60 6.1 97.2 279
LM2 40 CCP 0.13 - 1.4 - 1000 1300 56.2 6.2 78.8 210DV1 40 SC 1.31 0.33 14.6 3.7 1360 1430 58.3 5.2 92.4 275DV1 40 SSF 4.82 - 53.6 - 1360 1430 50.8 5.2 92.4 275DH3 67 SC 2.66 0.32 29.6 3.6 1100 1200 47.8 5.8 75.3 207DH3 67 SSF 5.27 - 58.6 - 1100 1200 43.3 5.8 75.3 207
DH3-Xtal 100 X-tal 0.19 0.26 2.1 2.9 - - - 5.8 - -Ti-6-4 100 GD 5 STA 2.97 - 33 - 1100 1200 41 4.5 114 267Al7075 100 T6 0.38 - 4.2 - 500 570 6 2.8 71.7 203Al2024 100 T6 0.66 - 7.3 - 350 430 <1 2.8 72.4 155SS 304 100 STA 9.49 - 105.4 - 220 500 <1 8 190 63
Sn 99.9% 100 X-tal 0.92 0.04 10.2 0.4 12.5 220 <1 5.8 41.4 38
σy, σmax, and E for all crystalline alloys (other than DH3-matrix) were obtained from matweb.com. Processing routes for metallic glasses are defined as: SC (suction cast), CCP (commercially cast plate), and SSF (semisolid forged). CIT is Charpy impact toughness.

27
Results and Discussion
Influence of Processing Conditions of Charpy Impact Energy
Compact Charpy impact testing was performed on a total of 12 alloys: six containing an
amorphous phase and six fully crystalline alloys. Table 2-1 gives compositions and processing
conditions for the alloys tested. Figure 2-5 is a visual plot of the data in Table 2-1, which shows
the impact energy (in Joules) for each sample along with impact energy per cross-sectional area
(in J/cm²). On average, seven samples of each type were impacted to observe the effect of
processing variation on impact energy, and the mean value for each alloy is shown in Figure 2-5
with a red circle. As a baseline, the monolithic BMG Vitreloy 1 (abbreviated Vit 1) was also
evaluated via Charpy testing, as was done by several other groups.3,4,16,17 Vit 1, which is the most
widely studied and commercialized BMG to date (often under the trade name LM1), is
approximately the amorphous matrix for the commercial composite LM2. Commercial quality
alloy was obtained and were then broken up and suction cast into beams. The impact energy for
the Vit 1 samples was determined to be 0.68 J, which is similar to the results from other studies
when scaled to full size, despite differences in sample geometry and origin. The crack
propagation through Vit 1 test samples also appears similar to the crack propagation through a
fracture toughness tests done in other studies.15

28
Figure 2-5: Compact Charpy impact toughness values from 11 alloys tested; one bulk metallic glass (BMG), six bulk metallic glass matrix composites (DH3, DV1, LM2) in various processing conditions, and four crystalline alloys. The processing conditions are commercially cast plate (CCP), crystalline (xtal), suction cast (SC), and semisolidly forged (SSF). The maximum hammer energy for the low drop height is displayed on the plot along with a scaled estimation of the full-sized Charpy toughness. On average, seven samples of each alloy were tested, and the average is plotted as a red circle.

29
Surprisingly, the commercially cast composite, LM2, had the lowest impact energy, with
only 0.13 J absorbed. This is in spite of the alloy having approximately 40% volume fraction of a
soft, crystalline dendrite phase. The brittle fracture surface typical of an the impact test is shown
in Figure 2-6 and the microstructure is shown in Figure 2-7. Images of the fracture surface allow
for an estimation of toughness. Qualitative estimates on the toughness of an alloy can be made
by inspecting the fracture surface. High surface roughness, large numbers of shear bands, and
the shear bands forming a long distance from the fracture surface are all indicative of a tough
material. LM2’s lack of roughness on the facture surface is indicative of a brittle material, which
the impact energy measurements verify. It is well-known from other studies that commercially
available LM2 contains a high ppm concentration of oxygen, which reduces the toughness of the
matrix BMG considerably. This is the likely cause of the low observed toughness, despite the
presence of the dendrites. Cracks forming in the matrix propagated without plastic shielding
from the dendrites.
Figure 2-7a is a composite SEM micrograph of LM2 obtained via a quadrant backscatter
detector (QBSD). This causes the dendrites to appear white in color versus the gray of the matrix
due to the different composition, stemming from the Z-scattering differences. These samples
were commercially produced by die-casting a liquid from a shot sleeve into a steel mold. This
method has a relatively slow cooling rate, which allowed the microstructure to coarsen to levels
similar to the SSF DV1 and DH3samples (shown in Figure 2-8a and Figure 2-9a). The dendrite
arms are ~10 μm thick, and the spacing of the arms is between 1-5 μm. The main branches of
the dendrites are ~100 μm in diameter, and are spaced several hundred microns apart. Unlike
the other SSF samples, though, LM2 is not extensively toughened by the coarsening, as the crack
cleaved through the sample without any significant branching or blunting. A limited number of
shear bands can be seen on the surface normal to the fracture, but they only extend between

30
5 µm to 50 µm away from the crack. As expected, the low commercial purity of the alloys makes
the matrix brittle and limits the glass forming ability of the alloy. This causes some brittle
intermetallic phases to nucleate during solidification, as seen in Figure 2-7c. In combination, the
high-oxygen matrix and the presence of the brittle intermetallic phases result in a very low
toughness.
Figure 2-6: Fracture surfaces from six BMGMC samples tested in this study, along with their impact energy. X-ray scans from SSF DH3 and the completely crystalline state are also shown. Although the body-centered cubic dendrites remain in the crystalline sample, the matrix is no longer amorphous, as evident from the numerous starred peaks. Also shown are magnified fracture surfaces from SSF, DH3, and LM2, showing the difference in the fracture pattern. All images are of the fracture surface taken with backscattered electrons in a SEM.

31
Figure 2-7: (a) A backscattered SEM micrograph showing a fractured specimen of commercially cast LM2. Despite the large, coarse dendrites, other factors (like oxygen content and partial crystallization) make this the most brittle alloy tested. (b) The edge of the crack from a region in (a) demonstrating very little toughness. (c) Another region near the edge of the crack showing that several shear bands have formed. (d) A region where the matrix has crystallized into an unknown brittle phase.

32
The Ti-based BMGMC DV1 was the first non-commercial composite tested. It is notable
for its large amount of tensile strain to failure (~15%) and low density (5.17 g/cm³).15 Ten
samples were suction cast, and their impact energy is plotted as the blue triangles in Figure 2-5.
SC DV1 has a large amount of variability, with impact energies between samples spanning nearly
an order of magnitude (a low of 0.56 J, high of 3.1 J, and an average of 1.3 J). This is likely caused
by the suction casting method, during which molten material is sucked into a mold and there is
the possibility of small voids due to the turbulent flow. There are also inconsistencies in the
solidification behavior of various DV1 samples as fabrication conditions do not permit identical
castings. Temperature control is not perfect, so some would be cast from higher temperatures
causing a slower cooling rate and larger dendrites. This would not have been as much of a
problem for SC Vit 1, since it lacks the dendritic microstructure seen in the composites and has
less variability when cast. To study the effects of dendrite refinement on DV1, an ingot was
heated into the semi-solid regime (~950 °C), and held isothermally for ~1 minute to coarsen the
microstructure, then forged between two copper plates into a 3mm thick plate (as
demonstrated in Ref 18). Semisolidly forging DV1 had a significant effect on impact toughness,
with the average energy absorbed increasing by nearly four times to 4.8 J. Scatter was also
reduced as a function of both the coarsened microstructure and that the samples were cut from
the same plate. Figure 2-8 demonstrates the difference between fractures in the two methods
of processing DV1. Both samples exhibit a rough fracture surface, but the SSF sample exhibits
significant shear lips on the edges perpendicular to the notch. Figures 2-8a and 2-7d show
composite images of the crack path through the DV1 SSF and SC samples, respectively. The
microstructure for the SSF sample is actually visible to the unaided eye, as a result of the
coarsening imparted by semi-solid processing. Damage can be seen 1-2 mm away from the crack
edge, and mostly consists of closely spaced shear bands (<10 µm separation) with significant

33
Figure 2-8: Backscattered SEM micrographs from the BMGMC DV1 (40% dendrite). (a) Crack originating at the notch and then propagating through a SSF sample during a compact Charpy test. (b),(c) Higher magnification of shear bands interacting with the Ti-based dendrites (e) Crack propagating through a SC sample during compact Charpy test. (e),(h) Higher magnification micrographs of shear bands in the SC sample along with the nominal microstructure.
damage visible in the dendrites (Figure 2-8b and Figure 2-8c). Dendrite arm spacing is 5-10 µm,
with thicknesses ~10-15 µm. The length of a dendrite is ~100 µm, and the arm spacing is only a
few microns. In contrast, the SC sample shows much less branching and blunting, with shear
bands only observed ~100-200 µm from the edge of the crack. Although many shear bands are
observed (Figure 2-8f) compared to an alloy such as Vit 1, there are significantly less than in the
SSF sample. The microstructure from the SC sample (Figure 2-8f) is an order of magnitude
smaller than the SSF sample, as a result of casting from above the liquidus and rapid quenching.
The overall dendrite size is only a few microns, with the arms themselves being approximately
0.5-1 µm. Figure 2-8f is a highly magnified image of the dendrites with shear bands that
occurred during fracture. It should be noted that although the SC sample of DV1 had energy
absorption 25% less than that in the SSF sample, it is still not a brittle fracture when compared
to LM2 and Vit 1. SC samples of DV1 still exhibit ten times higher impact toughness than
commercial LM2. Thus, even though the small dendrites aren’t as effective at blunting and
redirecting the crack tip as the coarser dendrites, they still require a significant amount of
energy to fracture.

34
DH3, the Zr-Ti based BMGMC, was the next impact tested composite. This alloy is
notable for its high fracture toughness (>173 MPa m1/2) and fatigue endurance limit (25% of
yield strength), mostly caused by the increased volume fraction of soft dendrites (66%).15 DH3
specimens were SC and SSF, similar to DV1, but in addition one set of samples intentionally had
the matrix crystallized (DH3-xtal) by slowly cooling from the semi-solid region (XRD scan shown
in Figure 2-6). The XRD scan from DH3 is a typical scan for all of the composites which exhibit
both a large, broad amorphous hump as well as bcc diffraction peaks. The DH3-xtal XRD scan
shows how upon the matrix’s crystallization, additional diffraction peaks can be seen from the
formation of intermetallic phases. XRD scans of other alloys are not shown.
The SC samples of DH3 show the reverse trend during impact testing compared to the
SC samples of DV1. Instead of a large scatter, the impact energies are clustered closely to the
average of 2.7 J. It is likely due to the higher dendrite fraction (and thereby higher liquidus
temperature) that the mini arc melter was unable to fully melt the alloy prior to suction casting,
and as a result some dendrite refinement was allowed to take place. This created a more
uniform microstructure during casting, which should result in less scatter in impact energies.
The SSF DH3 samples also exhibited significantly higher average impact energies than the SC
samples (5.4 J), although the improvement was not as dramatic as with DV1. The amount of
energy absorbed by SSF DH3 was actually high enough that a larger drop height was required to
break the samples. Similarly to DV1, the microstructure difference in DH3 SC and SSF varied by
approximately an order of magnitude. The nominal microstructure from the SSF samples is
shown in Figure 2-9b and Figure 2-9g, with dendrite arms 10-15 µm wide and spaced ~5 µm
apart. The overall dendrite size is 100-200 µm. The scale of both DV1 and DH3’s SSF samples are
similar, with DH3 having a larger fraction of dendrites. In contrast, the dendrites from SC DH3

35
Figure 2-9: (a) Crack arrest and branching after impact in a SSF sample. (b) Near the edge of the crack, many shear bands have formed and been arrested by the soft dendrites. (c) Magnification of a region in (a) demonstrating that even far away from the crack, shear bands still form in the glass matrix. (e) Crack propagating through a SC sample of DH3 and (f),(g) higher magnification images of the shear bands and microstructure.
have an arm size of 0.5-1 µm, and a spacing of only a few hundred nanometers (Figure 2-9f and
Figure 2-9h). The overall dendrite size is on the order of 1-5 µm in diameter.
Four common crystalline alloys were also tested in the same geometry for direct
comparison with the amorphous alloys, since a smaller than standard Charpy size was used. The
aerospace aluminum alloys Al-2024-T6 and Al7075-T6 exhibited impact energies of 0.66 and
0.38 J, with very low observed scatter. Ti-6-4’s impact energies were close to that of the SC
samples of DH3, but were surpassed by both SSF samples of DV1 and DH3. The fourth crystalline
alloy tested was a completely crystallized sample of DH3. It was fabricated via SSF, then
annealed in a radio frequency (RF) induction coil until crystallization was visible on the surface.
Crystallinity was verified by XRD (Figure 2-6), and no amorphous content was detected via
differential scanning calometry (DSC). It is not pictured, but the microstructure of the sample is

36
similar to Figure 2-7d: there are large coarsened dendrites, but the amorphous matrix is
replaced by a fine eutectic. Crystallizing the matrix resulted in a measured impact energy of 0.19
J. This is approximately 7% of the SC samples, 3% of the SSF samples, but still higher than the
0.13 J of the LM2 BMGMC. These results underline the importance of ensuring a vitrified and
tough matrix. By crystallizing the glass, the impact toughness of the matrix goes down
substantially, with a corresponding decrease in the critical size at which cracks form (100 µm in
the glass to ~10 nm in the crystalline eutectic.15). Since self-propagating cracks form at such
small lengths in the crystalline matrix, the dendrites, regardless of size, have no effect on
toughening, since cracks simply bypass them and propagate through the matrix unhindered.
DH3’s 67% volume fraction of crystal still experiences an order of magnitude decrease in
toughness when the matrix is crystallized. Figure 2-6 shows fracture surfaces of all DH3 samples
(SC, SSF, xtal) along with higher magnification images comparing the dimpled fracture pattern
between tough SSF DH3 and brittle LM2 samples. As expected, the brittle sample exhibits
approximately an order of magnitude smaller dimple pattern than the toughest composite alloy
(~20 µm versus ~2 µm). The fracture surfaces from the composites in order of increasing
toughness from the crystalline DH3 sample to the SC sample, to the SSF sample. In each case,
the roughness increases with toughness, as does the size of shear lips on the sample’s edge
(nearly 1mm in SSF DH3).
Finally, rolled samples of 304 stainless steel were tested, resulting in an average impact
energy of 9.5 J. These samples exhibited sufficiently high toughness in that the hammer was not
able to easily fracture the samples. This caused the hammer to vibrate significantly, and likely
added to large error in measurement. Because of this, only the average value is plotted in Figure
2-5.

37
Ductile to Brittle Transition in BMGMCs
To investigate the presence of a DTBT temperature in BMGMCs, further Charpy impact
testing was performed from room temperature down to liquid nitrogen temperatures. Figure
2-10 plots the measured impacted energy versus the temperature of the sample at time of
impact. As in the previous tests, where crystalline alloys were impact tested to verify the setup,
in this section pure Sn was impacted to verify that the DTBT temperature is similar to what is
measured in full-sized specimens. The Sn 99.9% curve recreates that from the literature19 well,
with a roughly linearly decreasing toughness from 150 to 300 K, and the DTBT temperature from
130 to 150 K (illustrated by a shaded area). Once below the transition temperature, the
toughness decreases linearly to a value roughly 2% of its room temperature value. The small
sized specimens were able to accurately replicate the shape of the low temperature toughness
of Sn, but the test underestimates the actual impact energies.
Also displayed in Figure 2-10 are two Vitreloy 1 curves for toughness versus
temperature. The first (with solid triangles) was produced in this work, while the other (open
triangles) is from the literature4. The impact energies from literature were performed on
specimens with 6x3x50 mm geometry. In both curves, the toughness decreases roughly linearly
with temperature and does not exhibit a DTBT. At 100 K, Vit 1 retains 35% of its room
temperature toughness, while the toughness of Sn has decreased by 98% from its room
temperature toughness. The rate of Vit 1’s decrease in toughness is calculated to be ~0.02 J cm-
2K-1.

38
Figure 2-10: Charpy impact toughness vs. temperature for pure Sn and the BMG Vitreloy 1 compared with data obtained from References 19 and4. The plot shows that the compact impact setup used in this work recreates the correct DTBT temperature in Sn and reproduces the shape of the curves from literature, despite the smaller specimen size. An estimate of the full-sized Charpy toughness is shown on the right axis. All the data is shown.
Figure 2-11: Charpy impact toughness vs. temperature for the BMGMC DH3 and its glass matrix, made separately. The curves represent the averages all of the data, which are also shown. Both alloys were produced via suction casting and notched identically.

39
Figure 2-11 is a plot of temperature vs. toughness for DH3, the BMGMC with 66% soft
crystalline dendrite, along with an alloy which approximately mimics its glassy matrix.20 The
BMGMC alloy DH3 exhibits excellent room temperature toughness and ductility, but is
comprised of a bcc crystalline phase that is expected to undergo a DTBT. It is known that brittle
metallic phases in a glass can make the BMGMC significantly more brittle than the parent glass
(as was demonstrated above). Figure 2-11 essentially confirms this hypothesis by showing that
the toughness of DH3, while much higher than its matrix BMG at room temperature, quickly
loses its toughness and essentially behaves like a monolithic glass. At room temperature, DH3
absorbs more than three times more energy than its glass matrix; however, the impact
toughness decreases rapidly for the first 100 K of cooling due to the embrittling of the bcc
dendrites. Around 175 to 200 K the DH3 and DH3-Matrix curves virtually converge,
demonstrating that the matrix controls the toughness because the dendrites can no longer
arrest shear band growth. DH3-Matrix exhibits a similar decrease in toughness compared to Vit
1, maintaining ~30% of its room temperature toughness at 100 K. DH3, the BMGMC, only
maintains 15% of its room temperature toughness, which is obviously lower because it starts
with a much higher toughness. Despite the performance, DH3’s DTBT is still significantly smaller
than that of Sn’s, which results in only 2% toughness retention at 100 K. Both DH3 and DH3-
Matrix have an impact toughness of ~0.25 J (2.7 J cm-2), an order of magnitude higher than Sn’s.
Earlier in this chapter it was demonstrated that processing techniques can significantly improve
the room temperature toughness of a BMGMC, however, that toughening is only worthwhile for
temperatures above the DTBT. This is not necessarily a bad result; BMGMCs’ superior room
temperature toughness remains for the first 100 K below ambient temperature, and the
amorphous matrix allows it to retain a moderate amount of toughness even at cryogenic
temperatures. Therefore, the BMGMCs are never more brittle than monolithic BMGs with

40
decreasing temperature, and both have respectable toughness at cryogenic temperatures
compared to metals that exhibit a DTBT.
Another unexpected result seen in Figure 2-11 is a slight hump in toughness around 163
K. Both DH3 and DH3-Matrix exhibit a slight increase in toughness at that temperature, followed
by decreasing toughness at lower temperatures. Since the hump was observed for both alloys, it
is likely a real phenomenon occurring in the glass matrix. A similar hump has not to date been
observed in Vit 1, where a number of cryogenic studies have been performed.
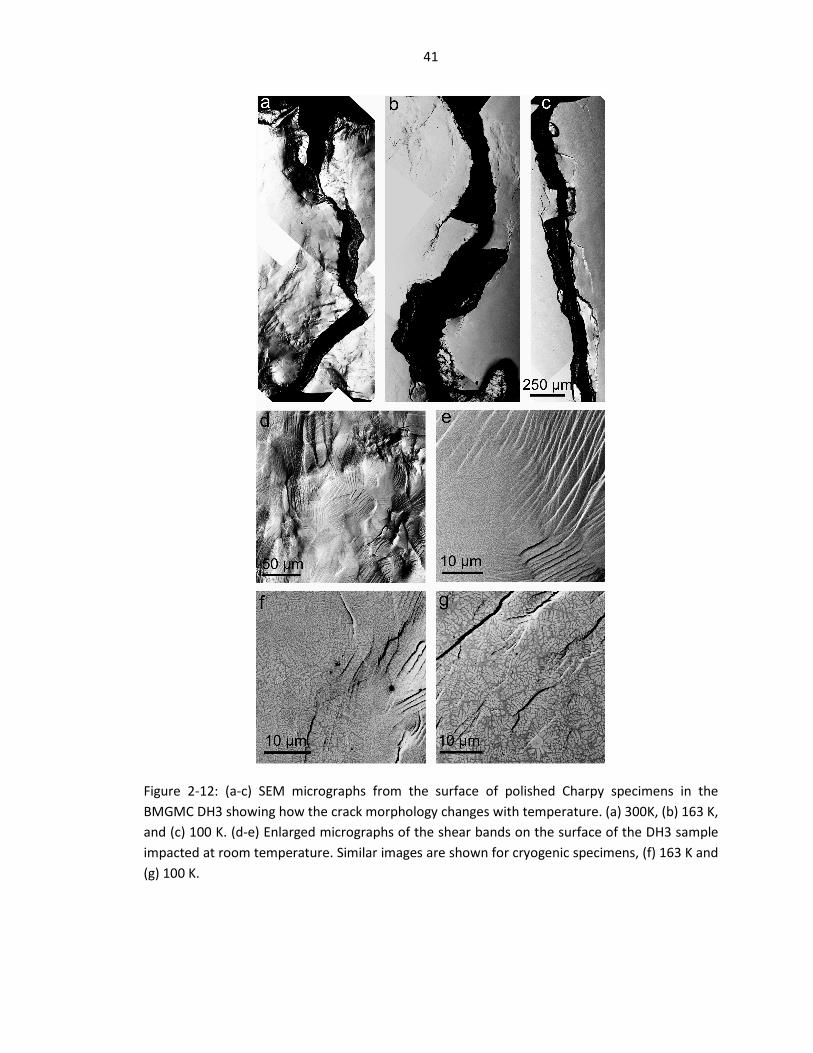
Figure 2-12 is a collection of SEM micrographs illustrating the differences in the
appearance of the fracture surface at 100, 163, and 300 K in the BMGMC DH3. Figure 2-12a-c
shows micrographs from the surface of three specimens that were polished to a 0.02 µm finish
prior to testing. The notch is at the top of each image, and the crack was driven downwards
during impact. Figure 2-12a, a 300 K impact, exhibits a large amount of deformation and crack
branching, with shear bands observed a distance of 950 µm from the edge of the crack. The
typical shear band spacing, shown at two different magnifications in Figure 2-12d and e, was
found to be 2.75 µm. At 163 K (Figure 2-12b) some crack branching is still apparent, although
there are fewer shear bands visible on the surface (only up to 600 µm from the crack) and they
have a larger spacing of 3 µm (Figure 2-12f). At 100 K (Figure 2-12c), the crack does not branch
at all, and cleaves the sample without significant deformation. The few visible shear bands only
extended 150 µm away from the crack, and had a spacing of 9.6 µm.
41
Figure 2-12: (a-c) SEM micrographs from the surface of polished Charpy specimens in the BMGMC DH3 showing how the crack morphology changes with temperature. (a) 300K, (b) 163 K, and (c) 100 K. (d-e) Enlarged micrographs of the shear bands on the surface of the DH3 sample impacted at room temperature. Similar images are shown for cryogenic specimens, (f) 163 K and (g) 100 K.

42
Figure 2-13: (a) SEM micrograph of the fracture surface from the monolithic BMG DH3-Matrix impacted at 300K. (b) DH3-Matrix 100 K. (c) Fracture surface from BMGMC DH3 at 100 K. In all samples the notch is at the bottom of the images.

43
Plastic flow of a material is a thermally activated process, so, by reducing the
temperature, the number of shear bands which can be formed should decrease. Another
assessment of toughness is the length of the crack-edge per mm of sample, called l, obtained
from Figure 2-12a-c. In a perfectly brittle fracture, no crack branching would be observed, and
the crack would travel perpendicular to the sample, leading to l = 1. In a tough material, the
track turns due to blunting and plastic shielding, leading to l > 1. In the coldest sample, impacted
at 100 K, l = 1.10 mm/mm. At 163 K, l = 1.38 mm/mm, and at 300 K, l = 1.36 mm/mm. The
lowest temperature impact has the shortest crack path, with the crack only traveling an extra
10% of distance in the material versus a pure cleavage fracture. The two higher temperature
impacts both had similar crack lengths, although they had significantly different average
energies of fracture. The higher concentration of shear bands in the 300 K sample can explain its
higher toughness. Fracture surfaces of DH3 and DH3-Matrix are shown in Figure 2-13 at (a)
300 K and (b) 100 K. As expected, as the temperature during fracture decreases the fracture
surface decreases in roughness, correlating with the decrease in toughness. Figure 2-13c is the
fracture surface from DH3 at 100 K. It can be seen to be similar to the DH3-Matrix, as its surface
is fairly smooth and lacks a large amount of roughness.
The final alloy tested was the Ti-based BMGMC DV1, which has a lower volume fraction
of dendrites than DH3 (40%), but still is reinforced with a bcc phase. Five impacts at 100 K and
300 K were performed. The average impact energy at 100 K was found to be 0.33 J (3.7 J cm-2),
compared with 1.31 J (14.5 J cm-2) for the 300 K sample.

44
Table 2-2: Summary of DH3 DTBT impacts
Temperature [K]
Shear Band Spacing [µm]
Max Shear Band Distance from Crack [µm]
l[mm/mm]
CIT [J]
CIT[J/cm²]
100 9.6 150 1.10 0.32 3.6163 3.0 600 1.38 0.72 8.5300 2.75 950 1.36 2.66 29.6
CIT is Charpy impact toughness, and l is the crack-edge per mm of sample.
Conclusions
In this study a series of miniaturized Charpy experiments were performed. The influence
of processing on the microstructure of BMGMCs was used to vary the microstructure of the two
alloys DV1 and DH3. Their impact toughness was measured to be greatest when semisolidly
forged. This technique allowed for much greater dendrite refinement than suction casting,
which, in turn, increased impact toughness. The commercially cast LM2, while a BMGMC,
performed poorly. This was due to the growth of a brittle crystalline phase within the
amorphous matrix, with similar results to the massive decrease in toughness experienced by
DH3-xtal. With proper fabrication, DV1 and DH3 can absorb more impact energy than Ti-6Al-4V,
Al-2024, and Al-7075.
Impact toughness was also measured across a range of temperatures for Vitreloy 1,
DH3, DH3-matrix, and Sn. The measurements for Vitreloy 1 and Sn matched well with the values
from the literature. Vitreloy 1 was found to slowly decrease in toughness as the impact
temperature was reduced. Sn experienced a DTBT between 130 to 150 K. DH3-matrix’s
temperature sensitivity was similar to Vitreloy 1’s, with a gradual decrease as the temperature
was reduced. DH3 was very tough at ambient temperatures. It suffered rapid degradation upon
cooling, but always performed at least as well as its amorphous matrix. This study demonstrated

45
how even when a bcc crystal undergoes a DTBT it remains possible to mitigate the effects by
constraining its failure within another tough material.
References
(1) ASTM Standard E23, 2007, “Standard Test Methods for Notched Bar Impact Testing of Metallic Materials” 2007.
(2) Nayar, A. Testing of Metals; McGraw-Hill Education, 2005; p. 202.
(3) Raghavan, R.; Murali, P.; Ramamurty, U. Ductile to brittle transition in the Zr41.2Ti13.75Cu12.5Ni10Be22.5 bulk metallic glass. Intermetallics 2006, 14, 1051–1054.
(4) Raghavan, R.; Murali, P.; Ramamurty, U. On factors influencing the ductile-to-brittle transition in a bulk metallic glass. Acta Mater. 2009, 57, 3332–3340.
(5) Li, H.; Tao, K.; Fan, C.; Liaw, P. K.; Choo, H. Effect of temperature on mechanical behavior of Zr-based bulk metallic glasses. Appl. Phys. Lett. 2006, 89, 041921.
(6) Huang, Y.; Shen, J.; Sun, J.; Zhang, Z. Enhanced strength and plasticity of a Ti-based metallic glass at cryogenic temperatures. Mater. Sci. Eng. A 2008, 498, 203–207.
(7) Yu, P.; Wang, R. J.; Zhao, D. Q.; Bai, H. Y. Anomalous temperature dependent elastic moduli of Ce-based bulk metallic glass at low temperatures. Appl. Phys. Lett. 2007, 91, 201911.
(8) Qiao, J. W.; Liaw, P. K.; Zhang, Y. Ductile-to-brittle transition of in situ dendrite-reinforced metallic-glass–matrix composites. Scr. Mater. 2011, 64, 462–465.
(9) Cheng, J. L.; Chen, G.; Xu, F.; Du, Y. L.; Li, Y. S.; Liu, C. T. Correlation of the microstructure and mechanical properties of Zr-based in-situ bulk metallic glass matrix composites. Intermetallics 2010, 18, 2425–2430.
(10) Lim, K. R.; Na, J. H.; Park, J. M.; Kim, W. T.; Kim, D. H. Enhancement of plasticity in Ti-based metallic glass matrix composites by controlling characteristic and volume fraction of primary phase. J. Mater. Res. 2010, 25, 2183–2191.
(11) Park, J. M.; Jayaraj, J.; Kim, D. H.; Mattern, N.; Wang, G.; Eckert, J. Tailoring of in situ Ti-based bulk glassy matrix composites with high mechanical performance. Intermetallics 2010, 18, 1908–1911.

46
(12) Guo, S. F.; Liu, L.; Li, N.; Li, Y. Fe-based bulk metallic glass matrix composite with large plasticity. Scr. Mater. 2010, 62, 329–332.
(13) Zhu, Z.; Zhang, H.; Hu, Z.; Zhang, W.; Inoue, a. Ta-particulate reinforced Zr-based bulk metallic glass matrix composite with tensile plasticity. Scr. Mater. 2010, 62, 278–281.
(14) Qiao, J. W.; Feng, P.; Zhang, Y.; Zhang, Q. M.; Liaw, P. K.; Chen, G. L. Quasi-static and dynamic deformation behaviors of in situ Zr-based bulk-metallic-glass-matrix composites. J. Mater. Res. 2010, 25, 2264–2270.
(15) Hofmann, D. C.; Suh, J.-Y.; Wiest, A.; Duan, G.; Lind, M.-L.; Demetriou, M. D.; Johnson, W. L. Designing metallic glass matrix composites with high toughness and tensile ductility. Nature 2008, 451, 1085–9.
(16) Shin, H. S.; Kim, K.-H.; Oh, S.-Y. Fracture behavior of Zr-based bulk metallic glass under impact loading. Int. J. Mod. Phys. B 2006, 20, 4359–4364.
(17) Shin, H.; Kim, K.; Jung, Y.; Ko, D. Impact fracture behavior of Zr-based bulk metallic glass using subsize Charpy specimen. Adv. Fract. Strength 2005, 297-300, 1356–1361.
(18) Hofmann, D. C.; Kozachkov, H.; Khalifa, H. E.; Schramm, J. P.; Demetriou, M. D.; Vecchio, K. S.; Johnson, W. L. Semi-solid induction forging of metallic glass matrix composites. JOM 2009, 61, 11–17.
(19) Ratchev, P.; Vandevelde, B.; Verlinden, B.; Allaert, B.; Werkhoven, D. Brittle to Ductile Fracture Transition in Bulk Pb-Free Solders. IEEE Trans. Components Packag. Technol. 2007, 30, 416–423.
(20) Duan, G.; Wiest, A.; Lind, M. L.; Li, J.; Rhim, W.-K.; Johnson, W. L. Bulk Metallic Glass with Benchmark Thermoplastic Processability. Adv. Mater. 2007, 19, 4272–4275.