Benefit Cost Analysis (BCA) Overview and introduction to discounting CHRIS MADDEN, .

HST, IMK, ARF
Introduction to Benefit Cost Analysis
Introduction
2
Cost-benefit analysis is a set of practical procedures for
guiding public expenditure decisions.
Present Value
3
Project evaluation usually requires comparing costs and
benefits from different time periods
Dollars across time periods are not immediately
comparable, because of inflation and returns in the market.
Present Value:
Currency into the Future
4
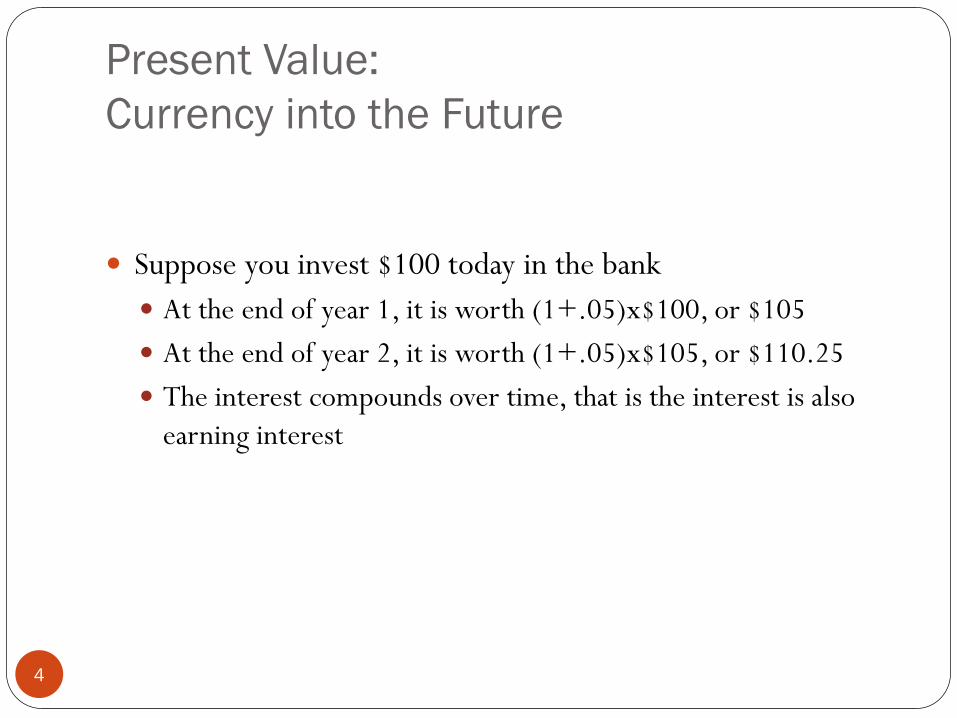
Suppose you invest $100 today in the bank
At the end of year 1, it is worth (1+.05)x$100, or $105
At the end of year 2, it is worth (1+.05)x$105, or $110.25
The interest compounds over time, that is the interest is also
earning interest
Present Value:
Currency into the Future
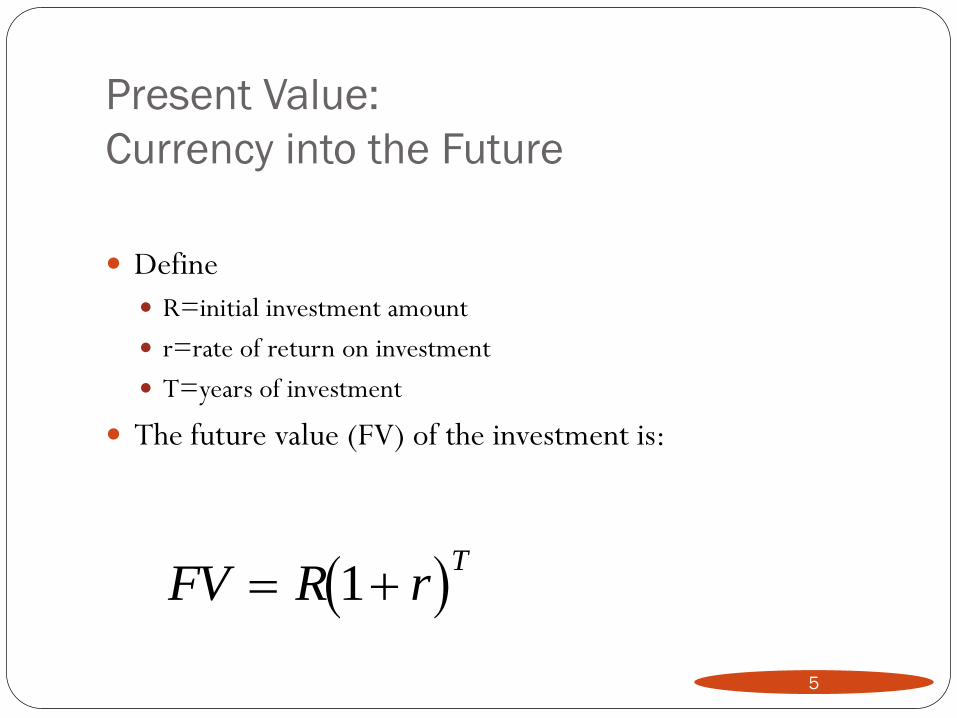
Define
R=initial investment amount
r=rate of return on investment
T=years of investment
The future value (FV) of the investment is:
FV R rT
1
5
Present Value:
Currency into the Future
6
Suppose someone promises to pay you $100 one year from now.
What is the maximum amount you should be willing to pay today for such a promise?
You are forgoing the interest that you could earn on the money that is being loaned.
Present Value:
Currency into the Future
7
The present value of a future amount of money is the
maximum amount you would be willing to pay today for
the right to receive the money in the future.
Present Value:
Currency into the Future
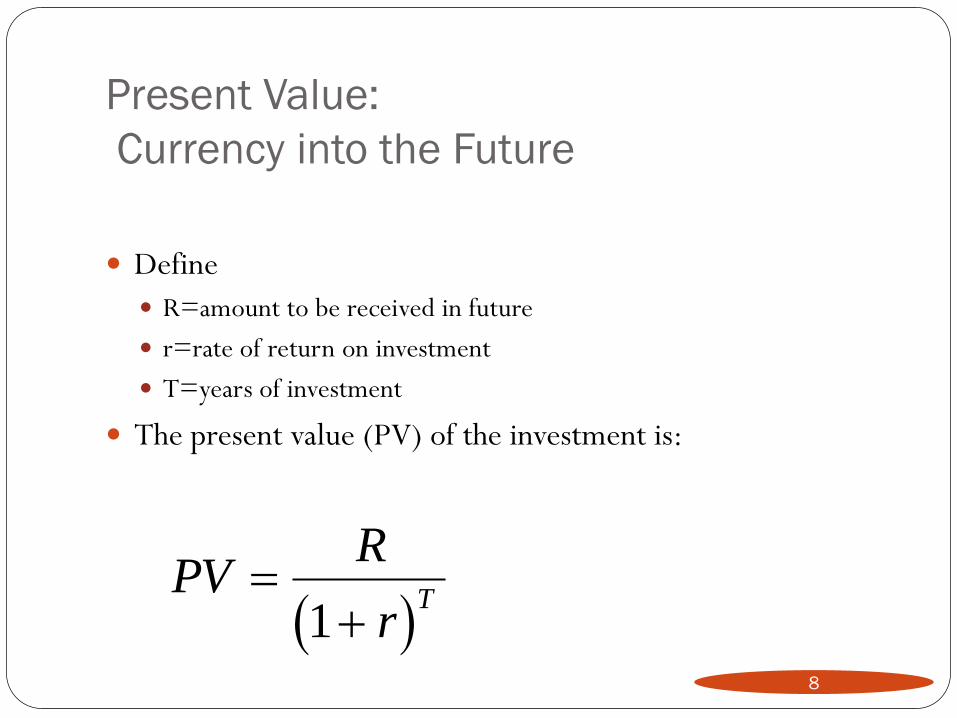
Define
R=amount to be received in future
r=rate of return on investment
T=years of investment
The present value (PV) of the investment is:
PV
R
rT
1
8
Present Value:
Future Currency into the Present
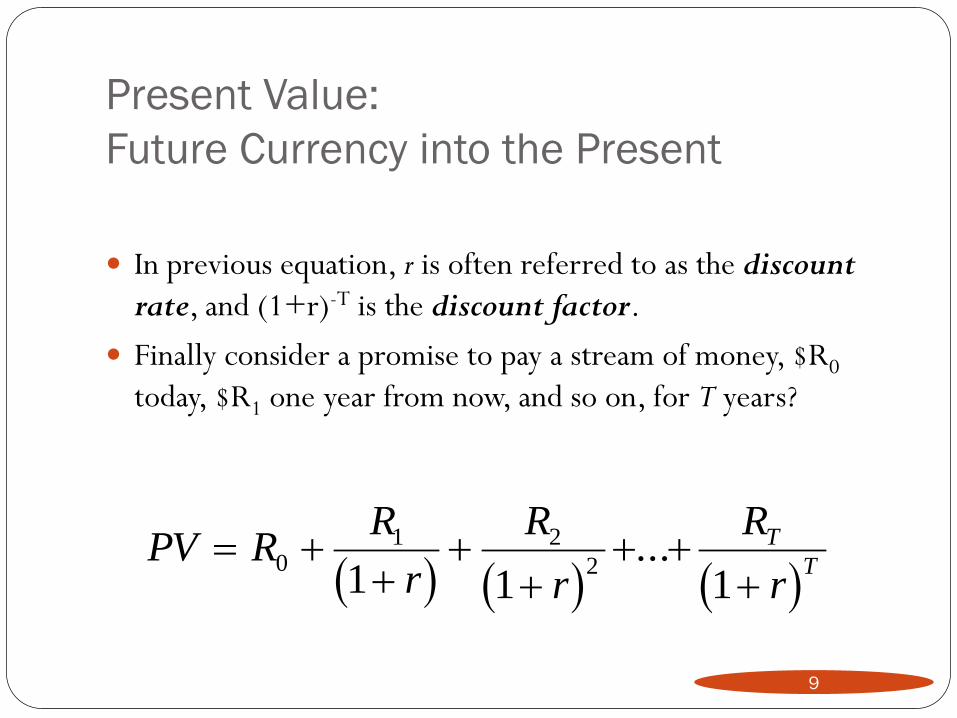
In previous equation, r is often referred to as the discount
rate, and (1+r)-T is the discount factor.
Finally consider a promise to pay a stream of money, $R0
today, $R1 one year from now, and so on, for T years?
PV R
R
r
R
r
R
r
T
T
0
1 2
21 1 1
...
9
Present Value:
Future Currency into the Present
10
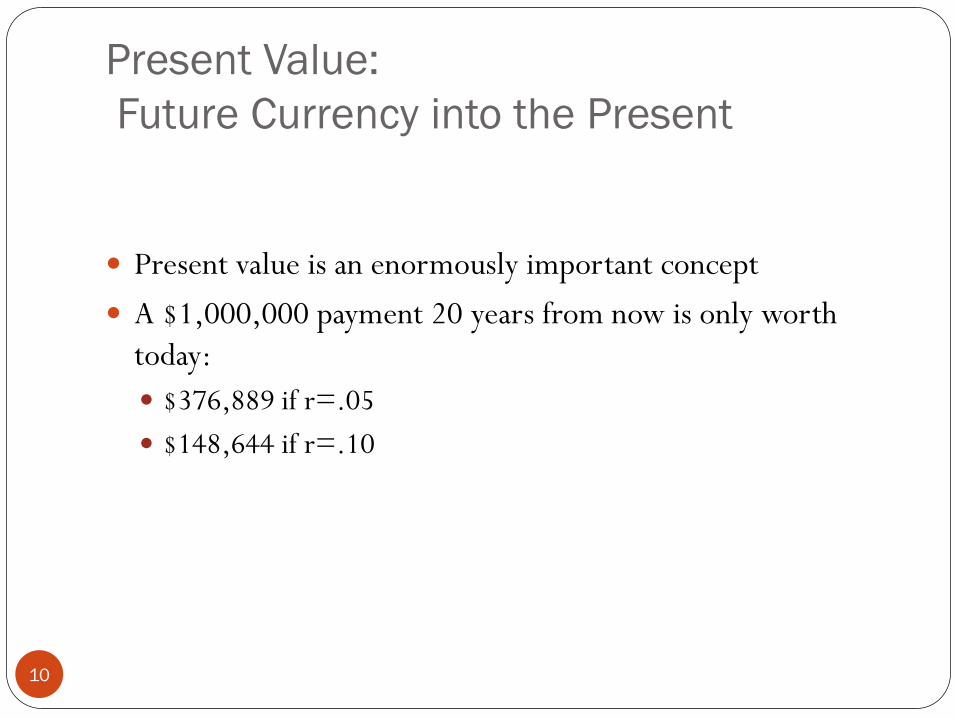
Present value is an enormously important concept
A $1,000,000 payment 20 years from now is only worth
today:
$376,889 if r=.05
$148,644 if r=.10
Present Value:
Inflation
11
Nominal amounts are valued according to the level of prices in the year the return occurs.
Real amounts are valued according to the level of prices in one particular year.
Inflation affects both the payout stream, and the discount factor, and these two cancel each other out.
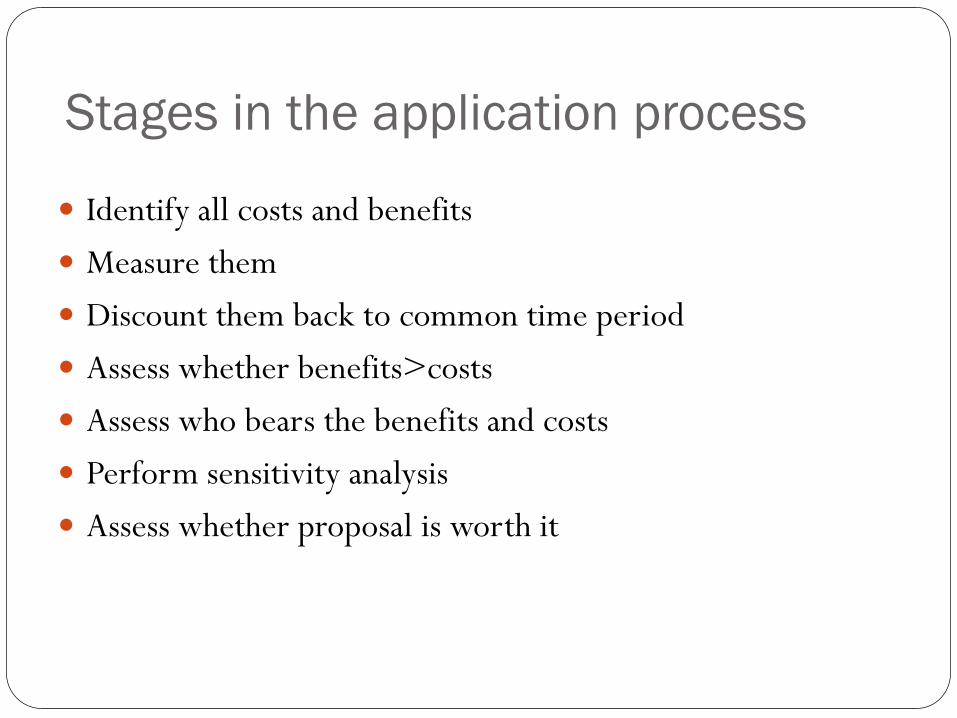
Stages in the application process
Identify all costs and benefits
Measure them
Discount them back to common time period
Assess whether benefits>costs
Assess who bears the benefits and costs
Perform sensitivity analysis
Assess whether proposal is worth it
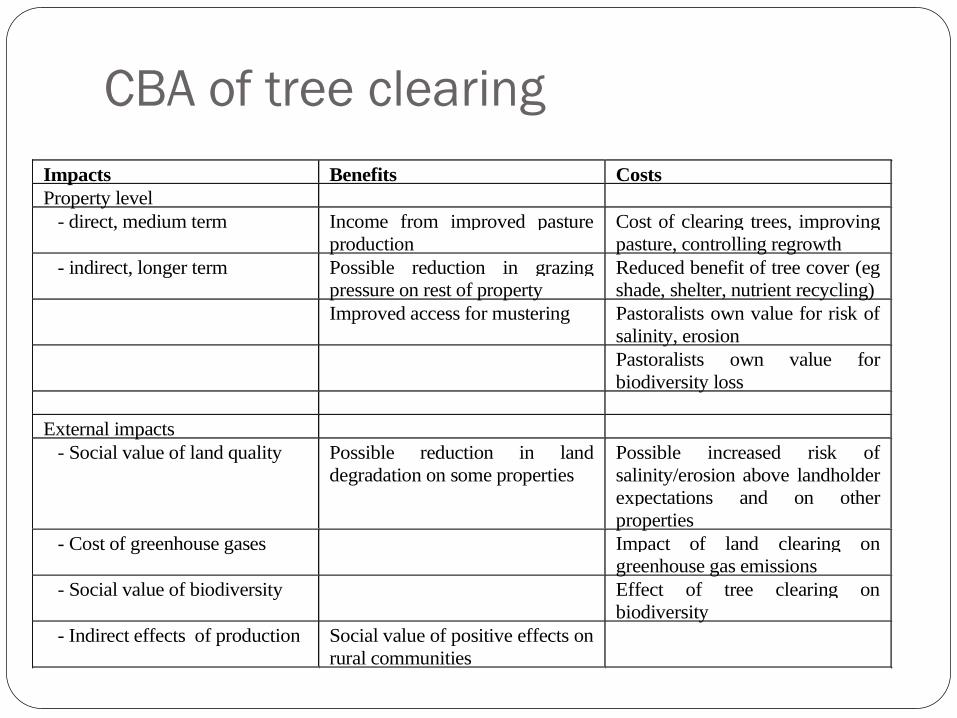
CBA of tree clearing
Impacts Benefits Costs
Property level
- direct, medium term Income from improved pasture
production
Cost of clearing trees, improving
pasture, controlling regrowth
- indirect, longer term Possible reduction in grazing
pressure on rest of property
Reduced benefit of tree cover (eg
shade, shelter, nutrient recycling)
Improved access for mustering Pastoralists own value for risk of
salinity, erosion
Pastoralists own value for
biodiversity loss
External impacts
- Social value of land quality Possible reduction in land
degradation on some properties
Possible increased risk of
salinity/erosion above landholder
expectations and on other
properties
- Cost of greenhouse gases Impact of land clearing on
greenhouse gas emissions
- Social value of biodiversity Effect of tree clearing on
biodiversity
- Indirect effects of production Social value of positive effects on
rural communities
Identification of impacts
Major problem in the past is that only financial costs and
benefits were identified - many environmental and social
ones ignored
Not always easy to be sure what the outcomes will be of
a project
Not always agreement about what are important social
and environmental impacts to include
Private Sector Project Evaluation
15
Suppose there are two projects, X and Y
Each entails certain benefits and costs, denoted as BX, CX, BY,
and CY.
Need to ask:
Is the project admissible?
Is the project preferable?
Private Sector Project Evaluation
16
Admissible: Are the benefits greater than the costs?
Preferable: Are the net benefits the highest?
Most projects involve a stream of benefits and costs over
time.
Private Sector Project Evaluation
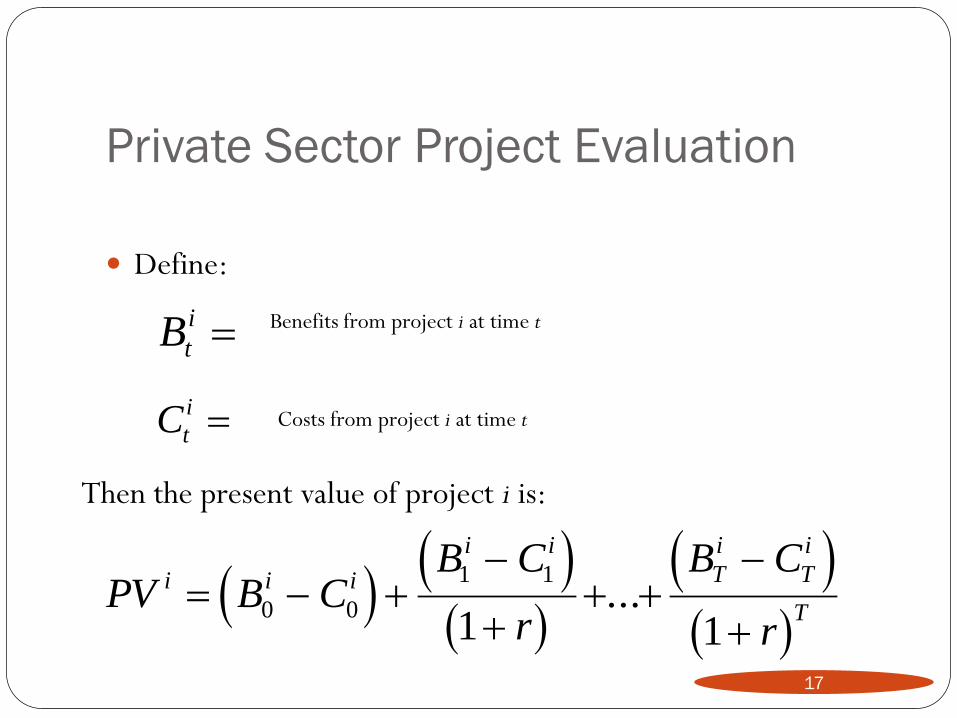
Define:
Bt
i
Ct
i
17
Benefits from project i at time t
Costs from project i at time t
Then the present value of project i is:
PV B CB C
r
B C
r
i i i
i i
T
i
T
i
T
0 0
1 1
1 1...
Private Sector Project Evaluation
18
The present value criteria for project evaluation are that:
A project is admissible only if its present value is positive
When two projects are mutually exclusive, the preferred project
is the one with the highest present value.
Private Sector Project Evaluation
19
Table 11.2 shows two different projects (R&D or
Advertising).
The discount rate plays a key role in deciding what project
to choose, because the cash inflows occur at different times.
The lower the discount rate, the more valuable the back-
loaded project.
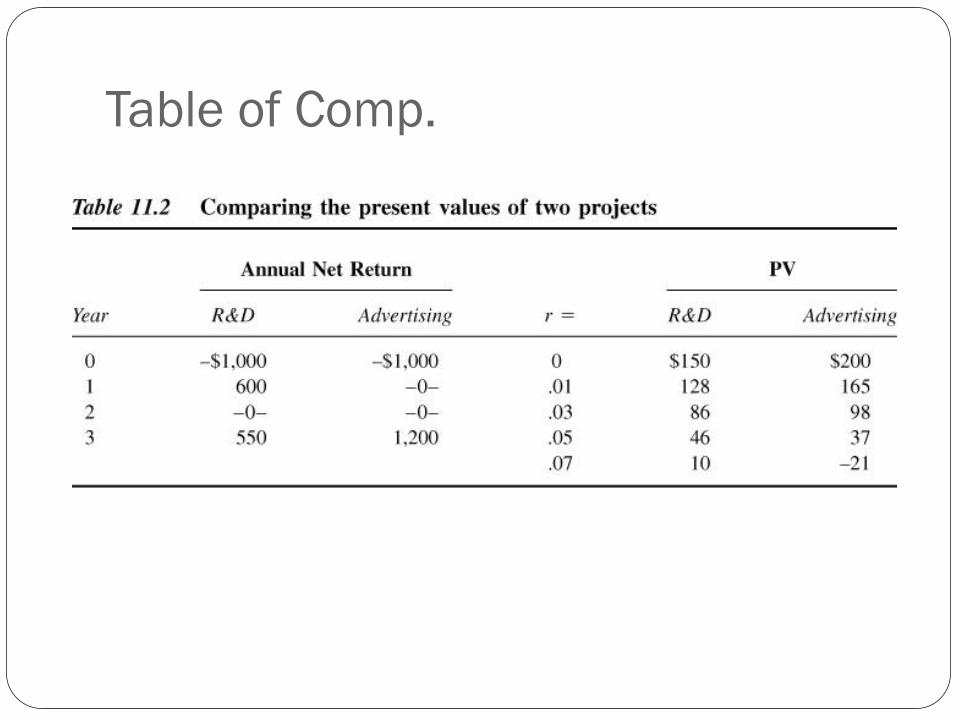
Table of Comp.
Private Sector Project Evaluation
21
Several other criteria are often used for project evaluation,
but can give misleading answers
Internal rate of return
Benefit-cost ratio
Private Sector Project Evaluation
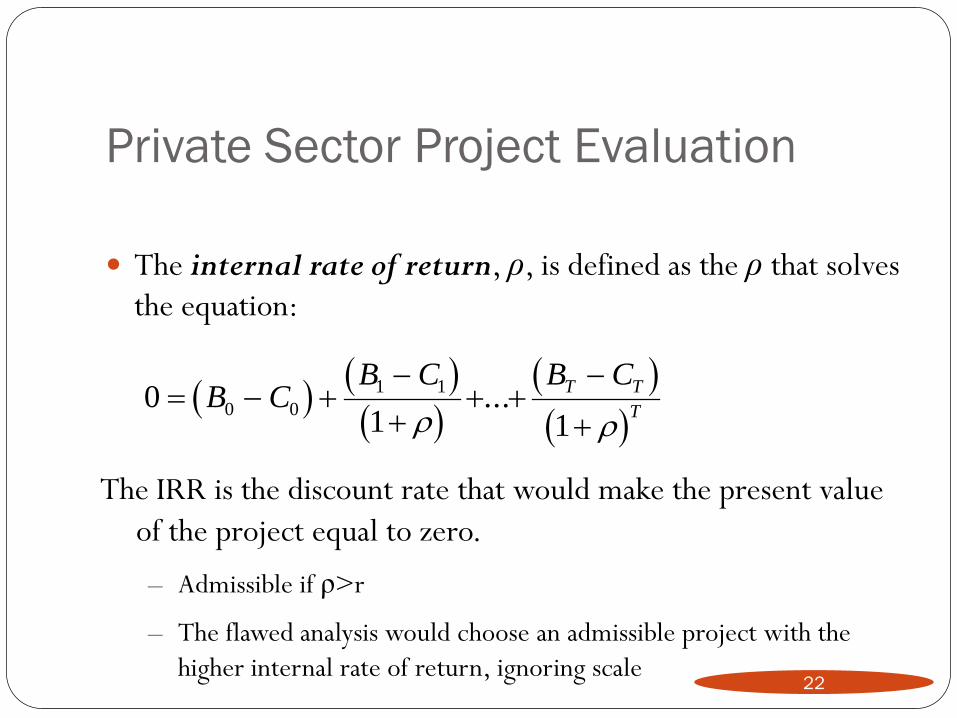
The internal rate of return, ρ, is defined as the ρ that solves
the equation:
0
1 10 0
1 1
B C
B C B CT T
T ...
22
The IRR is the discount rate that would make the present value
of the project equal to zero.
– Admissible if ρ>r
– The flawed analysis would choose an admissible project with the
higher internal rate of return, ignoring scale
Private Sector Project Evaluation
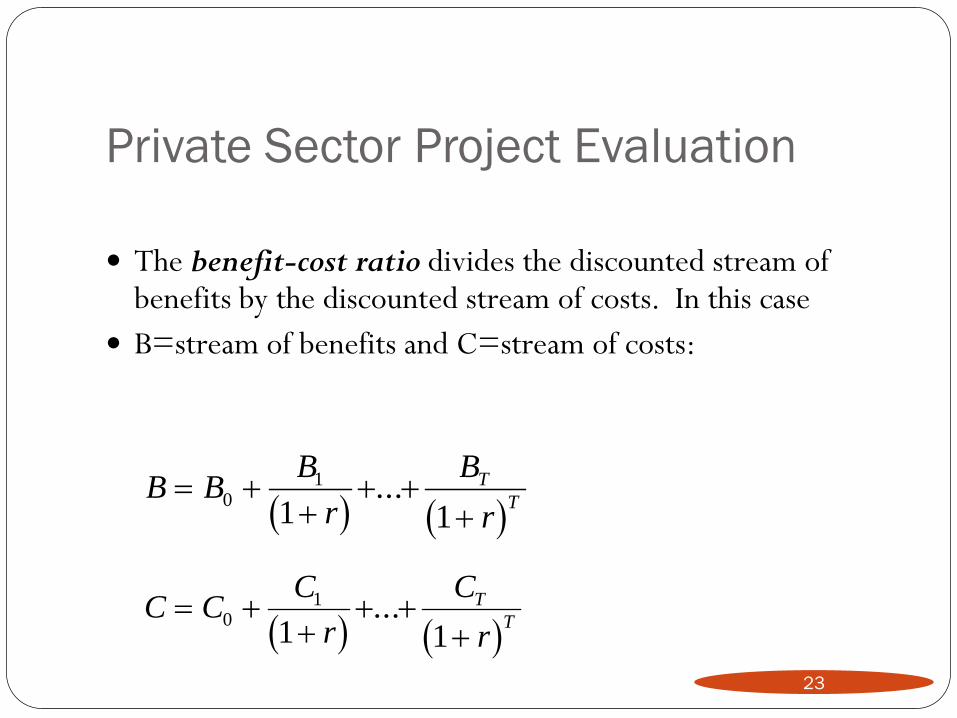
The benefit-cost ratio divides the discounted stream of benefits by the discounted stream of costs. In this case
B=stream of benefits and C=stream of costs:
B B
B
r
B
r
T
T
0
1
1 1...
C C
C
r
C
r
T
T
0
1
1 1...
23
Private Sector Project Evaluation
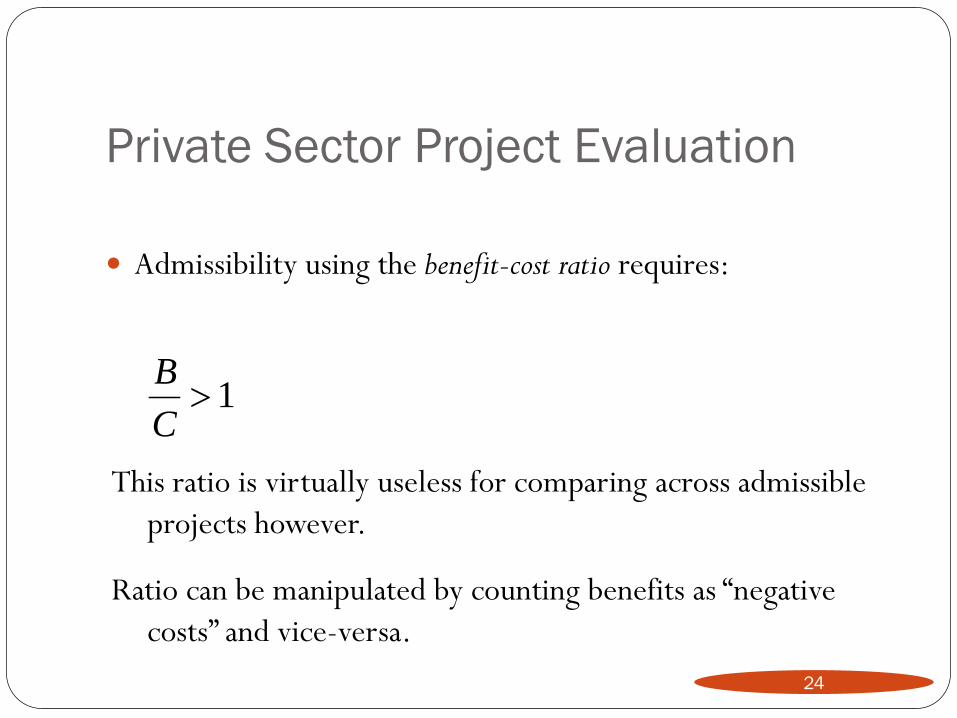
Admissibility using the benefit-cost ratio requires:
B
C 1
24
This ratio is virtually useless for comparing across admissible
projects however.
Ratio can be manipulated by counting benefits as “negative
costs” and vice-versa.

Discount rate for government projects
25
Government decision making involves present value
calculations
Costs, benefits and discount rates are somewhat different
from private sector
Discount rate for government projects
26
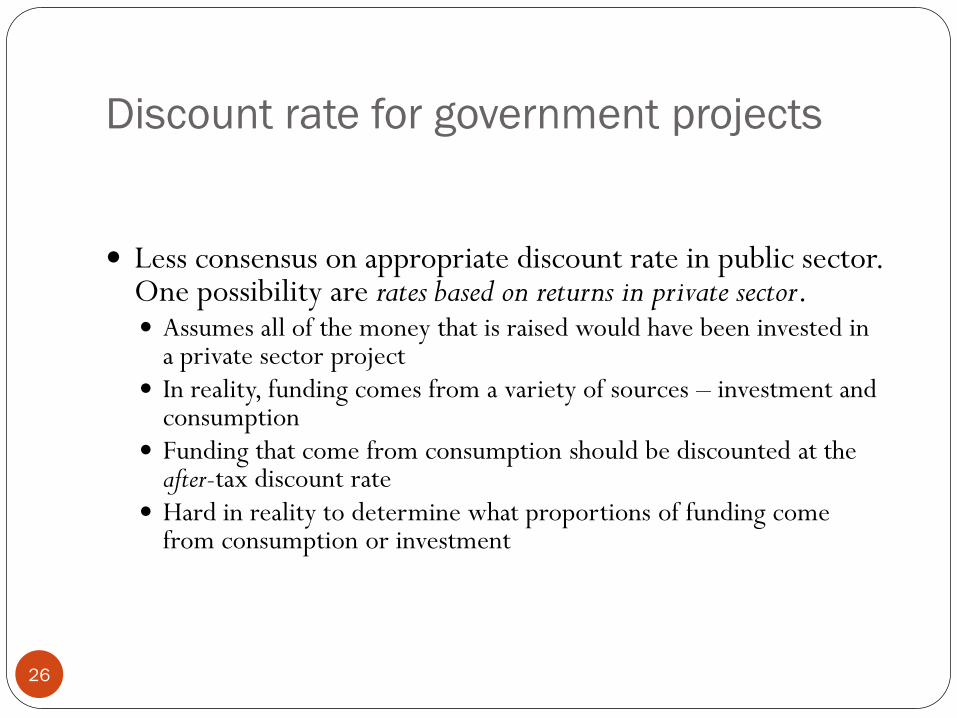
Less consensus on appropriate discount rate in public sector. One possibility are rates based on returns in private sector. Assumes all of the money that is raised would have been invested in
a private sector project In reality, funding comes from a variety of sources – investment and
consumption Funding that come from consumption should be discounted at the
after-tax discount rate Hard in reality to determine what proportions of funding come
from consumption or investment
Discount rate for government projects
27
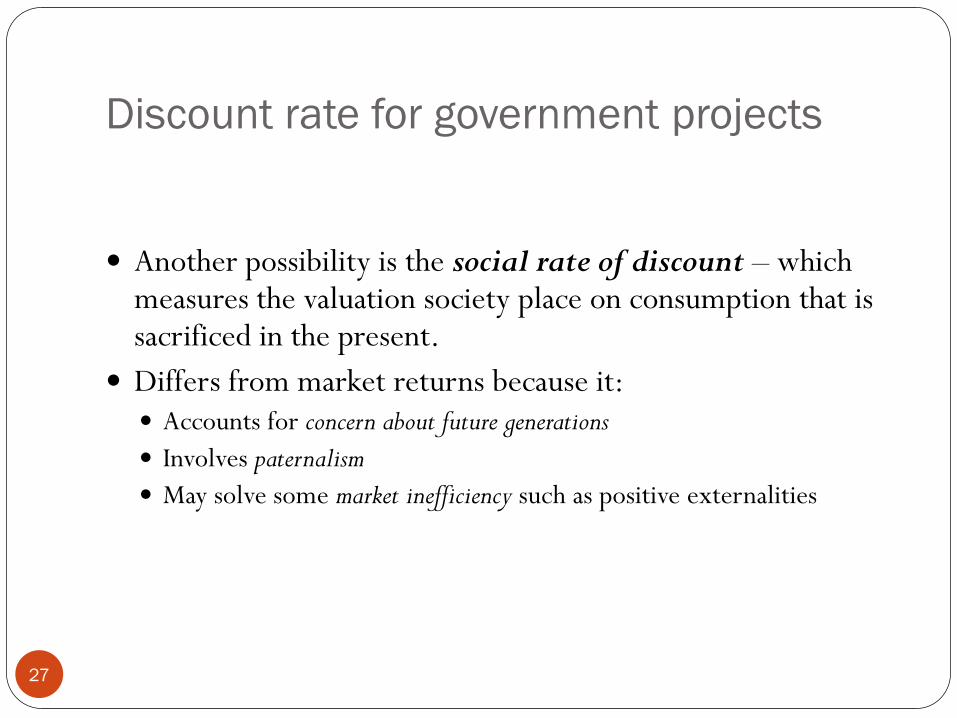
Another possibility is the social rate of discount – which measures the valuation society place on consumption that is sacrificed in the present.
Differs from market returns because it: Accounts for concern about future generations
Involves paternalism
May solve some market inefficiency such as positive externalities
Discount rate for government projects
28
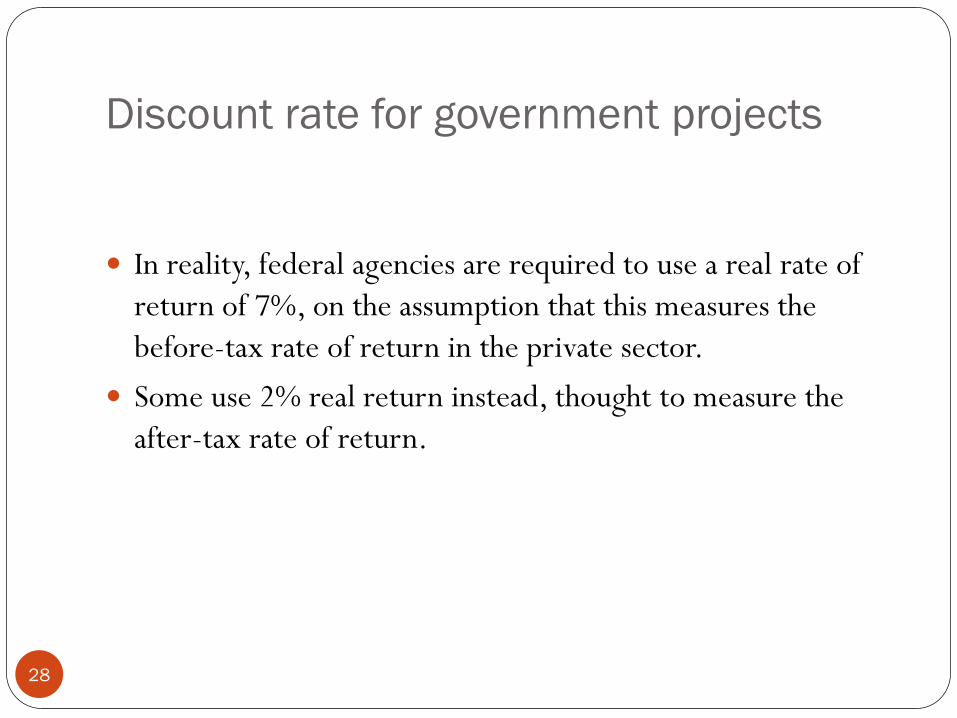
In reality, federal agencies are required to use a real rate of
return of 7%, on the assumption that this measures the
before-tax rate of return in the private sector.
Some use 2% real return instead, thought to measure the
after-tax rate of return.
Discount rate for government projects
29
When a new tax or expenditure is introduced, its effects
over a 5-year or 10-year period are analyzed to see whether
it will put the budget out of balance
Ignores discounting
Costs (or benefits) outside of the window are not counted
toward deficit (or surplus)
Profit today versus profit tomorrow
3
0
Money today is not the same as money tomorrow
◦ need way to convert tomorrow’s money into today’s
◦ important since firms make decisions over time
is it better to make profit now or invest for future profit?
how should investment in durable assets be judged?
◦ sacrificing profit today imposes a cost
is this cost justified?
Techniques from financial markets can be applied
◦ the concept of discounting and present value
The concept of discounting
3
1
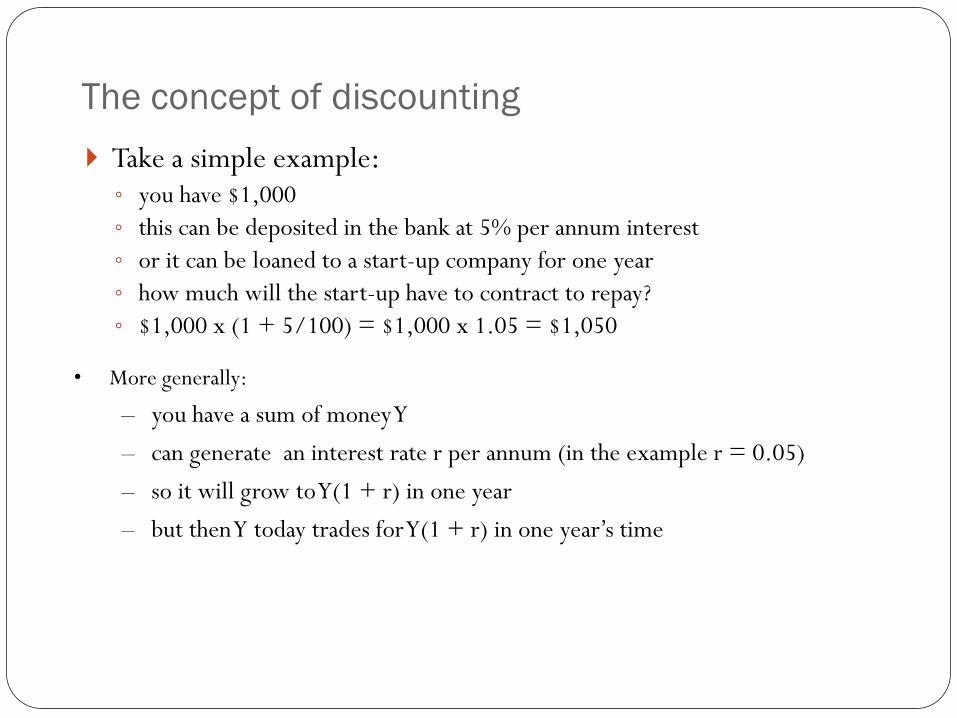
Take a simple example: ◦ you have $1,000
◦ this can be deposited in the bank at 5% per annum interest
◦ or it can be loaned to a start-up company for one year
◦ how much will the start-up have to contract to repay?
◦ $1,000 x (1 + 5/100) = $1,000 x 1.05 = $1,050
• More generally:
– you have a sum of money Y
– can generate an interest rate r per annum (in the example r = 0.05)
– so it will grow to Y(1 + r) in one year
– but then Y today trades for Y(1 + r) in one year’s time
3
2
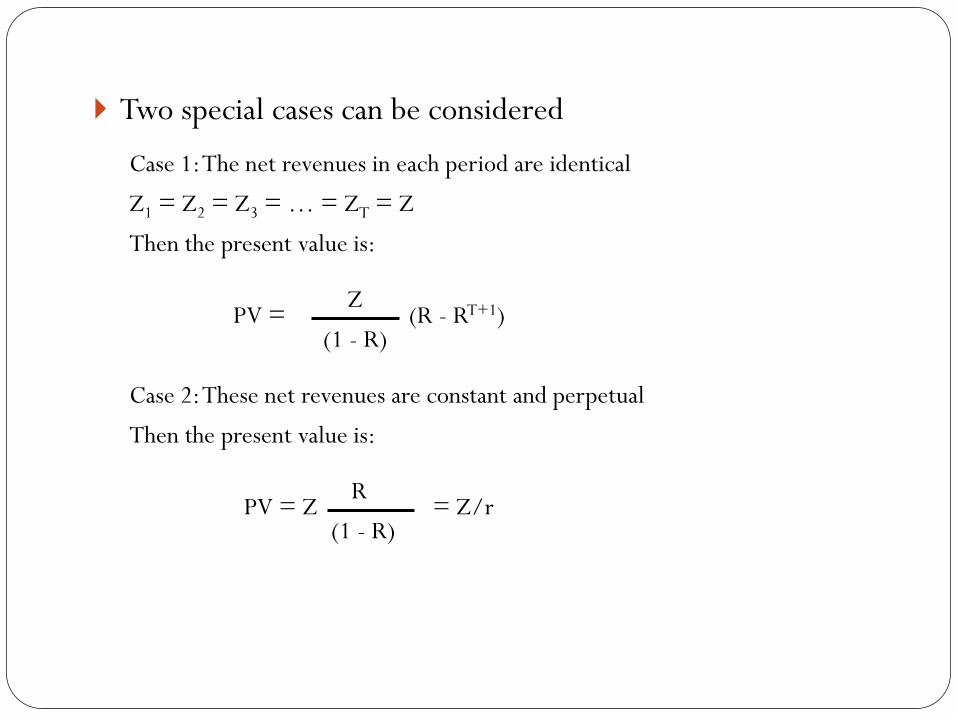
Two special cases can be considered
Case 1: The net revenues in each period are identical
Z1 = Z2 = Z3 = … = ZT = Z
Then the present value is:
PV = Z
(1 - R) (R - RT+1)
Case 2: These net revenues are constant and perpetual
Then the present value is:
PV = Z R
(1 - R) = Z/r
Present value and profit maximization
3
3
Present value is directly relevant to profit maximization
For a project to go ahead the rule is
◦ the present value of future income must at least cover the present value of
the expenses in establishing the project
The appropriate concept of profit is profit over the lifetime of the
project
The application of present value techniques selects the
appropriate investment projects that a firm should undertake to
maximize its value
Efficiency and Surplus
3
4
Can we reallocate resources to make some individuals better off without making others worse off?
Need a measure of well-being consumer surplus: difference between the maximum amount a consumer is
willing to pay for a unit of a good and the amount actually paid for that unit
aggregate consumer surplus is the sum over all units consumed and all consumers
producer surplus: difference between the amount a producer receives from the sale of a unit and the amount that unit costs to produce
aggregate producer surplus is the sum over all units produced and all producers
total surplus = consumer surplus + producer surplus
3
5
Quantity
$/unit
Demand
Competitive
Supply
PC
QC
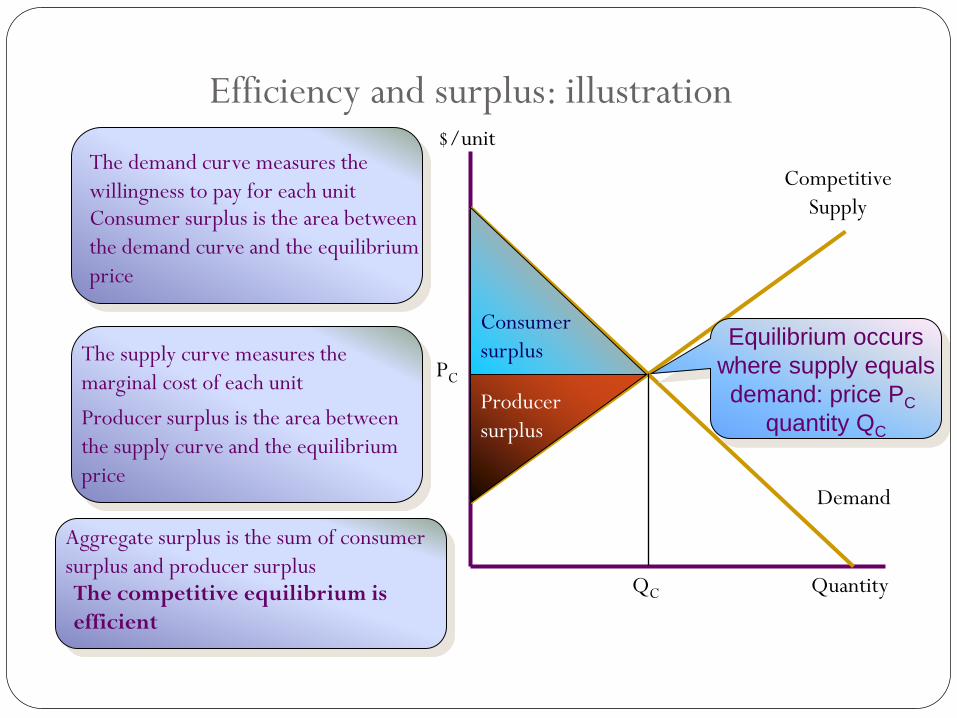
The demand curve measures the
willingness to pay for each unit Consumer surplus is the area between
the demand curve and the equilibrium
price
Consumer
surplus The supply curve measures the
marginal cost of each unit
Producer surplus is the area between
the supply curve and the equilibrium
price
Producer
surplus
Aggregate surplus is the sum of consumer
surplus and producer surplus
Equilibrium occurs
where supply equals
demand: price PC
quantity QC
Efficiency and surplus: illustration
The competitive equilibrium is
efficient
3
6
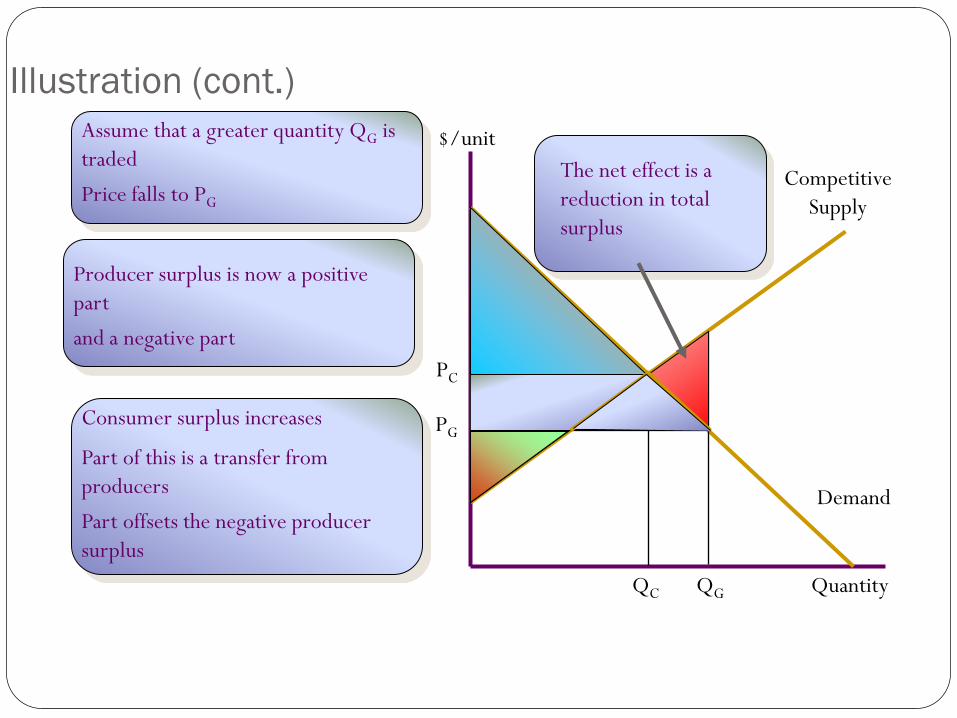
Illustration (cont.)
Quantity
Demand
Competitive
Supply
QC
PC
$/unit Assume that a greater quantity QG is
traded
Price falls to PG
QG
PG
Producer surplus is now a positive
part
and a negative part
Consumer surplus increases
Part of this is a transfer from
producers
Part offsets the negative producer
surplus
The net effect is a
reduction in total
surplus
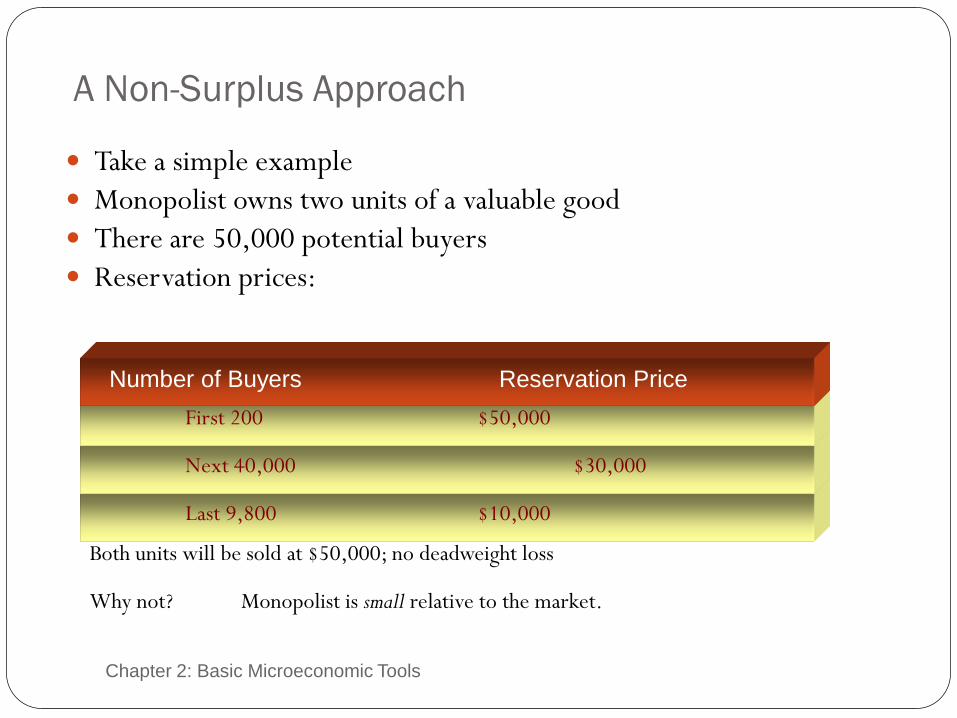
A Non-Surplus Approach
Chapter 2: Basic Microeconomic Tools 3
7
Take a simple example
Monopolist owns two units of a valuable good
There are 50,000 potential buyers
Reservation prices:
Last 9,800 $10,000
Next 40,000 $30,000
First 200 $50,000
Number of Buyers Reservation Price
Both units will be sold at $50,000; no deadweight loss
Monopolist is small relative to the market. Why not?
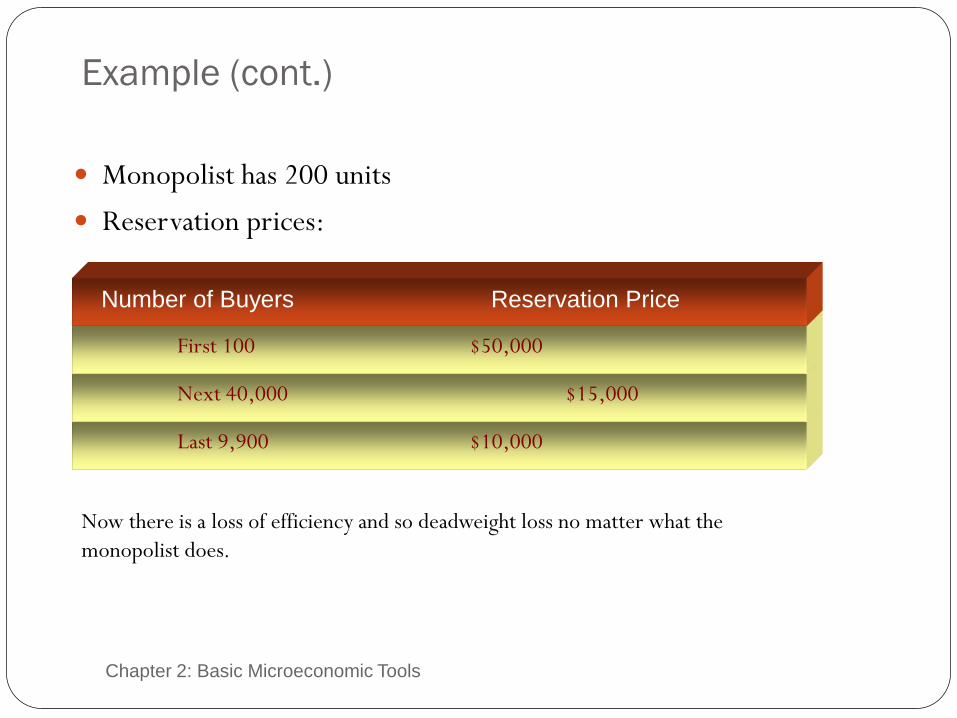
Example (cont.)
Chapter 2: Basic Microeconomic Tools 3
8
Monopolist has 200 units
Reservation prices:
Last 9,900 $10,000
Next 40,000 $15,000
First 100 $50,000
Number of Buyers Reservation Price
Now there is a loss of efficiency and so deadweight loss no matter what the
monopolist does.
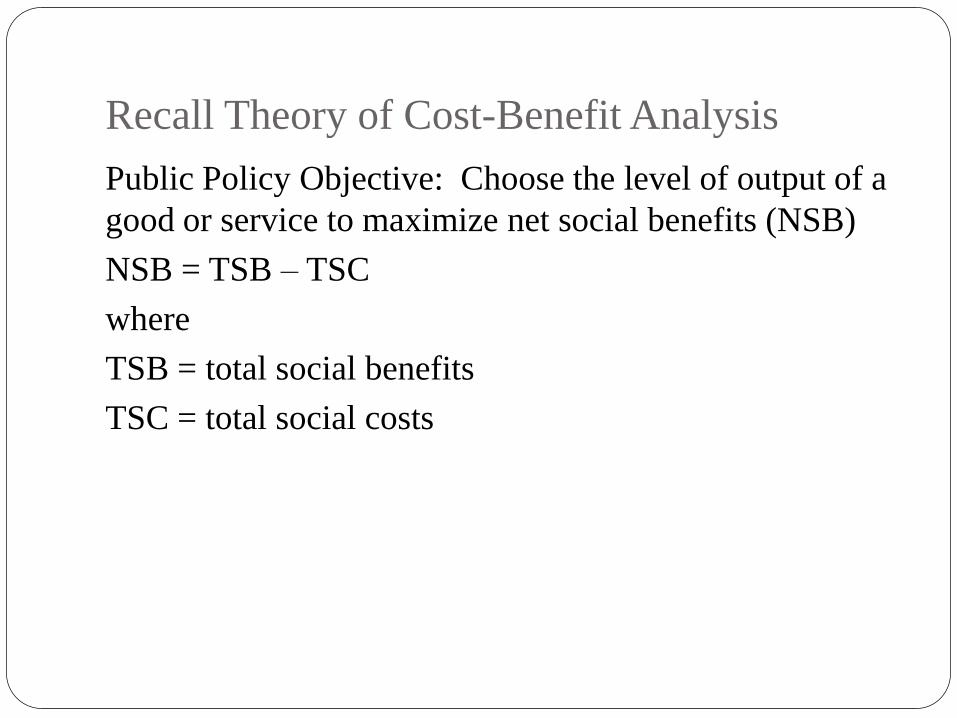
Recall Theory of Cost-Benefit Analysis
Public Policy Objective: Choose the level of output of a
good or service to maximize net social benefits (NSB)
NSB = TSB – TSC
where
TSB = total social benefits
TSC = total social costs
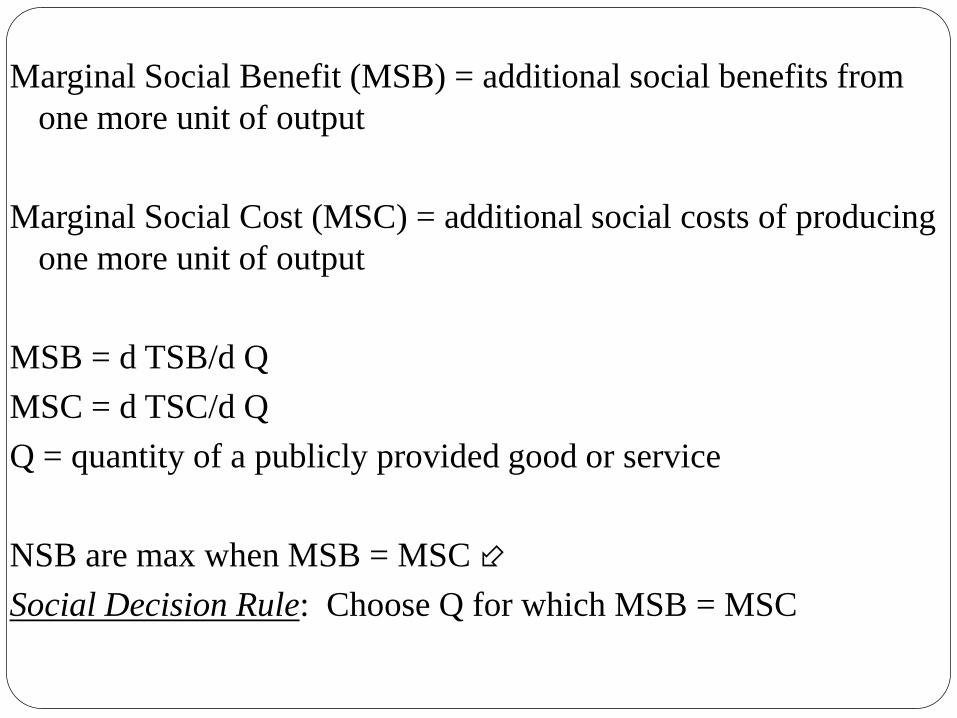
Marginal Social Benefit (MSB) = additional social benefits from
one more unit of output
Marginal Social Cost (MSC) = additional social costs of producing
one more unit of output
MSB = d TSB/d Q
MSC = d TSC/d Q
Q = quantity of a publicly provided good or service
NSB are max when MSB = MSC
Social Decision Rule: Choose Q for which MSB = MSC
Adjusting for the Time Dimension of
Environmental Benefits and Costs
41
Present Value Determination – a procedure that discounts
a future value (FV) into its present value (PV) by
accounting for the opportunity cost of money
Discount factor – the term 1/(1+r)t, where t is the number of
periods
Social discount rate – discount rate used for public policy
initiatives based on the social opportunity cost of funds
Adjusting for the Time Dimension of
Environmental Benefits and Costs
42
Inflation correction – a magnitude stated in terms of the
current period
Nominal value – a magnitude stated in terms of the current
period
Real value – a magnitude adjusted for the effects of inflation
Deflating – converts a nominal value into its real value
Adjusting for the Time Dimension of
Environmental Benefits and Costs
43
Summary of Deriving Time-Adjusted Benefits and Costs
Present value of benefits (PVB) – the time-adjusted magnitude of
incremental benefits associated with an environmental policy
change
Present value of costs (PVC) – the time adjusted magnitude of
incremental costs associated with an environmental policy
change
The Final Analysis: Comparing
Environmental Benefits and Costs
44
Step One: Determining Feasibility
Benefit-cost ratio – the ratio of PVB to PVC used to determine
the feasibility of a policy option if its magnitude exceeds unity
Present value of net benefits (PVNB) – the differential of (PVB –
PVC) used to determine the feasibility of a policy option if its
magnitude exceeds zero
The Final Analysis: Comparing
Environmental Benefits and Costs
45
Step Two: Decision Rules to Select Among Feasible Options
Maximize the present value of net benefits (PVNB) – a decision
rule to achieve allocative efficiency by selecting the policy
option that yields greatest excess benefits after adjusting for
time effects
Minimize the present value of costs (PVC) – a decision rule to
achieve cost–effectiveness by selecting the least-cost policy
option that achieves a preestablished objective
Reservations About the Use of Benefit-Cost
Analysis
46
Measurement Problems
Estimation is particularly problematic due to intangibles
Implicit costs
Equity Issues
Distribution of benefits and costs may be highly skewed
Valuing Public Benefits and Costs
47
Recall that the discount rate, benefits, and costs are needed
to compute the present value of a project
For private company:
Benefits = revenues received
Costs = firm’s payments for inputs
Valuing Public Benefits and Costs
48
For public sector, market prices may not reflect social benefits and costs. Externalities, for example
Several ways of measuring benefits and costs Market prices Adjusted market prices Consumer surplus Inferences from economic behavior Valuing intangibles
Valuing Public Benefits and Costs
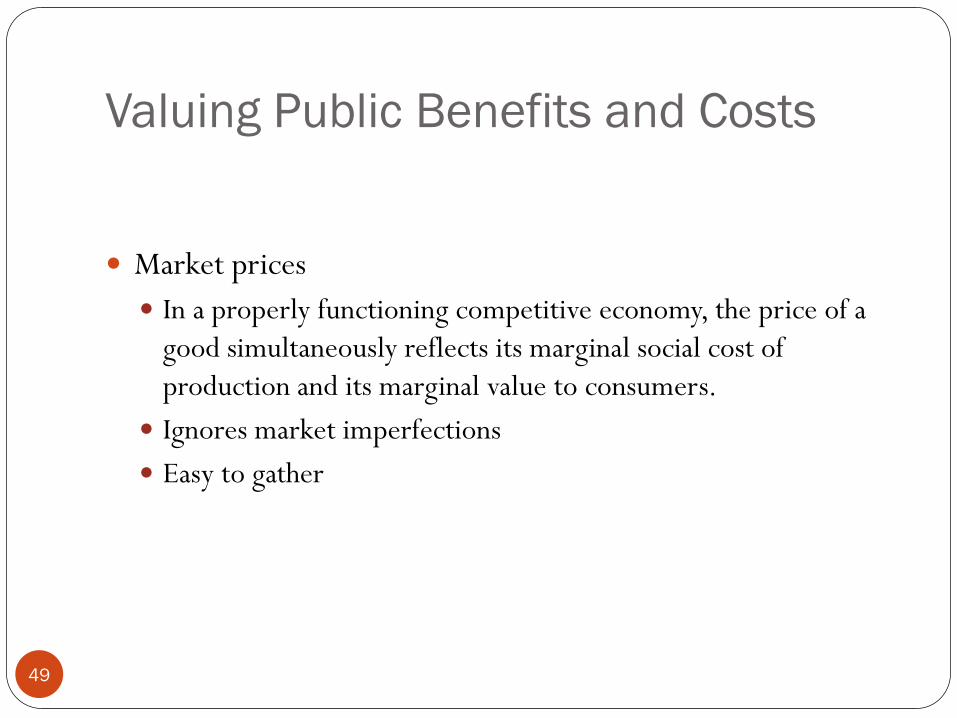
49
Market prices
In a properly functioning competitive economy, the price of a
good simultaneously reflects its marginal social cost of
production and its marginal value to consumers.
Ignores market imperfections
Easy to gather
Valuing Public Benefits and Costs
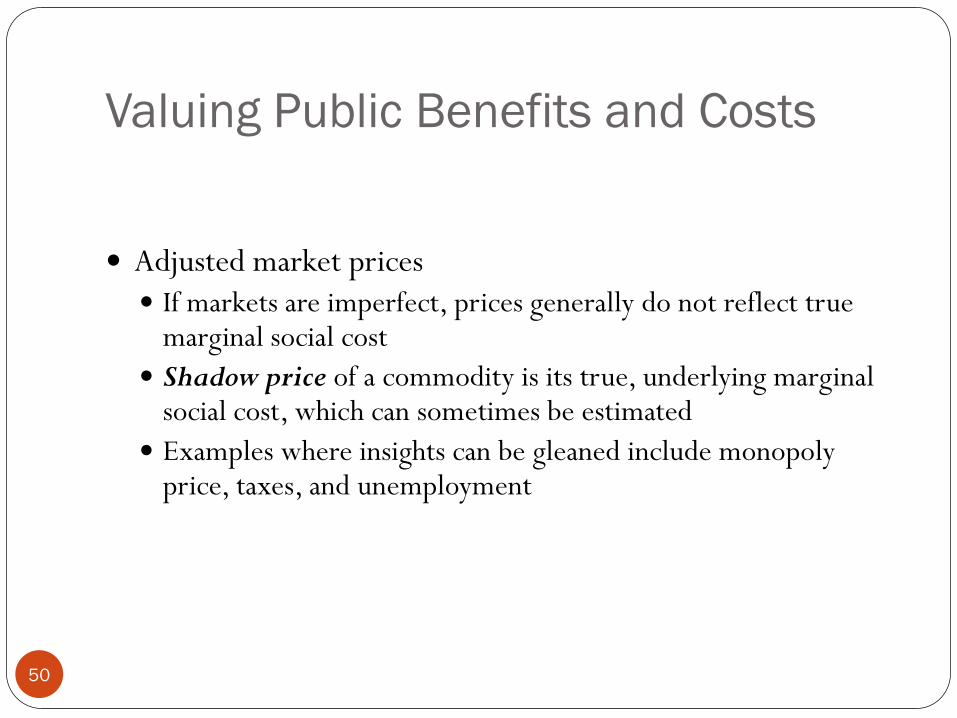
50
Adjusted market prices
If markets are imperfect, prices generally do not reflect true marginal social cost
Shadow price of a commodity is its true, underlying marginal social cost, which can sometimes be estimated
Examples where insights can be gleaned include monopoly price, taxes, and unemployment
Valuing Public Benefits and Costs
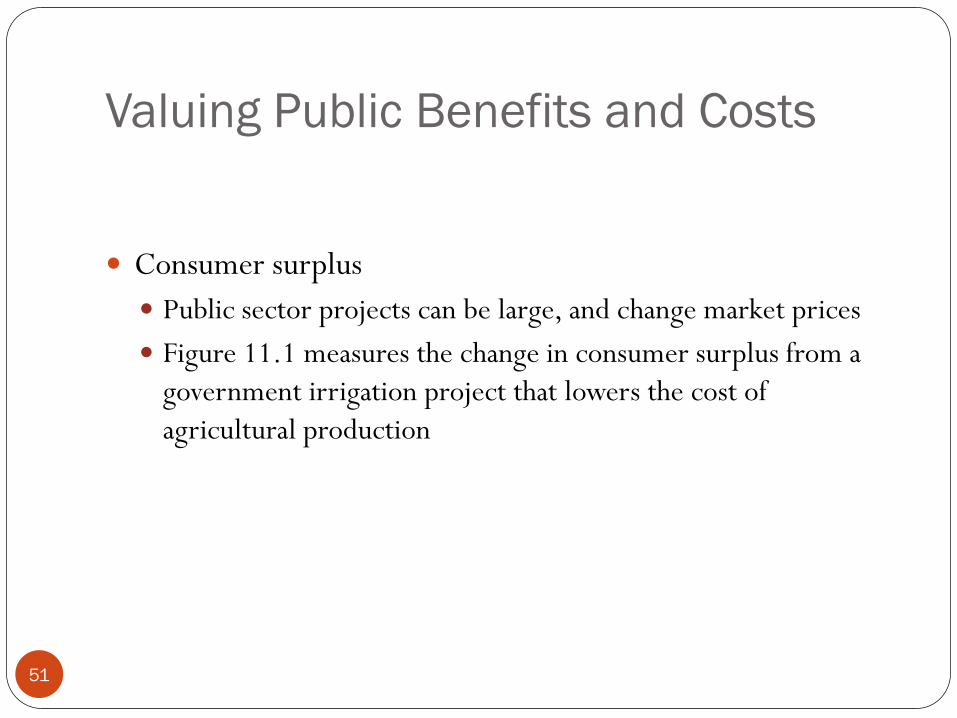
51
Consumer surplus
Public sector projects can be large, and change market prices
Figure 11.1 measures the change in consumer surplus from a
government irrigation project that lowers the cost of
agricultural production
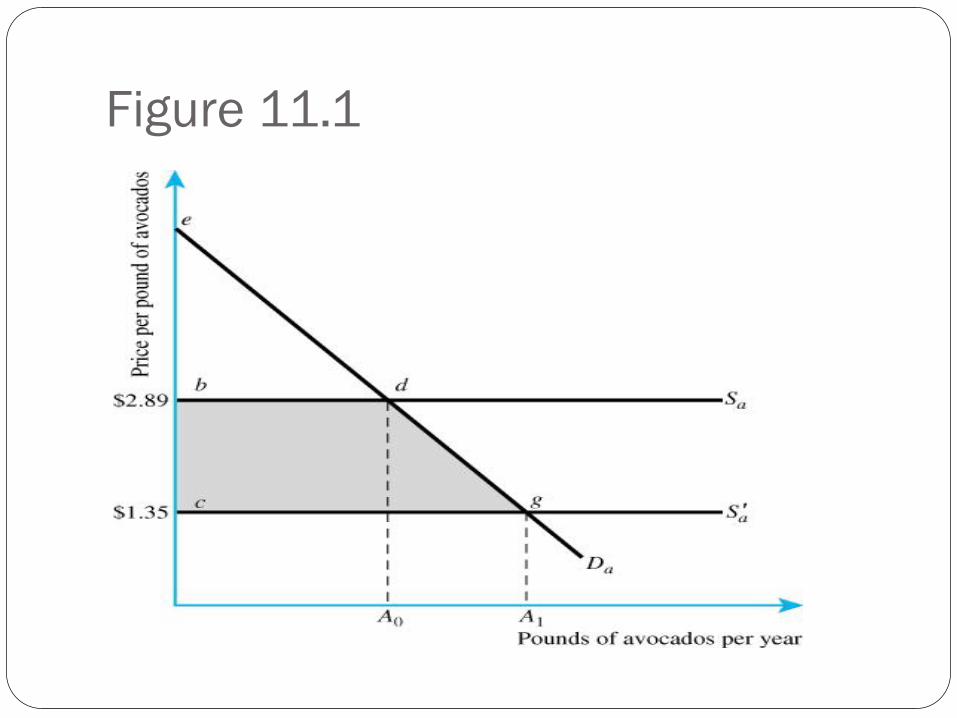
Figure 11.1
Valuing Public Benefits and Costs
53
In this figure, the change in consumer surplus is area bcgd.
Provided the government planner can accurately measure
the demand curve, the project’s benefit can be measured
with this change.
Valuing Public Benefits and Costs
54
Inferences from Economic Behavior
Many times a good in question is not explicitly traded, so no market price exists.
Examples:
Value of time
Value of life
Valuing Public Benefits and Costs
55
Value of time
In cost-benefit analysis, need to estimate the value of time
to take advantage of theory of leisure-income choice.
After-tax wage is often used
But hours of work not always a “choice,” and not all uses of
time away from job equivalent.
Valuing Public Benefits and Costs
56
Researchers have examined value of time by travel
commuting choices.
Trains are more expensive, but less time-consuming, than
buses. The same is true about non-stop airline flights versus
those with a layover.
Estimates are that value of time approximately half of the
before-tax wage.
Valuing Public Benefits and Costs
57
Value of life
The mindset that “life is priceless” presents obvious difficulties for cost-benefit analysis.
If the benefits of a saved life are infinite, any project that leads to even a single life saved has an infinitely high present value.
Valuing Public Benefits and Costs
58
Economists use two methods to assign finite values to
human life:
Lost earnings: Net present value of individual’s after-tax earnings
over lifetime.
Taken literally, no loss for aged, infirm, or severely handicapped
Probability of death: Most projects affect probability of death (e.g.
cancer research). People are willing to accept increases in the
probability of death for a finite amount of money.
Valuing Public Benefits and Costs
59
Examples:
Purchasing a more expensive, safer car with a lower
probability of death versus a less expensive, less safe car.
Occupational choice: Riskier jobs have higher wages, all else
equal
Willingness to pay for safety devises like smoke alarms.
Valuing Public Benefits and Costs
60
Estimates suggest value of a life between $4,000,000-$9,000,000
Can contrast this versus the cost per life saved:
Emergency floor lights on airplanes cost about $900,000 per life saved
Asbestos removal rules cost $100,000,000 per life saved
Valuing Public Benefits and Costs
61
Valuing intangibles
National prestige, others
Can be used to subvert entire cost-benefit analysis
Could use difference between costs and benefits to make an
argument on how large intangibles would have to be to
make the project admissible
Uncertainty
62
The results of many projects are uncertain (e.g., AIDS vaccine research or defense research).
In risky projects, benefits or costs must be converted into certainty equivalents – the amount of certain income the individual would trade for a set of uncertain outcomes generated by project.
Requires information on distribution of returns, and risk aversion.
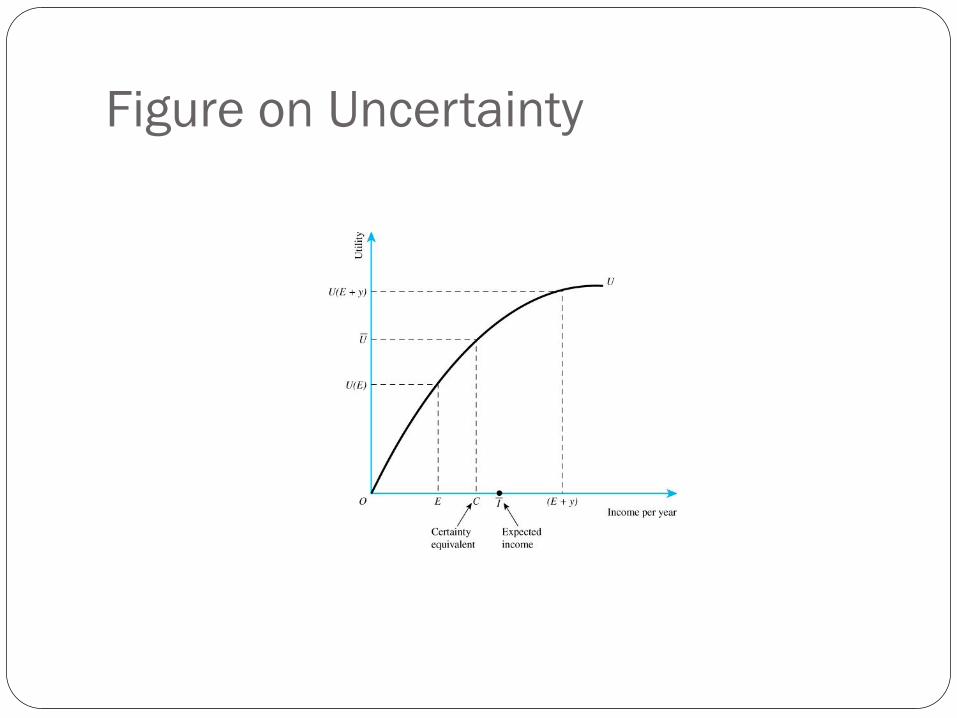
Figure on Uncertainty
Valuing Costs and Benefits
One of the key stages in Cost-Benefit Analysis was to
measure all the costs and benefits
Normally do this in terms of dollar values
Not always easy, because some items (eg biodiversity
protection) are not traded in markets
Need special non-market valuation techniques to handle
these cases
Non-market valuation techniques
Revealed preference techniques
Travel cost method
used for recreation impacts
Hedonic pricing
used for housing/lifestyle impacts
Averted expenditure techniques
Often used to estimate the value of indirect use benefits
Storm protection benefits of mangroves
Non-market valuation techniques 2
Stated preference techniques
Contingent valuation
Choice modelling
These are capable of estimating non-use values
Key techniques to use in relation to values for
biodiversity
But often complex, expensive and time consuming to
apply


![Principles and Standards for Benefit–Cost Analysis] Introduction- Professionalizing Benefit–Cost Analysis](https://static.fdocuments.us/doc/165x107/56d6beb21a28ab30169333bb/principles-and-standards-for-benefitcost-analysis-introduction-professionalizing.jpg)