INTRODUCTION Sand Resource Thickness of MON-1 · SAND RESOURCE THICKNESS PLOTS9810 27 25 23 21 19...
2
EXPLANATION FOR SAND RESOURCE THICKNESS PLOTS 27 25 23 21 19 17 15 13 11 9 7 5 SAND RESOURCE THICKNESS (in feet) Core depth is below sea floor (bsf). Sand resource thickness plot coordinates in New Jersey State Plane Feet. Thickness less than 5 feet not shown. 10 10 foot thickness intervals Core location 45 + 17 2 foot thickness intervals MAP SYMBOLS SIGNIFICANT SAND RESOURCE AREAS IN STATE AND FEDERAL WATERS OFFSHORE MONMOUTH COUNTY, NEW JERSEY Michael V. Castelli 1 , Daniel Latini 2 , Jane Uptegrove 1 , Jeffrey S. Waldner 3 , David W. Hall 3 , Andrea L. Friedman 4 by 2015 -40 -100 -110 -120 -130 -170 -140 -150 -160 -160 -150 -180 -190 -100 -100 -110 -120 -130 -110 -100 -100 -140 -150 -10 -20 -30 -40 -30 -10 -20 -30 -20 -10 -20 -40 -30 -90 -80 -90 -90 -80 -80 -90 -70 -70 -70 -70 -70 -70 -70 -50 -60 -60 -50 -60 -50 -60 -50 Point Pleasant Beach Sea Girt Belmar Asbury Park Monmouth Beach Middletown Rumson Sea Bright Sandy Hook Long Branch West Long Branch Oceanport Ocean Deal Neptune Neptune City Bradley Beach Avon-by- the-Sea Wall Spring Lake Heights Spring Lake Manasquan Lake Como Interlaken Allenhurst Loch Arbour Eatontown Little Silver Atlantic Highlands Highlands Fair Haven Na v e s in k River River Sh ar k Ri v e r Raritan Bay Twelve-mile limit Three-mile limit Three-mile limit Shrewsbury Atlantic Ocean Manasquan Inlet 84 43 82 85 70 69 42 65 71 72 40 64 81 83 80 73 30 86 29 63 39 45 44 62 68 47 46 32 79 52 66 33 49 48 31 37 34 60 61 59 50 51 57 67 35 54 53 36 56 58 38 55 77 74 9630 9620 9600 1220 1260 1420 1230 1300 9610 9670 1310 1210 1240 9580 1250 1300 9610 9670 9490 1290 9640 1280 9480 1270 1260 1240 1250 1200 1190 9470 9471 9460 9450 1220 1210 1010 1020 9520 9521 9580 1290 9640 9420 1280 1270 9521 9500 9650 1200 9590 1190 1230 9530 5910 9490 9480 9550 1410 1070 9540 9630 1030 9620 9600 1400 9560 1100 1430 9570 9470 9471 9606 1180 9460 9680 9450 9690 1170 1090 1160 1140 9570 9810 9430 9820 9560 1120 1430 1100 1090 1080 1070 1060 1050 1110 1130 1400 9550 1410 1120 1040 1030 9540 9510 9530 9650 1020 1010 1040 1050 1060 1140 9500 9520 9660 1170 1160 1180 9440 9430 1150 5231 5221 9420 1310 1150 9590 1340 1350 1360 1370 1380 1390 9420 9420 MON-14 MON-13 MON-12 MON-11 MON-9 MON-7 MON-6 MON-5 MON-2 MON-3 MON-4 MON-10 MON-1 MON-8 SB-1 BA-6 BA-5 BA-4 BA-2, BA-3 bathymetric contour interval = 10 ft. scale 1:80000 0 1 2 kilometers 0 1 2 nautical miles N EXPLANATION 87 468 NJGWS-delimited sand resource area Three-mile limit USACE/NJDEP-designated borrow area Twelve-mile limit NJGWS seismic trackline NJGWS vibracore Volume of Monmouth County Offshore Sand Resource Areas calculated at both a 5-ft and 10-ft minimum sand thickness in cubic yards (cu. yds.). MON-1 MON-2 MON-3 MON-4 MON-5 MON-6 MON-7 MON-8 MON-9 MON-10 MON-11 MON-12 MON-13 MON-14 MONMOUTH COUNTY RESOURCE NAME VOLUME 5 ft minimum Thickness (cu. yds.) VOLUME 10 ft minimum Thickness (cu. yds.) 18,508,000 31,337,000 4,643,000 21,788,000 6,534,000 25,282,000 20,975,000 12,814,000 3,318,000 2,605,000 4,163,000 2,651,000 2,502,000 295,000 10,938,000 27,028,000 3,219,000 17,928,000 4,293,000 20,255,000 17,178,000 6,441,000 2,233,000 1,931,000 949,000 990,000 354,000 53,000 BORROW NAME SB-1 BA-6 BA-5 BA-4 BA-3 BA-2 NAME Belmar #6 Belmar #5 Belmar #4 Belmar #3 Belmar #2 Sea Bright-1989 54,500,000 VOLUME (cu. yds.) 2,190,000 2,900,000 1,500,000 1,010,000 1,480,000 Sand volumes of USACE-designated borrow areas (USACE, 1989, 1993). 27 25 23 21 19 17 15 13 11 9 7 5 SAND RESOURCE THICKNESS (in feet) SEAFLOOR ELEVATION (feet below sea level) -10 -20 -30 -40 -50 -60 -70 -80 -90 -100 -110 -120 -130 -140 -150 -160 -170 -180 -190 -200 -210 -220 MONMOUTH COUNTY Area of Detail Middlesex Mercer Ocean 74 o 00’00” 73 o 52’30” 73 o 45’00” 74 o 00’00” 73 o 52’30” 73 o 45’00” 40 o 07’30’’ 40 o 15’00’’ 40 o 22’30’’ 40 o 07’30’’ 40 o 15’00’’ 40 o 22’30’’ Figure 1. Speed over ground at 3.5 knots; time/location stamps at 2-minute intervals = approximately 700 ft. Sand thickness above prominent seismic reflector shown in green. sand interbedded fines Core 55 Seismic Line 9440 SW NE Two-way travel time (TWTT) in milliseconds 7.5/ 15.0/ 24.6 49.2 19.9/ 28.7/ 37.5/ 46.2/ 55.0/ 63.7/ 72.5/ 81.2/ 65.3 94.1 123.0 151.5 180.4 208.9 237.8 266.3 meters/feet Depth in meters and feet, based on the acoustic velocity in water = 1500 meters/second, and an estimated acoustic velocity in these sediments of 750 meters/second Seafloor Prominent seismic reflector at acoustic imped- ance contrast between sand and underlying interbedded silts, sand and clay. Table 1. Unit conversions of sediment sizes differentiated in this study (modified from Wentworth, 1922). -3 -2 -1 0 1 2 3 4 5 4 3 2 1 0.5 0.4 0.3 0.2 0.1 8.00 6.73 5.66 4.764 4.00 3.36 2.83 2.38 2.00 1.63 1.41 1.19 1.00 0.840 0.707 0.545 0.500 0.420 0.354 0.297 0.250 0.210 0.177 0.149 0.125 0.105 0.088 0.074 0.32” 0.16” 0.08” 1 1/2 1/4 1/8 1/16 4 5 6 7 8 10 12 14 16 20 25 30 35 40 45 50 60 70 80 100 120 140 170 200 230 5/16 0.265 fine very fine very coarse coarse medium fine very fine PHI - mm CONVERSION Φ = log 2 (d in mm) mm Φ Fractional mm and Decimal inches SIZE TERMS (after Wentworth, 1922) Undifferentiated Pebbles, Cobbles and Boulders SIEVE SIZES ASTM No. (U.S. Standard) Pebbles Sand Granules Undifferentiated Clay and Silt inches mm Sand Resource Thickness of MON-1 464000 465000 466000 467000 468000 469000 470000 471000 472000 473000 638000 639000 640000 641000 642000 643000 644000 645000 646000 647000 648000 5 5 7 7 9 9 9 9 9 9 9 10 10 10 10 10 10 11 11 11 11 11 11 11 13 15 7 9 10 10 11 13 15 17 19 7 7 7 7 9 9 9 9 10 10 10 10 11 11 11 11 13 13 13 15 9 7 9 10 11 17 Sand Volume (cu. yds.) 5-ft. min = 18,508,000 10-ft. min = 10,938,000 11 + + 56 38 55 + NJGWS reports grain-size median values by depth in core runs, as recorded in the driller’s log. In some cases, core depths on different runs may not exactly coincide. Due to this possibility, there may be discrepancies in grain size median values at specific depths on different drilling runs. Depth Median (phi) (mm) bsf (m) 1.46 1.67 1.78 1.72 1.97 1.73 1.64 1.77 1.75 1.87 1.91 1.88 4.23 2.36 4.17 3.25 3.27 3.22 3.19 3.41 3.56 0.36 0.31 0.29 0.30 0.26 0.30 0.32 0.29 0.30 0.27 0.27 0.27 0.05 0.19 0.06 0.11 0.10 0.11 0.11 0.09 0.08 0.0 0.3 0.6 0.9 1.2 1.5 1.8 2.1 2.4 2.7 3.0 3.3 3.6 3.9 4.2 4.5 4.8 5.1 5.4 5.7 6.0 Core 55 1.33 1.39 1.37 1.61 1.46 1.55 1.06 1.39 1.57 1.48 1.07 1.35 1.40 1.23 2.06 2.20 2.32 2.43 -2.62 0.40 0.38 0.39 0.33 0.36 0.34 0.48 0.38 0.34 0.36 0.47 0.39 0.38 0.43 0.24 0.22 0.20 0.19 6.14 Depth Median (phi) (mm) bsf (m) 0.0 0.3 0.6 0.9 1.2 1.5 1.8 2.1 2.4 2.7 3.0 3.3 3.6 3.9 4.2 4.5 4.8 5.1 5.4 Core 38, Run 1 Depth Median (phi) (mm) bsf (m) 1.85 2.01 2.00 1.86 4.19 2.92 4.18 4.23 4.23 4.23 4.14 0.28 0.25 0.25 0.27 0.05 0.13 0.06 0.05 0.05 0.05 0.06 3.6 3.9 4.2 4.5 4.8 5.1 5.4 5.7 6.0 6.3 6.6 Core 36, Run 2 0.0 0.3 0.6 0.9 1.2 1.5 1.8 2.1 2.4 2.7 3.0 3.3 3.6 3.9 4.2 1.46 1.67 1.78 1.72 1.97 1.73 1.64 1.77 1.75 1.87 1.91 1.88 1.60 1.71 2.49 0.36 0.31 0.29 0.30 0.26 0.30 0.32 0.29 0.30 0.27 0.27 0.27 0.33 0.31 0.18 Depth Median (phi) (mm) bsf (m) Core 56, Run 1 Depth Median (phi) (mm) bsf (m) 4.23 2.36 4.17 3.25 3.27 3.22 3.19 3.41 3.56 0.05 0.19 0.06 0.11 0.10 0.11 0.11 0.09 0.08 3.6 3.9 4.2 4.5 4.8 5.1 5.4 5.7 6.0 Core 56, Run 2 0 1000 2000 feet 7 7 9 10 13 15 15 17 17 5 7 9 9 10 11 11 13 15 17 17 19 9 9 9 10 10 11 11 11 11 11 13 13 13 13 15 15 15 15 15 17 7 7 7 9 9 10 10 11 13 15 17 17 19 7 9 9 9 11 11 13 13 13 15 17 10 464000 466000 468000 470000 472000 474000 476000 646000 648000 650000 652000 654000 Sand Volume (cu. yds.) 5-ft. minimum = 31,337,000 10-ft. minimum = 27,028,000 + + + + 35 54 53 36 58 + Sand Resource Thickness of MON-2 1.68 1.32 1.38 1.69 1.81 1.62 1.38 1.82 1.81 1.84 1.73 1.57 1.46 1.67 1.45 1.78 1.40 0.31 0.40 0.38 0.31 0.29 0.33 0.39 0.28 0.28 0.28 0.30 0.34 0.36 0.32 0.36 0.29 0.38 Depth Median (phi) (mm) bsf (m) 0.0 0.3 0.6 0.9 1.2 1.5 1.8 2.1 2.4 2.7 3.0 3.3 3.6 3.9 4.2 4.5 4.8 Core 35 1.58 1.28 1.50 1.70 1.62 1.43 1.58 1.56 1.70 1.47 4.08 1.48 1.50 1.63 1.81 0.33 0.41 0.35 0.31 0.32 0.37 0.34 0.34 0.31 0.36 0.06 0.36 0.35 0.32 0.29 Depth Median (phi) (mm) bsf (m) 0.0 0.3 0.6 0.9 1.2 1.5 1.8 2.1 2.4 2.7 3.0 3.3 3.6 3.9 4.2 Core 36, Run 1 Depth Median (phi) (mm) bsf (m) 1.85 2.01 2.00 1.86 4.19 2.92 4.18 4.23 4.23 4.23 4.14 0.28 0.25 0.25 0.27 0.05 0.13 0.06 0.05 0.05 0.05 0.06 3.6 3.9 4.2 4.5 4.8 5.1 5.4 5.7 6.0 6.3 6.6 Core 36, Run 2 1.28 1.15 1.09 1.18 1.01 1.42 1.01 1.34 1.18 1.58 1.35 1.45 1.35 1.64 2.37 1.79 1.92 1.66 2.16 0.41 0.45 0.47 0.44 0.50 0.37 0.50 0.40 0.44 0.33 0.39 0.37 0.39 0.32 0.19 0.29 0.26 0.32 0.22 Depth Median (phi) (mm) bsf (m) 0.0 0.3 0.6 0.9 1.2 1.5 1.8 2.1 2.4 2.7 3.0 3.3 3.6 3.9 4.2 4.5 4.8 5.1 5.4 Core 53 0.84 0.95 0.87 0.85 1.01 0.98 1.13 1.02 1.09 1.00 1.06 1.38 0.93 0.96 1.18 1.02 -2.88 -3.04 1.71 1.77 0.56 0.52 0.55 0.55 0.50 0.51 0.46 0.49 0.47 0.50 0.48 0.38 0.53 0.51 0.44 0.49 7.37 8.21 0.31 0.29 Depth Median (phi) (mm) bsf (m) 0.0 0.3 0.6 0.9 1.2 1.5 1.8 2.1 2.4 2.7 3.0 3.3 3.6 3.9 4.2 4.5 4.8 5.1 5.4 5.7 Core 54 0.98 1.13 1.19 1.04 1.09 1.22 1.27 1.09 1.15 1.50 1.69 1.62 2.10 -2.85 -2.64 -2.73 -1.55 -1.13 2.89 3.37 3.07 0.51 0.46 0.44 0.49 0.47 0.43 0.41 0.47 0.45 0.35 0.31 0.33 0.23 7.21 6.23 6.63 2.92 2.19 0.14 0.10 0.12 Depth Median (phi) (mm) bsf (m) 0.0 0.3 0.6 0.9 1.2 1.5 1.8 2.1 2.4 2.7 3.0 3.3 3.6 3.9 4.2 4.5 4.8 5.1 5.4 5.7 6.0 Core 58 0 1000 2000 feet INTRODUCTION The New Jersey Geological and Water Survey (NJGWS) maps the State’s offshore geology and idenfies offshore sand deposits by acquiring, analyzing and interpreng marine geologic and geophysical data. With support from its parent agency, the New Jersey Department of Environmental Protecon (NJDEP) and from the U.S. Department of Interior, Bureau of Ocean Energy Management (BOEM), NJGWS is preparing assessments of offshore sand resources for beach nourishment in a series of maps by county at a scale of 1:80,000. These maps are developed to support the cooperave sand resource assessment by NJDEP and the United States Army Corps of Engineers (USACE). This map idenfies and quanfies nearshore sand shoals offshore Monmouth County, New Jersey, located in both State and Federal waters (within and beyond the 3-mile State/ Federal jurisdiconal boundary, respecvely). The USACE had previously idenfied five borrow sites in this map area, including the large site offshore Sea Bright and a group of small sites offshore Belmar (USACE, 1989,1993), most of which are located within State waters. Sand volumes for these areas were calculated by previous USACE studies and are listed in the Map Explanaon. The State of New Jersey has accessed sand from the large site offshore Sea Bright and several of the smaller sites offshore Belmar. The goal of this survey was to find addional sand resources in the area offshore central and southern Monmouth County, including sites in Federal waters, where sites had not previously been idenfied. This map idenfies 14 addional shoal features. Sand volumes at these sites, calculated based on a 5-foot minimum thickness, range from 295,000 to 31,337,000 cubic yards (cu. yds.). Sand volumes at these sites, calculated based on a more constrained 10-foot minimum thickness, range from 53,000 to 27,028,000 cu. yds. The 1:80,000 map scale corresponds to the scale common to naucal charts. Likewise, the level of detail presented in these maps and the goal of depicng a regional view are best achieved at this scale. In addion, Plates 1 and 2 include larger-scale views of each of the 14 shoal features, along with grain-size data on vibracores acquired at each shoal to ground- truth the seismic data and for sediment characterizaon. METHODS NJGWS collected the seismic sub-boom data used in this analysis in 2000 and 2001, using an Octopus 360 Sub- Boom Processor. This grid of sub-boom profiles extends from Sea Bright to just south of Manasquan Inlet. The seismic signal was recorded in real me as an analog paper copy and also recorded on tape. Post-survey, a number of tapes were found to be defecve or incomplete. For completeness and consistency, NJGWS recently converted the analog data into digital seg-y files using ImagetoSegy TM soſtware. This allowed for the data to be processed and analyzed in SonarWiz5 TM seismic processing soſtware. A total of 61 Vibracores were collected in the map area in three acquision phases in 2000, 2001, and 2002. Analysis of these cores was completed in the sediment labs at NJGWS. For each core, lithologic and photographic logs were prepared and samples for grain-size analysis were collected and processed. A 5-cm-long quarter-round of the core was extracted at 30- cm intervals down-core and analyzed for grain-size. Sediment samples were analyzed following procedures outlined by Folk (1980). Grain size distribuon focused on sand-sized and coarser material, with weight percents of full phi sizes ranging from -2 to >4 (from gravel to silt/clay; see Table 1), cumulave curves, and the textural stascs derived from these data (median, mean, sorng, skewness, and kurtosis). Of these stascs, median grain size is listed in the core tables; the other calculated stascs are on file at NJGWS. Several cores in these tables list mulple runs. These are cores drilled at sites where the pneumac drill did not penetrate the full 20-foot depth of the core. Aſter extracng the retrieved core segment from the coring apparatus, the plaorm would be re- posioned as close as possible to the original seafloor drilling locaon. The coring device would be jeed down to the depth where resistance was hit originally, and then would collect the remaining amount of core. As a result of this process, there can be slight discrepancies in the median grain size of sediment at the same depth in different runs. Radiocarbon samples were collected and analyzed, where available. The vibracores reported in this map are archived at the NJGWS Core Storage Facility. CORRELATION OF SEISMIC DATA AND SEDIMENT ANALYSIS NJGWS correlated changes in sediment character with acousc impedance changes and major reflectors observed on the sub-boom profiles. For each of the sand shoals idenfied on this map, cores were used to locate which reflector represented the base of sand. That reflector was traced for the enrety of the shoal, or for as long as the data clarity would allow (Figure 1). INCORPORATING PREVIOUS ANALYSIS INTO CURRENT, STANDARDIZED SHOAL ASSESSMENT PROTOCOL Previously, we performed inial analysis of the shoal areas offshore Monmouth County by transferring the data from analog seismic records into digital files using the Didger TM and Surfer TM imaging and contouring soſtware. This inial analysis targeted shoal areas where the sand thickness was in excess of 10 feet. In this analysis, two sand volumes are computed for each shoal: 1) areas with a 5-foot minimum thickness of sand; and 2) areas with a 10-foot minimum thickness of sand. On the 14 large-scale sand thickness plots, the 5-foot minimum thickness is the praccal boundary of the contour plots, and the 10-foot minimum thickness contours are indicated with a solid black line. On each geo-referenced and depth- referenced sub-boom profile, NJGWS delineated the base of sand, correlated to the vibracore lithology, to generate sand thickness data for all profiles that cross the feature. These data were then contoured in Surfer TM to further delimit the shoal and to calculate sand volumes. NJGWS determined that it is most praccal to trace the reflector interpreted as the base of the sand deposit across its full extent (Figure 1). This method provides addional data in the contouring analysis, resulng in a more complete and realisc representaon of the shoal. In calculang sand volume, the minimum thickness was selected and all areas of less than this thickness are excluded. The resulng sand volumes for the area of 5-foot minimum thickness and the area of 10-foot minimum thickness are listed in the map explanaon and on each sand thickness contour plot. Sand thickness contour plots of each shoal feature are shown on Plates 1 and 2, with accompanying median grain- size values (in mm and phi) for sediment samples collected at 30-cm (approximately 1 ſt) intervals from a 6-meter (20-foot) long vibracore. This high-frequency sampling increases the accuracy for determining the base-of-sand on the sub-boom profiles. 1 New Jersey Geological and Water Survey 2 Previously of New Jersey Geological and Water Survey 3 Rered, New Jersey Geological and Water Survey 4 Office of Energy and Sustainablity, New Jersey Department of Environmental Protecon Use of brand, commercial, or trade names is for idenficaon purposes only and does not constute endorsement by the New Jersey Geologi- cal and Water Survey. ACKNOWLEDGEMENTS The New Jersey Department of Environmental Protecon’s Office of Engineering and Construcon provided funding for all parts of this project, including seismic acquision, core acquision and processing, and data analysis. The Bureau of Offshore Energy Management, United States Department of Interior, through Cooperave Agreement No. M14AC00002 (2014), funded the compilaon and publicaon of this map. The Minerals Management Service, United States Department of Interior, Agreement No. 14-35-0001-30751 and No. 1435-01- 02-CA-85191 provided funding for the data acquision and inial analysis. Kimberly Bishop, Michael Schumacher, Laurie Whitesell, and Ma Wojtko parcipated (with the authors) in seismic data acquision and core processing/analysis during 2000 and 2001. Dr. Robert E. Sheridan (Rutgers University) advised the team on seismic acquision and stragraphic analysis of the resource area. In addion, Dr. Sheridan provided a very helpful and informed review of the map as part of the Geologic Map Series review protocol. Zehdreh Allen-Lafayee, Cartographer/GIS Specialist created the base map and incorporated the sand volume data into a NJGWS standard-format GIS map at 1:80,000 scale. 1 8 3 5 N E W J E R S E Y G E O L O G I C A L A N D W A T E R S U R V E Y P E D J N DEPARTMENT OF ENVIRONMENTAL PROTECTION WATER RESOURCES MANAGEMENT NEW JERSEY GEOLOGICAL AND WATER SURVEY SIGNIFICANT SAND RESOURCE AREAS IN STATE AND FEDERAL WATERS OFFSHORE MONMOUTH COUNTY, NEW JERSEY GEOLOGIC MAP SERIES GMS 15-3 Plate 1 of 2
Transcript of INTRODUCTION Sand Resource Thickness of MON-1 · SAND RESOURCE THICKNESS PLOTS9810 27 25 23 21 19...

EXPLANATION FORSAND RESOURCE THICKNESS PLOTS
27
25
23
21
19
17
15
13
11
9
7
5S
AN
D R
ES
OU
RC
E T
HIC
KN
ES
S(in
feet
)
Core depth is below sea floor (bsf).
Sand resource thickness plot coordinates in New Jersey State Plane Feet.
Thickness less than 5 feet not shown.
10 10 foot thickness intervals
Core location45+17 2 foot thickness
intervals
MAP SYMBOLS
SIGNIFICANT SAND RESOURCE AREAS IN STATE AND FEDERAL WATERSOFFSHORE MONMOUTH COUNTY, NEW JERSEY
Michael V. Castelli1, Daniel Latini2, Jane Uptegrove1, Jeffrey S. Waldner3,David W. Hall3, Andrea L. Friedman4
by
2015
-40
-100 -110
-120
-130
-170
-140
-150
-160
-160-150
-180
-190
-100
-100
-110
-120
-130
-110
-100
-100
-140
-150
-10
-20
-30
-40
-30
-10
-20
-30
-20
-10
-20
-40
-30
-90
-80
-90
-90
-80
-80 -90
-70
-70
-70
-70
-70
-70
-70
-50-60
-60-50
-60
-50
-60
-50
PointPleasantBeach
SeaGirt
Belmar
Asbury Park
MonmouthBeach
Middletown
Rumson
Sea Bright
SandyHook
Long Branch
WestLong
Branch
Oceanport
OceanDeal
Neptune
NeptuneCity
BradleyBeach
Avon-by-the-Sea
Wall
SpringLake
Heights
SpringLake
Manasquan
Lake Como
Interlaken
Allenhurst
Loch Arbour
Eatontown
Little Silver
AtlanticHighlands
Highlands
Fair Haven
Navesink River
River
Shark River
Raritan Bay
Twel
ve-m
ile li
mit
Thre
e-m
ile li
mit
Three-mile lim
it
Shrew
sbur
y
Atlantic OceanManasquan Inlet
84
43
82
85
70
69
42
65
7172
40
64
81
83
80
7330
86
29
63
394544
62
6847
4632
79
52
6633
49
48
31
37
34 606159
505157
67
35
5453
36
56
58
38
55
77
74
9630
9620
9600
1220
1260
1420
1230
1300
9610
9670
1310
1210
1240
9580
1250
1300
9610
9670
9490
1290
9640
12809480
1270
12601240
1250
1200
1190
9470
9471
9460
9450
1220
1210
10101020
9520
952195
80
1290
9640
9420
1280
1270
9521
9500
9650
1200
9590
1190
1230
95305910
9490
9480
9550
1410
1070
9540
9630
1030
9620
9600
1400
95601100
1430
9570
9470
9471
9606
1180
9460
9680
9450
9690
1170
1090
1160
1140
9570
981094
30
9820
9560
1120
1430 1100
1090
1080
1070
1060
1050
1110
1130
1400
9550 1410
1120
10401030
9540
9510
9530
9650
1020
1010
104010501060
11409500
9520
96601170
1160
1180
9440
9430
1150
5231
5221
9420
1310
1150
9590
1340
1350
1360
1370
1380
1390
9420
9420
MON-14
MON-13MON-12
MON-11
MON-9
MON-7
MON-6
MON-5
MON-2
MON-3
MON-4
MON-10
MON-1
MON-8
SB-1
BA-6
BA-5
BA-4BA-2,
BA-3
bathymetric contour interval = 10 ft.
scale 1:80000
0 1 2 kilometers
0 1 2 nautical miles
N
EXPLANATION
87
468
NJGWS-delimited sand resource area
Three-mile limit
USACE/NJDEP-designated borrow area
Twelve-mile limit
NJGWS seismic trackline
NJGWS vibracore
Volume of Monmouth County Offshore Sand Resource Areas calculated at both a 5-ft and 10-ft minimum sand thickness in cubic yards (cu. yds.).
MON-1MON-2MON-3MON-4MON-5MON-6MON-7MON-8MON-9MON-10MON-11MON-12MON-13MON-14
MONMOUTHCOUNTY
RESOURCENAME
VOLUME 5 ft minimum
Thickness(cu. yds.)
VOLUME 10 ft minimum
Thickness(cu. yds.)
18,508,000 31,337,000 4,643,000
21,788,000 6,534,000
25,282,000 20,975,000 12,814,000 3,318,000 2,605,000 4,163,000 2,651,000 2,502,000
295,000
10,938,000 27,028,000 3,219,000
17,928,000 4,293,000
20,255,000 17,178,000 6,441,000 2,233,000 1,931,000
949,000 990,000 354,000 53,000
BORROWNAMESB-1
BA-6BA-5BA-4BA-3BA-2
NAME
Belmar #6Belmar #5Belmar #4Belmar #3Belmar #2
Sea Bright-1989 54,500,000
VOLUME(cu. yds.)
2,190,0002,900,0001,500,0001,010,0001,480,000
Sand volumes of USACE-designated borrow areas (USACE, 1989, 1993).
27
25
23
21
19
17
15
13
11
9
7
5
SA
ND
RE
SO
UR
CE
TH
ICK
NE
SS
(in
feet
)
SE
AFL
OO
R E
LEVA
TIO
N (f
eet b
elow
sea
leve
l) -10-20-30-40-50-60-70-80-90-100-110-120-130-140-150-160-170-180-190-200-210-220
MONMOUTH COUNTY
Area of Detail
Middlesex
Mercer
Ocean
74o00’00” 73o52’30” 73o45’00”
74o00’00” 73o52’30” 73o45’00”
40o07’30’’
40o15’00’’
40o22’30’’
40o07’30’’
40o15’00’’
40o22’30’’
Figure 1. Speed over ground at 3.5 knots; time/location stamps at 2-minute intervals = approximately 700 ft.
Sand thickness above prominentseismic reflector shown in green.
sandinterbedded fines
Core 55
Seismic Line 9440SW
NE
Two-
way
trav
el ti
me
(TW
TT) i
n m
illis
econ
ds
7.5/
15.0/
24.6
49.2
19.9/
28.7/
37.5/
46.2/
55.0/
63.7/
72.5/
81.2/
65.3
94.1
123.0
151.5
180.4
208.9
237.8
266.3
meters/feet
Depth in m
eters and feet, based onthe acoustic velocity in w
ater = 1500 meters/second, and
an estimated acoustic velocity in these sedim
ents of 750 meters/second
Seafloor
Prominent seismic reflector at acoustic imped-ance contrast between sand and underlying interbedded silts, sand and clay.
Table 1. Unit conversions of sediment sizes differentiated in this study (modified from Wentworth, 1922).
-3
-2
-1
0
1
2
3
4
5
4
3
2
1
0.50.4
0.3
0.2
0.1
8.006.735.664.7644.003.362.832.382.001.631.411.191.000.8400.7070.5450.5000.4200.3540.2970.2500.2100.1770.1490.1250.1050.0880.074
0.32”
0.16”
0.08”
1
1/2
1/4
1/8
1/16
456781012141620253035404550607080100120140170200230
5/160.265
fine
veryfine
verycoarse
coarse
medium
fine
veryfine
PHI - mmCONVERSION
Φ = log 2(d in mm)
mmΦ
Frac
tiona
l mm
and
Dec
imal
inch
es
SIZE TERMS(after Wentworth,
1922)
UndifferentiatedPebbles, Cobbles
and Boulders
SIEVESIZES
AST
M N
o.(U
.S. S
tand
ard)
Pebb
les
Sand
Granules
UndifferentiatedClay and Silt
inches
mm
Sand Resource Thickness of MON-1
464000
465000
466000
467000
468000
469000
470000
471000
472000
473000
638000 639000 640000 641000 642000 643000 644000 645000 646000 647000 648000
5
5
7
7
9
9 9
99
99
10
10
10
10
1010
11
11
1111
11
11
11
13
15
79
10
1011
1315
17
19
7
7
7
79
9
9
9
10
10
10
1011
11
11
11
13
1313
15
9
79
1011
17
Sand Volume (cu. yds.) 5-ft. min = 18,508,00010-ft. min = 10,938,000
11
+
+
56
38
55
+
NJGWS reports grain-size median values by depth in core runs, as recorded in the driller’s log. In some cases, core depths on different runs may not exactly coincide. Due to this possibility, there may be discrepancies in grain size median values at specific depths on different drilling runs.
Depth Median(phi) (mm)bsf (m)1.461.671.781.721.971.731.641.771.751.871.911.884.232.364.173.253.273.223.193.413.56
0.360.310.290.300.260.300.320.290.300.270.270.270.050.190.060.110.100.110.110.090.08
0.00.30.60.91.21.51.82.12.42.73.03.33.63.94.24.54.85.15.45.76.0
Core 55
1.331.391.371.611.461.551.061.391.571.481.071.351.401.232.062.202.322.43-2.62
0.400.380.390.330.360.340.480.380.340.360.470.390.380.430.240.220.200.196.14
Depth Median(phi) (mm)bsf (m)
0.00.30.60.91.21.51.82.12.42.73.03.33.63.94.24.54.85.15.4
Core 38, Run 1Depth Median
(phi) (mm)bsf (m)1.852.012.001.864.192.924.184.234.234.234.14
0.280.250.250.270.050.130.060.050.050.050.06
3.63.94.24.54.85.15.45.76.06.36.6
Core 36, Run 2
0.00.30.60.91.21.51.82.12.42.73.03.33.63.94.2
1.461.671.781.721.971.731.641.771.751.871.911.881.601.712.49
0.360.310.290.300.260.300.320.290.300.270.270.270.330.310.18
Depth Median(phi) (mm)bsf (m)
Core 56, Run 1Depth Median
(phi) (mm)bsf (m)4.232.364.173.253.273.223.193.413.56
0.050.190.060.110.100.110.110.090.08
3.63.94.24.54.85.15.45.76.0
Core 56, Run 2
0 1000 2000
feet
77
9
10 13 15
15 17
17
5 7
9
910
11
1113
15
17
17
19
9
9
9
10
10
11
11
11
11
1113
13
13
13
15
15
15
15
15
17
7
7
7 9
9
10
1011
13
15
17
1719
7
9
99
11
11
13
13
13
1517
10
464000
466000
468000
470000
472000
474000
476000
646000 648000 650000 652000 654000
Sand Volume (cu. yds.) 5-ft. minimum = 31,337,00010-ft. minimum = 27,028,000
+
+
+
+
35
54
53
36
58
+
Sand Resource Thickness of MON-2
1.681.321.381.691.811.621.381.821.811.841.731.571.461.671.451.781.40
0.310.400.380.310.290.330.390.280.280.280.300.340.360.320.360.290.38
Depth Median(phi) (mm)bsf (m)
0.00.30.60.91.21.51.82.12.42.73.03.33.63.94.24.54.8
Core 35
1.581.281.501.701.621.431.581.561.701.474.081.481.501.631.81
0.330.410.350.310.320.370.340.340.310.360.060.360.350.320.29
Depth Median(phi) (mm)bsf (m)
0.00.30.60.91.21.51.82.12.42.73.03.33.63.94.2
Core 36, Run 1Depth Median
(phi) (mm)bsf (m)1.852.012.001.864.192.924.184.234.234.234.14
0.280.250.250.270.050.130.060.050.050.050.06
3.63.94.24.54.85.15.45.76.06.36.6
Core 36, Run 2
1.281.151.091.181.011.421.011.341.181.581.351.451.351.642.371.791.921.662.16
0.410.450.470.440.500.370.500.400.440.330.390.370.390.320.190.290.260.320.22
Depth Median(phi) (mm)bsf (m)
0.00.30.60.91.21.51.82.12.42.73.03.33.63.94.24.54.85.15.4
Core 530.840.950.870.851.010.981.131.021.091.001.061.380.930.961.181.02-2.88-3.041.711.77
0.560.520.550.550.500.510.460.490.470.500.480.380.530.510.440.497.378.210.310.29
Depth Median(phi) (mm)bsf (m)
0.00.30.60.91.21.51.82.12.42.73.03.33.63.94.24.54.85.15.45.7
Core 540.981.131.191.041.091.221.271.091.151.501.691.622.10-2.85-2.64-2.73-1.55-1.132.893.373.07
0.510.460.440.490.470.430.410.470.450.350.310.330.237.216.236.632.922.190.140.100.12
Depth Median(phi) (mm)bsf (m)
0.00.30.60.91.21.51.82.12.42.73.03.33.63.94.24.54.85.15.45.76.0
Core 58
0 1000 2000
feet
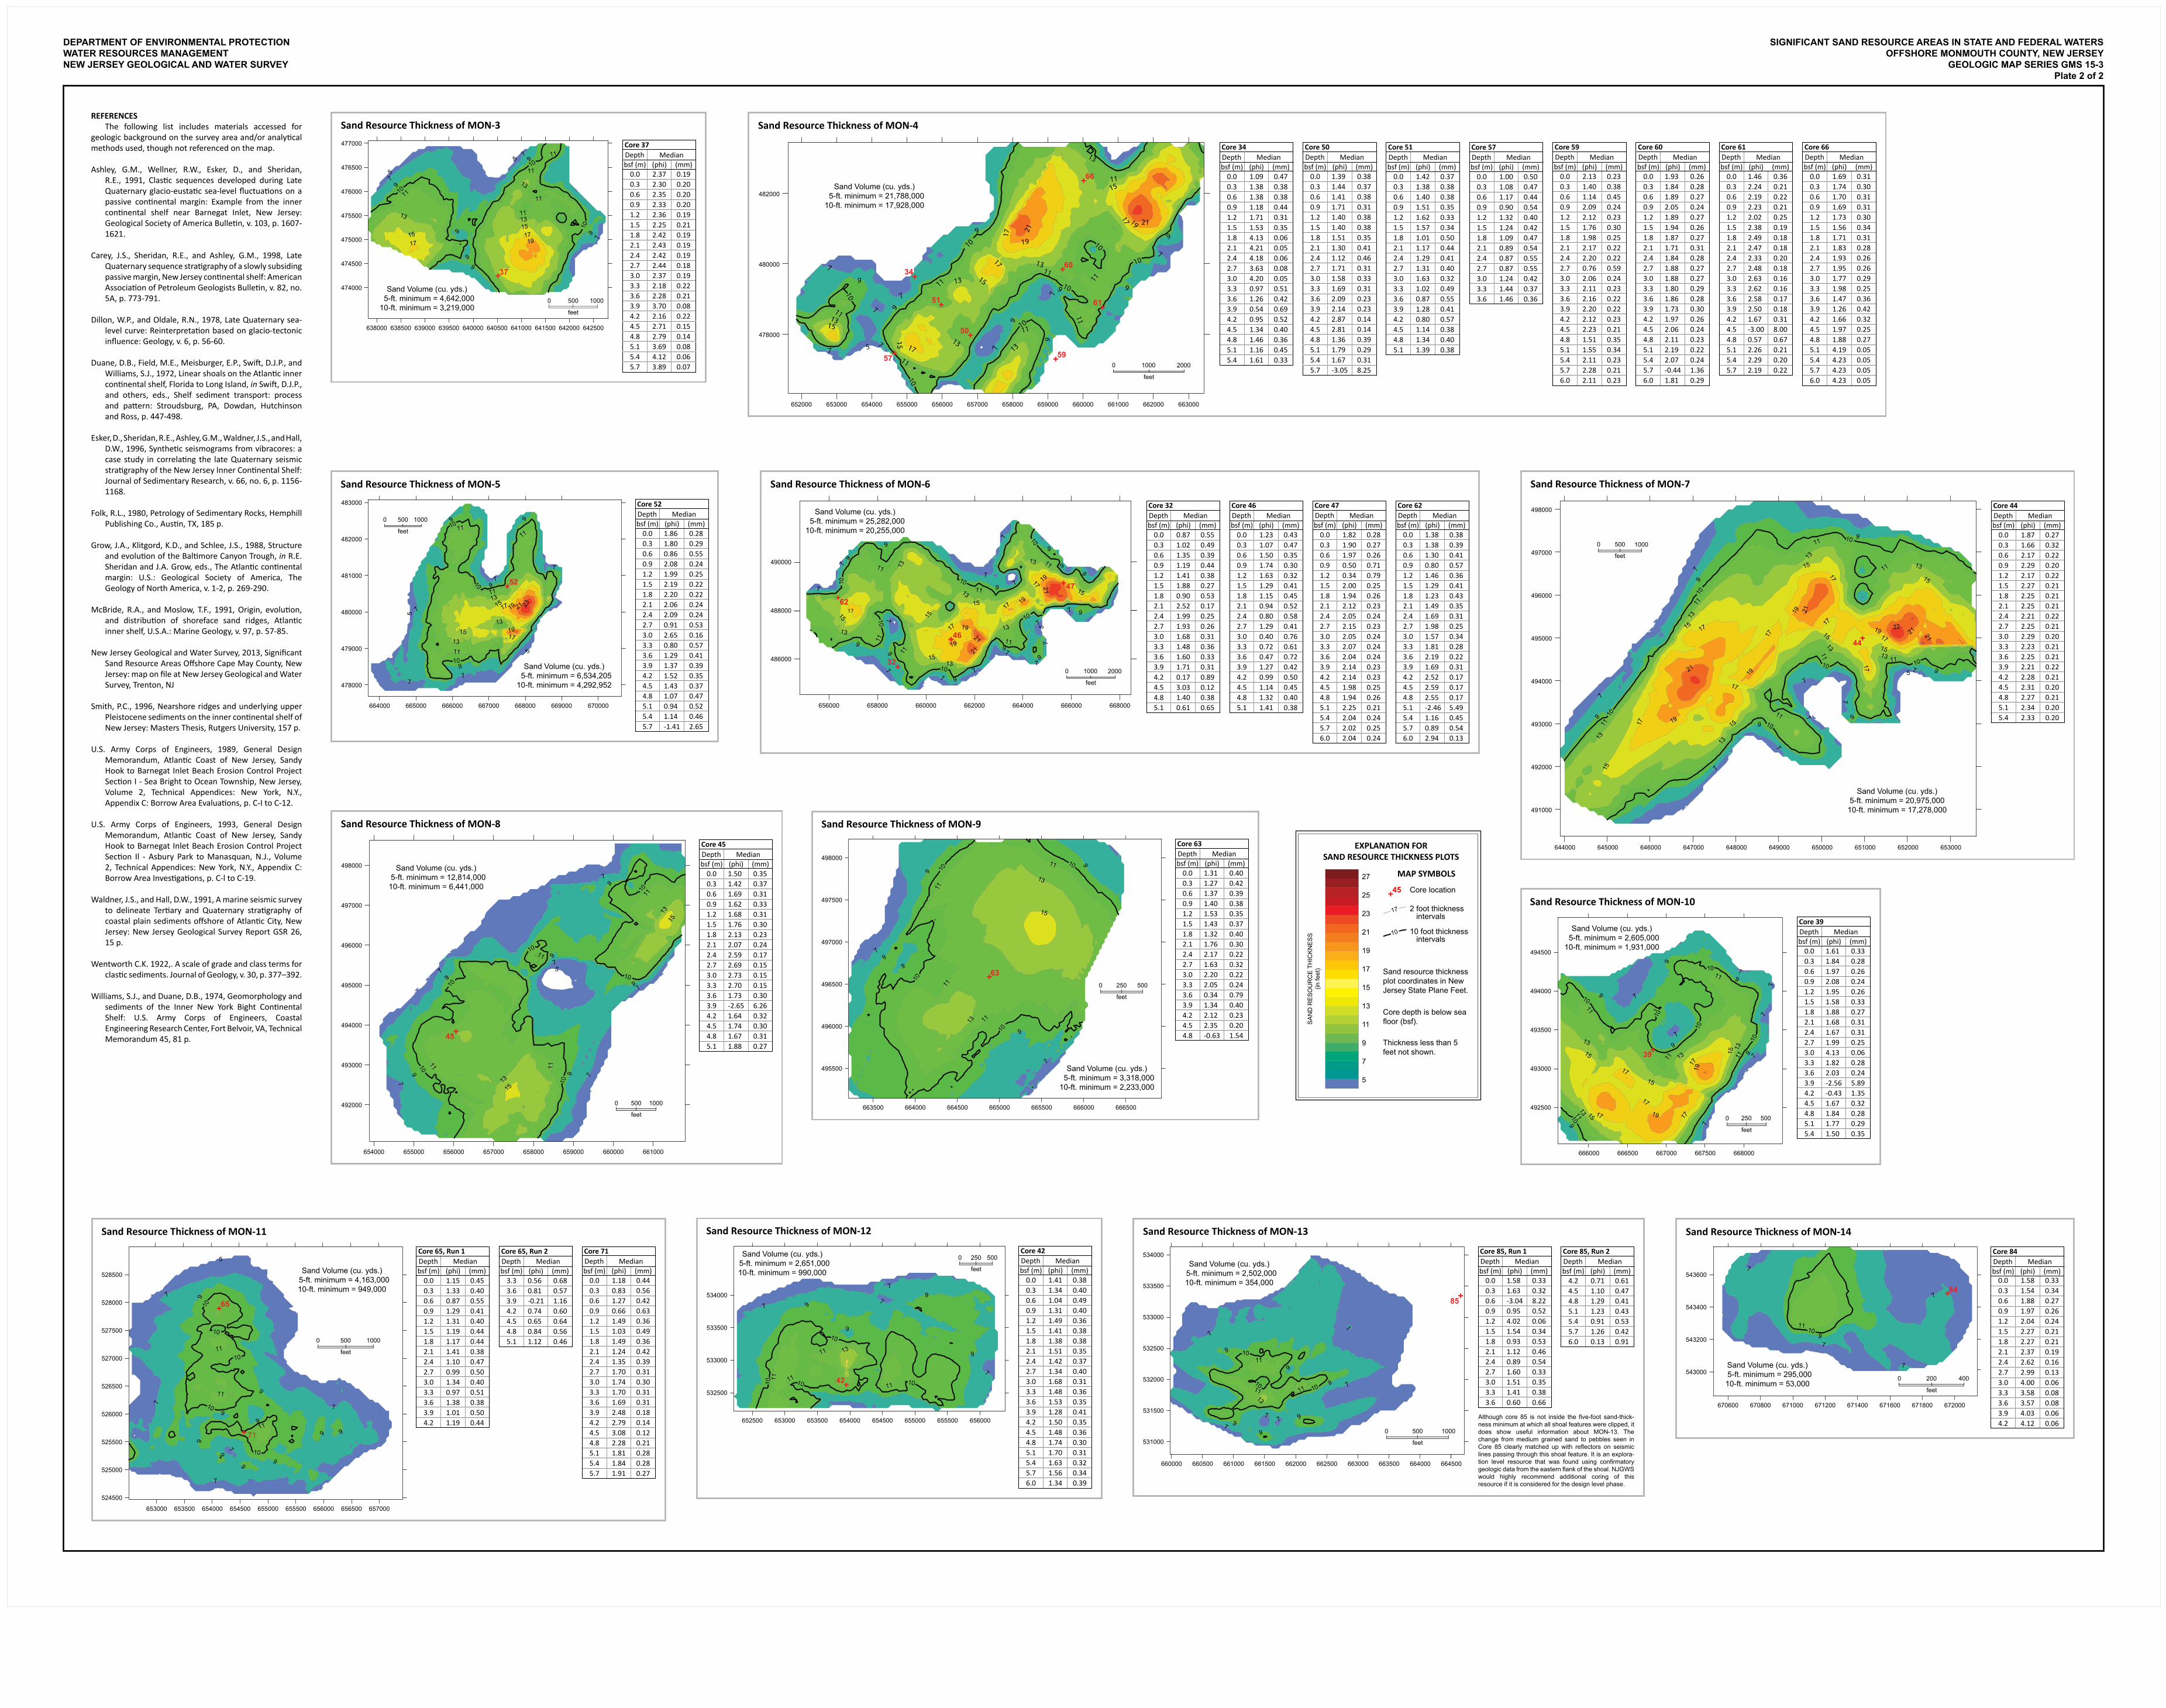
INTRODUCTION The New Jersey Geological and Water Survey (NJGWS) maps the State’s offshore geology and identifies offshore sand deposits by acquiring, analyzing and interpreting marine geologic and geophysical data. With support from its parent agency, the New Jersey Department of Environmental Protection (NJDEP) and from the U.S. Department of Interior, Bureau of Ocean Energy Management (BOEM), NJGWS is preparing assessments of offshore sand resources for beach nourishment in a series of maps by county at a scale of 1:80,000. These maps are developed to support the cooperative sand resource assessment by NJDEP and the United States Army Corps of Engineers (USACE). This map identifies and quantifies nearshore sand shoals offshore Monmouth County, New Jersey, located in both State and Federal waters (within and beyond the 3-mile State/Federal jurisdictional boundary, respectively). The USACE had previously identified five borrow sites in this map area, including the large site offshore Sea Bright and a group of small sites offshore Belmar (USACE, 1989,1993), most of which are located within State waters. Sand volumes for these areas were calculated by previous USACE studies and are listed in the Map Explanation. The State of New Jersey has accessed sand from the large site offshore Sea Bright and several of the smaller sites offshore Belmar. The goal of this survey was to find additional sand resources in the area offshore central and southern Monmouth County, including sites in Federal waters, where sites had not previously been identified. This map identifies 14 additional shoal features. Sand volumes at these sites, calculated based on a 5-foot minimum thickness, range from 295,000 to 31,337,000 cubic yards (cu. yds.). Sand volumes at these sites, calculated based on a more constrained 10-foot minimum thickness, range from 53,000 to 27,028,000 cu. yds. The 1:80,000 map scale corresponds to the scale common to nautical charts. Likewise, the level of detail presented in these maps and the goal of depicting a regional view are best achieved at this scale. In addition, Plates 1 and 2 include larger-scale views of each of the 14 shoal features, along with grain-size data on vibracores acquired at each shoal to ground-truth the seismic data and for sediment characterization.
METHODS NJGWS collected the seismic sub-bottom data used in this analysis in 2000 and 2001, using an Octopus 360 Sub-Bottom Processor. This grid of sub-bottom profiles extends from Sea Bright to just south of Manasquan Inlet. The seismic signal was recorded in real time as an analog paper copy and also recorded on tape. Post-survey, a number of tapes were found to be defective or incomplete. For completeness and consistency, NJGWS recently converted the analog data into digital seg-y files using ImagetoSegyTM software. This allowed for the data to be processed and analyzed in SonarWiz5TM seismic processing software. A total of 61 Vibracores were collected in the map area in three acquisition phases in 2000, 2001, and 2002. Analysis of these cores was completed in the sediment labs at NJGWS. For each core, lithologic and photographic logs were prepared and samples for grain-size analysis were collected and processed. A 5-cm-long quarter-round of the core was extracted at 30-cm intervals down-core and analyzed for grain-size. Sediment samples were analyzed following procedures outlined by Folk (1980). Grain size distribution focused on sand-sized and coarser material, with weight percents of full phi sizes ranging from -2 to >4 (from gravel to silt/clay; see Table 1), cumulative curves, and the textural statistics derived from these data (median, mean, sorting, skewness, and kurtosis). Of these statistics, median grain size is listed in the core tables; the other calculated statistics are on file at NJGWS. Several cores in these tables list multiple runs. These are cores drilled at sites where the pneumatic drill did not penetrate the full 20-foot depth of the core. After extracting the retrieved core segment from the coring apparatus, the platform would be re-positioned as close as possible to the original seafloor drilling location. The coring device would be jetted down to the depth where resistance was hit originally, and then would collect the remaining amount of core. As a result of this process, there can be slight discrepancies in the median grain size of sediment at the same depth in different runs. Radiocarbon samples were collected and analyzed, where available. The vibracores reported in this map are archived at the NJGWS Core Storage Facility.
CORRELATION OF SEISMIC DATA AND SEDIMENT ANALYSIS NJGWS correlated changes in sediment character with acoustic impedance changes and major reflectors observed on the sub-bottom profiles. For each of the sand shoals identified on this map, cores were used to locate which reflector represented the base of sand. That reflector was traced for the entirety of the shoal, or for as long as the data clarity would allow (Figure 1).
INCORPORATING PREVIOUS ANALYSIS INTO CURRENT, STANDARDIZED SHOAL ASSESSMENT PROTOCOL Previously, we performed initial analysis of the shoal areas offshore Monmouth County by transferring the data from analog seismic records into digital files using the DidgerTM and SurferTM imaging and contouring software. This initial analysis targeted shoal areas where the sand thickness was in excess of 10 feet. In this analysis, two sand volumes are computed for each shoal: 1) areas with a 5-foot minimum thickness of sand; and 2) areas with a 10-foot minimum thickness of sand. On the 14 large-scale sand thickness plots, the 5-foot minimum thickness is the practical boundary of the contour plots, and the 10-foot minimum thickness contours are indicated with a solid black line. On each geo-referenced and depth-referenced sub-bottom profile, NJGWS delineated the base of sand, correlated to the vibracore lithology, to generate sand thickness data for all profiles that cross the feature. These data were then contoured in SurferTM to further delimit the shoal and to calculate sand volumes. NJGWS determined that it is most practical to trace the reflector interpreted as the base of the sand deposit across its full extent (Figure 1). This method provides additional data in the contouring analysis, resulting in a more complete and realistic representation of the shoal. In calculating sand volume, the minimum thickness was selected and all areas of less than this thickness are excluded. The resulting sand volumes for the area of 5-foot minimum thickness and the area of 10-foot minimum thickness are listed in the map explanation and on each sand thickness contour plot. Sand thickness contour plots of each shoal feature are shown on Plates 1 and 2, with accompanying median grain-size values (in mm and phi) for sediment samples collected at 30-cm (approximately 1 ft) intervals from a 6-meter (20-foot) long vibracore. This high-frequency sampling increases the accuracy for determining the base-of-sand on the sub-bottom profiles.
1 New Jersey Geological and Water Survey2 Previously of New Jersey Geological and Water Survey3 Retired, New Jersey Geological and Water Survey4 Office of Energy and Sustainablity, New Jersey Department of Environmental Protection
Use of brand, commercial, or trade names is for identification purposes only and does not constitute endorsement by the New Jersey Geologi-cal and Water Survey.
ACKNOWLEDGEMENTS The New Jersey Department of Environmental Protection’s Office of Engineering and Construction provided funding for all parts of this project, including seismic acquisition, core acquisition and processing, and data analysis. The Bureau of Offshore Energy Management, United States Department of Interior, through Cooperative Agreement No. M14AC00002 (2014), funded the compilation and publication of this map. The Minerals Management Service, United States Department of Interior, Agreement No. 14-35-0001-30751 and No. 1435-01-02-CA-85191 provided funding for the data acquisition and initial analysis. Kimberly Bishop, Michael Schumacher, Laurie Whitesell, and Matt Wojtko participated (with the authors) in seismic data acquisition and core processing/analysis during 2000 and 2001. Dr. Robert E. Sheridan (Rutgers University) advised the team on seismic acquisition and stratigraphic analysis of the resource area. In addition, Dr. Sheridan provided a very helpful and informed review of the map as part of the Geologic Map Series review protocol. Zehdreh Allen-Lafayette, Cartographer/GIS Specialist created the base map and incorporated the sand volume data into a NJGWS standard-format GIS map at 1:80,000 scale.
1835
NEW
JER
SEY
GEOLOGICAL AND W
ATER SURVEY
PEDJN
DEPARTMENT OF ENVIRONMENTAL PROTECTIONWATER RESOURCES MANAGEMENTNEW JERSEY GEOLOGICAL AND WATER SURVEY
SIGNIFICANT SAND RESOURCE AREAS IN STATE AND FEDERAL WATERSOFFSHORE MONMOUTH COUNTY, NEW JERSEY
GEOLOGIC MAP SERIES GMS 15-3Plate 1 of 2
EXPLANATION FORSAND RESOURCE THICKNESS PLOTS
27
25
23
21
19
17
15
13
11
9
7
5
SA
ND
RE
SO
UR
CE
TH
ICK
NE
SS
(in fe
et)
Core depth is below sea floor (bsf).
Sand resource thickness plot coordinates in New Jersey State Plane Feet.
Thickness less than 5 feet not shown.
10 10 foot thickness intervals
Core location45+17 2 foot thickness
intervals
MAP SYMBOLS
644000 645000 646000 647000 648000 649000 650000 651000 652000 653000
491000
492000
493000
494000
495000
496000
497000
498000
Sand Resource Thickness of MON-7
7
7
9
9
10
10
11
11
13
13
15
15
17
17
19
7
7
7
7
11
13
15
17
1921
9 10
11
13
15
17
19 21
7
9
9
10
10
1113
15
17
17
17
5 7 910
11 13
15
19
1113
17
2121
15
22
+44
Sand Volume (cu. yds.)5-ft. minimum = 20,975,000
10-ft. minimum = 17,278,000
1.871.662.172.292.172.272.252.252.212.252.292.232.252.212.282.312.272.342.33
0.270.320.220.200.220.210.210.210.220.210.200.210.210.220.210.200.210.200.20
Depth Median(phi) (mm)bsf (m)
0.00.30.60.91.21.51.82.12.42.73.03.33.63.94.24.54.85.15.4
Core 44
0 500 1000
feet
654000 655000 656000 657000 658000 659000 660000 661000
492000
493000
494000
495000
496000
497000
498000
Sand Resource Thickness of MON-8
7
9 910
11
13
7
9
10
11
5
7
7
79
7
1011
13
9
Sand Volume (cu. yds.) 5-ft. minimum = 12,814,00010-ft. minimum = 6,441,000
15
15
11 9
10
10
45+
10
1.501.421.691.621.681.762.132.072.592.692.732.701.73-2.651.641.741.671.88
0.350.370.310.330.310.300.230.240.170.150.150.150.306.260.320.300.310.27
Depth Median(phi) (mm)bsf (m)
0.00.30.60.91.21.51.82.12.42.73.03.33.63.94.24.54.85.1
Core 45
0 500 1000
feet
495500
496000
496500
497000
497500
498000
Sand Resource Thickness of MON-9
9
9
1011
11
13
15
7
7
9
99
10
10
10
11
11
13
Sand Volume (cu. yds.) 5-ft. minimum = 3,318,00010-ft. minimum = 2,233,000
663500 664000 664500 665000 665500 666000 666500
63+
1.311.271.371.401.531.431.321.762.171.632.202.050.341.342.122.35-0.63
0.400.420.390.380.350.370.400.300.220.320.220.240.790.400.230.201.54
Depth Median(phi) (mm)bsf (m)
0.00.30.60.91.21.51.82.12.42.73.03.33.63.94.24.54.8
Core 63
feet
0 250 500
652500 653000 653500 654000 654500 655000 655500 656000
532500
533000
533500
534000
Sand Resource Thickness of MON-12
7
77
7
9
9
9
910
10 10
11 11
11 13
1011
Sand Volume (cu. yds.) 5-ft. minimum = 2,651,00010-ft. minimum = 990,000
+42
1.411.341.041.311.491.411.381.511.421.341.681.481.531.281.501.481.741.701.631.561.34
0.380.400.490.400.360.380.380.350.370.400.310.360.350.410.350.360.300.310.320.340.39
Depth Median(phi) (mm)bsf (m)
0.00.30.60.91.21.51.82.12.42.73.03.33.63.94.24.54.85.15.45.76.0
Core 420 250 500
feet
Sand Resource Thickness of MON-5
478000
479000
480000
481000
482000
483000
5
7
7
9
910
10
11
11
11
13
13
1517
19
7
17
19 21 23
5
7
7
9
910
11
15
Sand Volume (cu. yds.) 5-ft. minimum = 6,534,20510-ft. minimum = 4,292,952
13
+52
664000 665000 666000 667000 668000 669000 670000
1.861.800.862.081.992.192.202.062.090.912.650.801.291.371.521.431.070.941.14-1.41
0.280.290.550.240.250.220.220.240.240.530.160.570.410.390.350.370.470.520.462.65
Depth Median(phi) (mm)bsf (m)
0.00.30.60.91.21.51.82.12.42.73.03.33.63.94.24.54.85.15.45.7
Core 52
0 500 1000
feet
666000 666500 667000 667500 668000
492500
493000
493500
494000
494500
Sand Resource Thickness of MON-10
7
7
7
7
7
7
9
9
9
10
10
11
11
1113
1315
1719
910
10
10
11
1315
15
17
17
9
7
13 15 17 1719119
Sand Volume (cu. yds.) 5-ft. minimum = 2,605,00010-ft. minimum = 1,931,000
10
39+
1.611.841.972.081.951.581.881.681.671.994.131.822.03-2.56-0.431.671.841.771.50
0.330.280.260.240.260.330.270.310.310.250.060.280.245.891.350.320.280.290.35
Depth Median(phi) (mm)bsf (m)
0.00.30.60.91.21.51.82.12.42.73.03.33.63.94.24.54.85.15.4
Core 39
0 250 500
feet
524500
525000
525500
526000
526500
527000
527500
528000
528500
Sand Resource Thickness of MON-11
653000 653500 654000 654500 655000 655500 656000 656500 657000
5
7
7
7
7
99
9
910
10
10
10
11
7
9
9
9
9
10
11
11
9
9
Sand Volume (cu. yds.) 5-ft. minimum = 4,163,00010-ft. minimum = 949,000
+
65
71
+
1.151.330.871.291.311.191.171.411.100.991.340.971.381.011.19
0.450.400.550.410.400.440.440.380.470.500.400.510.380.500.44
Depth Median(phi) (mm)bsf (m)
0.00.30.60.91.21.51.82.12.42.73.03.33.63.94.2
Core 65, Run 1Depth Median
(phi) (mm)bsf (m)0.560.81-0.210.740.650.841.12
0.680.571.160.600.640.560.46
3.33.63.94.24.54.85.1
Core 65, Run 2
1.180.831.270.661.491.031.491.241.351.701.741.701.692.482.793.082.281.811.841.91
0.440.560.420.630.360.490.360.420.390.310.300.310.310.180.140.120.210.280.280.27
Depth Median(phi) (mm)bsf (m)
0.00.30.60.91.21.51.82.12.42.73.03.33.63.94.24.54.85.15.45.7
Core 71
0 500 1000
feet
Sand Resource Thickness of MON-4
652000 653000 654000 655000 656000 657000 658000 659000 660000 661000 662000 663000
478000
480000
482000
577
7
7
7
7
7
9
10
11 11
13
13
13
13
15
15
17
9
9 10
10
10
11
1113
15
17
17
19
21
11
9
11
10
9
11109
7
9
9
10
17 19 21
11
13
15Sand Volume (cu. yds.) 5-ft. minimum = 21,788,00010-ft. minimum = 17,928,000
+
+
+
+
+
+
+
+
50
51
59
60
61
66
57
34
1.091.381.381.181.711.534.134.214.183.634.200.971.260.540.951.341.461.161.61
0.470.380.380.440.310.350.060.050.060.080.050.510.420.690.520.400.360.450.33
Depth Median(phi) (mm)bsf (m)
0.00.30.60.91.21.51.82.12.42.73.03.33.63.94.24.54.85.15.4
Core 34
1.391.441.411.711.401.401.511.301.121.711.581.692.092.142.872.811.361.791.67-3.05
0.380.370.380.310.380.380.350.410.460.310.330.310.230.230.140.140.390.290.318.25
Depth Median(phi) (mm)bsf (m)
0.00.30.60.91.21.51.82.12.42.73.03.33.63.94.24.54.85.15.45.7
Core 50
1.421.381.401.511.621.571.011.171.291.311.631.020.871.280.801.141.341.39
0.370.380.380.350.330.340.500.440.410.400.320.490.550.410.570.380.400.38
Depth Median(phi) (mm)bsf (m)
0.00.30.60.91.21.51.82.12.42.73.03.33.63.94.24.54.85.1
Core 51
0.00.30.60.91.21.51.82.12.42.73.03.33.6
1.001.081.170.901.321.241.090.890.870.871.241.441.46
0.500.470.440.540.400.420.470.540.550.550.420.370.36
Core 57Depth Median
(phi) (mm)bsf (m)2.131.401.142.092.121.761.982.172.200.762.062.112.162.202.122.231.511.552.112.282.11
0.230.380.450.240.230.300.250.220.220.590.240.230.220.220.230.210.350.340.230.210.23
Depth Median(phi) (mm)bsf (m)
0.00.30.60.91.21.51.82.12.42.73.03.33.63.94.24.54.85.15.45.76.0
Core 59
1.931.841.892.051.891.941.871.711.841.881.881.801.861.731.972.062.112.192.07-0.441.81
0.260.280.270.240.270.260.270.310.280.270.270.290.280.300.260.240.230.220.241.360.29
Depth Median(phi) (mm)bsf (m)
0.00.30.60.91.21.51.82.12.42.73.03.33.63.94.24.54.85.15.45.76.0
Core 60
1.462.242.192.232.022.382.492.472.332.482.632.622.582.501.67-3.000.572.262.292.19
0.360.210.220.210.250.190.180.180.200.180.160.160.170.180.318.000.670.210.200.22
Depth Median(phi) (mm)bsf (m)
0.00.30.60.91.21.51.82.12.42.73.03.33.63.94.24.54.85.15.45.7
Core 61
1.691.741.701.691.731.561.711.831.931.951.771.981.471.261.661.971.884.194.234.234.23
0.310.300.310.310.300.340.310.280.260.260.290.250.360.420.320.250.270.050.050.050.05
Depth Median(phi) (mm)bsf (m)
0.00.30.60.91.21.51.82.12.42.73.03.33.63.94.24.54.85.15.45.76.0
Core 66
0 1000 2000
feet
670600 670800 671000 671200 671400 671600 671800 672000
Sand Resource Thickness of MON-14
7
7
910
11
7
7Sand Volume (cu. yds.) 5-ft. minimum = 295,00010-ft. minimum = 53,000
543200
543400
543600
543000
+840.00.30.60.91.21.51.82.12.42.73.03.33.63.94.2
1.581.541.881.972.042.272.272.372.622.994.003.583.574.034.12
0.330.340.270.260.240.210.210.190.160.130.060.080.080.060.06
Core 84Depth Median
(phi) (mm)bsf (m)
0 200 400
feet
7
91110
5
7
910
11
1313
1517
9
9
7
9
9
10
11
11
638000 638500 639000 639500 640000 640500 641000 641500 642000 642500
474000
474500
475000
475500
476000
476500
477000
Sand Resource Thickness of MON-3
Sand Volume (cu. yds.) 5-ft. minimum = 4,642,00010-ft. minimum = 3,219,000
191517
11
13
5
37+
2.372.302.352.332.362.252.422.432.422.442.372.182.283.702.162.712.793.694.123.89
0.190.200.200.200.190.210.190.190.190.180.190.220.210.080.220.150.140.080.060.07
Depth Median(phi) (mm)bsf (m)
0.00.30.60.91.21.51.82.12.42.73.03.33.63.94.24.54.85.15.45.7
Core 37
0 500 1000
feet
Sand Resource Thickness of MON-6
17
486000
488000
490000
656000 658000 660000 662000 664000 666000 668000
7
7
7
9
9
9
10
10
11
11 13
13
13
15 15
77 7
9 11
1315
17
9
10
1011
1517
19
21
21
5
7
7
7
7
77
99
9
9
13
13
15
17 19
219
10
11
9
7
7 10
11
9
19
19
Sand Volume (cu. yds.) 5-ft. minimum = 25,282,00010-ft. minimum = 20,255,000
+
+
+32
62
46
47
0.871.021.351.191.411.880.902.521.991.931.681.481.601.710.173.031.400.61
0.550.490.390.440.380.270.530.170.250.260.310.360.330.310.890.120.380.65
Depth Median(phi) (mm)bsf (m)
0.00.30.60.91.21.51.82.12.42.73.03.33.63.94.24.54.85.1
Core 32
1.231.071.501.741.631.291.150.940.801.290.400.720.471.270.991.141.321.41
0.430.470.350.300.320.410.450.520.580.410.760.610.720.420.500.450.400.38
Depth Median(phi) (mm)bsf (m)
0.00.30.60.91.21.51.82.12.42.73.03.33.63.94.24.54.85.1
Core 46
1.821.901.970.500.342.001.942.122.052.152.052.072.042.142.141.981.942.252.042.022.04
0.280.270.260.710.790.250.260.230.240.230.240.240.240.230.230.250.260.210.240.250.24
Depth Median(phi) (mm)bsf (m)
0.00.30.60.91.21.51.82.12.42.73.03.33.63.94.24.54.85.15.45.76.0
Core 47
1.381.381.300.801.461.291.231.491.691.981.571.812.191.692.522.592.55-2.461.160.892.94
0.380.390.410.570.360.410.430.350.310.250.340.280.220.310.170.170.175.490.450.540.13
Depth Median(phi) (mm)bsf (m)
0.00.30.60.91.21.51.82.12.42.73.03.33.63.94.24.54.85.15.45.76.0
Core 62
0 1000 2000
feet
531000
531500
532000
532500
533000
533500
534000
Sand Resource Thickness of MON-13
7
7
7
7
779
9
9
10
11
11
9
9
1011
660000 660500 661000 661500 662000 662500 663000 663500 664000 664500
Sand Volume (cu. yds.) 5-ft. minimum = 2,502,00010-ft. minimum = 354,000
10
13
9
+85
0.00.30.60.91.21.51.82.12.42.73.03.33.6
1.581.63-3.040.954.021.540.931.120.891.601.511.410.60
0.330.328.220.520.060.340.530.460.540.330.350.380.66
Core 85, Run 1Depth Median
(phi) (mm)bsf (m)Depth Median
(phi) (mm)bsf (m)0.711.101.291.230.911.260.13
0.610.470.410.430.530.420.91
4.24.54.85.15.45.76.0
Core 85, Run 2
Although core 85 is not inside the five-foot sand-thick-ness minimum at which all shoal features were clipped, it does show useful information about MON-13. The change from medium grained sand to pebbles seen in Core 85 clearly matched up with reflectors on seismic lines passing through this shoal feature. It is an explora-tion level resource that was found using confirmatory geologic data from the eastern flank of the shoal. NJGWS would highly recommend additional coring of this resource if it is considered for the design level phase.
0 500 1000
feet
REFERENCES The following list includes materials accessed for geologic background on the survey area and/or analytical methods used, though not referenced on the map.
Ashley, G.M., Wellner, R.W., Esker, D., and Sheridan, R.E., 1991, Clastic sequences developed during Late Quaternary glacio-eustatic sea-level fluctuations on a passive continental margin: Example from the inner continental shelf near Barnegat Inlet, New Jersey: Geological Society of America Bulletin, v. 103, p. 1607-1621.
Carey, J.S., Sheridan, R.E., and Ashley, G.M., 1998, Late Quaternary sequence stratigraphy of a slowly subsiding passive margin, New Jersey continental shelf: American Association of Petroleum Geologists Bulletin, v. 82, no. 5A, p. 773-791.
Dillon, W.P., and Oldale, R.N., 1978, Late Quaternary sea-
level curve: Reinterpretation based on glacio-tectonic influence: Geology, v. 6, p. 56-60.
Duane, D.B., Field, M.E., Meisburger, E.P., Swift, D.J.P., and Williams, S.J., 1972, Linear shoals on the Atlantic inner continental shelf, Florida to Long Island, in Swift, D.J.P., and others, eds., Shelf sediment transport: process and pattern: Stroudsburg, PA, Dowdan, Hutchinson and Ross, p. 447-498.
Esker, D., Sheridan, R.E., Ashley, G.M., Waldner, J.S., and Hall, D.W., 1996, Synthetic seismograms from vibracores: a case study in correlating the late Quaternary seismic stratigraphy of the New Jersey Inner Continental Shelf: Journal of Sedimentary Research, v. 66, no. 6, p. 1156-1168.
Folk, R.L., 1980, Petrology of Sedimentary Rocks, Hemphill Publishing Co., Austin, TX, 185 p.
Grow, J.A., Klitgord, K.D., and Schlee, J.S., 1988, Structure and evolution of the Baltimore Canyon Trough, in R.E. Sheridan and J.A. Grow, eds., The Atlantic continental margin: U.S.: Geological Society of America, The Geology of North America, v. 1-2, p. 269-290.
McBride, R.A., and Moslow, T.F., 1991, Origin, evolution, and distribution of shoreface sand ridges, Atlantic inner shelf, U.S.A.: Marine Geology, v. 97, p. 57-85.
New Jersey Geological and Water Survey, 2013, Significant Sand Resource Areas Offshore Cape May County, New Jersey: map on file at New Jersey Geological and Water Survey, Trenton, NJ
Smith, P.C., 1996, Nearshore ridges and underlying upper Pleistocene sediments on the inner continental shelf of New Jersey: Masters Thesis, Rutgers University, 157 p.
U.S. Army Corps of Engineers, 1989, General Design Memorandum, Atlantic Coast of New Jersey, Sandy Hook to Barnegat Inlet Beach Erosion Control Project Section I - Sea Bright to Ocean Township, New Jersey, Volume 2, Technical Appendices: New York, N.Y., Appendix C: Borrow Area Evaluations, p. C-I to C-12.
U.S. Army Corps of Engineers, 1993, General Design Memorandum, Atlantic Coast of New Jersey, Sandy Hook to Barnegat Inlet Beach Erosion Control Project Section Il - Asbury Park to Manasquan, N.J., Volume 2, Technical Appendices: New York, N.Y., Appendix C: Borrow Area Investigations, p. C-l to C-19.
Waldner, J.S., and Hall, D.W., 1991, A marine seismic survey to delineate Tertiary and Quaternary stratigraphy of coastal plain sediments offshore of Atlantic City, New Jersey: New Jersey Geological Survey Report GSR 26, 15 p.
Wentworth C.K. 1922,. A scale of grade and class terms for clastic sediments. Journal of Geology, v. 30, p. 377–392.
Williams, S.J., and Duane, D.B., 1974, Geomorphology and sediments of the Inner New York Bight Continental Shelf: U.S. Army Corps of Engineers, Coastal Engineering Research Center, Fort Belvoir, VA, Technical Memorandum 45, 81 p.
DEPARTMENT OF ENVIRONMENTAL PROTECTIONWATER RESOURCES MANAGEMENTNEW JERSEY GEOLOGICAL AND WATER SURVEY
SIGNIFICANT SAND RESOURCE AREAS IN STATE AND FEDERAL WATERSOFFSHORE MONMOUTH COUNTY, NEW JERSEY
GEOLOGIC MAP SERIES GMS 15-3Plate 2 of 2