INTRODUCTION REPLY HARDWARE STEP 1: … XP-IQ User... · Synthesis Multimedia ... TROUBLE SHOOTING...
88
INTRODUCTION Installation ....................................................................................... 1 What's New when Upgrading from XP-IQ Release 1 ............................... 2 Important Notes On This Release ........................................................ 4 Quick Start (Running A Demo Presentation) ......................................... 4 Overview.......................................................................................... 5 Compatibility Requirements ................................................................ 5 Capacities ........................................................................................ 6 What Skills Do I Need? ...................................................................... 6 Synthesis Multimedia ......................................................................... 6 REPLY HARDWARE Components and System Operation ..................................................... 7 Connecting Base Stations ................................................................... 7 Testing The System ........................................................................... 9 Additional Test Functions.................................................................... 9 Configuring a Base Station For Network Connections ........................... 10 Changing channels and keypad addresses .......................................... 11 STEP 1: CREATING A BASIC PRESENTATION Overview........................................................................................ 13 Set Default Theme .......................................................................... 13 Creating A Master Presentation ......................................................... 14 Slide Types..................................................................................... 16 Slide Options .................................................................................. 17 Adding Slides To Your Presentation.................................................... 20 Checking Your Presentation .............................................................. 21 STEP 2: SETTING PRESENTATION OPTIONS Overview........................................................................................ 22 On The General Tab: ....................................................................... 22 On The Options Tab: ....................................................................... 24 Moving Your Presentation ................................................................. 27 STEP 3: RUNNING A PRESENTATION Overview........................................................................................ 28 Starting The Presentation ................................................................. 28 Reviewing Slides and Jumping To Slides............................................. 31 Impromptu Slides............................................................................ 31 Comparing Results .......................................................................... 32 Using The Countdown Clock.............................................................. 34 Ending The Presentation................................................................... 34 Presentation Functions At A Glance.................................................... 36 Helpful Tips .................................................................................... 37 OPTIONAL SYNTHESIS FILES Using Template Files........................................................................ 38 Using A Roster ................................................................................ 39 Creating A Playlist ........................................................................... 40 CREATING TEAM COMPETITION Overview........................................................................................ 42 The Team File Approad, Pre-assigned ................................................ 42 The Demographic Slide Approach ...................................................... 44 REPORTS: VIEWING, PRINTING, AND CONVERTING Overview of Reports ........................................................................ 46 Report By Individual ........................................................................ 46 Report By Results Screen ................................................................. 46 Demographic Comparison................................................................. 47 Slide Comparison ............................................................................ 50
Transcript of INTRODUCTION REPLY HARDWARE STEP 1: … XP-IQ User... · Synthesis Multimedia ... TROUBLE SHOOTING...
INTRODUCTIONInstallation.......................................................................................1What's New when Upgrading from XP-IQ Release 1 ...............................2Important Notes On This Release ........................................................4Quick Start (Running A Demo Presentation) .........................................4Overview..........................................................................................5Compatibility Requirements................................................................5Capacities ........................................................................................6What Skills Do I Need? ......................................................................6Synthesis Multimedia.........................................................................6
REPLY HARDWAREComponents and System Operation.....................................................7Connecting Base Stations...................................................................7Testing The System...........................................................................9Additional Test Functions....................................................................9Configuring a Base Station For Network Connections ...........................10Changing channels and keypad addresses .......................................... 11
STEP 1: CREATING A BASIC PRESENTATIONOverview........................................................................................ 13Set Default Theme .......................................................................... 13Creating A Master Presentation ......................................................... 14Slide Types..................................................................................... 16Slide Options .................................................................................. 17Adding Slides To Your Presentation.................................................... 20Checking Your Presentation ..............................................................21
STEP 2: SETTING PRESENTATION OPTIONSOverview........................................................................................ 22On The General Tab: .......................................................................22On The Options Tab: .......................................................................24Moving Your Presentation................................................................. 27
STEP 3: RUNNING A PRESENTATION
Overview........................................................................................ 28Starting The Presentation................................................................. 28Reviewing Slides and Jumping To Slides.............................................31Impromptu Slides............................................................................ 31Comparing Results .......................................................................... 32Using The Countdown Clock.............................................................. 34Ending The Presentation...................................................................34Presentation Functions At A Glance.................................................... 36Helpful Tips .................................................................................... 37
OPTIONAL SYNTHESIS FILESUsing Template Files........................................................................38Using A Roster ................................................................................39Creating A Playlist ........................................................................... 40
CREATING TEAM COMPETITIONOverview........................................................................................ 42The Team File Approad, Pre-assigned ................................................ 42The Demographic Slide Approach ......................................................44
REPORTS: VIEWING, PRINTING, AND CONVERTING
Overview of Reports ........................................................................46Report By Individual ........................................................................46Report By Results Screen ................................................................. 46Demographic Comparison................................................................. 47Slide Comparison ............................................................................ 50
Team Comparsion ........................................................................... 50Class Report ................................................................................... 51Converting Reports To Data Files ......................................................52Publishing Reports To A Web ............................................................ 52
EDITING AND COMBINING DATA FILESEditing a Synthesis Data File............................................................. 53Combining Synthesis Data Files ........................................................ 54Move Records in a Data File..............................................................55
ADVANCED FEATURESAdding Music, Pictures, Movies and Shapes ........................................ 57Making Changes Across An Entire Presentation ...................................58Using Demographic Slides ................................................................ 59Using Multi-Choice Slides ................................................................. 60Using Comparison Slides .................................................................. 61Using Review Slides......................................................................... 61Using Demopgraphic Filter Slides ......................................................61Using The Slide Sorter ..................................................................... 62Using Log In ................................................................................... 62Advanced Text File Import................................................................ 63Working With PowerPoint ................................................................. 63Working With Text Boxes ................................................................. 64Scale Transitions............................................................................. 65Removing Response Choices.............................................................68Adjust Team Points.......................................................................... 68About First Correct .......................................................................... 68Using Comparison Graphs ................................................................ 69Delivering On The Road Training ....................................................... 70Save MPF and SPF as a Web Page or PDF ...........................................71Pack A Presentation......................................................................... 71Custom Text Color........................................................................... 72Presentation Auto Run ..................................................................... 72Move Multiple Groups of Slides.......................................................... 72Change System Messages ................................................................ 73Using The Game Board .................................................................... 73Compare Two .................................................................................75Hot Backup..................................................................................... 76Refresh ..........................................................................................77Using The Call List........................................................................... 78
TROUBLE SHOOTINGTrouble Shooting Guide.................................................................... 79
FACILITATIONOverview........................................................................................ 80Define Meeting Objectives ................................................................ 80Developing Questions ......................................................................80Introduce The System...................................................................... 81Interpretation of Results .................................................................. 82Do's and Don'ts...............................................................................82Promote Interaction......................................................................... 83
APPENDIX
The Home Page...............................................................................84About Quick Files ............................................................................ 84Custom Layouts .............................................................................. 84Global Change ................................................................................84The And/Or Operator - Demographic Comparisons .............................. 84Weighted Voting ............................................................................. 85
SOFTWARE AGREEMENT ......................................................................... 86
Synthesis XP-IQ Page 1
Introduction
Installation
1. Install ComTec XP-IQ software (product key code is on the inside of the CD case)
2. When completed, plug the Reply base station into a serial port (com port) on your computer. If you do not have one, see the notes below.
3. As an option, you may want to go to Windows Device Manager, expand the "Ports - Com & LPT" group and note which Com port number you have connected the base station to.
4. Start the product that you have purchased. From Windows 'Start' button, 'Program Files', there is now a folder called ComTec Audience Response. There are three programs in this folder; Unity XP-IQ, Elect XP-IQ, and Synthesis XP-IQ along with a User Guide for each.
5. Inside your DVD case is a Product Key Code for each product that was purchased. (A brief description of the differences between products is on the inside cover of the printed User Guide.) Determine which product you have purchased and start the program.
6. With the purchased product started, close the 'Task Selector' by clicking 'Cancel'.
7. Go to the 'Tools' menu and select 'Change Product Key Code'.
8. Enter your the Product Key Code found or your DVD case inside cover, or click Cancel to use the system for evaluation purposes, in which case, you may use a maximum of 10 keypads as shown in the system title bar.
9. From the Task Selector choose: "Start One or More Base Stations" or from the main toolbar
click the icon .
10.A new box will open. Since you can use multiple base stations, each base station is given a 'letter' identifier. The first base is assigned 'A'.
11.Select the Com port that the base is connected to and if desired, enter a new range of keypads to poll.
12.Click 'Connect'. (if you have difficulty connecting, please see "Configuring and Connecting Base Stations"
13.Once connected, click the 'Test Keypads' button.
14.A new screen opens and the base station starts polling keypads.
15. Press any key on the keypads you want to test. The vote you sent appears next to the keypad number on screen.
16.When done, stop polling and close the window.
17. You are now ready to start creating your first presentation.
Important Notes:
o If your computer has no serial (com) ports you can purchase a USB to serial converter cable, or you can use the network connection port instead. To purchase the USB to serial converter, please contact ComTec for a list of known reliable devices.
o If you choose to use the network connection, please see the topic "Using the NetworkConnection" in the hardware section.
o We strongly suggest that you read the Overview in the Introduction to understand the differences between Unity XP-IQ, Synthesis XP-IQ, and Elect XP-IQ. It is also very important to know which of the products you own and the maximum number of keypads you can support.
Synthesis XP-IQ Page 2
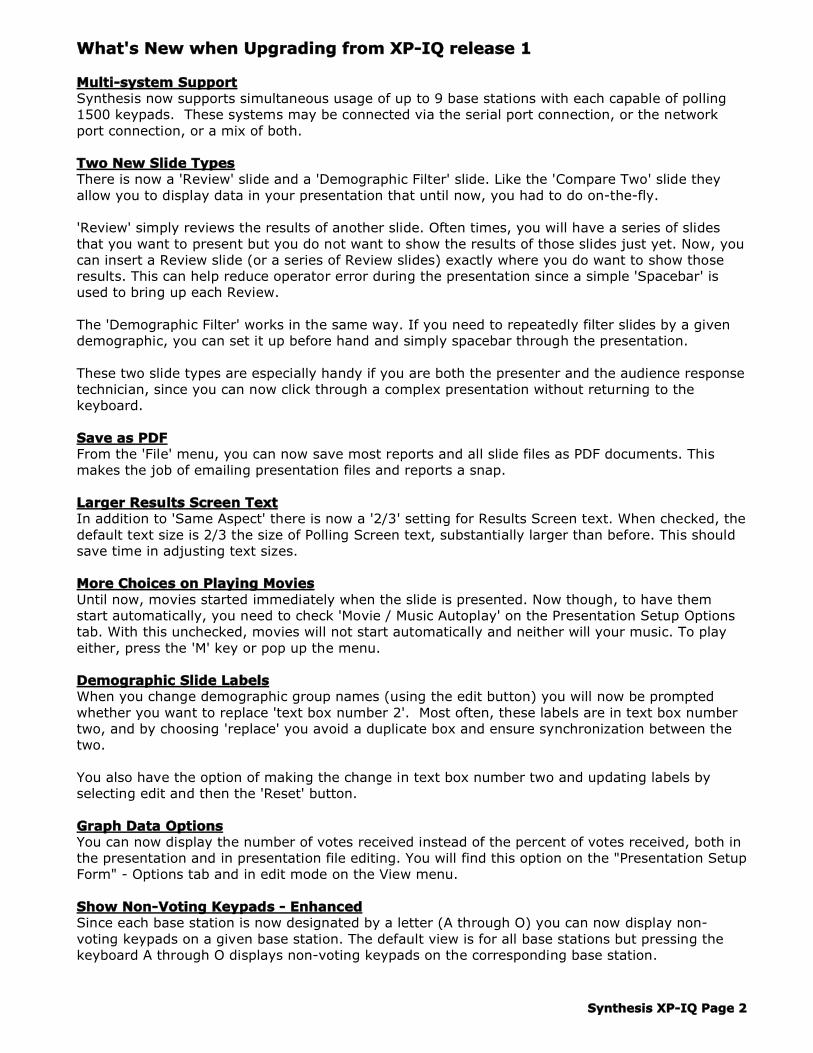
What's New when Upgrading from XP-IQ release 1
Multi-system SupportSynthesis now supports simultaneous usage of up to 9 base stations with each capable of polling 1500 keypads. These systems may be connected via the serial port connection, or the network port connection, or a mix of both.
Two New Slide TypesThere is now a 'Review' slide and a 'Demographic Filter' slide. Like the 'Compare Two' slide they allow you to display data in your presentation that until now, you had to do on-the-fly.
'Review' simply reviews the results of another slide. Often times, you will have a series of slides that you want to present but you do not want to show the results of those slides just yet. Now, you can insert a Review slide (or a series of Review slides) exactly where you do want to show those results. This can help reduce operator error during the presentation since a simple 'Spacebar' is used to bring up each Review.
The 'Demographic Filter' works in the same way. If you need to repeatedly filter slides by a given demographic, you can set it up before hand and simply spacebar through the presentation.
These two slide types are especially handy if you are both the presenter and the audience response technician, since you can now click through a complex presentation without returning to the keyboard.
Save as PDFFrom the 'File' menu, you can now save most reports and all slide files as PDF documents. This makes the job of emailing presentation files and reports a snap.
Larger Results Screen TextIn addition to 'Same Aspect' there is now a '2/3' setting for Results Screen text. When checked, the default text size is 2/3 the size of Polling Screen text, substantially larger than before. This should save time in adjusting text sizes.
More Choices on Playing MoviesUntil now, movies started immediately when the slide is presented. Now though, to have them start automatically, you need to check 'Movie / Music Autoplay' on the Presentation Setup Options tab. With this unchecked, movies will not start automatically and neither will your music. To play either, press the 'M' key or pop up the menu.
Demographic Slide LabelsWhen you change demographic group names (using the edit button) you will now be prompted whether you want to replace 'text box number 2'. Most often, these labels are in text box number two, and by choosing 'replace' you avoid a duplicate box and ensure synchronization between the two.
You also have the option of making the change in text box number two and updating labels by selecting edit and then the 'Reset' button.
Graph Data OptionsYou can now display the number of votes received instead of the percent of votes received, both in the presentation and in presentation file editing. You will find this option on the "Presentation Setup Form" - Options tab and in edit mode on the View menu.
Show Non-Voting Keypads - EnhancedSince each base station is now designated by a letter (A through O) you can now display non-voting keypads on a given base station. The default view is for all base stations but pressing the keyboard A through O displays non-voting keypads on the corresponding base station.
Synthesis XP-IQ Page 3
Turn off AutosaveWith a presentation open for editing, you can now disable autosave.
Improved 'View Display Screen' FunctionsFrom the Presentation Setup Form, when you view the display screen, you can now set the location of the status box by pressing CTRL+ any arrow key. When you save your Quick File, the status box location will be saved as well.
Also, while viewing the display screen you can resize it using the minus and plus keys. If it is smaller than your full screen, you can move it by using the arrow keys.
The 'Home' key and 'End' key will toggle between placing the status box on the smaller display window versus the larger screen display.
Greater 'Range To Poll' ControlIn a either single or multiple system environment, you can set a specific range (or ranges) of keypads to poll. In the past, you could only set a range if you used one base station. And even then, it was one range only.
For example, you can now configure your system to poll: 1-150 on base station A, 50-175 on base station B, and 1-110 plus 200-240 on base station C.
This becomes important when you have blocks of keypads that are not on-site and then need to show keypads that have not yet voted on a given question.
It is also important to overall polling speed. Now, if you used 4 systems and each used keypads 1-50, your polling speed would be .5 seconds rather than a full 3 seconds as it used to be.
Easy Replace of Pictures & MoviesIf you have spent some time positioning a picture or movie exactly and at the last minute need to change the picture or movie, you can now right click it and choose a new source.
Presentation File Save with Keyboard CTRL+SWith a presentation file open, the standard key combination of CTRL+S saves your file. This was previously disabled.
Test Keypads - ConfigurableOn a base station by base station basis, you can now specify one or more ranges of keypads to poll and therefore to test.
This allows you to easily discard entire groups of keypads that may not be on site, and limits the keypad ranges that would be displayed using the 'Show Non-Voting keypads' function in the presentation.
It is also possible to remove from the 'live' group of keypads, any keypads that did not successfully vote during the keypad test. This ensures that during the presentation, you poll only those keypads that are present and working correctly.
Call List Audience members can now signal that they have a question by pressing the '1' key, or that they have a comment by pressing the number '2' key while the system Call List is open.
See 'Call List' in the Advanced Features Section for more.

Synthesis XP-IQ Page 4
Important Notes On This Release
If you have been using previous versions of ComTec software it is important to note that there are a few features that have either been removed or have been changed substantially. They are:
o Before running a live presentation, you must now 'connect' to your base station or base stations.
o You can now connect up to 9 base stations. The previous maximum was one.
o There is no 'virtual' numbering any longer. So, when using two systems of 300 keypads each, Keypads are now A001-A300 and B001-B300 instead of 1-300 and 301-600.
o In the presentation while displaying a graph, CTRL+R no longer displays the 'response data". Instead use CTRL+B for 'both'. This displays the percent of votes cast and the number of votes cast. Use CTRL+P for percent only, and CTRL+N for number only.
Quick Start (Running A Demo Presentation)If you are an experienced Synthesis user, you may want to discover its newest features on your own. If not, you can still get a good feel for Synthesis' power by running the included demo. Just launch Synthesis, start a Presentation as shown below, and follow the on-screen prompts for New Users.
1. From Synthesis' main window select "Run A Presentation" from the Action menu.
2. On the Presentation Setup form, click "Open A Quick File".
3. Browse for and open a file called "TryMe.qck" which is located in your C:\ComTecXP-IQ\Synthesis Masters folder.
4. If you have not connected and started a Reply base station, click on 'Demo Mode' to have the computer generate random results just as though people are voting.
5. Click the "Run" button. Your home page will be displayed.
6. Move your mouse (or press "A" on the keyboard) to show the "Control Button" in the lower left corner of the screen. Click on the button to pop up a menu.
7. Everything that you can do is listed on the menu. And, you can do different things from different screens.
8. Lastly, know that the "Spacebar" is used to advance the Presentation.
Have fun. . .

Synthesis XP-IQ Page 5
OverviewComTec XP for Reply IQ includes three separate products, Unity XP-IQ, Synthesis XP-IQ and Elect XP-IQ. In most cases, you have purchased only one of these. The other products are provided astrial versions and allow you to explore other possible applications within your organization.
All three products allow you to perform the fundamental task of presenting questions, collecting votes, and displaying graphs. However, each product offers a sub-set of features that is specific to a particular meeting environment.
Unity XP-IQ is the best tool to use when you need general presentation support or you need to support "Group Decision" making. As a general presentation support tool, it allows you to include custom slide backgrounds, pictures, movies, and music. Although Elect allows you to specify correct answers for questions, it does not keep score at all.
Unity also offers two very powerful tools to support the Group Decision making process. First, it allows you to prioritize (force rank) up to 99 items or issues. Second, it provides XY mapping capability so that you can plot issues two dimensionally.
Synthesis XP-IQ is the best tool to use when your need is for "Learning Support." Like Unity, it allows you to include custom slide backgrounds, pictures, movies, and music. Synthesis does not offer prioritization or XY mapping. As a learning tool though, it allows you to assign correct answers to questions, assign point values, and assign keypads to teams. And, it keeps track of scoring based on both percent correct and points scored for individuals, demographic groups, and teams.
This capability allows Synthesis XP-IQ to be used effectively in anything from a traditional classroom quiz, to a high-end game where teams are competing for points to win the "Grand Prize" and learning something along the way.
Elect XP-IQ is designed for parliamentary proceedings. Although you can ask standard opinion questions, Elect's strength is in providing a Roll Call function and in features such as seconding motions and holding elections. If a roster file is used each roster member's vote can be weighted and each person's vote can be displayed on screen.
Elections can include multiple rounds of voting and nominees can be removed from the list as each seat in a multi-seat office (e.g. Board of Directors) is filled.
So that you can practice running presentations without having to connect the audience response hardware, all products provide you with a simulation tool. Simply check "demo mode" in the Presentation Setup Options form.
Compatibility Requirements
Synthesis XP-IQ is designed to run on Windows client computers and notebooks. It is not designed for use on network application servers, nor is it designed for use in the Mac environment.
Minimum Requirements
o Windows XP or Windows 2000
o Windows Media Player must be operational to play music & movies in Synthesis
o Macromedia flash player must be operational to play flash (*.swf) movies
o Your PC should be use a Pentium 4 processor (or higher) with 264 MB RAM (or more)
o SVGA (800 x 600) display or higher
o One available serial port or network port.
o An installed sound card if you want to play music while polling
Synthesis XP-IQ Page 6
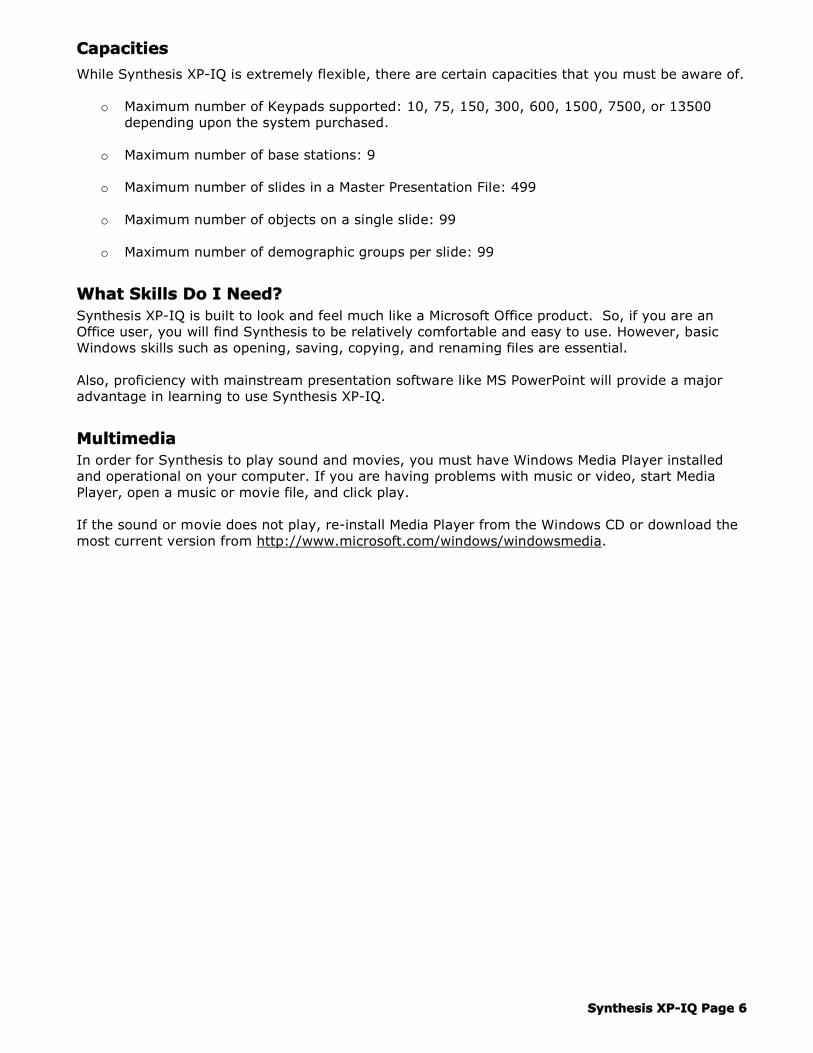
Capacities
While Synthesis XP-IQ is extremely flexible, there are certain capacities that you must be aware of.
o Maximum number of Keypads supported: 10, 75, 150, 300, 600, 1500, 7500, or 13500 depending upon the system purchased.
o Maximum number of base stations: 9
o Maximum number of slides in a Master Presentation File: 499
o Maximum number of objects on a single slide: 99
o Maximum number of demographic groups per slide: 99
What Skills Do I Need?Synthesis XP-IQ is built to look and feel much like a Microsoft Office product. So, if you are an Office user, you will find Synthesis to be relatively comfortable and easy to use. However, basic Windows skills such as opening, saving, copying, and renaming files are essential.
Also, proficiency with mainstream presentation software like MS PowerPoint will provide a major advantage in learning to use Synthesis XP-IQ.
MultimediaIn order for Synthesis to play sound and movies, you must have Windows Media Player installed and operational on your computer. If you are having problems with music or video, start Media Player, open a music or movie file, and click play.
If the sound or movie does not play, re-install Media Player from the Windows CD or download the most current version from http://www.microsoft.com/windows/windowsmedia.

Synthesis XP-IQ Page 7
Reply Hardware
ComponentsYour audience response system is a peripheral device that attaches to a desktop PC or notebook. The base station communicates with each keypad and your computer.
The Base StationThe base station includes transmit and receive modules for communicating wirelessly with up to 1500 keypads on a specific radio channel. It then sends votes from those keypads, to the computer, for processing.
There are fifteen different radio channels available within the Reply IQ hardware platform. The base station and the keypads must be assigned the same channel, in order to communicate. Changing channels is covered later in this section.
Synthesis XP-IQ software comes in various sizes with support for up 10, 75, 150, 300, 600, 1500, 7500, or 13500 keypads. With all sizes, you can use up to fifteen serial ports, but are still limited to the total number of keypads that your version will support.
The KeypadsKeypads function as individual terminals, sending user entered digits to the Base Station via wireless Radio Frequency transmission. Each keypad has an electronically stored ID called an "address". The address is also shown near the top of the keypad itself. Addresses range from 1 to 1500.
To turn a keypad on, press any key. To turn a keypad off manually, press the left arrow key and the #1 key simultaneously. This brings up the main menu. Choose the power option to power it off.
Using Multiple Base StationsIt is very important to know that a single base station is configured for use with up to 300 keypads, by default. You can increase this capacity in steps of 300 keypads, up to a maximum of 1500. This is accomplished by purchasing feature connectors which then transfer the new capacitysettings to the base station.
To use more than 1500 keypads, you need an additional base station. This base station and all keypads assigned to it must be on a different channel. Both base stations would then need to be plugged into your computer and you must 'connect' to both. Your software will then poll both base stations simultaneously, and will automatically aggregate the data from all base stations.
Connecting Base StationsImportant: Before you can use your voting system, you must first "connect" to your base station.
Determine The Physical Connection TypeThe Reply IQ base station can physically connect to your computer using one of two connection types; a serial connection, or network connection. Although the base station has both connectors, only one is active at any given time. To determine which connection type is active, watch the LED when powering on the base station.
After a double dashed line is displayed on the LED, either the code 'SC' or 'EC' will be displayed. 'SC' means that the serial connection is active. 'EC' means that the Ethernet Connection is active.
If you need to switch the connection type, locate the recessed 'program' button next to the power connector. Turn on the base station and wait for the dashed line to display. Using a small screwdriver or pen, depress and hold the program button. It will change to a triple dashed line. In just a few seconds it will then display either 'SC' or 'EC'. Release the button and allow the base tocontinue its startup.

Synthesis XP-IQ Page 8
To Connect One Base Station via the Serial Connection:1. Set the base station on a table near your computer and plug it into a serial port (com port).
2. From the Task Selector choose "Start One or More Base Stations" or from the Action menu or Toolbar select "Connect".
3. From the "Connect" box accept the default settings of 'Base A'.
4. Select "Serial Port Connection" as the connection type.
5. Select the serial (com) port that the base station is physically connected to.
6. Set a range of keypads to poll, or accept the default.
7. Choose to find all active keypads or all keypads within the specified range.
8. Click the connect button.
9. Once connected, you should 'Test' your keypads. (use the Test Keypads button)
To Connect One Base Station via the Network Connection: Before you can use the network connection, the base station must be assigned an IP address. If you have not done so, first follow the steps outlined in the topic "Configuring a Base Station for Network Connections".
1. Set the base station on a table near your computer and plug it into the network port using the included network cable and adapter. (If you are using a network hub, do not use the adapter.)
2. From the Task Selector choose "Start One or More Base Stations" or from the Action menu or Toolbar select "Connect".
3. From the "Connect" box accept the default settings of 'Base A' Select "Ethernet Connection" as the connection type.
4. Enter the base station's IP address
5. Set a range of keypads to poll, or accept the default.
6. Choose to find all active keypads or all keypads within the specified range.
Click the connect button. Once connected, you should 'Test' your keypads. (use the Test Keypads button)
Important: it is critical that keypads are placed within the maximum radio range (about 300') of the base station.
To Configure A Four Base Station System:
1. Be certain you have 4 Reply systems, each assigned a different channel.
2. Be certain you have 4 available serial ports or a network hub, depending on the connection type chosen. You can of course connect some bases stations via serial port and some vianetwork port.
3. Set the 4 base stations on a table near your computer.
4. Plug the first base station into a port and connect to it.
5. Plug in the next base station, set the Base Station ID to 'B', and click connect to it.
6. Plug in the next base station, set the Base Station ID to 'C', and click connect to it.
7. Plug in the next base station, set the Base Station ID to 'D', and click connect to it.
8. Test all keypads on all ports.
Synthesis XP-IQ Page 9
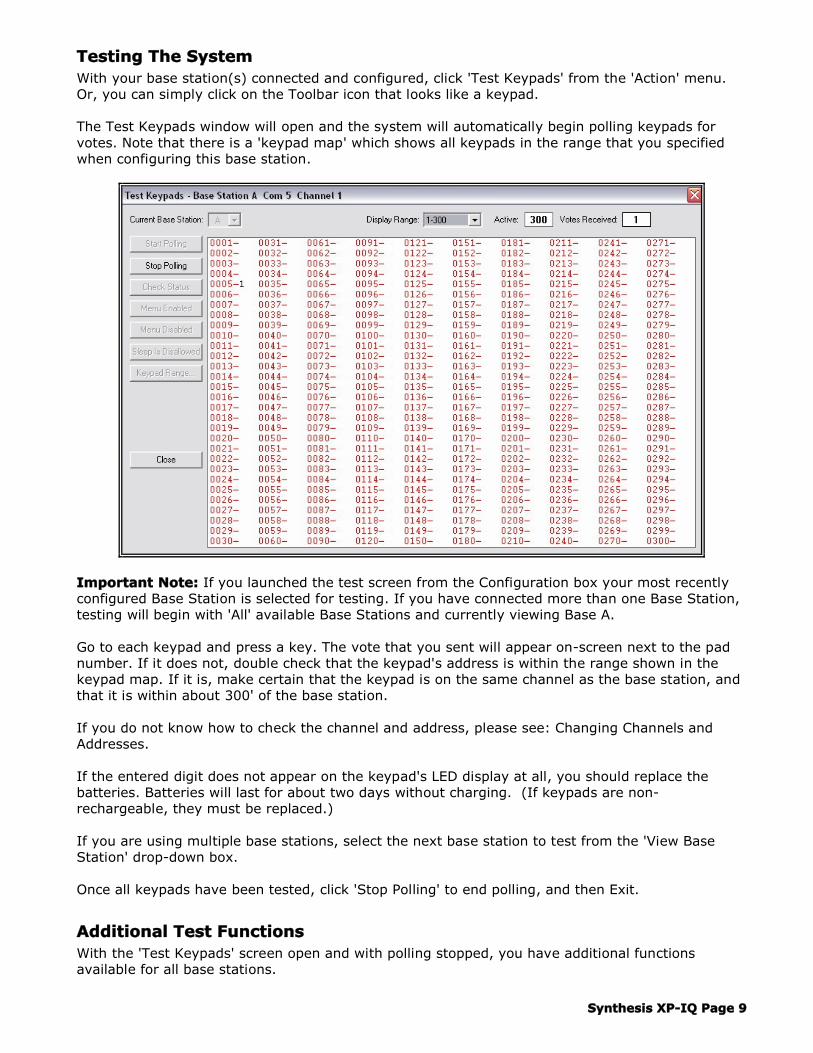
Testing The SystemWith your base station(s) connected and configured, click 'Test Keypads' from the 'Action' menu. Or, you can simply click on the Toolbar icon that looks like a keypad.
The Test Keypads window will open and the system will automatically begin polling keypads for votes. Note that there is a 'keypad map' which shows all keypads in the range that you specified when configuring this base station.
Important Note: If you launched the test screen from the Configuration box your most recently configured Base Station is selected for testing. If you have connected more than one Base Station, testing will begin with 'All' available Base Stations and currently viewing Base A.
Go to each keypad and press a key. The vote that you sent will appear on-screen next to the pad number. If it does not, double check that the keypad's address is within the range shown in the keypad map. If it is, make certain that the keypad is on the same channel as the base station, and that it is within about 300' of the base station.
If you do not know how to check the channel and address, please see: Changing Channels and Addresses.
If the entered digit does not appear on the keypad's LED display at all, you should replace the batteries. Batteries will last for about two days without charging. (If keypads are non-rechargeable, they must be replaced.)
If you are using multiple base stations, select the next base station to test from the 'View Base Station' drop-down box.
Once all keypads have been tested, click 'Stop Polling' to end polling, and then Exit.
Additional Test FunctionsWith the 'Test Keypads' screen open and with polling stopped, you have additional functions available for all base stations.
Synthesis XP-IQ Page 10
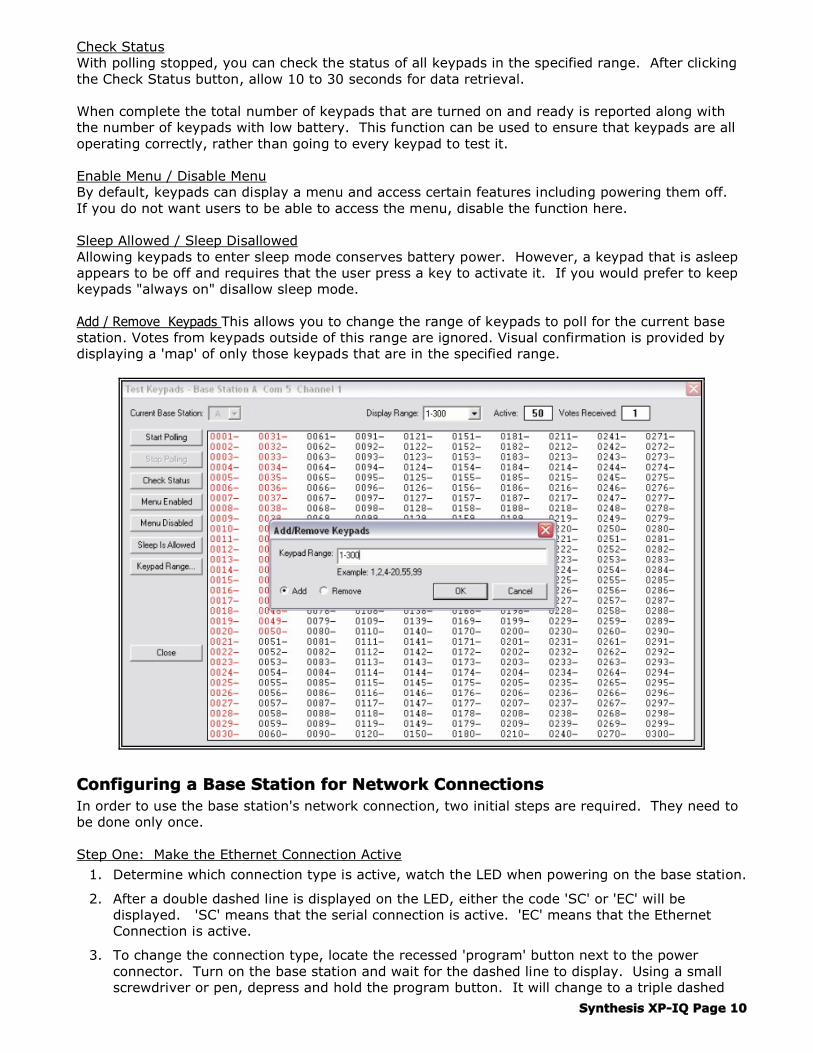
Check StatusWith polling stopped, you can check the status of all keypads in the specified range. After clicking the Check Status button, allow 10 to 30 seconds for data retrieval.
When complete the total number of keypads that are turned on and ready is reported along with the number of keypads with low battery. This function can be used to ensure that keypads are all operating correctly, rather than going to every keypad to test it.
Enable Menu / Disable MenuBy default, keypads can display a menu and access certain features including powering them off. If you do not want users to be able to access the menu, disable the function here.
Sleep Allowed / Sleep DisallowedAllowing keypads to enter sleep mode conserves battery power. However, a keypad that is asleep appears to be off and requires that the user press a key to activate it. If you would prefer to keep keypads "always on" disallow sleep mode.
Add / Remove Keypads This allows you to change the range of keypads to poll for the current base station. Votes from keypads outside of this range are ignored. Visual confirmation is provided by displaying a 'map' of only those keypads that are in the specified range.
Configuring a Base Station for Network ConnectionsIn order to use the base station's network connection, two initial steps are required. They need tobe done only once.
Step One: Make the Ethernet Connection Active1. Determine which connection type is active, watch the LED when powering on the base station.
2. After a double dashed line is displayed on the LED, either the code 'SC' or 'EC' will be displayed. 'SC' means that the serial connection is active. 'EC' means that the Ethernet Connection is active.
3. To change the connection type, locate the recessed 'program' button next to the power connector. Turn on the base station and wait for the dashed line to display. Using a small screwdriver or pen, depress and hold the program button. It will change to a triple dashed
Synthesis XP-IQ Page 11
line. In just a few seconds it will then display either 'SC' or 'EC'.
4. Release and press the button until EC is shown. Then release the button and allow the baseto continue its startup.
Step Two: Assign the base station an IP address.You must first determine what IP addresses your LAN has available. If you are creating your own LAN using only a network hub to connect multiple base stations and this hub is not connected to a corporate LAN, then you can use any addresses in the standard range of: 192.168.0.2 to192.168.0.255. Additionally, your computer must use a static IP address. Once you have decided on an address for each base station, follow the steps below.
1. Determine the base station’s MAC address. It is located on the bottom of the unit, on the label, and is the last line under the bar code. It uses the format of 6 pairs of characters.
2. Connect the base station directly to your computer using the included adapter (provides crossover connection) or a crossover cable.
3. From your Windows Start button open a command window by selecting 'Run' and enter the command: cmd
4. At the prompt, type: arp - s <IP address> <MAC address> and press Enter. (note: Do not use brackets. Do use the actual addresses, not the words)
5. At the prompt type: telnet <IP address> 1 (A message is returned stating that a connection can not be established.)
6. At the prompt type: telnet <IP address> 9999
7. Now a message is returned telling you to press Enter to continue.
8. Follow the menus and select "Server Configuration". Enter the IP address.
9. Once completed and at the main menu, save the settings and exit. The base station is nowconfigured.
10. You should now label the base station with its IP address. It will be needed when connecting to it.
You can now Connect To Your Base Station and begin using it.
Changing channels and keypad addressesIf you own just one system, chances are that you'll never have to change channels or keypad addresses. However if you own more than one system, it is quite likely that at some point you'll be making configuration changes.
Example Reasons For Changing Keypad Addresses
o During a presentation a user's keypad fails. You could change batteries, but it is much quicker to hand the person a new keypad. The problem is that you've asked a few demographic questions, so you want the replacement keypad to be the same address (ID) as the original in order to maintain data integrity.
o Maybe you own two systems with keypads number 1-50 and both use the same channel. You now need to borrow 5 keypads from one system for use with the other. You could re-address them as 51-55.
Example Reasons For Changing Channels
o You could be at an off-site meeting and find that someone else in close proximity is also using a Reply IQ system. Unfortunately you are both on the same default channel. While rare, this could certainly happen, especially at a trade show. One of you needs to change channels so as not to interfere with one another.
o Maybe you own two systems and they are assigned two different channels. You now need to borrow five from one system to use with the other.

Synthesis XP-IQ Page 12
To Change a Keypad's Address (ID)
This is done from the keypad's menu. To access the menu press the left arrow key, then the number one key and release both.
o Choose option 5
o Enter a new address (1-1500)
o Press Send
To Change a Keypad's Channel
This is done from the keypad's menu. To access the menu press the left arrow key, then the number one key and release both.
o Choose option 6
o Enter a new channel (1-15)
o Press Send
Note: the keypad will restart.
To Change a Base Station's Channel
The current channel is displayed on its LED when powering on is complete.
o To change the channel, locate the recessed 'program' button next to the power connector. Turn on the base station and using a small screwdriver or pen, immediately press the program button. This will change the channel to 1.
o Release and press the program button until the desired channel is reached, then wait for thebase station to finish its start-up process.

Synthesis XP-IQ Page 13
Step 1: Creating A Basic Presentation
OverviewAlthough Synthesis XP-IQ allows you to run a presentation with no pre-planned questions, most times you will want to run your presentation from a slide file that you created earlier.
The basic concept is that you create a presentation in much the same way as you would with PowerPoint. Each slide normally asks a question of your audience, and provides a list of up to twenty possible choices. For example: "Where should we hold next year's annual meeting? 1. New York 2. Chicago 3. Los Angeles 4. Houston 5. Phoenix."
With Synthesis however, you have a "Part B" to the slide. That is, you have a follow-up screen that shows the question text, and also shows a graph of how the group voted. The first part of the slide is referred to as a "Polling Screen" and the second part is referred to as a "Results Screen."
These slides are stored in a Master Presentation file that you create. You then "Run a Presentation" using this file to get the group's answers to your questions. By default, each slide is presented in order. However, you have the option to skip slides, insert new slides, or jump back to those that were skipped... all during your presentation.
Each time you run a presentation, Synthesis creates two additional files. One contains the data (each keypad's response for each question asked) which is called a Synthesis Data File. The other is a copy of your Master that also includes any slides created during the presentation, as well as information regarding the order in which questions were asked. This file is called a Session Presentation File.
After your presentation, you will typically print a variety of reports. When you do, you will use the Session Presentation File together with the Synthesis Data File, to show the question text and a graph of exactly how the audience responded.
Important Notes:
o The Session Presentation File stores slides based on two separate indexing schemes. One index is the slide's "original order." That is, the original number in the Master. The second index is "the actual order in which it was presented." During the Presentation (or with the file open for editing) Synthesis displays slides in their "original order." However, when working with reports, slides are presented in the "actual order." In this way, you not only know what questions were asked, but in what sequence they were asked.
o While you most often use the Synthesis Data File and the Session Presentation File together, each can be opened and modified separately.
Set Default ThemeThis menu item is found in the main system window (with no files open) under the Action menu.
Here is where you set your default presentation color scheme. It is important to note that the text and background choices you make here are used as the basis for all "New" Presentation files, Custom Results Screens, Opening Messages, Ending Messages, Home Pages, and Impromptu Screens. You can keep the default settings, or customize your theme.
A screen of 20 bars is displayed in the current color selection. To change a bar color, click anywhere on the bar. This will pop-up the 'Color Picker'. Click on the desired color and then on OK.
If you select a "cylinder" style graph, the bar fill will be a gradient.
You may also change the text, background color, background picture, and graph type. Again, all new Presentation Files etc., will use your new choices.
Synthesis XP-IQ Page 14
You can also change the default scale. If for example, most of your presentations use a scale of 1 -7, set it here. From then on, all new presentations will use 1 -7 as the initial slide scale.
And, like the default scale, you can set a graph (chart) type. So if you like horizontal cylinders, set it here. All new presentations will use horizontal cylinders for the initial slide.
Note: if you like the default color scheme, there is no reason to make any changes.
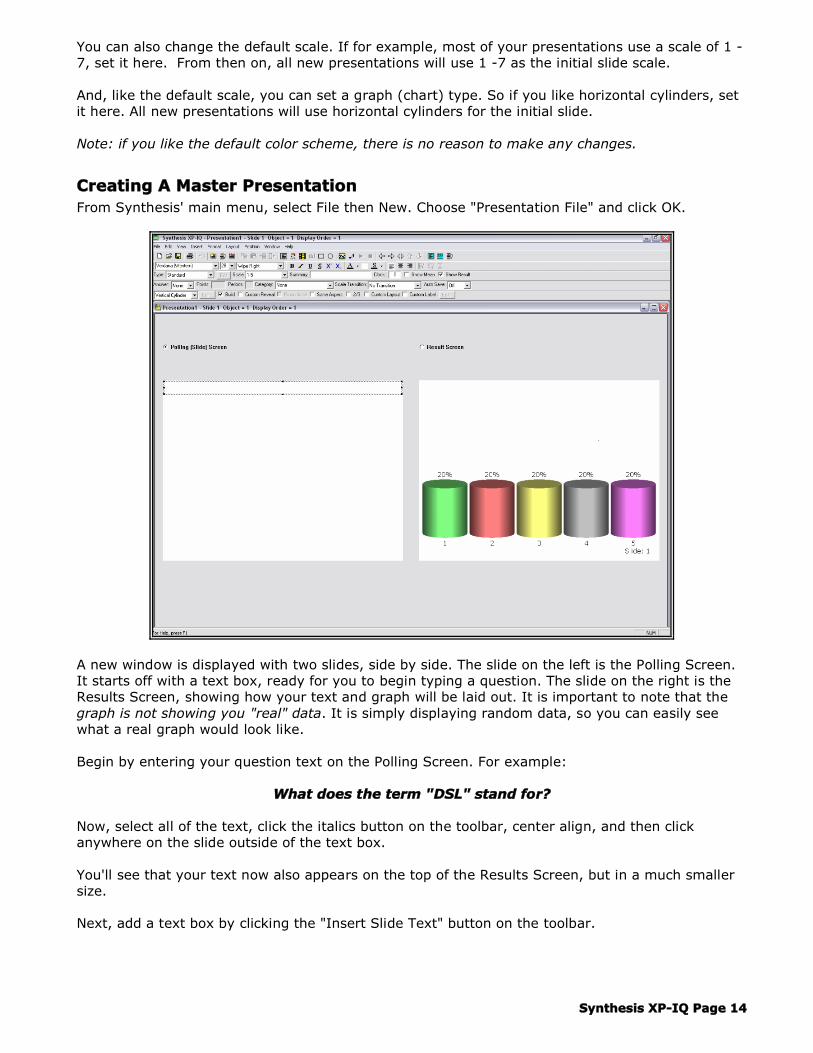
Creating A Master PresentationFrom Synthesis' main menu, select File then New. Choose "Presentation File" and click OK.
A new window is displayed with two slides, side by side. The slide on the left is the Polling Screen. It starts off with a text box, ready for you to begin typing a question. The slide on the right is the Results Screen, showing how your text and graph will be laid out. It is important to note that the graph is not showing you "real" data. It is simply displaying random data, so you can easily see what a real graph would look like.
Begin by entering your question text on the Polling Screen. For example:
What does the term "DSL" stand for?
Now, select all of the text, click the italics button on the toolbar, center align, and then click anywhere on the slide outside of the text box.
You'll see that your text now also appears on the top of the Results Screen, but in a much smaller size.
Next, add a text box by clicking the "Insert Slide Text" button on the toolbar.

Synthesis XP-IQ Page 15
Then enter the list of response choices in this new box.1. Dynamic System Line2. Digital System Link3. Dynamic Synchronous Line4. Digital Subscriber Line5. Dynamic Subscriber Link
Again, you'll see that the text also appears on the Results Screen, but in a much smaller font. To see exactly how it will look to the audience, click anywhere on the Results Screen to select it, then click the "Full Screen" view button on the toolbar.
In most cases, you will find that the question text is now quite legible. It is important to know that this is Synthesis' "Standard" Results Screen layout. That is, all of your original text from the Polling Screen is reduced in size and placed at the top of the Results Screen. The graph is then placed on the bottom half of the screen. These elements are locked in place and non-editable, unless you use a "Custom Layout" which is covered later.
Press the ESC key to return to the Normal View.
When using the "Standard Results Screen" layout, any changes that you make to the Polling Screen, are automatically made to the Results Screen. While this is most convenient, there may be times when you need greater control over how things layout. Fortunately, Synthesis lets you do this too.
From Synthesis' Normal View, click the Custom Layout checkbox on your Options toolbar. Now, you can move or resize your text boxes, graph, or other elements. However, it is very important to understand that once you select Custom Layout, the link between the Polling Screen and the Results Screen is removed. So, if you make changes to the Polling Screen, the Results Screen will not be updated. When using the Custom Layout, any changes must be made to both screens independently.
For now, uncheck the Custom Layout option. Your Results Screen is returned to the Standard Layout, and the link is reestablished.
If you need to change the font size of your graph labels, click anywhere on the Results Screen to select it. Then, on the toolbar, select a new font size.
Tip 1: If your question text takes up the top half or less on your Polling Screen, you can check "Same Aspect". This creates a Results Screen with text at the top in the exact same size as the Polling Screen.
Tip 2: If the default Results Screen text is too small and the "Same Aspect" text size is too large, try the '2/3' setting on the toolbar.
Note: Your Presentation file will be saved every 10 minutes, automatically.
You should now set the Slide Options, beginning with selecting the "Slide Type."
Synthesis XP-IQ Page 16
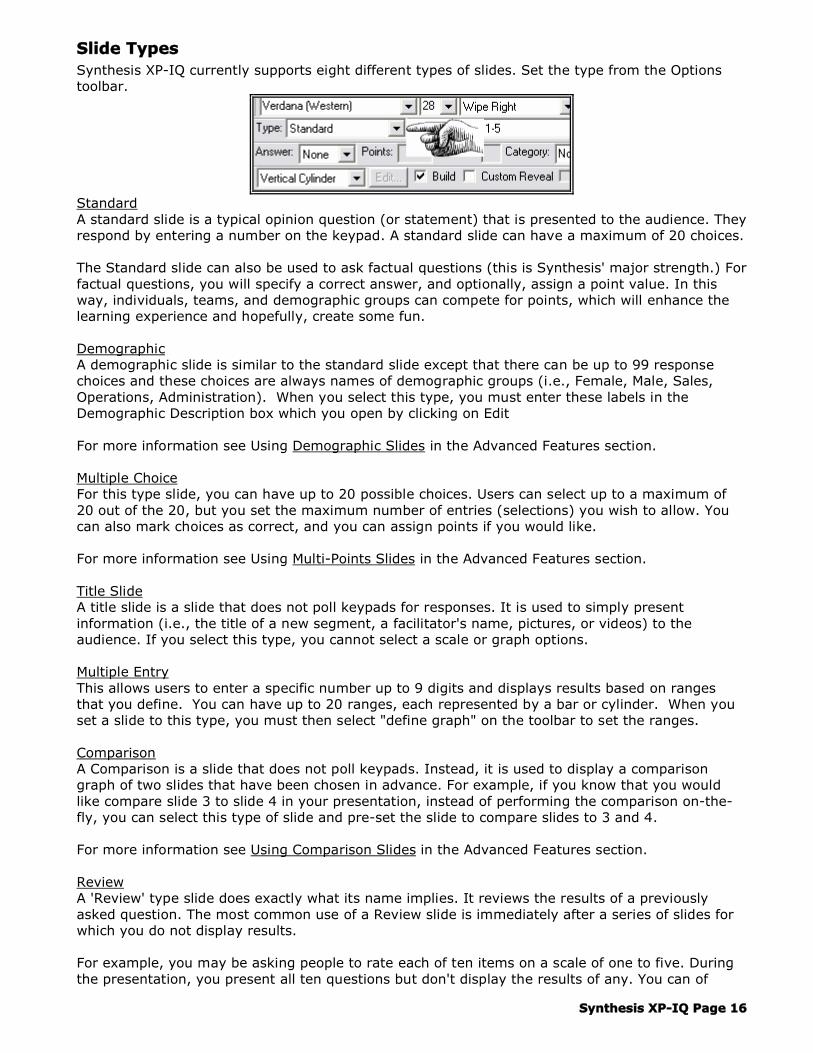
Slide TypesSynthesis XP-IQ currently supports eight different types of slides. Set the type from the Options toolbar.
StandardA standard slide is a typical opinion question (or statement) that is presented to the audience. They respond by entering a number on the keypad. A standard slide can have a maximum of 20 choices.
The Standard slide can also be used to ask factual questions (this is Synthesis' major strength.) For factual questions, you will specify a correct answer, and optionally, assign a point value. In this way, individuals, teams, and demographic groups can compete for points, which will enhance the learning experience and hopefully, create some fun.
DemographicA demographic slide is similar to the standard slide except that there can be up to 99 response choices and these choices are always names of demographic groups (i.e., Female, Male, Sales, Operations, Administration). When you select this type, you must enter these labels in the Demographic Description box which you open by clicking on Edit
For more information see Using Demographic Slides in the Advanced Features section.
Multiple ChoiceFor this type slide, you can have up to 20 possible choices. Users can select up to a maximum of 20 out of the 20, but you set the maximum number of entries (selections) you wish to allow. You can also mark choices as correct, and you can assign points if you would like.
For more information see Using Multi-Points Slides in the Advanced Features section.
Title SlideA title slide is a slide that does not poll keypads for responses. It is used to simply present information (i.e., the title of a new segment, a facilitator's name, pictures, or videos) to the audience. If you select this type, you cannot select a scale or graph options.
Multiple EntryThis allows users to enter a specific number up to 9 digits and displays results based on ranges that you define. You can have up to 20 ranges, each represented by a bar or cylinder. When you set a slide to this type, you must then select "define graph" on the toolbar to set the ranges.
ComparisonA Comparison is a slide that does not poll keypads. Instead, it is used to display a comparison graph of two slides that have been chosen in advance. For example, if you know that you would like compare slide 3 to slide 4 in your presentation, instead of performing the comparison on-the-fly, you can select this type of slide and pre-set the slide to compare slides to 3 and 4.
For more information see Using Comparison Slides in the Advanced Features section.
ReviewA 'Review' type slide does exactly what its name implies. It reviews the results of a previously asked question. The most common use of a Review slide is immediately after a series of slides for which you do not display results.
For example, you may be asking people to rate each of ten items on a scale of one to five. During the presentation, you present all ten questions but don't display the results of any. You can of
Synthesis XP-IQ Page 17
course go back and review slides on-the-fly using the 'review' function. However, to make the presentation easier on the computer operator, you might instead place 10 'Review' slides after the original ten questions.
For more information see Using Review Slides in the Advanced Features section.
Demographic FilterLike the 'Comparison' and 'Review' slide types, the 'Demographic Filter' slide is designed to simplify the presentation by reducing keystrokes. If you know that during the presentation you will want to filter the results of one question by a demographic question, then rather than doing it on-the-fly you can preset the function by including a 'Demographic Filter' slide.
For more information see Using Demographic Filter Slides in the Advanced Features section
With the Slide Type selected, you should now set the other "Slide Options".
Slide OptionsWith your slide laid out the way you want it and the Slide Type set, you should now set your other Slide Options.
ScaleThe slide "scale" means "the number of response choices for this question". For standard slides, you must set the scale or accept the default scale. The reason is that for standard slides you type the choices in a text box on the slide. So, the system has no way of knowing what you have typed.
When you set the scale, you are also setting the labels for each bar/pie slice in the Results Graph.
For example, if you set the scale to "Yes/No" your bars will be labeled Yes and No. If instead, you set the scale to "1 - 2" your bars will be labeled as 1 and 2.
SummaryEnter a summary description for this slide. The summary is used when comparing slides (e.g. New Product, Technology, Case History 1, Safety Procedures, etc).
Note: you can select keywords in a textbox, right click, and click "Send To Summary" rather than type entries in this field.
ClockIf you would like to use a countdown timer on this slide, enter the time in seconds here.
Show MeanMark this checkbox to display the Mean Average as part of the Results Graph.
Show ResultsWhen running your presentation, the spacebar is used to advance the cycle. That is, spacebar brings up a slide and starts polling. Spacebar stops (or closes) the polling. Spacebar again, now displays the Results Screen. Spacebar once more, brings up the next slide.
Typically, you will "show the results" for most slides in your file, and so, you will leave this box checked. However, there may be some slides for which you don't want a Results Screen shown at all (e.g., rating a given presenter's performance.) In that case, uncheck this box. When running your presentation, the spacebar will advance to the next slide without showing results. You can always view the results later by selecting Review.
Correct AnswerIf there is a correct answer for this question, specify it here. Synthesis tracks the correct answer for both individuals, and teams.

Synthesis XP-IQ Page 18
PointsYou can assign up to 1000 points to a question. Generally, the tougher the question, the higher its point value would be. You will want to assign points if you have divided your audience into teams and they are competing for recognition, or prizes. But, you can also use this feature as a means by which to "weight" questions in a typical classroom setting. In doing so, you might find that two students each scored 85% correct on a quiz, but that student #2 achieved a higher point total because she got more of the "important" questions correct.
PeriodsHere's where you can add a whole new dimension to the scoring method and some additional excitement to your game or quiz. Assuming you have assigned a clock, correct answer, and points to this question, you can also specify a number of segments (periods) to split the clock into, up to a maximum of ten. So, let's assume you have assigned 100 points to the question and placed 30 seconds on the clock. Now let's assume you specify 5 periods. That means that each period (or segment) will be 6 seconds long (30 seconds divided by 5) and worth 20 points (100 points divided by 5).
So, anyone answering correctly within the first 6 seconds will score 100 points. Anyone answering correctly within the next 6 seconds will score 80 points, and so on, down to 20 points for a correct answer in the last 6 seconds. In this way, the highest scores go to the fastest correct answers.
CategoryIf you will be playing a Jeopardy style game, enter the slide category name. (See "Using The Game Board" in the Advanced Presentation Features of this document.)
Scale TransitionThis allows you to apply a transition to response choices. Please see "Scale Transitions" in the Advanced Features section.
Graph TypeNow select the type of graph to display. You will find that Synthesis' cylinder style graphs use gradient fills while bar graphs use solid fills. Also, you can set different graph colors for each question. To do this, simply right click on any bar to pop up the color picker. (You can also use Global Change to change all slides, or a range.)
Synthesis also allows you to use pictures as bar fills. Select the "Vertical Picture" or "Horizontal Picture" graph type. Then click the edit button. Browse for a picture for each bar and click OK. Now, make your choice for the "Build" and "Proportional" options.
Build On / Proportional On: This results in an animated graph where your image is stretched, and bars are varying heights. This is best when the image you are using displays well regardless of whether it may be stretched or squashed.
Build On / Proportional Off: This results in an animated graph where your image is stacked within a bar, and bars are varying heights. This is best when the image you are using displays well when stacked.
Build Off / Proportional On: This results in a non-animated graph with all bars proportional to the percentage. This is best when the image you are using displays well when stretched, but poorly when stacked.
Build Off / Proportional Off: This results in a non-animated graph with all bars the same height, even though the percentages differ (i.e., bars are not proportional in size to the percentage). This is best when the image you are using displays poorly when stretched or stacked.
BuildRegardless of the type of graph you select, you should choose whether or not to "build" the graph. That is, whether or not your bars will be animated.

Synthesis XP-IQ Page 19
Custom RevealSynthesis also allows you to 'reveal' the bars in a graph one at a time (rather than doing it automatically) to add suspense to your presentation. During the presentation (if this option is checked) the results screen will display as usual, except that bars for the graph are not yet shown.
The operator must then press the keyboard number "1" followed by ENTER to show bar number one, "2 ENTER" for bar number two, and so on.
Same AspectTypically, this option will be left unchecked. However, if you want to accomplish an effect for the presentation, whereby a graph seems to simply 'appear' as a part of the polling screen, check this box. When you do, all text on the polling screen is sized exactly the same on the Results Screen, and in the same exact position.
If your text has occupied more than the top half of the Polling Screen, it will surely overlap some part of the graph. If so, you should adjust the text.
When you run the presentation, the Polling Screen will be presented as usual. Then, stop polling and show the Result Screen, as usual. But since the top half of both screens are exactly the same, it will appear as though they were in fact a single screen that simply revealed a graph.
2/3By default, the text on your Results Screen is half the size of that it is on the Polling Screen. If you turn on 'Same Aspect' it will be 100% of the Polling Screen size. Selecting 2/3 will make the text 2/3's the size.
Custom LayoutIf you want full control over the results screen layout, check this option. Once you do, you can select any text box, picture, or graph and move or resize it. It is important to note that once you select a custom layout, the link between the Polling Screen and Results Screen is removed. So, changes to one will not update the other. Unchecking Custom Layout will re-establish the link.
Custom LabelUse this option to provide your own labels for the graph bars. With this item selected, click the adjacent "edit" button. Enter your label text. You can also change the label's font size to accommodate longer labels.
With your slide options set, you should now Add Slides To Your Presentation.
Synthesis XP-IQ Page 20
Adding Slides To Your PresentationIf you have not yet saved your file, you should now. We suggest that you save to folder called "Synthesis Masters" in your c:\ComTecXP-IQ folder. Once you save it, it will then save automatically every ten minutes.
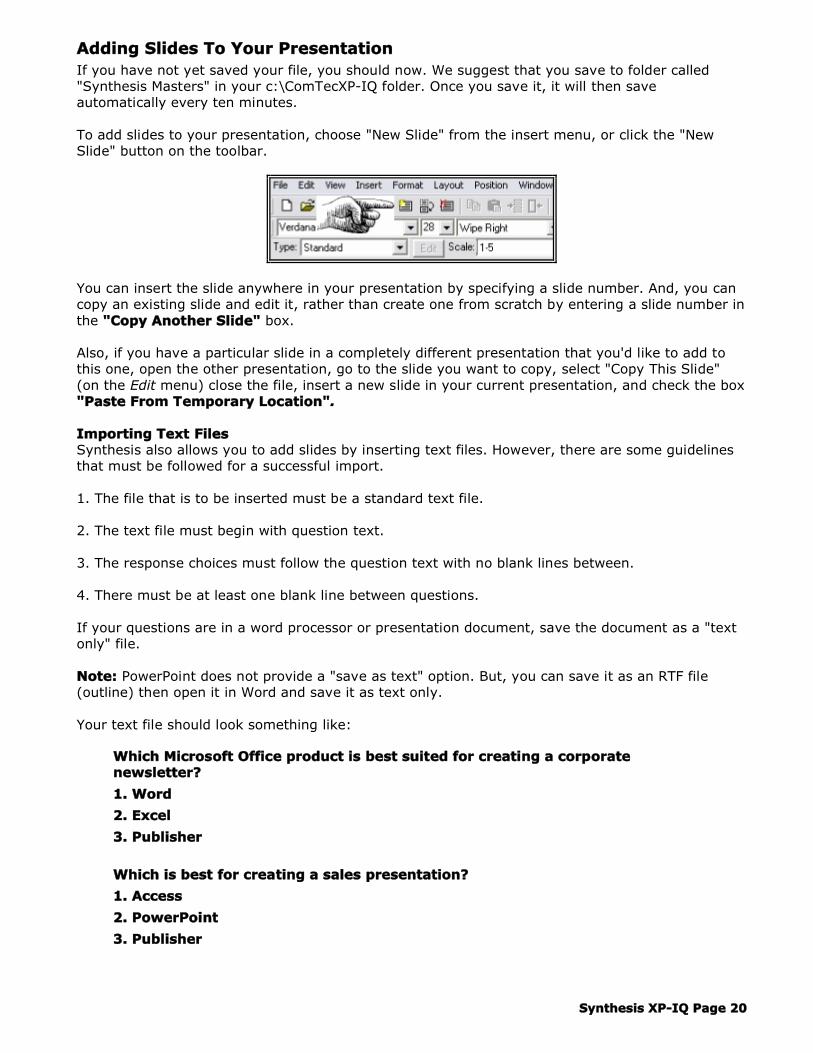
To add slides to your presentation, choose "New Slide" from the insert menu, or click the "New Slide" button on the toolbar.
You can insert the slide anywhere in your presentation by specifying a slide number. And, you can copy an existing slide and edit it, rather than create one from scratch by entering a slide number in the "Copy Another Slide" box.
Also, if you have a particular slide in a completely different presentation that you'd like to add to this one, open the other presentation, go to the slide you want to copy, select "Copy This Slide" (on the Edit menu) close the file, insert a new slide in your current presentation, and check the box "Paste From Temporary Location".
Importing Text FilesSynthesis also allows you to add slides by inserting text files. However, there are some guidelines that must be followed for a successful import.
1. The file that is to be inserted must be a standard text file.
2. The text file must begin with question text.
3. The response choices must follow the question text with no blank lines between.
4. There must be at least one blank line between questions.
If your questions are in a word processor or presentation document, save the document as a "text only" file.
Note: PowerPoint does not provide a "save as text" option. But, you can save it as an RTF file (outline) then open it in Word and save it as text only.
Your text file should look something like:
Which Microsoft Office product is best suited for creating a corporate newsletter?
1. Word
2. Excel
3. Publisher
Which is best for creating a sales presentation?
1. Access
2. PowerPoint
3. Publisher
Synthesis XP-IQ Page 21
From the insert menu, select "Insert Text File". In the dialog box, enter the name of the text file or browse for, and a slide number that it should be inserted after. Then click OK.
Importing Other Synthesis Presentation FilesThere may be times when you have slides in one presentation file that you'd like to use in another. Open the file that you'd like to add the others to. From the Insert menu, select "Presentation File".
Browse for the second file and enter a range of questions to insert. Click OK.
When you are finished adding slides, you should check your presentation for errors.
Checking Your PresentationWith your slides created, you should now check your presentation to be sure it lays out the way you want it, and that it is error free.
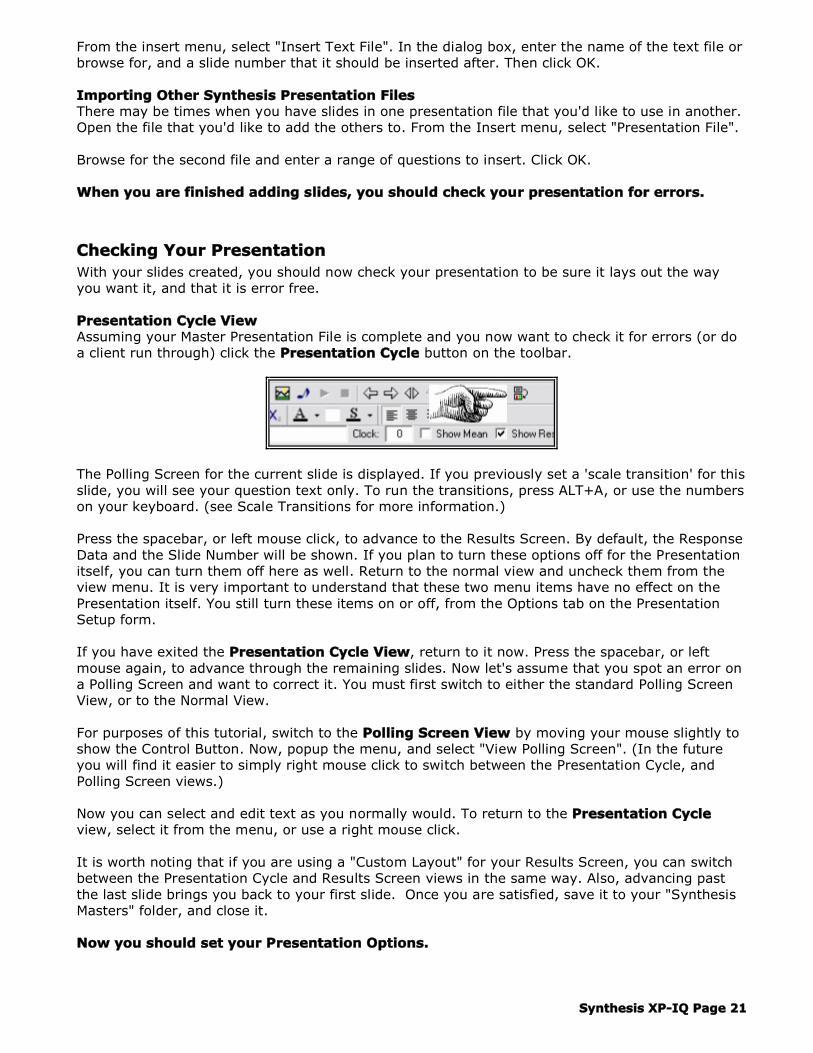
Presentation Cycle ViewAssuming your Master Presentation File is complete and you now want to check it for errors (or do a client run through) click the Presentation Cycle button on the toolbar.
The Polling Screen for the current slide is displayed. If you previously set a 'scale transition' for this slide, you will see your question text only. To run the transitions, press ALT+A, or use the numbers on your keyboard. (see Scale Transitions for more information.)
Press the spacebar, or left mouse click, to advance to the Results Screen. By default, the Response Data and the Slide Number will be shown. If you plan to turn these options off for the Presentation itself, you can turn them off here as well. Return to the normal view and uncheck them from the view menu. It is very important to understand that these two menu items have no effect on the Presentation itself. You still turn these items on or off, from the Options tab on the Presentation Setup form.
If you have exited the Presentation Cycle View, return to it now. Press the spacebar, or left mouse again, to advance through the remaining slides. Now let's assume that you spot an error on a Polling Screen and want to correct it. You must first switch to either the standard Polling Screen View, or to the Normal View.
For purposes of this tutorial, switch to the Polling Screen View by moving your mouse slightly to show the Control Button. Now, popup the menu, and select "View Polling Screen". (In the future you will find it easier to simply right mouse click to switch between the Presentation Cycle, and Polling Screen views.)
Now you can select and edit text as you normally would. To return to the Presentation Cycle view, select it from the menu, or use a right mouse click.
It is worth noting that if you are using a "Custom Layout" for your Results Screen, you can switch between the Presentation Cycle and Results Screen views in the same way. Also, advancing past the last slide brings you back to your first slide. Once you are satisfied, save it to your "Synthesis Masters" folder, and close it.
Now you should set your Presentation Options.

Synthesis XP-IQ Page 22
Step 2: Setting Presentation Options
Overview
The final step in creating a presentation is selecting which features you want turned on, and which you want turned off when the presentation is actually run.
You do this by opening the Presentation Setup form, filling in the blanks, and then saving the form. When it comes time to run the presentation, you will simply open the form and click "Run".
Important Note: If you need to copy your presentation to a different computer, you should first read the topic "Pack A Presentation".
To begin setting your Presentation Options, select "Run Presentation" from the Action menu. This opens the setup form. Fill it in as follows.
On The General Tab:
DescriptionEnter a description of this Presentation to help identify it later (e.g. Margaret Jones First Set of Questions.) The description entry is completely optional.
Master Presentation FileEnter the name of the Master Presentation file, or browse for it in the "Synthesis Masters" folder assuming that is where it was saved. Note: In most cases, you will enter a presentation filename, but even this is not required. If you do not select a Master, you must at least provide a name for the Synthesis Data File. Your presentation will then be completely impromptu.
Synthesis Data FileThis is where the votes from keypads are saved. If you selected a Master Presentation file, Synthesis will create a file with the same name, but with an "sdf" extension. You will use this file (along with the Session Presentation File) for reports. It is important to understand that your slides and your data, never get merged.
Synthesis XP-IQ Page 23
The slides are in one file, and the data is in another. Although you typically use them together, you have the option of editing them separately which may be necessary in preparation for combining multiple presentations.
Session Presentation FileThis file can be thought of as a "working copy" of your Master Presentation. It contains a copy of each slide in your Master, but also includes any Impromptus that you may have added during the Presentation.
It is extremely important to understand that once you start your presentation, this is the file that Synthesis presents from. So, if you end the presentation to make changes, you must make those changes to this file, not the Master.
If you do make changes to the SPF, you must know that you should never move slides, or add slides in the section of your file that has already been presented. So, if you have 50 slides, you then present slides 1 to 20 and then need to add a slide, it is fine to add it any place after slide 20. But, you must never add it before slide 20 or else slides will no longer align with their data.
It is also important to know that the Session Presentation File (along with the Synthesis Data File) is the one that is used for reports, not the Master.
Roster FileIf you have created a Roster file and want to display participant names when you show Individual Standings, select the file here. For more information on creating and using Roster files, see "Using a Roster" in the "Optional Synthesis Files" section of this document
Team FileIf you have created a Team file, name it here. For more information on creating and using Team files, see "Creating Team Competition" in the "Optional Synthesis Files" section of this document.
Sound PlaylistIf you have created a playlist and want to use it in this presentation, name it or browse for it here.
Keypad RangeThe default keypad number range is from 1 to 300. If you configured your base station for fewer keypads in order to allow the fastest polling time, the current range is shown.
Demo ModeIf you want Synthesis to simulate voting, check this box. The system will generate random responses, just as though you had people voting. This is especially useful when you are rehearsing. But, you must make certain that this box is unchecked when you start your "live" presentation.
Custom ColorSynthesis allows you to have one custom color associated with text. For more info please see the topic "Custom Text Color" in the Advanced Presentation Features chapter.
Display DimensionsIf you are sharing the screen with another device and your image overshoots the screen, you can reduce its size by adjusting the dimensions of your display.
Full Screen BackgroundIf you have reduced the size of your display, and you uncheck this option, your desktop or another open program is viewable.
View DisplayAllows you to view the display window that you have changed with "Display Dimensions" and "Full Screen Background".

Synthesis XP-IQ Page 24
While viewing the display screen you can resize it using the minus and plus keys. If it is smaller than your full screen, you can move it by using the arrow keys. The 'Home' key and 'End' key will toggle between placing the status box on the smaller display window versus the larger screen display. You can also set the location of the status box by pressing CTRL+ any arrow key. When you save your Quick File, the status box location will be saved as well.
Open Quick FileIf you have previously saved your setup to a Quick file, use this to easily re-load it.
Save Quick FileOnce you have selected your setup options, use this to save the Presentation Setup form. We suggest that you use the same base name for your MPF, SPF, and SDF. Synthesis will assign this "Quick" file an extension of *.qck. Be sure to note where you have saved it.
PackAllows you to pack your Presentation including all multi-media files, in preparation for moving to another computer. Please see "Pack A Presentation" in the Advanced Presentation Features chapter, for more information. Note: You must first save your Quick file, for this feature to be available.
Clear AllClears all of the selections made.
RunLaunches your presentation. If the Data File already exists, Synthesis will first ask whether you want to keep the data and start with the next slide, or delete it and start at the beginning.
On The Options Tab:
Opening MessageIf you wish to display a screen prior to seeing your Home Page, click the Opening Message checkbox. A full screen view is provided with a text box to enter your message. You can also insert one picture from the popup menu in the lower left corner. Right click anywhere on screen

Synthesis XP-IQ Page 25
for an options menu where you can change the background, and select a music file. When done, select OK from the popup menu.
Important Note: When in the presentation, press the ESC key to exit from your Opening Message.
Home PageIf you leave this box unchecked, Synthesis will display a black screen as your Home Page but it is still your Home Page, complete with status box and menu. To customize the look of your Home Page click the checkbox.
A full screen slide view is provided. Enter your text. For example, you could use, "The ABC Company Audience Response System." If your Presentation file uses a background different than the one shown, you can change it by clicking control button (lower left corner) and selecting Options.
You can also insert one picture, and assign one music file. Once you have started the presentation, press M at your Home Page to start and stop the assigned music.
Important: Once your presentation is launched, you can only end it from Home.
Login ScreenTo customize the text on your login screen, click the checkbox. A new screen opens for you to customize. Menu choices are available from the button in the lower left corner.
If you did not check 'Require Login' on the General tab, this option is unavailable.Custom Impromptu ScreenAllows you to customize the screen that is used for Impromptu slides. When you check this box, a full screen slide view is provided. Enter your text (e.g. Please Vote Now). From the Options menu, choose a font, the text color, and a background image. You can also, add a picture and assign music.
Ending MessageIf you wish to display an ending message, click on this check box. A full screen view is provided with a text box. Enter your text. Right click for an Options menu. You can also, add a picture and assign music. When done, select OK from the pop-up menu in the lower left corner.
Important Note: When in the presentation, press the ESC key to exit your Ending Message.
Use Left Mouse As SpacebarBy default, the spacebar is used to advance through the presentation. However, you can assign this function to the Left Mouse Button as well. This can be especially helpful if you are both the computer operator and the Presenter. A wireless mouse might then be used to run your presentation as you walk around the room.
Show Status Box ImmediatelyWhen you are polling keypads, the number of responses received is shown in the status box at the lower right corner of the slide. If you do not want this number shown, uncheck the Show Status Box option. During the presentation, you can show or hide the Status Box by pressing the letter "Z" on the keyboard.
Result DataSets the graph's bar label options for your Results Screen. For each bar the graph can show: the percent of votes; the number of votes; or both.
Show Slide NumberBy default, the slide number is shown as part of the Results Screen. This helps ensure that you do not lose your place. However, if you don't want the slide number shown, uncheck this box.

Synthesis XP-IQ Page 26
Operator ControlUse this for standard feature access, and for attended clock control.
Number Of ResponsesSynthesis allows you to automatically advance the presentation once a specified number of keypads have voted.
Once you have started the presentation, bring up the first slide as you normally would. When the specified number of votes is reached, Synthesis will either show the results (if this was checked in Slide Options) or save the results and present the next question (if "Show Results " was not checked in Slide Options").
At anytime during the polling, you can press the spacebar to stop. All standard operator options are then available.
Tip: Synthesis can automatically advance through the entire Presentation until it reaches the end with no operator intervention required, provided you use the autorun feature, or you do not show any Results Screens. This can be very powerful!
Autorun - Display ResultsThis allows you to assign a timer to your Results Screen so that the entire Presentation can be run without computer operator intervention. Please see, the "Presentation Auto Run" topic in the Advanced Presentation Features chapter, for more information.
Run Scale Transitions AutomaticallyIf you have assigned scale transitions in your Presentation, you can check the "Run Scale Transitions Automatically" option. When you do, assigned scale transitions will run as soon as the slide is presented.
Show Clock ImmediatelyIf you placed a clock on your slides, you have the option to show it immediately (as soon as the slide comes up) or to wait until you start it. If this is left unchecked, the clock will not start until you press "C" on the keyboard, or select it from the pop-up. To pause the clock during its countdown, press "C" again.
Movie / Music AutoplayWhen checked, movies and assigned music files will begin playing as soon as the slide is presented. When unchecked, movies and music will not play until the operator presses "M" on the keyboard or selects Play Movie or Play Music from the menu.
Require “Send” For All Votes Including Single DigitNormal keypad operation is such that when there are 10 or fewer answer choices, a simple press of any multi-digit responses are used, the Send key is required. Using the "Require Send ForAll" option maybe seen as being consistent for voters, as the send key will be always required.
Display Standard LCD PromptsThere are a number of standard prompts that can be sent to keypads that will help audience members in their voting. Check this option to utilize them.
Hot BackupWhen you run a presentation you have the option of naming a backup location. This is typically a folder on a second machine. As you run your Presentation, files are updated on both the main and backup machines simultaneously. Please see the topic "Hot Backup" in the Advanced Features section for more information.
Slide ComparisonDuring the presentation, if you compare two slides and choose not to display them side by side, they will be displayed as two series of bars. By default, the color for the first series is your 'bar number one' color and the color for your second series is your 'bar number two' color. You can

Synthesis XP-IQ Page 27
change the default however, by choosing different colors here.
Change System MessagesYou have the ability to change the standard, default Presentation messages such as "Slide," "Mean," "Total," and so on. This is especially useful if you are presenting to an audience that speaks a language other than English. Please see the topic "Change System Messages" in the Advanced Features section for more information.
Change Default OptionsDuring the presentation, Synthesis uses your Default Options for things like graph colors, and when comparing 10 slides, a background image. To be certain that the "right" colors and backgrounds for this Presentation are used, choose this option and set the choices accordingly.
Then, save your quick file. Synthesis will now always use these settings rather than the "current" settings, thereby eliminating any chance of displaying the "wrong" background or colors.
Moving Your PresentationIf you have created a presentation on one machine, and need to move it to another, it may be necessary to 'Pack' the presentation first. Presentation files are much like web files, in that they do not embed pictures, music, backgrounds, or video.
So, if your presentation includes only backgrounds, music, and photos that are installed with ComTec XP-IQ, you do not need to move these components because they will also be on the target machine.
But, if you inserted photos, movies, music, or other multimedia from other folders on your computer or your network, they will need to exist on the target machine in the same exact location.
The easiest way to do this is pack your presentation. Please see 'Pack A Presentation' in the Advanced Features section of this document.
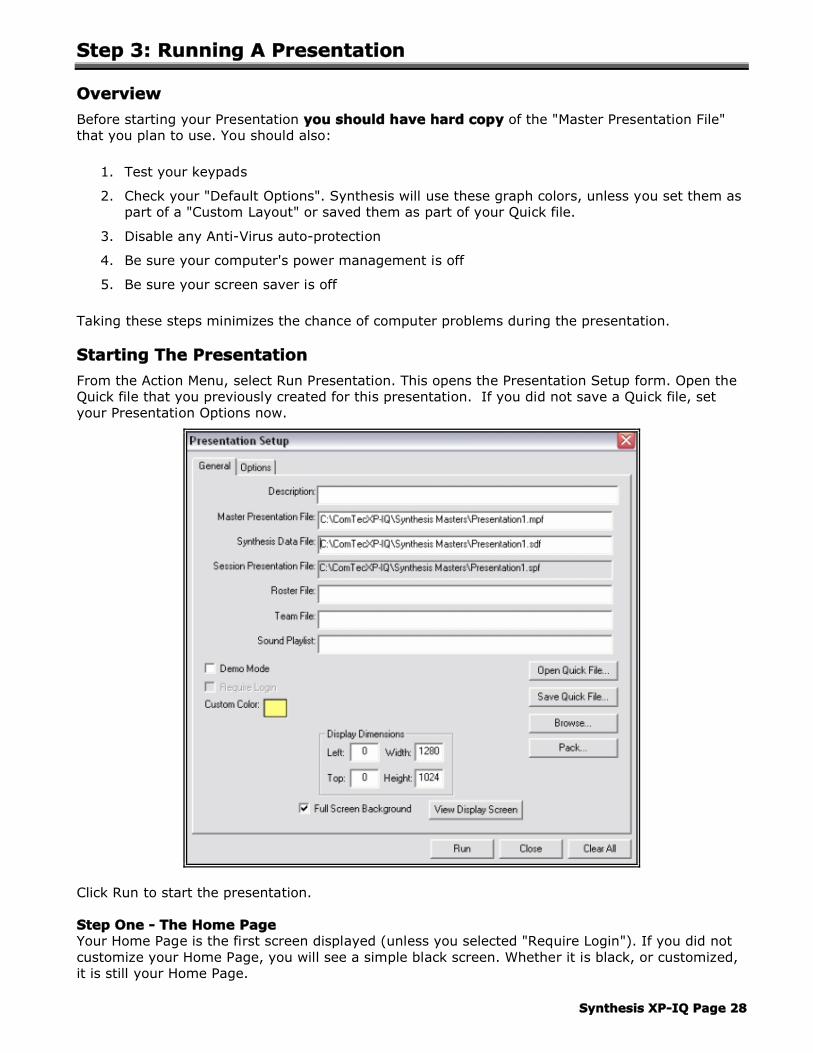
Synthesis XP-IQ Page 28
Step 3: Running A Presentation
Overview
Before starting your Presentation you should have hard copy of the "Master Presentation File" that you plan to use. You should also:
1. Test your keypads
2. Check your "Default Options". Synthesis will use these graph colors, unless you set them as part of a "Custom Layout" or saved them as part of your Quick file.
3. Disable any Anti-Virus auto-protection
4. Be sure your computer's power management is off
5. Be sure your screen saver is off
Taking these steps minimizes the chance of computer problems during the presentation.
Starting The Presentation
From the Action Menu, select Run Presentation. This opens the Presentation Setup form. Open the Quick file that you previously created for this presentation. If you did not save a Quick file, set your Presentation Options now.
Click Run to start the presentation.
Step One - The Home PageYour Home Page is the first screen displayed (unless you selected "Require Login"). If you did not customize your Home Page, you will see a simple black screen. Whether it is black, or customized, it is still your Home Page.

Synthesis XP-IQ Page 29
Move your mouse slightly to show the Control Button in the lower left corner of the screen. Click this button to pop-up a menu. Everything that you can do from Home is shown here, along with the keyboard shortcut. To collapse your menu, press ESC. To hide the button, press the letter "A" on the keyboard.
In the lower right corner of your Home Page is a status box. This tells you which slide number is next in queue. The status box is also shown when you begin polling for a slide. However, when you are in polling mode, the box shows the number of votes received. To hide the box during polling, press the keyboard letter "Z".
Note: From your Home Page, you can use the arrow keys to move the status box if needed. The box will retain this position for all slides. But if you close Synthesis completely, the status box will return to its default position.
Note: If you selected "Require Login" on the Presentation Setup Form, your login screen is the first screen to be displayed. For more information, see Using Login in the Advanced Features section.
Step Two - Polling a SlideFrom your Home Page, press the spacebar to present and start Polling the first slide. You, or your facilitator, should read the question aloud and ask the group to enter a choice. As responses are received, they are totaled and displayed in the status box.
In most cases, you can expect an eighty to ninety percent response rate. This is due to the fact that not everyone will want to respond to every question. If your presentation is quite lengthy, you may see participation drop to as low as fifty percent.
Things you can do while polling. . .
o If you assigned a scale transition and did not check 'run automatically' on the Setup -Options tab, use ALT+A to bring them all in, or press 1 through 10 then press Enter to bring in textboxes 1 through 10.
o If you assigned music to this slide and did not select "Music Autoplay" in your Setup Options, press "M" on the keyboard to start / pause it.
o If you assigned a clock to this slide and did not select "Show Clock Immediately" in your Setup Options, press "C" on the keyboard to start / pause it.
o If you want to show a list of keypad numbers that have not yet voted, press CTRL+N. Then tell the audience "If your keypad number is shown here, we have not yet received a valid vote from you." As soon as one of these keypads votes, its number is removed from the list. Press CTRL+S to return to the slide. (When using multiple base stations, use the keyboard letter A through O to display non-voting keypads on a given base station.)
Step Three - Close PollingOnce a sufficient number of responses are in, press the Spacebar to stop polling. The status box shows the word "Stop".
Things you can do once polling is stopped. . .
o If you want to save the results without showing them to the group, press the keyboard letter "N" or select Next Slide from the pop-up menu.
o With polling stopped, Synthesis allows you to edit your question. You may find this necessary if the audience feels the question is not right, or incomplete. Click on the text box that you want to change. If you are adding or deleting response choices, right click on the slide and change the scale. Press the spacebar to resume polling.
o If you want to cancel the results and re-ask the question, press the keyboard letter "L" or select Cancel from the menu. This will return you to your Home Page with this question next

Synthesis XP-IQ Page 30
in the queue.
o If you want to return to the polling mode (because you stopped to soon or someone wants to change a response, press the keyboard letter "C" or select Continue from the menu.
In most cases though, you will simply press the spacebar to show the results.
Step Four - Show The ResultsWith polling stopped, press the spacebar to display the results. Once the Results Screen is displayed, either you or your facilitator should offer some interpretation.
Things you can do from the Results Screen. . .
o If you assigned music to the Results Screen and if you selected 'Movie/Music Autoplay' in your setup options, the music clip will play automatically. However, it will play just once rather than repeat play as it does while polling. To stop or start your music, press "M" on the keyboard.
o If you selected "Custom Reveal" in the options for this slide, you will not see any bars. Press the number 1 on the keyboard followed by ENTER to reveal bar 1. Do the same for all remaining bars, in any order.
o To cancel the results and re-ask the question, press the keyboard letter "L" or select Cancel from the menu. This will return you to your Home Page with this slide next in the queue.
o Often times, group discussion of the topic will ensue. During this time, participants may need to focus on the original list of choices, or the graph. Use the Control Button's "Screen" menu to show the graph only, slide text only, or both (keyboard G, S, B).
o If you want to show the mean average and did not check it off in Slide Options, press CTRL+M, or select it from the menu.
o If you want to change or set the correct answer (e.g. "Number 3 is correct. We now have 750 employees") press ALT+1, or ALT+2, etc., for bars 1 through 10, using the '0' key for 10. To stop the flashing, press CTRL+M (which displays the mean average) and CTRL+M again.
o To show or hide the response data (actual number of votes for each choice) press CTRL+B for 'both percent and number of votes'. Use CTRL+P for percent only, and CTRL+N for number of votes only.
o If you previously set up a Comparison Graph, use the keyboard "X" to show or hide it. (see Using Comparison Graphs in the Advanced Features section)
o From the Options menu, you can insert an Impromptu, Jump to slide, or Review the results of a slide.
o From the Results Screen, you can filter the responses based on any number of Demographic questions that have already been asked. This is an extremely powerful tool. If you are unfamiliar with this, please see Using Demographic Slides.
o You can compare the results of this question with the results of another that you have already asked (e.g. "Now that we've discussed the topic, let's answer this question again and see if our opinion has changed.") Press "C" to select another question. If your percent labels happen to overlap, press "-" on the keyboard to reduce the size. For more information on comparing slides, see Compare Two in the Advanced Features chapter.
o Lastly, you can move or resize the graph. Click on it to select it, and adjust it as desired.
From the Results Screen, press the Spacebar to save the results and bring up the next slide.
Step Five - Go Through The Remaining SlidesIt is important to note that you can go through an entire presentation (present a slide, stop polling, show results, next slide) by pressing only the spacebar!
Synthesis XP-IQ Page 31
Step Six - End The PresentationWhen you reach the end of your presentation file, Synthesis will automatically bring you to your Home Page. The status box will show the word "END." From here, press "E" to end and return to Synthesis' main window.
Reviewing Slides and Jumping To SlidesAlthough you have created a Master Presentation and expect to present each slide in order, your facilitator may not be so accommodating. He may ask you to "back up" to the previous slide, or to "skip ahead" to a particular slide.
Fortunately, Synthesis allows you to do this with relative ease.
Reviewing SlidesIt is important to understand that in a Synthesis presentation, there is no such thing as "backing up" to a slide. Instead, you "Review" the results of a standard or demographic slide.
From the Results Screen of any slide (or from your Home Page) press "R" on the keyboard or select it from the pop-up menu. A navigation box is displayed. Use the up/down arrows to choose a slide number and press enter.
If you do not want the navigation box displayed, you can use the keyboard for a "blind" review. ALT+R followed by the Enter key will review the last slide presented. ALT+R followed by a slide number, then the Enter key, will review the specified slide.
Jumping To SlidesSynthesis allows you to jump ahead (or backward) to a specific slide. Most of the time you will be asked to jump ahead, skipping over a slide, or a group of slides.
To do this, press the keyboard letter "J" or select "Jump" from the pop-up menu. A navigation box is displayed. Use the up/down arrows to choose a slide number and press enter.
If you do not want the navigation box displayed, you can use the keyboard for a "blind" jump. ALT+J followed by a slide number, then the Enter key, will jump to the specified slide.
Once you jump to a slide, Synthesis will continue forward (when you press the spacebar) from that point on. But, you can also jump backward. You may want to if you jumped ahead because your meeting is running long, and then find that you now have time to ask the questions you jumped over.
If this is the case, just jump to the first slide in the group you skipped. Use the spacebar as you normally would through the rest of the slides in this group. (The spacebar always moves you forward.) Once you come to a slide that you've already presented, Synthesis will automatically jump over it, bringing you to the next slide that has not already been presented.
Impromptu SlidesAn Impromptu is a slide that you did not pre-plan, and therefore, did not include in your Master Presentation File.
During the presentation, you can insert an Impromptu at anytime. But, to access this feature you must be either at a Results Screen, or your Home Page.
Synthesis provides two methods for handling "unplanned" questions. One way is to create a new one from an existing slide and modify the text (called a Full Featured Impromptu). This may be practical in small meetings where participants want to word-smith the question, but not in large fast-paced meetings.

Synthesis XP-IQ Page 32
The second way is to verbalize the question while displaying a simple message like "Please Vote Now" (Quick & Easy Impromptu). Once votes are in, you display the Results Screen as usual. But, since you did not enter any text you will have a graph, only. This method is much faster, and clearly less painful if your typing skills are less than adequate.
Full Featured Impromptu QuestionFrom your Home Page or any Results Screen, select "Impromptu" from the Control Button, or use the keyboard letter "I".
Synthesis asks whether you want to copy another slide. Answer with "Yes" and enter the number of the slide that you want to copy. This slide can be a Standard or Demographic type.
It is usually best if you can toggle your display back to local (or put your projector in stand-by) so the audience does not see you typing the question.
In the text box, enter your new text. You can also change the slide type to Demographic. If so, use the edit button to insert or delete items.
Then, check the Scale, add a summary if you'd like, and click on OK.
Notes:
Your Results Screen will always be the Standard Layout, even if the original slide used "Custom."
Copying a slide also copies the original slide's background and music options.
The Quick and Easy ImpromptuFrom your Home Page or any Results Screen, select "Impromptu" from the pop-up menu, or use the keyboard letter "I".
Synthesis asks whether you want to copy another slide. Answer with "No".
The Slide Options bar will pop up. At a minimum, you must select a scale, or use the default value of 1-5. Enter a summary if you wish. Now click on OK, or press Enter.
Your "Custom Impromptu Screen" (created in the Presentation Setup Form) is displayed. If you did not create an Impromptu Screen, a default message "Please Respond Now" is displayed on the default background color, with no background image.
Certainly, this method is far quicker than the alternative of entering slide text. But, unless you take notes, you will have no record of the question asked. So, be sure to jot it down. After the presentation, you will find that a slide with no text has been automatically inserted in your Session Presentation file. You can add the text then.
If you need an Impromptu Demographic slide, you must use the Full Featured Impromptu method.
Important Note: While you are in your Presentation, Impromptu's are assigned numbers at the end of your file. So if you have 20 slides in total and ask an Impromptu after slide 10, your Impromptu is given the number 21. (In that way, your original numbering is not disturbed.) But when you open a report you will find the Impromptu in its "sequential" position. In this example, it will be number 11.
Comparing ResultsDuring the Presentation, there are three different ways to compare the results of two (or more) slides. One way is to compare the results of a given slide to a pre-determined data set that you entered when creating it (i.e., Planned Comparison). The second way is to compare the results to some other question that you have already asked (e.g. before and after discussion of a topic.) The

Synthesis XP-IQ Page 33
third way is to compare the results of up to ten questions, based on percent correct only.
Comparing Results To Pre-Determined DataPlease see "Using Comparison Graphs" in the Advanced Presentation Features section.
Comparing Results To Another QuestionWith the results of a question on screen, press "C" on the keyboard or select "Compare with" fromthe menu. Use the keyboard's up/down arrows to select the other question and press Enter.
Synthesis provides two series of bars. The first series is the data from the base question. That is, the one from which you initiated the compare. The second series is of course that of the second question.
If you used a summary description for each slide, it is shown in the color key. If not, the slide number is shown.
Note: If the bar label size is too large or too small, use the keyboard +/- to adjust it. You can also press "F" on the keyboard to choose a different font size.
This type of comparison is most often used to determine whether a group's knowledge level has moved any, as the result of discussion.
Comparing Results Of Up To Ten QuestionsIn order to compare up to ten questions, you must be at your Home Page. Press "C" on the keyboard or select "Compare" from the menu. Synthesis displays a box, asking you for a range of questions to compare, and whether or not you want them sorted.
Note: Demographic and Title Slides are not available. Also, only questions that have a correct answer can be compared.
Choose to include All, Even or Odd numbered questions (slides) in the range. If you choose Custom, you can pick individual slides from the list.
If you want the questions sorted based on percent correct, select "Ascending" or "Descending".
Now choose a demographic group, or use the default Total Group, and click "OK".

Synthesis XP-IQ Page 34
Using The Countdown ClockTo display a countdown clock for a given slide during the presentation, you must have assigned one to the slide itself.
Assigning a ClockOpen your Master Presentation File (or Session Presentation File) and navigate to the slide that will be assigned a clock. On the Options toolbar, enter the number of seconds.
Now click anywhere outside of the box, or press TAB. Synthesis will place a clock in the lower right corner of your Polling Screen.
Left click on the clock to select it. Then, right click for a menu. Choose to display a border, or not. Now select a fill effect. You can change the background color by clicking the "Background Color" swatch on the text format toolbar. You can also change the font type and size using the standard controls.
And of course, you can move and size the clock. If you want this exact layout on all slides, go to Global Change and select "Clock Layout."
During The PresentationThe first thing you need to do is decide whether you want your clock to start as soon as the slide is presented, or wait for the computer operator to start it. Most times, you'll want to wait for the operator. This gives the presenter time to read the question and then say something like "You have 25 seconds to respond, starting now".
If you want the clock to start immediately, check "Show Clock Immediately" on the Options tab of your Presentation Setup Form. Or, leave it unchecked to start it manually.
Assuming you left it unchecked and have launched the Presentation, bring up a slide that has a clock assigned.
Now, press "C" on the keyboard to start the clock, or select it from the pop-up menu. Pressing "C" again will pause the clock, leaving it on screen. If you want to "pause and hide" it, use a right mouse click. Right mouse click again to "show and resume" the countdown.
Once the countdown hits zero, Synthesis automatically closes polling. However, if "Show Results" was unchecked in the Slide Options, the presentation will automatically advance to the next slide.
Tip: If you do not need to show the Results Screen, you can set-up a clock and start the first slide. From that point on, Synthesis will automatically advance through the entire presentation until it reaches the end with no operator intervention required. This can be very powerful and is often used for classroom quizzes.
Note: At anytime during the countdown, you can press the spacebar to stop polling. All standard operator options are then available.
Ending The PresentationWhen you reach the end of your presentation file, Synthesis will automatically bring you to your Home Page. The status box will show the word "END." If you now press the Spacebar, Synthesis starts an Impromptu slide. If you do not want to go to an Impromptu, press "E" to end and return to Synthesis' main window.

Synthesis XP-IQ Page 35
Note: It is always a nice touch to have something like "Thank you for Participating" as your last slide. And of course, you can assign "walk out" music to it for a real professional close.
The very first thing you should do after ending is copy the Synthesis Data File (*.sdf) the Session Presentation File (*.spf) and Quick File (*.qck) to diskette. Typically, this is very important data to your organization. And so, care should be taken to safeguard it.
Since you have just ended a presentation, you can open any reports without first going to "Select Files".

Synthesis XP-IQ Page 36
Presentation Functions At A Glance
Print this page and keep it near you during your Synthesis Presentation.
Function Name Available From Shortcut
Go Home Any Screen Except Polling H
Show/Hide Menu Button Any Screen A
Show A Black Screen Home ESC
Next Slide Home / Results Screen N or Spacebar
Next Slide (Skip Results) Polling Stopped N
Team Scores for a Slide Results Screen / Polling Stopped T
Demographic Scores for a Slide Results Screen / Polling Stopped D
Team Standings Home / Results Screen CTRL+T
Demographic Standings Home / Results Screen CTRL+D
Individual Standings Home / Results Screen CTRL+I
Confirm Data Stream Polling Screen B
Continue Polling Polling Stopped C
Start/Stop Polling Music Polling Screen M
Start/Stop Results Music Results Screen M
Show/Hide Scanning Number Polling Screen Z
Start/Stop Clock Polling Screen C
Cancel Results Polling Screen / Results Screen L
Show/Hide Mean Average Results Screen CTRL+M
Show Percent/Number/Both Results Screen CTRL+P/N/B
Call List Home CTRL+L
Make Bar 1-10 Flash (Correct) Results Screen ALT+BarNumber (1,2,3...0)
Make Bar 11-20 Flash (Correct) Results Screen CTRL+BarNumber (1,2,3,..0)
Show Graph Only Results Screen G
Show Slide Text Only Results Screen S
Show Both Text & Graph Results Screen B
Show Non-Voting Keypads Polling Screen CTRL+N
Non-Voting in Group A-J Non-Voting Screen A-J
Return To Slide Non-Voting Keypads Screen CTRL+S
Show Comparison Graph Results Screen X
Compare Two Slides Results Screen C
Compare Ten Slides Home C
Review A Slide Home/ Results Screen R
Jump To A Slide Home/ Results Screen J
Insert an Impromptu Home/ Results Screen I
Adjust Team Points Home P
Show Game Board Home G
End The Presentation Home E
Synthesis XP-IQ Page 37
Helpful Tips
Here are a few tips from our support team.
o Correct Answer: To change the "Correct Answer" during the presentation, press ALT+BarNumber for bars 1-10 using 0 as 10 (CTRL+BarNumber for bars 11-20) at the Results Screen, or simply click on the bar. All scores will be re-calculated and the "new" correct answer will be saved in your Session Presentation file.
o Adjust Team Points: If you use a Quick file, any adjustments that you make to "Team Points" from the Home Page will also be saved when ending the Presentation. If you re-start the Presentation, continuing where you left off, the adjusted scores will be used. If you delete the data and start from the beginning, any adjustments are cleared.
o Impromptu Copy: If you want to simply ask a previous question once again (i.e., Before and After discussion) use Jump To. Synthesis will in effect, make an Impromptu copy of that exact slide and save it as a new one.
o Classroom Quizzes: If you do not need to show the Results Screen (which is normally the case for quizzes) you can set-up a clock and start the first slide. From that point on, Synthesis will automatically advance through the entire presentation until it reaches the end with no operator intervention required.
o Direct Demographic Cut: During the Presentation, ALT+D then Slide Number, "." Group Number, Enter (e.g. ALT+D, 3.2, Enter) will display a histogram for that that group only.
o Full Implementation of Show-No Vote: Show-No Vote is now supported for any number of keypads in a Presentation. However, the screen is limited to displaying 216 keypads at a time, per base station. As votes come in for the first 216, any keypads from 217 and higher will begin to appear. If you have more than one base station, press the letters A through J to display keypads on the corresponding base station.
o Transition / Build: You can now assign both a transition and a build to the Results Screen.
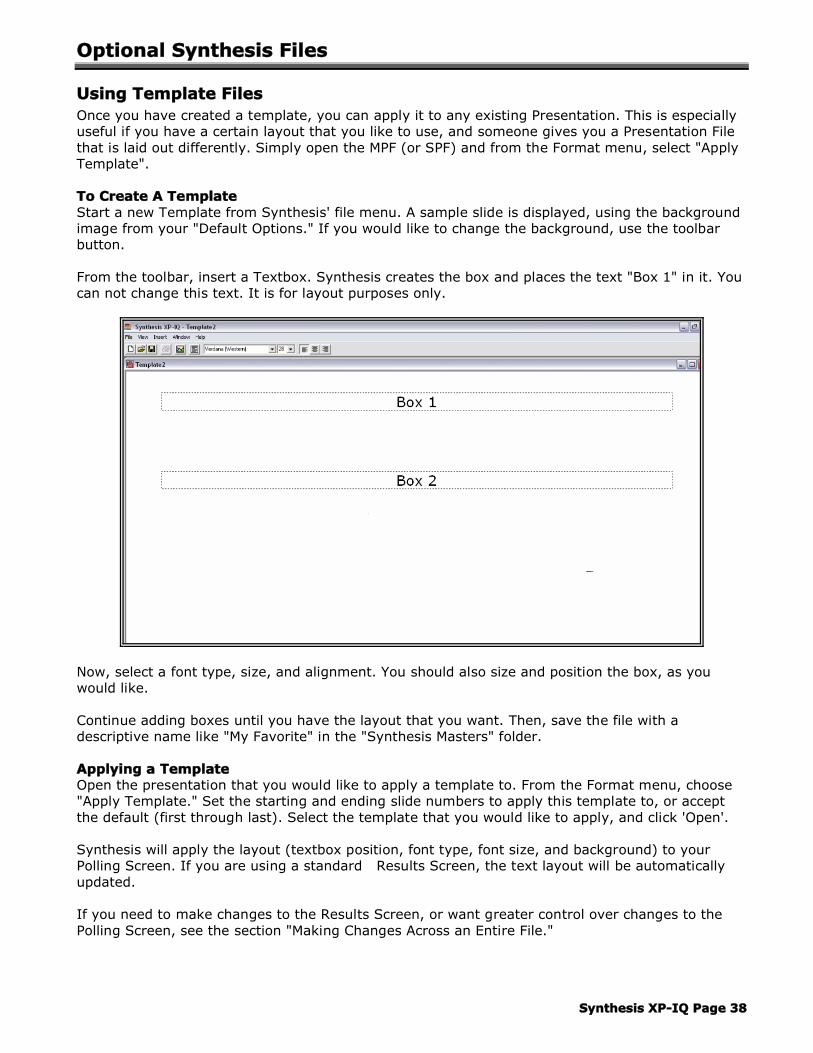
Synthesis XP-IQ Page 38
Optional Synthesis Files
Using Template FilesOnce you have created a template, you can apply it to any existing Presentation. This is especially useful if you have a certain layout that you like to use, and someone gives you a Presentation File that is laid out differently. Simply open the MPF (or SPF) and from the Format menu, select "Apply Template".
To Create A TemplateStart a new Template from Synthesis' file menu. A sample slide is displayed, using the background image from your "Default Options." If you would like to change the background, use the toolbar button.
From the toolbar, insert a Textbox. Synthesis creates the box and places the text "Box 1" in it. You can not change this text. It is for layout purposes only.
Now, select a font type, size, and alignment. You should also size and position the box, as you would like.
Continue adding boxes until you have the layout that you want. Then, save the file with a descriptive name like "My Favorite" in the "Synthesis Masters" folder.
Applying a TemplateOpen the presentation that you would like to apply a template to. From the Format menu, choose "Apply Template." Set the starting and ending slide numbers to apply this template to, or accept the default (first through last). Select the template that you would like to apply, and click 'Open'.
Synthesis will apply the layout (textbox position, font type, font size, and background) to your Polling Screen. If you are using a standard Results Screen, the text layout will be automatically updated.
If you need to make changes to the Results Screen, or want greater control over changes to the Polling Screen, see the section "Making Changes Across an Entire File."
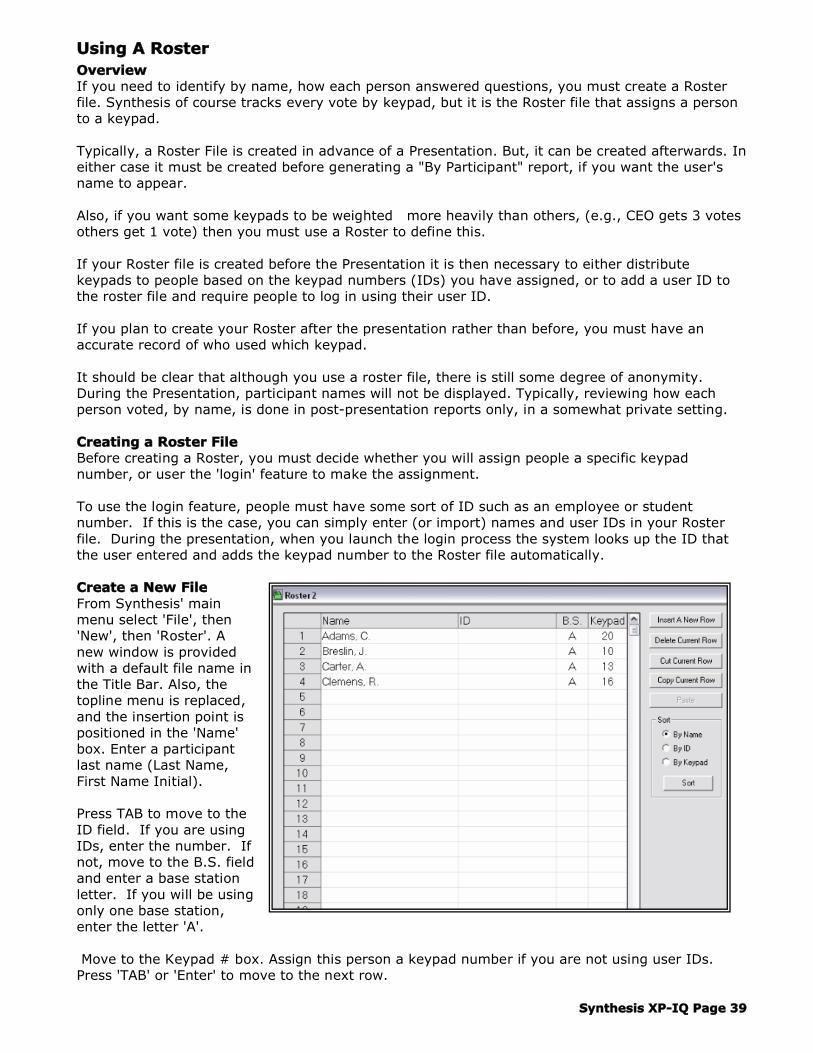
Synthesis XP-IQ Page 39
Using A RosterOverviewIf you need to identify by name, how each person answered questions, you must create a Roster file. Synthesis of course tracks every vote by keypad, but it is the Roster file that assigns a person to a keypad.
Typically, a Roster File is created in advance of a Presentation. But, it can be created afterwards. In either case it must be created before generating a "By Participant" report, if you want the user's name to appear.
Also, if you want some keypads to be weighted more heavily than others, (e.g., CEO gets 3 votes others get 1 vote) then you must use a Roster to define this.
If your Roster file is created before the Presentation it is then necessary to either distribute keypads to people based on the keypad numbers (IDs) you have assigned, or to add a user ID to the roster file and require people to log in using their user ID.
If you plan to create your Roster after the presentation rather than before, you must have an accurate record of who used which keypad.
It should be clear that although you use a roster file, there is still some degree of anonymity. During the Presentation, participant names will not be displayed. Typically, reviewing how each person voted, by name, is done in post-presentation reports only, in a somewhat private setting.
Creating a Roster FileBefore creating a Roster, you must decide whether you will assign people a specific keypad number, or user the 'login' feature to make the assignment.
To use the login feature, people must have some sort of ID such as an employee or student number. If this is the case, you can simply enter (or import) names and user IDs in your Roster file. During the presentation, when you launch the login process the system looks up the ID that the user entered and adds the keypad number to the Roster file automatically.
Create a New FileFrom Synthesis' main menu select 'File', then 'New', then 'Roster'. A new window is provided with a default file name in the Title Bar. Also, the topline menu is replaced, and the insertion point is positioned in the 'Name' box. Enter a participant last name (Last Name, First Name Initial).
Press TAB to move to the ID field. If you are using IDs, enter the number. If not, move to the B.S. field and enter a base station letter. If you will be using only one base station, enter the letter 'A'.
Move to the Keypad # box. Assign this person a keypad number if you are not using user IDs. Press 'TAB' or 'Enter' to move to the next row.

Synthesis XP-IQ Page 40
Continue this for all participants. Once completed, note that you can sort the list by name, ID, or Keypad number.
If you need to delete entries, simply click in the row and then click the Delete button.
Inserting a Roster List From Another SourceSynthesis XP-IQ allows you to insert a roster list from another source, provided you follow some basic formatting rules.
The file to be imported must be TAB delimited, ASCII text. Virtually all databases, spreadsheets, and word processors can save data in this format.
The file MUST contain a header row with the words Name, ID, B.S., Keypad and Weight in the first five columns.
Each 'record' must be on a separate line.
The easiest way to do this is to open the Excel file 'Master Roster.xls' which has been installed to your Synthesis Masters folder and to then save it as TAB delimited text once names have been added.
The file you are inserting should look similar to this if you are not using Login:
Name ID B.S. Keypad
Steinway, Robert G. A 1
Johnson, Kelly A 2
Woods, Tiger A 3
Mays, Willie A 4
The file you are inserting should look similar to this if you are using Login:
Name ID B.S. Keypad
Steinway, Robert G. 397604 A
Johnson, Kelly 149269 A
Woods, Tiger 192131 A
Mays, Willie 724591 A
With all entries made, save the file using a new name, and select 'Text (Tab delimited)' as the file type. Now with a new Roster file open, select 'Insert' from the menu, browse for the file you just saved, and select it.
Once you have completed your roster, click File, then Save.
Creating A PlaylistAs you know, Synthesis allows you to assign Polling Screen music on a slide-by-slide basis. Obviously, this is necessary if you want a specific music track to go along with a specific slide. But, if you want Synthesis to pick music for you, use a playlist.
Creating The FileFrom Synthesis' main menu, select File, New, Playlist. Add sound files by browsing for them. To place them in a specific order, use the "Add After" and "Add Before" buttons.
Then, save this file in your Music folder with an easily identified name like "Easy Listening" or "Soft Rock".
Synthesis XP-IQ Page 41
Using The PlaylistWhen you run your Presentation, be sure to name your playlist. Synthesis will play each track in order, assigning them "on-the-fly" to each slide. Any slides that have a "Specific Assignment" will use that assignment rather than the playlist.
If you have more slides than there are tracks, Synthesis will simply run through the playlist again.
Also, if you end your Presentation and re-start it, Synthesis will pull music from the bottom of the list working its way up rather than from the top, down.

Synthesis XP-IQ Page 42
Creating Team Competition
OverviewSynthesis provides two different ways for you to easily create teams. The more robust method is to pre-assign keypads (and therefore users) to Teams using a Team file.
However, it is possible to have users assign themselves to Teams (on-the-fly) by responding to a Demographic question. This second method is more convenient when setting up the system, but is somewhat limited in Presentation features.
The Team File Approach, Pre-AssignedThis approach is both flexible and feature rich, but it requires some up-front planning and work. The basic concept is that you create a Synthesis Team file, whereby you assign groups of keypads to Teams, giving each Team a name and assigning a Team color. You then name this file in your Presentation Setup form, and can customize the screen that is used for displaying the "Team Standings."
Once you are in the Presentation, you use the keyboard letter "T" to show how your teams scored on a given question and CTRL+T to show the cumulative Team Standings (using the screen you customized in the Presentation Setup.) This approach also allows you to show cumulative scoring for keypads within a given team. So, you can give prizes to the Top Individual Overall, The Top Team Overall, and the Top Individual Within The Top Team!
Step 1 - Create A Team FileFrom the main menu, select "File, New" and then "Team File." A new window opens ready for you to begin creating teams.
Enter the name of a team such as "Sharks" or "Table 1" or "Red". Enter a range of keypads assigned to this team (e.g., 1-20). You can also enter multiple ranges and/or specific keypad numbers by putting a comma between them. For example, the Sharks may be assigned keypads: 1-20, 205-215, 223, 245. This capability makes it easy to handle last minute additions to your teams.
Synthesis XP-IQ Page 43
With keypads assigned to this team, pick a color that will be used for the team's bar when displaying standings, or scoring for a given question. Keep in mind that the graph on your Results Screen also has colors. To avoid confusion, it is best to use Team colors that are very different from your Results Screen graph colors. Or, you can use a picture (e.g. $100 bill) as the bar fill for the Results Screen.
Once you have assigned a color to this Team, click the "Add "button. Repeat this for additional teams. When done, save the file in your Synthesis folder and close it.
Step 2 - Customize the Team Standings ScreenThis step is completely optional, but is clearly worth the few minutes that it takes to set it up. Open the Presentation Setup form, load your Quick file, click inside the Team File box, and browse for the file you just created. Then go to the Options tab. Click on the "Custom Team Standings Screen" item.
When you do, the default layout is shown. You can change the title (e.g. "Here's How Teams Are Doing") and you can right click inside the box to pop up an edit menu.
You can also, move and size the graph. And, from the popup menu, you can add a picture and position it anywhere on the screen. Now, right click anywhere on screen to open an options box. Choose the type of graph, and whether or not your Teams should be sorted in descending order. If this is left unchecked, Teams will always be shown alphabetically.
Then select the number of Teams to display per page (screen) up to a maximum of 20. If you choose to display more than 10 at a time, your graph labels will probably be too large. Click the "Graph Font" button to choose a smaller size.
If you'd like, you can also select a different background image for your standings. And, you can assign music to this screen. When done, choose "OK" from the Control Button menu in the lower left corner. Now, save your Quick file.
Step 3 - Issuing keypadsBefore your meeting begins, you must get keypads in the hands to the right users. This is often done as part of the meeting's registration process. As people register, you can hand them a keypad for the Team that they are assigned to. As an alternative, you can simply put keypads on tables (sorted by Team) near the meeting room entrance. People can then just go to their Team table, and get a keypad.
As for seating, you can put Team members together, or have a mix of Teams at each table. From a system operational view, it does not matter.
Step 4 - Showing Team Scoring and StandingsThere are a number of different Presentation "flows" that you can use. Here, we'll outline the most common. First, you should present a warm-up question or two. Then, ask a demographic or two. Now tell the group that you are ready to play the game.
Poll the first question, and show the Results Screen as you normally would. Your "MC" should say something like "Well okay, 57% of us chose number three. Let's see the correct answer." Now, assuming that "Show Answer Immediately" was unchecked in your Setup Options, press the spacebar to show the correct answer.
With the correct answer flashing, the MC should say "OK, let's see how our Teams scored on this one." Press the keyboard letter "T" to show scoring. If you have more teams than are shown, use the page down key to show the others.
Once the audience cheers have quieted, press the spacebar to present the next slide, repeating the same process as above. After three questions, the MC should ask for the Team Standings. Press CTRL+T to display your Custom Team Standings Screen. (Tip: You can put a Title Slide in this spot that says "Let's See How We're Doing". This will help to queue the MC.)
Synthesis XP-IQ Page 44
Continue through the game, showing Team Standings after every three or four questions. Normally, it will take about 45 minutes to get through about twenty questions. When you reach the end, use CTRL+I to display the Top Individuals by keypad number. Press "W" on the keyboard to flash the winner. (If you used a Roster, participant names are shown.)
Now, show the Team Standings again and press "W" on the keyboard to flash the winning team. Award a prize to each member. Then if you'd like, press CTRL+I again and select the winning team from the list. This displays the Top Individuals within the Top Team. A special gift is well deserved. Press "W" to flash the winner.
How Scoring WorksPoints are awarded to teams by multiplying the Team Percent Correct, by the point value assigned to the slide. However, it is important to understand how Synthesis arrives at the "Team Percent Correct". Let's assume that in the Team file, you assigned 10 keypads to the 'Sharks'.
When you start the Presentation, Synthesis expects to find 10 keypads on the Sharks team. But, let's say that one person on the team did not make the meeting. So, when you ask the warm-up question, only 9 of the 10 keypads respond. Synthesis automatically adjusts the Team size to 9. Now, if all 9 get a subsequent question correct, this team receives 100% of the points.
If now, the missing person shows up and starts voting, the Team size is recalculated and from that point on, the percent correct is based on 10 people. Taking this a step farther, if 2 members of the Sharks team need to leave the meeting, there is no methodology for accommodating this. Synthesis counts only correct answers from keypads that have responded to at least one question. So, if the remaining 8 people on the Sharks answered correctly, they would score only 80%.
Note: All teams score points based on the percent correct rather than a "winner takes all" basis. In this way, every team stays in the game and can overtake another by answering a high-value question, correctly.
The Demographic Slide ApproachIf you find that the pre-assigned Team File approach is too involved for your audience, you may be able to use the Demographic Slide approach. However, there are a few limitations you need to know about.
More than one keystroke is required to show slide scoring and cumulative standings
You can not show the top individuals within a given team
If you plan to award points for other team activities you can not add those points using the 'Adjust Team Points' feature, which is covered in the 'Advanced Features' section.
Step 1 - Create a Demographic SlideIn the Master Presentation file, create a slide that defines your Teams. It could be something like "Which Branch Office are you from?" or "Which is your favorite color?" or even "Pick a number from 1 to 10."
Step 2 - Issuing keypadsWith this approach, you do not need to issue keypads because the assignment will happen on-the-fly. However, if you will be giving prizes to individuals, you still need have some sort of label on the keypad that clearly shows its number.
Step 3 - Showing Team Scoring and StandingsAs with the "flow" described in the 'Team File Approach' topic, you should present a warm-up question or two. Then, ask your demographic that defines the Teams. Now tell the group that you are ready to play the game.
Synthesis XP-IQ Page 45
Poll the first question, and show the Results Screen as you normally would. Your emcee should say something like "Well okay, 71% of us chose number two. Let's see the correct answer." Now, assuming that "Show Answer Immediately" was unchecked in your Setup Options, press the spacebar to show the correct answer.
With the correct answer flashing, the emcee should say "OK, let's see how our Teams scored on this one." Press the keyboard letter "D" which pops up the "Select Demographic Slide" box. It will default to the first Demographic, and so if that is your Team question, just press ENTER. Team scoring is displayed.
Repeat this for additional questions, but after every 3 or so, press CTRL+D, Enter to show the cumulative standings. When you reach the end, show the Standings once more and press "W" to flash the winner.
Note: You can customize the look of your cumulative standings by selecting "Custom Demographic Standings Screen" on the options tab of the Presentation Setup form.
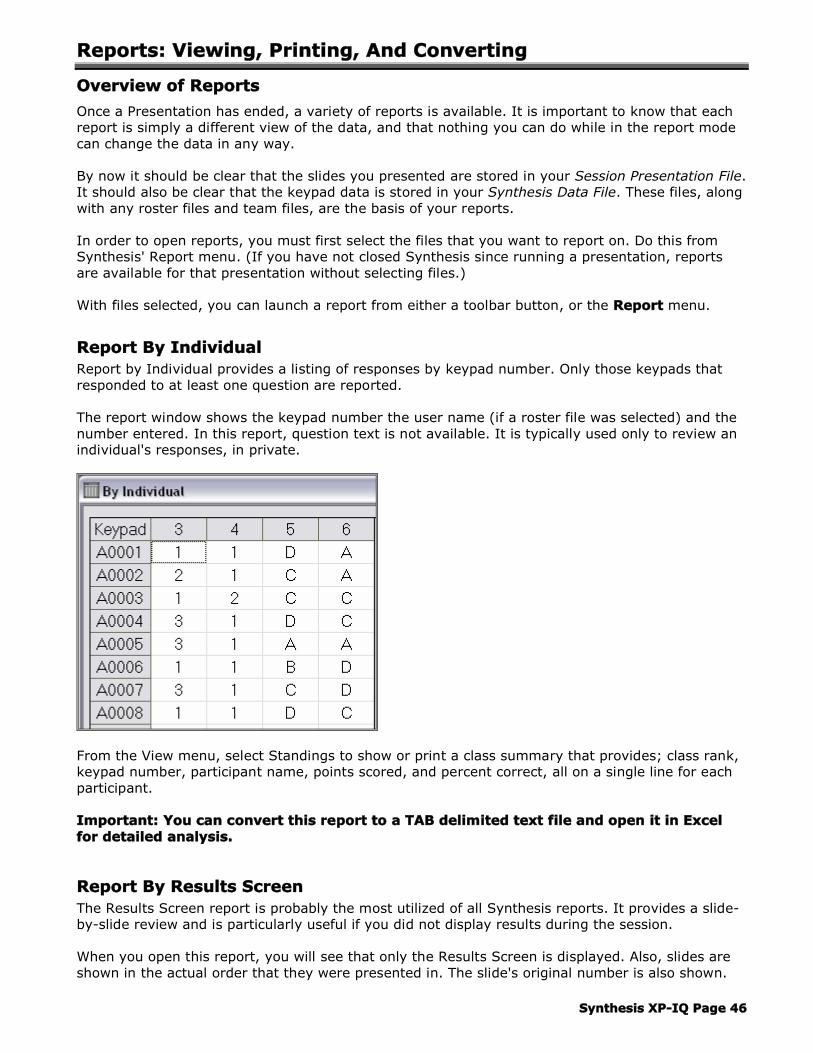
Synthesis XP-IQ Page 46
Reports: Viewing, Printing, And Converting
Overview of Reports
Once a Presentation has ended, a variety of reports is available. It is important to know that each report is simply a different view of the data, and that nothing you can do while in the report mode can change the data in any way.
By now it should be clear that the slides you presented are stored in your Session Presentation File. It should also be clear that the keypad data is stored in your Synthesis Data File. These files, along with any roster files and team files, are the basis of your reports.
In order to open reports, you must first select the files that you want to report on. Do this from Synthesis' Report menu. (If you have not closed Synthesis since running a presentation, reports are available for that presentation without selecting files.)
With files selected, you can launch a report from either a toolbar button, or the Report menu.
Report By Individual Report by Individual provides a listing of responses by keypad number. Only those keypads that responded to at least one question are reported.
The report window shows the keypad number the user name (if a roster file was selected) and the number entered. In this report, question text is not available. It is typically used only to review an individual's responses, in private.
From the View menu, select Standings to show or print a class summary that provides; class rank, keypad number, participant name, points scored, and percent correct, all on a single line for each participant.
Important: You can convert this report to a TAB delimited text file and open it in Excel for detailed analysis.
Report By Results ScreenThe Results Screen report is probably the most utilized of all Synthesis reports. It provides a slide-by-slide review and is particularly useful if you did not display results during the session.
When you open this report, you will see that only the Results Screen is displayed. Also, slides are shown in the actual order that they were presented in. The slide's original number is also shown.
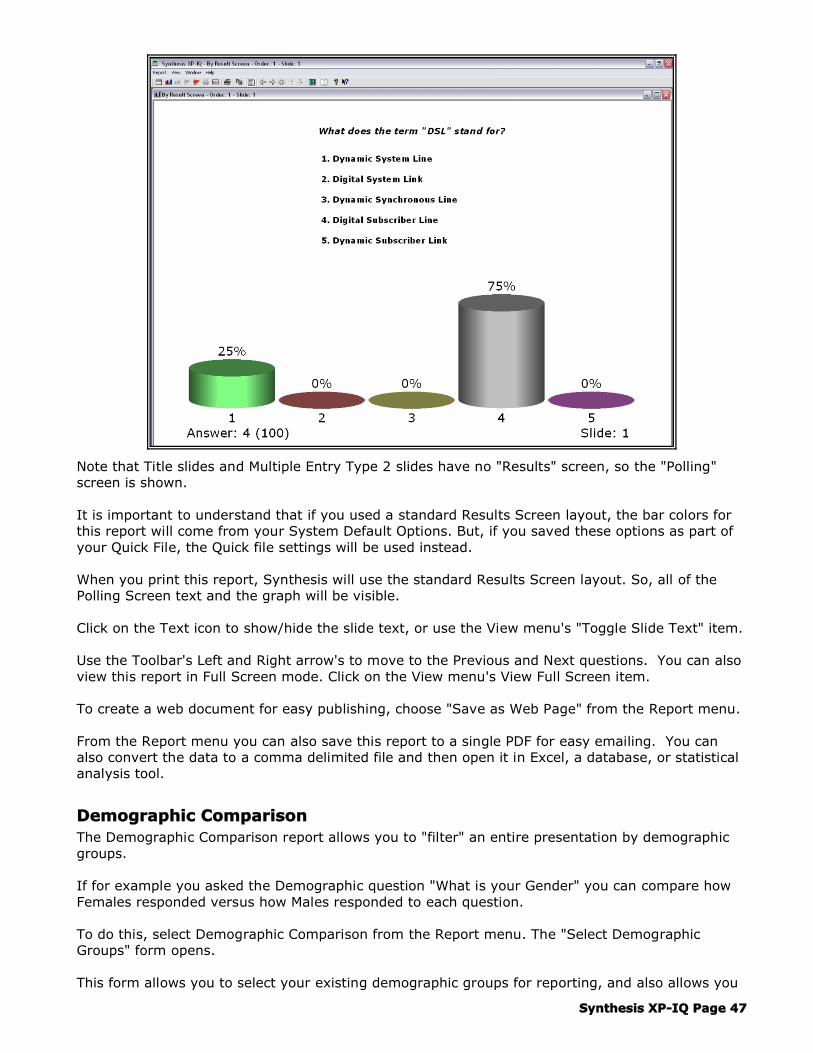
Synthesis XP-IQ Page 47
Note that Title slides and Multiple Entry Type 2 slides have no "Results" screen, so the "Polling" screen is shown.
It is important to understand that if you used a standard Results Screen layout, the bar colors for this report will come from your System Default Options. But, if you saved these options as part of your Quick File, the Quick file settings will be used instead.
When you print this report, Synthesis will use the standard Results Screen layout. So, all of the Polling Screen text and the graph will be visible.
Click on the Text icon to show/hide the slide text, or use the View menu's "Toggle Slide Text" item.
Use the Toolbar's Left and Right arrow's to move to the Previous and Next questions. You can also view this report in Full Screen mode. Click on the View menu's View Full Screen item.
To create a web document for easy publishing, choose "Save as Web Page" from the Report menu.
From the Report menu you can also save this report to a single PDF for easy emailing. You can also convert the data to a comma delimited file and then open it in Excel, a database, or statistical analysis tool.
Demographic ComparisonThe Demographic Comparison report allows you to "filter" an entire presentation by demographic groups.
If for example you asked the Demographic question "What is your Gender" you can compare how Females responded versus how Males responded to each question.
To do this, select Demographic Comparison from the Report menu. The "Select Demographic Groups" form opens.
This form allows you to select your existing demographic groups for reporting, and also allows you

Synthesis XP-IQ Page 48
to build new groups from the existing ones. But first, you'll need to know how to use the form.Screen OrientationAcross the top of the screen are five boxes. The first, third and fifth, each list your existing groups. The second and fourth allow you to use an "AND" function or an "OR" function to build a custom group.
Near the middle of the screen is a single line Text box, an Add button and a Clear button. The Text box is where you enter a name for a new demographic group that you build. "Add", adds the new name (and definition) to the "Selected" list. "Clear", clears the Text box.
Below the Text box is the "Selected" list box. Demographic group names and their definitions are shown here. Your reports are based on all groups listed in this box.
Clicking on "OK" displays the report. "Cancel" returns you to the Report Window. "Clear All", clears the Selected list. Print, prints the Selected list.
With a group in the "Selected" list highlighted, "View Group" displays a list of keypad numbers belonging to the group. This is very powerful, and covered in greater detail later in this section.
To Report On Existing Demographic GroupsSelect groups to compare from the First List Only (i.e., Sales, Operations, Human Resources, Finance) by clicking on each one. Then click on Add.
All groups selected are listed in the "Selected" list box, along with a definition (Sales = Sales, Operations = Operations, etc). Click OK. Your report is displayed.
To Create a new Demographic Group or CrosstabAssume that the following groups are our existing demographics.
Synthesis XP-IQ Page 49
FemaleMaleNortheastSoutheastNorthwestSouthwestCentralSalesHROperations
You can build a report that shows how "Females" from the "Southwest" who are in "Sales" responded. From the first list select Female. Leave the "And/Or" operator set to And. From the next list select Southwest, leaving the next operator also set to And. From the last list, select Sales.
In the "New Name" box enter a brief description like SWestSalesWomen. Click on “Add”. Your description along with its definition will appear on the Selected list.
You can change this by double clicking on it, modifying the name or definition, and adding it again. Create additional groups the same way (i.e., SWest SalesMen) and click OK to display the report.
You can also create a new group which combines two or three groups from the same question. Here, the Or operator is used.
To build a new group called Eastern Region, choose Northeast from the first list. Set the operator to "OR". Select Southeast from the second list. Enter the name "Eastern Region" in the New Name box and add it to the list.
Now build another group called Western Region. Choose Northwest OR Southwest. Add it to the list.
Then, from the first box, select Central. Add it to the list. You will now have a report showing the Eastern Region versus the Western Region versus the Central Region.
Important: When using crosstabs it important to understand the And/Or Operator.
Save As a PDFFrom the Report menu you can also save this report to a single PDF for easy emailing.
Viewing Group MembershipThere may be times when you want to quickly identify specific participants, based on a demographic profile. Let's assume that you are conducting Market Research for a new cola soft drink. And, let's assume you have 45 people in a focus group, each with a keypad. Your goal is to identify those people who drink cola at least 3 times a week, and who are 20 to 35 years old, and who also make the soft drink purchases for the household.
Run a presentation, asking those demographic questions. Then launch the Demographic comparison report, and create a crosstab called "Target" selecting the appropriate groups. Click "Add".
Now, select the new crosstab called "Target" and click the "View Group" button. Synthesis will display a list of keypad numbers belonging to the group called "Target."
You can then ask the people using these keypads to stay for Part II of the interview!

Synthesis XP-IQ Page 50
Slide Comparison
This report is used to compare the results of any number of slides based on Percent Correct. It is extremely valuable in determining which Slides were most often correct, and which were least often correct.
Selecting Slides To CompareWhen you launch this report, the Select Slides form will open. Enter a range of slides (from - to) to report on. By design, Demographic slides and Title Slides are not available.
Choose to include All, Even or Odd numbered questions in the range. Or, choose "Custom" to pick individual slides from the list.
If you want the selected slides sorted, select Ascending or Descending. Now choose to filter the results for a demographic group, or use the default "Total Group."
Click OK to display the report.
Up to 10 questions are displayed per screen. Use the Toolbar's Up and Down arrows to show Next and Previous pages.
Like most other reports, you can convert this to a comma delimited file. However, it can not be saved as a web page.
Team ComparisonThis report is used when teams have been defined using a Team file. Use the Toggle Text menu item to show or hide the question text.
Each Team is represented by a horizontal bar, and the length of the bar is based on either the percent correct, the points achieved, or the mean average for this Slide.
Up to 10 teams are displayed per screen. Use the Toolbar's Up and Down arrows to show Next and Previous pages.
From the normal view, use the toolbar's Left and Right arrows to move through the file. You can also show the final Team Standings by selecting Standings from the View menu.
With standings shown, select Ascending, Descending, or None from the View, Standings Sort menu to display the various sort options. And, like most other reports, you can view the comparison in Full Screen.

Synthesis XP-IQ Page 51
From the Report menu, you can also copy the current graph to your clipboard where you may then want to paste it to a word processor, or presentation document.
To create a web document for easy publishing, choose "Save as Web Page" from the Report menu.
This report may also be converted to a comma delimited file, from the Report menu.
Class ReportThis report provides a line graph summary of the entire session. It is especially useful in a classic learning environment. The "Y" axis shows the percent of the group or class. The "X" axis shows the percent correct, or the percent of points available in the session.
When you select this report, you are prompted to select which group to report on. The default selection is the Total Group. However, you may choose to report on only a single demographic group (i.e., those from the Eastern Region only, or those with Spanish as a first language). If you used Teams, you can instead report on a single Team. With your group selected, click OK. The report is displayed.
Keep in mind that Synthesis allows you to open multiple copies of the same report, but for different groups.
So, you can easily determine how Sales, Marketing, and HR scored as compared to the Total group. (Use the standard Window menu to Tile windows)
This can be very helpful to the educator who has a diverse class and is trying to determine whether the teaching method needs to be different for different groups.If points were assigned to questions, you can also view scoring based on points achieved. This provides a slightly different twist on things since more important questions were probably assigned a greater point value. If so, this report truly represents a weighted score. Educators might then find that Sales had the highest percent correct, but Operations had more of the really important questions right!

Synthesis XP-IQ Page 52
Converting Reports To Data FilesAll reports may be converted to Comma Separated Variable (*.csv) files by selecting this option from the Report menu. Synthesis will prompt you for a file name, and place it in the current folder.
The actual data that is written to the CSV file varies, depending upon the type of report that you converted. Once converted though, you can open it in a spreadsheet, database, or statistical analysis tool.
If you use Excel, open the file (as you would a spreadsheet) remembering that the data filename uses "csv" as its extension. Or, double click the file in Windows Explorer, or "My Computer."
It is important to note that only the data itself is converted, and that slide text is not. If you need the slide text too, open the presentation and select "Save as Text File". You then have two different files, one with text and one with data. You can then build a custom report using standard MS Office tools.
Publishing Reports To A WebSynthesis' "By Results Screen," "Demographic Comparison," and "Team Comparison" reports can be easily saved as Web pages. With the report open, select this option from the report menu.
You will be prompted for a filename. Once supplied, Synthesis will create a folder with this name and place the web document in the folder.

Synthesis XP-IQ Page 53
Editing and Combining Data Files
Editing a Synthesis Data FileIt is sometimes necessary to edit a data file, if for example you want to manually add votes for a user who may have left the room, or if you need to combine files that are not identical.
Synthesis also allows you to create a 'new' data file from the keyboard. This is useful if you conducted an employee survey whereby some employees used keypads, and some submitted paper. You can manually input the paper based responses, then combine the file with the keypad data, providing a consolidated set of reports.
To Edit An Existing Data File
From Synthesis' main menu, select 'Tools' then 'Synthesis Data File Maintenance'. Now choose "Open" and browse for the file to edit. Once selected, the "Edit Data File" box opens with the data for slide number one loaded.
To add votes from a keypad, enter a keypad number and a valid response in the appropriate boxes. Then click on "Done". It is added to the list. Click the "Next Slide" button and enter the data for slide number two. Continue this for all slides.
To change a keypad's response, double click on it in the list box. It will be copied to the Edit box. Make the change and click on Done.
If you need to change the correct answer or the point value of a slide, enter the new information in the appropriate field.
To delete an entire slide, simply mark the Delete box. Once you close the file, that slide will be deleted.
Important Notes:You cannot add a slide to an existing data file. But, you can delete one. Therefore, if you are preparing a file for combining and need to add a slide, your only choice is to delete the slide from the other files.
If you delete a slide from the Data File, you do not need to delete it from your Session Presentation File. If you open the Presentation file for editing, the slide will be in its original place. But, if you open a report using the file, that slide will not be shown. In fact, Synthesis assumes that you simply did not present the question.
Creating a New Data FileThere may be times when you want to create a new data file (e.g. from a paper based survey) in order to combine it with another data file, or to simply take advantage of Synthesis' powerful reporting features.
From Synthesis' main menu, select 'Tools' then 'Synthesis Data File Maintenance'. Now choose "New." The "Edit Data File" box opens, ready for you to begin adding data for slide number one. Specify a scale. Next, enter a keypad number and its vote. Then, click on "Done." Enter additional keypad numbers and votes in the same way.
If you are simply creating a paper based survey that did not include demographics, you can probably use Quick Change. This allows you to enter the total number of votes for each response choice.
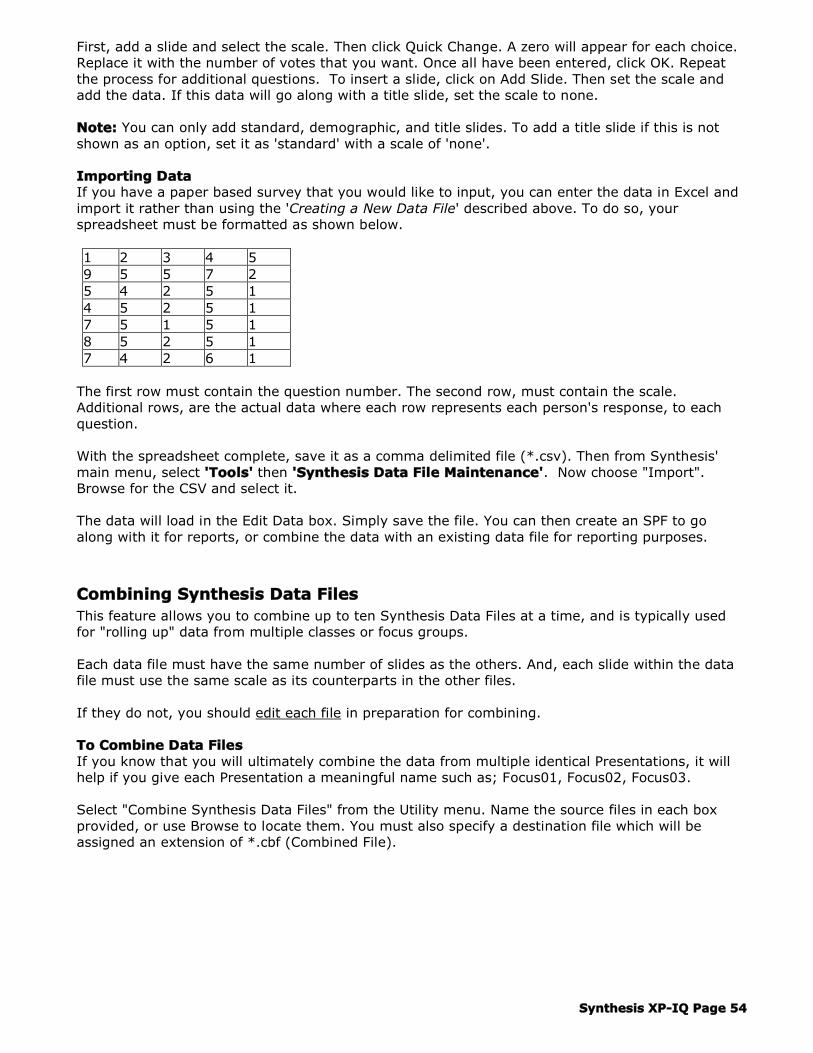
Synthesis XP-IQ Page 54
First, add a slide and select the scale. Then click Quick Change. A zero will appear for each choice. Replace it with the number of votes that you want. Once all have been entered, click OK. Repeat the process for additional questions. To insert a slide, click on Add Slide. Then set the scale and add the data. If this data will go along with a title slide, set the scale to none.
Note: You can only add standard, demographic, and title slides. To add a title slide if this is not shown as an option, set it as 'standard' with a scale of 'none'.
Importing DataIf you have a paper based survey that you would like to input, you can enter the data in Excel and import it rather than using the 'Creating a New Data File' described above. To do so, your spreadsheet must be formatted as shown below.
1 2 3 4 59 5 5 7 25 4 2 5 14 5 2 5 17 5 1 5 18 5 2 5 17 4 2 6 1
The first row must contain the question number. The second row, must contain the scale. Additional rows, are the actual data where each row represents each person's response, to each question.
With the spreadsheet complete, save it as a comma delimited file (*.csv). Then from Synthesis' main menu, select 'Tools' then 'Synthesis Data File Maintenance'. Now choose "Import".Browse for the CSV and select it.
The data will load in the Edit Data box. Simply save the file. You can then create an SPF to go along with it for reports, or combine the data with an existing data file for reporting purposes.
Combining Synthesis Data FilesThis feature allows you to combine up to ten Synthesis Data Files at a time, and is typically used for "rolling up" data from multiple classes or focus groups.
Each data file must have the same number of slides as the others. And, each slide within the data file must use the same scale as its counterparts in the other files.
If they do not, you should edit each file in preparation for combining.
To Combine Data FilesIf you know that you will ultimately combine the data from multiple identical Presentations, it will help if you give each Presentation a meaningful name such as; Focus01, Focus02, Focus03.
Select "Combine Synthesis Data Files" from the Utility menu. Name the source files in each box provided, or use Browse to locate them. You must also specify a destination file which will be assigned an extension of *.cbf (Combined File).
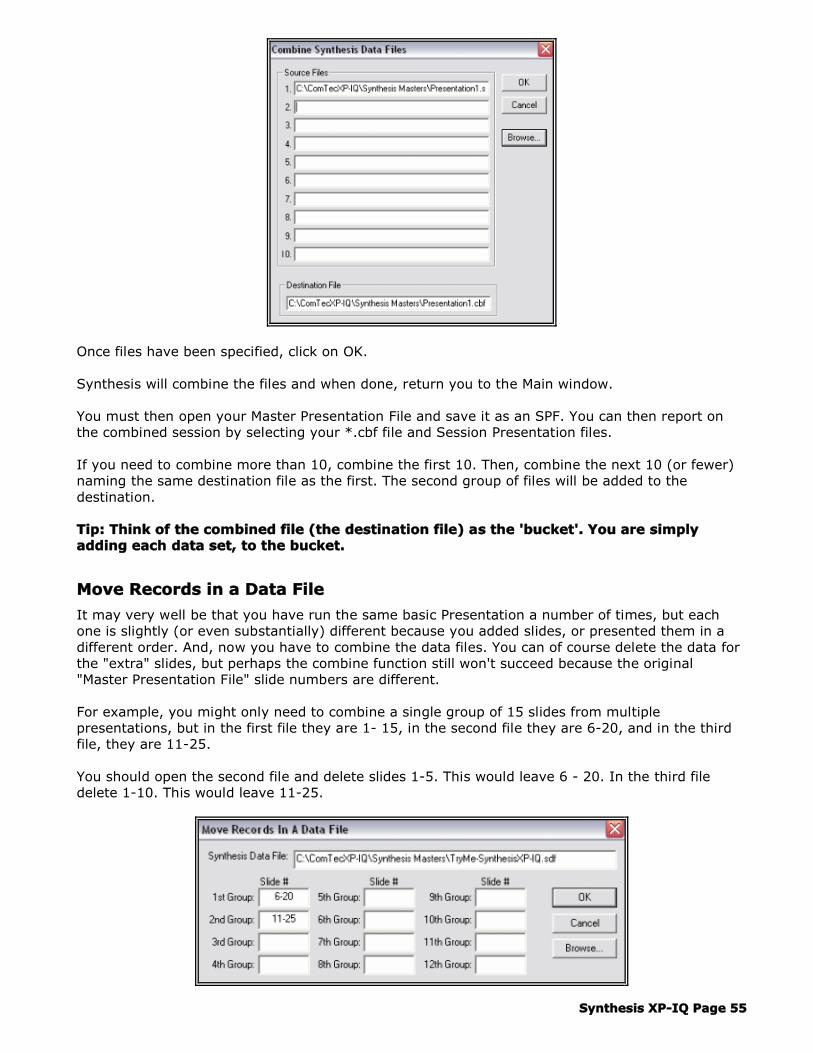
Synthesis XP-IQ Page 55
Once files have been specified, click on OK.
Synthesis will combine the files and when done, return you to the Main window.
You must then open your Master Presentation File and save it as an SPF. You can then report on the combined session by selecting your *.cbf file and Session Presentation files.
If you need to combine more than 10, combine the first 10. Then, combine the next 10 (or fewer) naming the same destination file as the first. The second group of files will be added to the destination.
Tip: Think of the combined file (the destination file) as the 'bucket'. You are simply adding each data set, to the bucket.
Move Records in a Data File
It may very well be that you have run the same basic Presentation a number of times, but each one is slightly (or even substantially) different because you added slides, or presented them in a different order. And, now you have to combine the data files. You can of course delete the data for the "extra" slides, but perhaps the combine function still won't succeed because the original "Master Presentation File" slide numbers are different.
For example, you might only need to combine a single group of 15 slides from multiple presentations, but in the first file they are 1- 15, in the second file they are 6-20, and in the third file, they are 11-25.
You should open the second file and delete slides 1-5. This would leave 6 - 20. In the third file delete 1-10. This would leave 11-25.
Synthesis XP-IQ Page 56
Once the extras are deleted from each, use the "Move records" function (Tools menu) to reassign slide numbers in the data file. Here are the steps to follow based on the example above.
1. Browse for and open the second file.
2. In the "1st Group" box enter 6-20.
3. Click OK. (slides 6-20 are renumbered as 1-15).
4. Browse for and open the third file.
5. In the "1st Group" box enter 11-25.
6. Click OK. (slides 11-25 are renumbered as 1-15).
7. You can now combine all three files.
There are 12 different groups available so that you can completely rebuild a data file in one step. For example, you could specify a new data file order as: 6-10, 1, 11-15, 2-5, 26, 16-25. The result would be moving the data sets and having them numbered 1-25.
Synthesis XP-IQ Page 57
Advanced Features
Adding Music, Pictures, Movies and ShapesYou can easily add music, pictures, movies and shapes to make your presentation more exciting. To play music and movies, Windows Media Player (a standard Windows component) must be operational.
MusicSynthesis can play music while your audience is voting, and then again, when you show results. For music while polling, you have two ways to assign sound files.
Specific AssignmentFrom the normal view, click anywhere on the Polling Screen to be sure it is selected. Then click the toolbar button that shows a single note. Browse for a music file and select it. Once selected, you can check it by using the Play and Stop buttons on the toolbar.
Playlist AssignmentRather than assigning music slide-by-slide, you can create a playlist. From the Synthesis' main menu, select File, New, Playlist. Add sound files by browsing for them. Then save this file with an easily identified name like "Easy Listening" or "Soft Rock". When you run your Presentation, be sure to name your playlist. Synthesis will play each track in order, assigning them "on-the-fly" to each slide. Any slides that have a "Specific Assignment" will use that assignment rather than the playlist.
Results Screen MusicSynthesis can also play music when you show Results. Click on the Results Screen in normal view to be sure it is selected. Then click the toolbar button that shows a single note. Browse for a musicfile and select it. Once selected, you can check it by using the Play and Stop buttons on the toolbar.
Important Note: When running a presentation, the Results Screen music will play just once. To stop the music, press "M" on the keyboard.
PicturesTo add pictures to your slides, select "Picture" from the Insert menu. Browse for the picture you want and click OK. Most popular image formats such as gif, jpeg, tiff, targa, bmp, wmf, pcx, and eps are supported. You will find that most animated gif's render correctly in Synthesis. However, some animations do not follow "standard" rules and therefore, may not render exactly as they would in a browser.
Note: All pictures have their original dimension ratios locked, regardless of placement or resizing.
MoviesTo add a movie, click anywhere on the Polling Screen to be sure it is selected. Select "Movie" from the Insert menu. Browse for the desired movie and click OK. Most popular movie formats are supported including avi, mov, mpeg-1, and asf, but this is solely dependent upon the version of Windows Media Player installed. Also, Macromedia flash (*.swf) movies are supported provided the computer has the flash player installed. Synthesis allows only one movie on a slide. And, it can be on the Polling Screen only.
All movies have their original dimension ratios locked, regardless of placement or sizing.
Also, when editing in the normal view you will find that there is a white border around all movies. In the Presentation itself (and in the Presentation Cycle View) this border is not displayed.
ShapesYou can easily add rectangular or elliptical shapes to accent text or other objects on your slide. From the Insert menu, select the Rectangle or Ellipse item. The shape is automatically inserted.

Synthesis XP-IQ Page 58
Right click on the shape to select a fill style. To change colors, select a new one from the toolbar's "background color" button.
Also, from the right-click menu, you can add text to the shape. Doing so creates a single object that you can easily move and size. To change the font type or size, select the text and choose the new attributes.
Making Changes Across An Entire PresentationSynthesis allows you to make changes across an entire presentation, or to a range of slides within a presentation. The simplest way to do this is to "Apply a Template". For information on how to apply a template, please see "Using Template Files" in the "Optional Synthesis Files" section.
Advanced users will want to take advantage of "Global Change, which offers far greater control over slide objects.
Before opening Global Change, you should decide whether you want to make changes to the Polling Screen, the Results Screen, or only specific text boxes.
If you need to change the layout for all objects on all screens, and you are using a Custom Layout, at least three steps are required. First, you will change the Polling Screen. Then, you will change the text portion of the Results Screen. And last, you will change the graph itself.
Making Changes To The Polling ScreenAssuming that you want to change all textboxes on all slides, navigate to a slide that has the most number of boxes.
Set the box position, font type, font size, and alignment for each box. Then from the Format menu, choose Global Change. Place a check next to "Text Layout" and specify a range of slides to apply this to. Click OK. All slides are now updated with your new format.
If you are using a clock and want it the same on all slides, select Global Change and check the "Seconds" and the "Clock Layout" options.
Making Changes To The Results ScreenIf you are using a standard layout, any changes made to the Polling Screen will be reflected on the Results Screen except for the slide background. To change the background for all slides (or a range) change it for the current slide. Then use Global Change to apply the change to all.
If you are using a Custom Layout, you can make changes to individual boxes as stated below. To change the graph, set it up the way you want it to look (size, position, type, colors, and so on). Then, with the graph highlighted, open Global Change. Place a check next to those items that you want changed, and click OK. Use the "Size & Position" command to set the graph's size and position.
Making Changes To Specific BoxesEach object on your slide is assigned an Object number. When you select an object, its number is shown in the titlebar. If you had two textboxes on each slide, the first would be Object 1 and the second would be Object 2.
If you want to change only Object 1 on all slides, set the box size, position, font, color, and alignment to the way you want. Then, with the object selected, open Global Change. Check the attributes that you want changed and click OK. Formatting is then applied to all Object 1's, on all slides in the specified range.
Repeat the process if you then want to change all Object 2's.

Synthesis XP-IQ Page 59
Using Demographic SlidesUsing demographic slides in your presentation can be a powerful tool in understanding why your audience feels the way they do, on a given issue. For example, if you were to ask the group how important "on-site" child care is you might find that overall, the group is neutral. However, if you then filter the results based on gender, you might find that for female employees it is "very important" whereas for males, it is "not at all important."
In order to do this "filtering" during your presentation, you must first have a slide that asks the group whether they are Female or Male. Then, at the Results Screen of any other question, choose "Demographic" from the pop-up menu or press "D" on the keyboard.
Creating a Demographic Slide in Your Presentation FileWith a Master Presentation file open, insert a new slide near the beginning of the file. Type the question itself (e.g., What is Your Gender?) in the first text box. Now, set the slide type to Demographic.
This opens the Demographic Description box. Enter the names of up to 10 demographic groups. It is important to understand that these group names are used during the presentation (and in reports) as labels for the bars when displaying filtered data.
With group names entered, click OK. Synthesis will place a text box on your slide and copy the group names to it. Your Demographic slide is now complete.
Important Note: If you need to make changes to the list, click the 'Edit' button next to the 'Demographic' Slide Type to open the description box again. When you click 'OK' you'll be prompted to 'Replace Object 2 - Text Box'. If your list that appears on the polling screen is in the 'Object 2' text box, select 'Replace' in order to copy your changes to the slide. Conversely, you can make changes on the slide and if the list is in 'Object 2' you can open the description box and click 'Reset'. This will copy your Object 2 list to the description box.
Filtering Results While Running Your PresentationSynthesis allows you to have any number of Demographic slides in your presentation. However, we do suggest that you use them sparingly if anonymity is important. The reason is that your audience may feel that you can "zero in" on an individual, if too much demographic information is collected. (It may be well known that I am the only Male in Sales from the NY Branch Office.)
Assuming you have two or three Demographic slides and that you are now in your presentation, go ahead and present the Demographic questions to the audience. Next, let's assume that you ask the question:
How important is On-Site child care to you personally?
1. Not at all important
2. Of very little importance
3. Neutral
4. Somewhat important
5. Very important
You then show the Results Screen. Since this is a continuous scale, it is best to also show the Mean Average. (If you did not select this option when you created the question, select it from the pop-up

Synthesis XP-IQ Page 60
menu, or press CTRL+M on the keyboard.)
Now, select "Demographic" from the pop-up menu, or press "D" on the keyboard. Use the up/down arrow keys to select the 'gender" Demographic slide and click OK, or press Enter.
Note: You can avoid showing the navigation box by pressing ALT+D followed by the slide number, and then Enter. Also, ALT+D (no slide number) and then Enter will select the most recently used demographic slide, or the first demographic slide if no filtering has been done as yet. Lastly, ALT+D then Slide Number, "." Group Number, Enter (e.g. ALT+D, 3.2, Enter) will display a histogram for that that group only.
Synthesis now displays the Mean average for each group associated with this slide. To view the histogram for group one only, press the keyboard #1. For group two, press #2, etc. To view all groups again, press ALT+D, Enter.
With all groups displayed, you can compare them based on how they voted, by selecting "Graph" and then "Show Detail" from the pop-up, or CTRL+S on the keyboard. You can also view the actual number of votes for each demographic group by selecting "Graph" and then "Show Response Data" from the pop-up, or CTRL+R on the keyboard.
To return to the original graph which was for the entire group, as a group, you must "review" the current question. Select "Options" then "Review" from the pop-up, or press ALT+R, Enter on the keyboard.
Of course, you can repeat this filtering with any of the other demographic slides that you have. In fact, you can filter by any other standard question as well. But, if you filter by a standard question, Synthesis will label bars as Group One, Two, etc, since there are no defined group labels.
Using Multi-Choice SlidesSynthesis includes a slide type that allows multiple correct answers. In the slide type dropdown box, select "Multi-Choice". The edit button next to it is now available. Click it and enter a summary description of each choice. Also, enter a point value for each.
If a given choice is considered incorrect, assign zero points. For the best (or most correct) you might assign 200 points. For a second best choice, you might assign 100 points. When you click OK, Synthesis creates a new box, listing the choices.
When you reach this slide in the Presentation, the audience will be prompted with the on-screen message "1st Choice." This will be followed by additional rounds of voting, depending upon the number of choices that you assigned points to.
Once voting has finished, a horizontal graph is displayed showing the cumulative percentage for each choice. That is, if a given item received 25% of the vote on round one, and 30% of the vote in round two, the total percent shown will be 55%.
Since this can be difficult for a Presenter to interpret on-the-fly, we suggest that once voting has been completed rather than show the results, show how teams scored ("T" on the keyboard) in terms of points. The most any one team can score, is the total number of points available for the question.

Synthesis XP-IQ Page 61
As with all other questions, the appropriate number of points is awarded to not only Teams, but to Demographic Groups, and Individuals. This can be a very effective "Tie-Breaker" if each of the possible answers is considered somewhat correct.
Using Comparison SlidesComparison slides are used to compare the results of two other slides. For example, if you know that you would like compare slide 3 to slide 4 in your presentation, instead of performing the comparison on-the-fly, you can insert a 'comparison' as slide number 5 and preset it to compare the two.
To do this, insert a new slide where you want the comparison to be. Obviously, it must be placed after the two slides you will compare. Now set the slide type to 'Comparison'. An options box is then displayed.
First choose whether to display the comparison as: one graph with two series of bars; two graphs side by side; or two graphs stacked vertically (top/bottom). If you choose the 'series' option, you can also set the colors for each of the two questions.
Next select the specific slides to compare and click 'OK'.
Synthesis inserts the new slide and shows how the graphs will lay out. (Although you see a 'Polling' screen, we know that keypads won't really be polled.)
You can resize the graph as you'd like. You can also add text boxes that explain to the audience exactly what they are looking at. And, you can add pictures, movies, or videos.
Very Important Note: If you move slides in your presentation file, and if those moves result in changing the numbering of the two slides you are comparing, you must update your comparison slide. It will not automatically update.
Using Review Slides'Review' slides do exactly what the name implies. They provide a review of the data for a question that has been already asked.
There are times when you might want to ask a series of questions and not show the results as you go along. But then, once the series is complete, you may want to go back and look at the results. Of course, the computer operator can do the reviews on-the-fly, but you may want to set up the file so the operator can simply 'spacebar' through or so that the presenter can click through the presentation.
To do this, simply insert a new slide and set the type to 'Review'. An options box will pop up. Specify the number of the slide to be reviewed.
Very Important Note: If you move slides in your presentation file, and if those moves result in changing the numbering of the slide you are reviewing, you must update your Review slide. It will not automatically update.
Using Demographic Filter SlidesLike the 'Comparison' and 'Review' slides, the 'Demographic Filter' slide does not actually poll keypads. Instead, it is used to display a specific demographic comparison at a specific point in the presentation.
Of course, the computer operator can execute a demographic filter on-the-fly, during the presentation. (See 'Using Demographic Slides' in the Advanced Features section.) But, you may want to set this up beforehand so that it happens automatically.
Before inserting a 'Demographic Filter' slide, you should have already created a 'Demographic' slide

Synthesis XP-IQ Page 62
and at least one other slide that you want to filter.
When you insert a slide and set it to 'Demographic Filter' you'll be prompted to specify the slide to filter, and the demographic slide that will be used as the criteria for filtering.
Very Important Note: If you move slides in your presentation file, and if those moves result in changing the numbering of either the slide to filter or the demographic slide that establishes the filter criteria, you must update your 'Demographic Filter' slide. It will not automatically update.
Using The Slide SorterWith a presentation file open, you can easily view all of your slides, move them, delete slides, change a background, or change a transition. Click on your Polling Screen to be sure it is selected. Then, from the View menu, select Slide Sorter. By default, Synthesis will display sixteen slides per screen (4x4). Press the number 2 on your keyboard to display 2 rows by 2 columns, the number 3 for 3 by 3, and so on up to 6 by 6.
Use the Page Up/Down keys to move a page at a time. Use the Arrow Up/Down keys to move a row at a time. Or, Right click in the area between slides to pop-up a menu.
Working With SlidesSelect a specific slide by Left clicking on it. To move it, drag it to a new location, and select move. To copy a slide, select it, and either right click to select copy, or drag it and select copy.
To delete a slide, make sure it is selected and press Delete from the keyboard. Or, Right click outside of its border and select Options, then Delete.
To select multiple slides, use CTRL + Left Click. You can then, delete them all (use the Delete key,) move them, or right click for Global Change and apply any changes to all selected slides.
To view a slide's transition, double left click it. To change the transition, make sure the slide is selected. Then, Right click and select 'Transition'.
To change a slide's background, make sure it is selected. Then, Right click and select Background.
To close the Slide Sorter, Right click in the area between slides and select View Normal or press the ESC key.
You can also view your Results ScreensFrom the Normal View, click on the Results Screen to be sure it is selected. Then, from the View menu, select Slide Sorter.
Although you can not move or delete slides from this view, you can change a slide's background, and view or change its transition. These items are on the right click pop-up menu under 'Options'.
Caution: It is important to remember that you are still in slide edit mode. So, the graphs that you see do not represent "real" data from keypads. They simply show the type of graph you selected, and its position.
Using Login
In order to use Synthesis' login feature you must:
1. Create a Roster file2. Include participant names in the Roster3. Include participant IDs (i.e., employee number, student number, social security number) in
the Roster4. Include the Roster file on the Presentation Options Setup form5. Check the 'Require Login' box on the Presentation Options Setup form

Synthesis XP-IQ Page 63
Assuming you have done all of the above, your Login screen will be displayed when you start the presentation, and the login process will be open. As audience members enter the room, they can be seated at any keypad and should then enter their ID and press the Send key.
As audience members successfully login with valid IDs, the status box increments showing the total number of people logged in.
To show a list of those people who are logged in, press the keyboard CTRL+L or choose "Show Logged In List" from the menu.
Important: All keypads whether logged in or not can vote on all questions. The benefit of logging in is that the roster file is automatically edited showing who used which keypad. Therefore, the participant report will provide an exact and complete record of how each person voted, by name.
Advanced Text File Import
When importing a text file, you can now add a command (also known as a switch) to the preceding line of a question to set its slide type. Valid switches are /d (demographic) and /t (title). If no switch is used, the system assumes that it is a standard slide. Here's an example.
/d
What is your gender?
1. Female
2. Male
When this file is imported, the system will put the question text in one box and the choices in a separate box. However, it will also set the slide type to "Demographic" and automatically fill in the edit box for your group labels.
Also, the system will set a correct answer if you add /c to the end of a line. For example:
Who was the first President of the USA?
1. Abe Lincoln
2. Thomas Jefferson
3. George Washington /c
4. Ben Franklin
Important Notes:
There are no special 'switches' for Multiple Entry slides. So, they will be imported as standard slides. Be sure to edit your Master Presentation, setting the correct parameters.
When marking text as a Title Slide, your text should be in one continuous line (no "hard returns" other than the last one). If there are multiple lines of text, the system will interpret these as new slides.
Working With PowerPoint
There may be times when you want to blend a Synthesis presentation with PowerPoint. If so, it will be helpful to understand that Synthesis is "Audience Response Software" that also offers basic presentation functionality. On the other hand, PowerPoint is designed specifically for high-end presentations. Choosing the right software, for the right job, should be your starting place.
Generally, there are two ways to interface Synthesis and PowerPoint. You should decide which is the best method for your particular situation.

Synthesis XP-IQ Page 64
SwitchingIf you have a very large or complex PowerPoint presentation, you are probably best running both PowerPoint and Synthesis simultaneously. You can use Windows' ALT+TAB to switch between them when both are on the same machine. Or, run each on a separate machine and use an "A/B Switch" to your projector. (Many projectors have 2 VGA inputs built right in.)
InsertingIf you have a manageable number of PowerPoint slides and don't need links to other Office programs, you can insert them as Synthesis title slides. Simply open your PPT presentation and Save As either *.gif, *.jpg, *.tif, *.tga, or *.wmf. If these file types do not appear on your Save As File Type list, PowerPoint's "graphic filters" option was not installed. (Tip: saving as Tiff or Targa provides the highest quality, but image file sizes will be much larger).
PowerPoint will ask whether you want to save the "current slide" or "all slides in the presentation". Assuming you save them all, PowerPoint will create a new folder (with the same name as your presentation) and save each slide as Slide01, Slide02, Slide03, etc.
Now go to Synthesis, insert a new question where you want your first PowerPoint slide and select Slide01 as your background picture. Set the question type to Title Slide and choose a transition if you'd like.
Please note that PowerPoint's conversion of slides to images is not of the highest quality, and that your PowerPoint text will suffer in the conversion. If this is an issue, consider using the switching method.
Working With Text Boxes
Synthesis allows you to work with standard text boxes just as you would with many other applications. However, there are a few tips that you should know about.
Text Box Tips
Tip:There is a limit of 99 boxes on a slide. Boxes would include pictures and movies.
Tip:Each text box is assigned an Object number. The first box that you place on your slide is Object #1. The second is Object #2, and so. This approach allows you to make sweeping changes across your entire Presentation, for a given box number (e.g. Color, Italics, Position.) Use Global Change to apply these changes.
Tip:Synthesis text boxes allow you to set text color, bold, italics, shadow, and underline on a character by character basis. However, the font type and size that you choose effects all text in the box. So, if you were to select a single character and change its size, all text in the box is changed. If you need a different font or size, you can simply place that text in a separate box.
Tip:With a text box selected, right click inside the box for standard edit controls. You can also use standard keyboard shortcuts such as CTRL+A, CTRL+C, CTRL+X, and CTRL+V
Tip:There is no hanging indent capability for text boxes, but there are two other ways to create indents. Enter the choice number (e.g. 1.) and press the Tab key. Now, enter your text. If it wraps to a second line, go to the end of the first line and put in a hard return (Enter Key). At the start of the second line, enter another Tab character.
The second way is to create two boxes, side by side. Put your numbers (1, 2, 3, etc.) in the first box. Put the text for these choices in a second box. Then go to "Full Screen View" and make

Synthesis XP-IQ Page 65
certain that the tops of the two boxes are positioned at the same points. If need be, add blank lines in the first box to align text with the second. Any new questions that you add after this, will use the identical layout.
Caution: If you use this method, your text will not format correctly when you save it as a text file. Synthesis writes the contents of each box, in order. So, you will find all of the numbers listed, and then all of the text for each.
Tip:When editing, you can double click on a word to select it. Click once more to select all text in the box. Also, with a box selected, you can use the toolbar's copy button to copy the entire box with formatting to the clipboard.
Scale Transitions
This feature (also called Text Box Transitions) gives you the ability to "build" slide text. So, during your Presentation, you can now reveal the response choices one-by-one. It is important to know that transitions are applied to text boxes, and not individual lines of text. So, if you want to reveal choice number 1, then 2, then 3, they must each be in a separate text box.
The BasicsThere is a dropdown list on the toolbar called Scale Transition and a number of buttons that are used in managing text boxes. The basic idea is that when you select a Scale Transition, it is applied to all text boxes on the slide except the first one. Why not the first? Well, because the system assumes that the first text box contains the question text.
Let's look at an example.
During the Presentation, the facilitator or MC will want to read the question, and then reveal the choices one-by-one. When you display this slide (assuming a Scale Transition has been applied) all that will be shown at first is the question itself. To display the first choice (Sales) press the number 1 on the keyboard, then press ENTER. To display the second choice (Customer Service) press the number 2 on the keyboard, then press ENTER. And of course, to display the third choice (Administration) press the number 3 on the keyboard, then press ENTER.
Now, here's where it gets interesting. If you insert a shape on your slide and right click to add text, it now becomes a text box rather than just a shape. So, any Scale Transition is also applied to it. Also, as you know, pictures and videos are given object numbers. But, since they are not text boxes, a Scale Transition is not applied to them.
So, the rule for "Scale Transitions" is: "The text box that is assigned Display Order #1 receives no transition. All other text boxes are revealed in order, based on their Display Order number."
This is extremely important to understand when making last minute changes.

Synthesis XP-IQ Page 66
Let's review the example used above.
Now let's assume that you need to add a choice between 1 and 2. So, you add a text box (Display Order - 5) and re-number the other choices. It would then look like this.
During the Presentation, when you press 1 ENTER, "Sales" would reveal. But, when you press 2 ENTER, "Customer Service" would reveal because it is next in the "Display Order"! To change this, select the Human Resources box. Right click. Select "Display Order", and then "Display First." The Human Resources box will now become "Display Order 1. Now, send it backward twice so that it becomes "Display Order - 3). (Tip: You could instead combine the boxes, and split them again as described in "Splitting, Combining, Aligning, and Moving Text Boxes" below.)
It is strongly recommended that when using scale transitions, you always check your slides in the Presentation Cycle View. When a slide with a Scale Transition is displayed, it will of course show the question text only. Press the appropriate keyboard numbers to reveal the choices. Or, use a left mouse click to reveal them one-by-one. Also, you can use ALT+A to automatically reveal them in order. (The same key commands are available in the Presentation itself.)
Splitting, Combining, Aligning, and Moving Text BoxesIf you have already created a Presentation file that has all of the response choices in a single box, or if you used the Insert Text File feature, you may want to split this single box into the appropriate number of individual boxes so that you can use Scale Transitions for each choice.
To do this easily, be sure that each Response Choice in the box begins with either a number or a letter, and is followed by a period or close parenthesis [e.g. 1. Yes or A) Not At All]. Assuming this is the case, select your Object #2 Text Box and simply click the "Split" button on the main toolbar (next to the Paste button).
You now have separate text boxes, numbered sequentially. If you want to do this for all Object #2 Text Boxes, select it on this slide, go to Edit, then Global Change. Check the "Split" option and click OK. Your file is done.
Now that they are split, you may need to move or align them as a group. With no text boxes selected, hold the CTRL key and left click on each box. Your pointer becomes a crossbar, allowing you to move the entire group. Now, let's assume that you added some text to the last text box and have pulled the box's left margin farther to the left, to keep the text all on one line. Rather than try to align the other boxes individually, use auto align. To do this, be sure no boxes are selected, hold the CTRL key, and click the box you just expanded. Then, select the other boxes. On

Synthesis XP-IQ Page 67
the format toolbar, just below the Slide Sorter button, click the "Align left" button. All boxes are automatically aligned, based on the first box that you selected.
There will also be times when you modify text in one or more boxes, and would then need to distribute them evenly from top to bottom. With no text boxes selected, hold the CTRL key and left click on each box. Click the last button on the Format toolbar to space them all evenly.
o To select all text boxes (except #1) hold the CTRL key and left click anywhere on the slide, other than on a text box.
o You can combine the boxes on a slide by selecting them all and then, clicking the toolbar's "combine" button. Then, split the box again to re-number all of the boxes. This method is extremely helpful when making last minute edits that change the text box display order.
Selecting Transitions And Adjusting The TimingNow that your Response Choices are each in a separate box, you'll want to apply a transition. Although only one Scale Transition can be specified for a given slide, you'll find that some transitions are in fact a combination of two different ones. For example, the "Wipe Right then Left" transition alternates between a wipe-right and a wipe-left.
We suggest that you experiment by assigning a transition, then going to the Presentation Cycle view and running the transition (Press 1 ENTER, 2 ENTER, 3 ENTER or use repeated left clicks to reveal them one-by-one. Or, use ALT+A to reveal them automatically.)
Tip: You can try the different transitions without returning to the normal view. While in the Presentation Cycle view, right click to enter the Polling Screen view. Pop up the menu, and select a new Scale Transition. Right click again to enter the Presentation Cycle view. Then, left click repeatedly to reveal each response choice.
After going through the different transitions you will find that depending upon your text, some transitions look better than others, and that some are faster than others. At this time, there is noway to specifically set the speed of transitions. However, there are two factors that do impact speed.
First, is your font size. Smaller fonts, run faster. Second, is the text box size. Large boxes run faster than small ones. So, if you have one or two words in a box and it is moving too slowly, stretch the box to its full width. Conversely, if it is moving too fast, close it down making it as narrow as possible. The last two things to know about "Scale Transitions" is that this item has been added to Global Change, and that they also work on Title Slides. So, you may now be able to use Unity or Synthesis rather than PowerPoint.
Using Transitions In The PresentationIf you have checked your Presentation using the Presentation Cycle view, you will know exactly how to display them in the Presentation. (also see the topic Scale Transitions - Autorun)
The slide itself, along with the question text, will transition in, based on the selected slide transition. To reveal all Response Choices automatically, press ALT+A. To reveal them one-by-one, use a left mouse click, or press the appropriate number on the keyboard followed by ENTER. Keep in mind that when using the one-by-one method, you do not have to reveal them in order.
Also, if this Presentation uses a clock, music, and Scale Transitions you should decide what happens in what order, and spend some time practicing. In most cases you will: spacebar to display the slide; ALT+A to reveal the choices; M to start the music; C to start the clock; and, spacebar twice to show the Results.
Scale Transitions AutorunIf you have assigned scale transitions in your Presentation, you can check the "Run Scale Transitions Automatically" option. When you do, assigned scale transitions will run as soon as the slide is presented.
Synthesis XP-IQ Page 68
Removing Response Choices
Along with Scale Transitions that let you transition Response Choices in, Synthesis XP-IQ allows you to remove choices, too. With your choices on screen, press the Box number then Enter, and watch it disappear.
This feature is available in the Presentation Cycle view, and of course, in the Presentation itself. What makes this feature especially interesting is that when you remove a choice, any votes cast for that choice are discarded.
So, you could display five choices and then slowly remove all but two. In effect, you are giving the audience a 50/50 chance to get the question right. This can get very interesting when using Synthesis with points assigned, and a segmented clock. You are allowing people to change their answer, but of course, they get fewer points as the clock runs down!
Adjust Team Points
Synthesis XP-IQ allows you to manually modify team scores. This feature is available only if you have used a Team file for defining your teams, and is available for up to 499 teams.
Why would you want to modify point scores? Well, let's say that your teams are involved in other team building activities. And, let's say they can score points in those activities. Well, this feature lets you add those points to their Synthesis team scores so that you can have an overall winning team across all activities.
To add points, you must be in the presentation mode. At your Home page, press the keyboard 'P' or select it from the popup menu. Your Team names are shown, but up to twenty teams only, in alphabetical order. Enter the desired number of points in the appropriate boxes.
Notes:
o You can enter either positive or negative numbers.
o The maximum value you can enter is 999,999.
o Only the current point value will ever be added. In other words, if you added 100 points for Team One, then later entered 50 points, the total value added will be 50, not 150.
o If you exit the presentation, the 'added' values will be automatically stored in your Quick File. So, if you exit Synthesis altogether then: start it again; load the Quick file; and begin the presentation, all of the previously added values will remain in tact. However, if you did not use a Quick file, or if you did but deleted all of the keypad data and started the presentation from scratch, all values are reset to zero.
About First Correct
Determining the First Person to Answer CorrectlyAssuming you know ahead of time that you will need to show the 'First Correct' you'll need to decide how precise you need to be, and then choose a method for implementing. The most accurate way is to use "timestamps" for determining which correct answer was first. Select this option from the Presentation Setup form's Options tab. Doing so will result in a brief delay in displaying results because all timestamps must be calculated.
If you need to eliminate the delay, then leave it unchecked and Synthesis will base the first correct on polling cycles.
Once everyone has voted, you will press the spacebar to close polling. You can press the keyboard letter 'W' to display the first correct. Or, you can display a graph as you normally would, and press 'W' then.

Synthesis XP-IQ Page 69
In either case, the 'First Correct' screen is displayed. If you named a Roster file in your Presentation Setup, the name of the first person to answer correctly is displayed. If you did not name a Roster file, the keypad number will be displayed.
Therefore, it is very important to make certain that keypads have a number label on them, and that this number is in fact the keypad's true, programmed number!
Very Important Notes:
o If you display the first correct based on keypad number, make certain that keypads have a number label on them. And, confirm that this number is in fact the keypad's true, programmed number by testing each keypad using the 'Test Reply Keypads' function.
o Once you display the First Correct, it is no longer possible to cancel the slide.
Creating a 'Fastest Finger' or 'Buzzer'Keep in mind that this is a First Correct feature, and not a "First To Answer". However, with a little planning, it can be used for just that.
To do so, create some number of slides setting the scale to 1-2 and turning "Show Results" off. Also, you must set the correct answer to 1.
Save the file, and setup your Presentation as you normally would. However, on the Options tab, set the 'Number of Responses' to one.
Now run your presentation. Bring in the slide and instruct people to press the #1 to "buzz in". Since the 'Number of Responses' is to one, Synthesis will stop as soon as the First response is received. Now press 'W'. Since the #1 is correct, this person's keypad number (or name if you used a roster) will be displayed!
Using Comparison Graphs
Synthesis allows you to place a second graph on your Results Screen, so that when you run the Presentation, you can easily compare this group's response to that of some other group (e.g., "Last Year's Attendees" or "National Survey Data".)
Creating a Comparison Graph in Your Presentation FileTo create this secondary graph, open your presentation file and navigate to the slide that you will use for comparison. Click on the Results Screen to be sure it is selected. Click "Custom Layout" on the toolbar. (Note: if you do not understand the implications of using a Custom Layout, see the section Creating A Master Presentation.)
From the Insert menu, click "Graph". Enter the scale, graph type, and a summary description. Then enter the number of votes for each choice. Optionally, you can set the font for graph labels. With this done, click OK.
Your secondary graph now appears on the Results Screen. Position it where you would like. To change the data, double click the graph.
Now, you should decide how you will use the comparison graph during your Presentation. There are two ways. You can have the graph displayed immediately as part of your Results Screen. Or, you can hide the comparison graph initially, and display it on command.
To better understand this, click anywhere off the graph to be sure that it is not currently selected. Then, right click on the graph. You will see that it becomes minimized and placed in the lower right corner of the slide. To restore it, left click on the minimized button.If during the Presentation you do not want to show the graph initially, you must leave it minimized here in the Presentation file.

Synthesis XP-IQ Page 70
Displaying Comparisons While Running Your PresentationDuring the Presentation, when you display your Results Screen, the Comparison Graph will be either visible or minimized, depending on how you left it when creating this slide.
To show it, left click on it as you did before, or press the letter "X" on the keyboard.
Delivering On-The-Road Training
One of Synthesis' most common uses is in delivering on-the-road training programs. We will assume that you have created a Master Presentation, and that you have discovered the power of using Demographic slides.
Let's also assume that your Master is called "Serving The Customer" and that you will be making this Presentation to 23 different classes, in 23 cities. Before your road tour, setup your Presentation Options as you normally would, naming "Serving The Customer" as your Master. Synthesis will use this same name for the Synthesis Data File entry, and the Session Presentation File entry.
Now, it's time for the first Presentation. Open your Quick File for "Serving The Customer". However, before launching the Presentation, add "01" to the Synthesis Data File so it now reads " Serving The Customer 01.sdf". Synthesis will automatically change the Session Presentation File to the same name. Go ahead and run your Presentation.
For the next group, follow the steps above, but use "02". Continue in this way for the remaining meetings. Once you have completed the tour, combine all of the Synthesis Data Files to a destination called "Serving The Customer All". (see "Editing and Combining Data Files").
Note: You should also save a copy of the MPF as "Serving The Customer All.spf".
Then from the Report menu, choose "Select Report Files."

Synthesis XP-IQ Page 71
Open your "Serving The Customer" Quick File. Click on Browse, change the "Files Of Type" list to "Combined File" and select "Serving The Customer All". Click "OK". (Synthesis will also look for the file you just saved as "Serving The Customer All.spf")
You can now open Reports and view the "rolled up" data for all 23 groups.
Note: The 'By Participant' report is not available when using combined files. If you need that data, you should load each original data file separately.
Save MPF and SPF as a Web Page or PDF
With a Master Presentation File or Session Presentation File open, there is an option on the file menu to save the file as a web page. This is especially helpful when a large number of people need to see the slides, and when you know that you will be making numerous changes. After each change, update your website and email everyone that a change has been made.
Note: If you would like the slide images larger than the default size, you can turn off all of your toolbars and from the "View" menu select "Normal" then "Polling Screen". This makes the slide larger, and therefore the web page images will be larger.
If you only need to send your slide file to a few people, it is probably best to save it as a PDF. This option is available from the 'File' menu. Then mail the PDF as an attachment.
You should take some care when emailing these PDFs. Because they are graphics intensive, the file will grow large rather quickly. The Internet's mail network generally limits the size of attachments to about 8 MB.
Pack A Presentation
Once you have created a Presentation and have set all of your options, you can "Pack" the presentation so that it can be easily moved. When you click "Pack" (on the Presentation Setup Options form) the system will ask for a new folder name.
Important: You must enter the complete path, as well as the new folder name (e.g. “C:\ComTecXP-IQ\MyShow").
It will then pick up all multimedia components (backgrounds, pictures, movies, and music) and copy them to the new folder. It will also copy all named files (Presentation Files, Roster Files, Playlists, etc) to the same folder.
Once the Presentation has been packed, you can move it to another machine (that has ComTec XP-IQ installed) and run it from there.
Important: You must move it to the same location on the target machine that as it was originally packed to.
So if you packed it to "C:\ComTecXP-IQ\MyShow" the folder "MyShow" must be located in "C:\ComTecXP-IQ\" on the target machine.
Tip: If you have no set policy as to where "show" files will be placed we suggest that you create a Word document called "Unpack Info.Doc". In the document, include a line like "this folder must be placed in the c:\ComTecXP-IQ folder." Then, save the Word document inside the packed folder. In that way, anyone reading your instructions knows exactly where the folder must go.Notes:
o If you have included one or more videos in the Presentation, the packed folder can become quite large, rather quickly.
o You must first save your Quick file, for this feature to be available.
Synthesis XP-IQ Page 72
Custom Text Color
You may select a custom font color and then apply it to text, so that you can more closely match another Presentation (e.g., PowerPoint) that you might also be running. There are a few steps to making this happen.
1. Set the desired custom color in your Default Options page
2. Create your slide presentation assigning the custom color to all text in Slide 1. Any new slides will pick up the same color settings.
3. Select your files on the "Presentation Setup" form and be certain that the desired color is shown in the color swatch. Save the Quick file.
Now, as long as this Quick File has been loaded, your Presentation file text color will be the one you chose.
Important Note: Your slide text custom color is not permanently saved with the file. Instead, it gets the color settings from the currently loaded Quick file. If no Quick file has been loaded, it will get the settings from your Default Options page. So, if you have changed the Default Options Custom Color since creating the Presentation file, your slide text will be the wrong color! To correct this, simply load the Quick file for this Presentation and your slide colors will then load correctly.
Presentation Auto Run
By setting a timer for the Results Screen, you can run an entire Presentation unattended even when showing Results Screens.
To do this, check the "Auto Run" box on your Presentation Setup form's Options tab, and enter the number of seconds that you want to display results for. This timer is applied to all Results Screens.
Important Notes:
1. When you check Auto Run, it means just that. . . Your music will play automatically, your clock will start automatically, and any scale transitions will run automatically whether or not these options have been checked! If you don't want all of these things to happen automatically and immediately, do not use the Auto Run feature.
2. To run the presentation unattended you must also have either a clock assigned to each Polling screen, or you must use the Maximum Number of Responses option.
3. If you use "Build" for your graph, the Results Screen Timer is ticking while the build is being done. So, you probably want to add 1 or 2 seconds to the timer.
Move Multiple Groups of Slides
Let's assume that just before your meeting begins, the presenters change the order in which they will speak. And, rather than "Jumping To" slides during the presentation, you would rather move them into the correct order.
Another situation might be that you moved the data for slides in preparation for combining, and now need to renumber your presentation file to match it.
In either case, you will find it fairly easy. With either a Master Presentation File, or Session Presentation File open, select Move Multi-Groups from the edit menu. The Multi-Group dialog box opens. In each of the "Group" boxes, you will enter a slide number, or a range of slides that will result in a new order.
Since this can be a complex function, you will find it easiest to think through it using the following example.

Synthesis XP-IQ Page 73
"First I want slides 6 - 10" (enter 6-10 in the 1st Group box)
"Next I want slides 21 - 30" (enter 21-30 in the 2nd Group box)
"Next I want slides 1 - 5" (enter 1-5 in the 3rd Group box)
"Next I want slides 11 - 20" (enter 11-20 in the 4th Group box)
Then click OK to make the change. (You can also use individual slide numbers rather than a range).
System Messages
You have the ability to change the standard, default Presentation messages such as "Slide," "Mean," "Total," and so on. This is especially useful if you are presenting to an audience that speaks a language other than English.
Changing The MessagesFrom the Presentation Setup Options form, select the Options tab. Click the "System Messages" button. Enter the alternate text in each field.
If you need to use special characters, you can simply go to Windows Character Map, copy your selection, and paste it in the appropriate field. We suggest that you use the same font character set as the one that is used in your default setup options.
Please note, that there may be some "extended" characters that do not display correctly. Also, most special characters can be entered directly in the field using the "ALT+" standard. As with most other software, the "ALT+" requires using a standard keyboard's number keypad.
Once your modifications are made, be sure to save your quick file.
Viewing The MessagesYou can view your modified text messages by running the presentation. However, you can also view most messages by viewing the Presentation file itself. This feature is available only if your alternate text is loaded in the Presentation Setup Options form.
Using The Game Board
Synthesis XP-IQ lets you play a Jeopardy style game using a board of 5 categories with 5 slides in each. Typically, teams take turns answering questions. But, rather than giving points to only the current team, Synthesis allows all teams to answer and score points. This methodology gives every team a chance to catch up, and to win.
In trying to understand how the game works, it is best if you can think of it as a standard presentation, but one that includes a board that gives you an automatic "jump to" feature.
Your Master Presentation FileTo play the game, you create a Master Presentation as you normally would. However, you want to create a total of at least 25 slides. That is, five categories with five slides per category. To do this, enter a category name in the slide category field for each of five slides (e.g. History). Then assign values of 100, 200, 300, 400, and 500 points consecutively. Repeat this for the next four categories.
When you start the game (or setup the game board) Synthesis will search for the first 5 slides that have an identical category name. It will then load that text into the game board category box. Then, it will search for slides with the appropriate point values and load them under the category.
Setting Up The Game BoardSet up your presentation as you normally would using the "Presentation Setup Options" form. With your Presentation file named, click on the Design Game Board button on the "Options" tab. You will see that the board is filled in, and that a default color scheme is used. To change the look, right
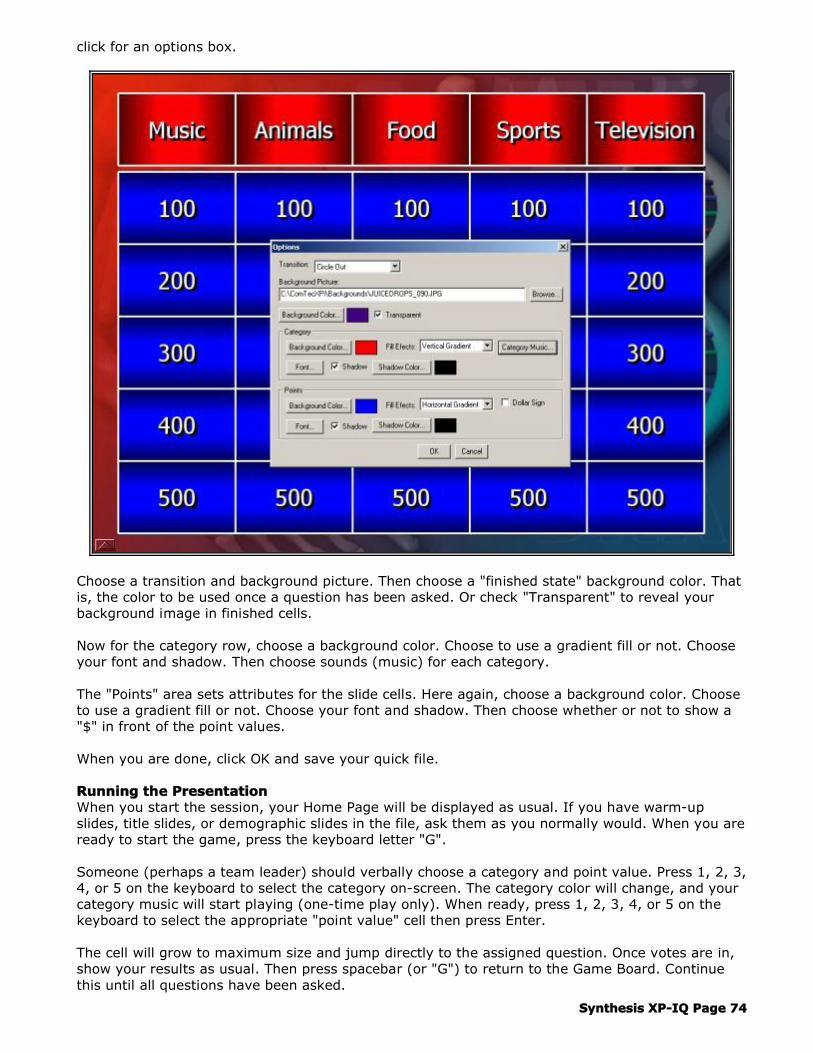
Synthesis XP-IQ Page 74
click for an options box.
Choose a transition and background picture. Then choose a "finished state" background color. That is, the color to be used once a question has been asked. Or check "Transparent" to reveal your background image in finished cells.
Now for the category row, choose a background color. Choose to use a gradient fill or not. Choose your font and shadow. Then choose sounds (music) for each category.
The "Points" area sets attributes for the slide cells. Here again, choose a background color. Choose to use a gradient fill or not. Choose your font and shadow. Then choose whether or not to show a "$" in front of the point values.
When you are done, click OK and save your quick file.
Running the PresentationWhen you start the session, your Home Page will be displayed as usual. If you have warm-up slides, title slides, or demographic slides in the file, ask them as you normally would. When you are ready to start the game, press the keyboard letter "G".
Someone (perhaps a team leader) should verbally choose a category and point value. Press 1, 2, 3, 4, or 5 on the keyboard to select the category on-screen. The category color will change, and your category music will start playing (one-time play only). When ready, press 1, 2, 3, 4, or 5 on the keyboard to select the appropriate "point value" cell then press Enter.
The cell will grow to maximum size and jump directly to the assigned question. Once votes are in, show your results as usual. Then press spacebar (or "G") to return to the Game Board. Continue this until all questions have been asked.

Synthesis XP-IQ Page 75
Notes:
1. From the Game Board, you can view Team Standings.
2. With question cell or category selected (flashing) pressing "ESC" will un-select the choices.
3. You may want to have one last Slide in the file to act as a tiebreaker. Once the board is finished, go Home and spacebar (or JumpTo) the tiebreaker.
4. You can add another dimension to the game by creating a Game Board background that depicts some sort of message (e.g. "Quality is Number 1"). Then have a bonus question that asks "what is the message that the Game Board revealed?"
Have Fun. . .
Compare Two
With Synthesis XP-IQ you have multiple options for comparing two slides during the Presentation.
From the Results Screen of a given slide, press the keyboard letter "C" or choose compare from the popup menu. You are prompted for a slide to compare the current slide to. Enter the slide number, or scroll the list.
On the selection bar, there is also an option for "Side By Side". With this unchecked, your comparison will be shown as two series of bars. With it checked, your comparison will be shown as two separate, side by side graphs.
Also on the selection bar, there is also an option for "Display On Left". With this unchecked the specified slide will not be shown on the left, and therefore will be on the right. With this checked, it will of course be shown on the left.
ImportantIf the two slides being compared do not use the same scale, the scale from the originating slide will be used as the base. If the second slide has a lower scale (e.g., base slide has 5 bars, second slide has 3 bars) the second slide will be shown with the additional bars set to zero. Conversely, if the second slide has more choices than the base, the additional bars will be dropped and the remaining bars will be re-calculated based on only those people who selected one of the "base" choices.
With your comparison on screen, you can not display the "response data" as you can for a Results screen. But, you can press CTRL+S to toggle between "Side By Side" and "Series" views. You can also press CTRL+L to toggle between which slide will be on the left. Lastly, you can use the "+" and "-" keys to increase or decrease the graph label size.
Series ColorsOn the "Options" tab of the Presentation Options Setup form, the default colors for your Slide Comparison - Series View are shown. These colors will be used for all Series comparisons throughout the Presentation. They have no effect on the "Side By Side" view.
This is especially useful when doing " before/after" or "pre/post" comparisons in that regardless of the individual slide's color scheme, the comparison colors will remain consistent.
Synthesis XP-IQ Page 76
Hot Backup
When you run a presentation you have the option of naming a backup location for your critical files. This is typically a folder on a second machine. As you run your Presentation, files are updated on both the main and backup machines simultaneously. So if you were to lose your main, you could start the Presentation from the backup with all the data in tact and never miss a beat.
Often times 'backup' is not taken very seriously. We strongly suggest that you implement Hot Backup on every critical meeting.
Using Hot Backup
1. You must first create a simple File Sharing network between your two computers. If you do not know how to do this, please see ComTec's website http://www.comtecars.com
2. Be sure that the folder c:\ComTecXP-IQ on both the main and backup machines is shared. Also, if you have not already, you should create and share a folder called Public on Drive C, on both machines.
3. Copy the Presentation (*.mpf, *.qck, slide backgrounds, team files, roster files, and any multimedia components) from the main (c:\ComTecXP-IQ) to the backup (c:\ComTecXP-IQ). Using Pack will make the copying much easier.
4. Run the Presentation in Demo Mode on both machines simultaneously to be sure that all necessary files exist on both machines.
5. Now, assuming you have created a folder called "Public" on the backup machine, go to the main machine. On the Presentation Setup form's Options tab select Hot Backup, and enter the full network path to the Public folder on your backup (e.g. \\secondary01\public). What you are basically doing is telling the system to put a copy of the Session Presentation File and the Data File in the Public folder on the backup.
6. On the backup machine (on the Presentation Setup General tab) clear the field for Master Presentation File. Then, change the location of the data file from "c:\ComTecXP-IQ\Synthesis\myshow.sdf" (or where ever it might be) to the Hot Backup location on this machine (e.g. c:\public\myshow.udf). Tab out of the field, and save the Quick File.
o Note: In case you are wondering why you can't browse for the Hot Backup data file or Presentation file, it's because they do not yet exist on the backup machine.
o Note: We are suggesting that you put Hot Backup files in the Public folder rather than the ComTecXP-IQ folder to avoid potential confusion when looking at identical file names, in identical folders, on identical machines.
7. Once you start the presentation on the main, the files are immediately created on the backup machine's "public" folder.
8. Be sure not to do any polling on your backup machine will your main machine is polling. The act of polling turns on the base station's radio, and if both are on, they will interfere with each other.
9. If you should lose your network during a presentation, a small transparent triangle will appear next to the Status Box while polling.

Synthesis XP-IQ Page 77
In The Event Of A Failure
1. If you are in a presentation, end it.
2. Turn on your backup base station.
3. Turn off your primary base station.
4. On the backup machine, click Run and select "Keep the data and continue . . ."
Your show will now run from the backup, with all previous data in tact.
Important Note: Of course, you must also switch your video and audio inputs to the backup computer. You should be able to do this in under 10 seconds.
Refresh
Synthesis XP-IQ includes a "Refresh" feature for certain reports. Its function is quite simple, but its impact can be substantial.
With either a "By Results Screen" or "Demographic Comparison" report open, click the "Refresh" button to refresh the report. This function simply closes the report, reopens it, and displays the last slide. While that may seem insignificant, it is far from that when considering how it can be used in conjunction with 'Hot Backup'.
When you have two computers and one is used for Hot Backup, the keypad data gathered is written to both the main and backup machines simultaneously. So, as the presentation is running, you can open a "Results Screen" report on the backup computer and view the results as each question is saved by clicking "Refresh".
Why would you want to do this? Well, suppose you were presenting a group of questions and not showing the results (e.g., focus group or presenter evaluations) but your colleague (or client) wants to see how the group is answering. Just set him/her up at your backup machine with the Results Screen report open and have them click "Refresh" each time you finish a question!
How To Set It UpAssuming you have implemented Hot Backup, go to your "Select Files" item on the Report Menu.
1. Be sure that the correct data file and Session Presentation Files are named.
2. If you have already asked at least one question in the Presentation, click "OK" on the Select Report Files box. If you have not asked at least one question, the files do not yet exist. Instruct your colleague to wait until you have completed the first question and to then click "OK".
3. With the correct files selected, open a Results Screen report. Then after each question has been asked, click "Refresh" to see the results.
Tips:
o With a report open, you can of course view data for all questions that have been asked up until the last refresh.
o You can also use the Demographic Comparison report in the same way.
o You can open any two reports (Results Screen and/or Demographic Comparison) and "Refresh" will refresh them both.

Synthesis XP-IQ Page 78
Call ListOften times at the end of a presentation, the presenter opens the floor to questions from the audience. If more than one person raises his hand, the presenter must now choose which of them to call upon. Well, why not make use of the audience response system?
In the presentation mode, and from the 'Home Page' the operator can select 'Show Call List' from the menu, or press CTRL+L. This will open a list window. You probably don't want this list displayed on the big screen, so switching the projector to another source is best. It is however helpful to display the list on the presenter's monitor, if he has one.
The presenter should then instruct the audience to press the number 1 if they'd like to ask a question, the number 2 if they have comment, and the number 3 to cancel their call.
When an audience member presses number 1 or 2, his keypad number appears on the list. If a roster file is used, his name is displayed rather than the keypad number. List entries are displayed in a first-come-first-served order.
As each person is addressed by the presenter, the computer operator should select that person from the list and delete him.
This is an extremely effective method for handling standard Q & A.
Notes:o The call list is not available from the login screen.
o The Call List box can be moved and resized as needed.

Synthesis XP-IQ Page 79
Trouble Shooting Guide
From time to time, you may experience operational difficulties with your Reply system. At those rare times, it is important to understand how the system works and how to remedy problems quickly. In this guide, it is assumed that you know how to connect and test your hardware.
System OperationThe Reply base station contains one transmitter and two receivers. When polling is initiated, the transmitter interrogates each keypad sequentially. When the keypad "sees" that it is its turn, it transmits the digit that was entered. The number in the keypad's window then extinguishes, and the base station will send an acknowledgement of receipt.
If the keypad LCD is DarkThe keypad is powered off. Press any key to turn it on. If it still does not power on, batteries are most likely drained. Replace the batteries, or recharge the keypad if it is equipped with this capability.
If the Number Stays Solid and Does Not ExtinguishThis most common reason is that the question type is multiple digit thereby requiring that the Send key be pressed.
If the Send key was in fact pressed, you should first be sure the keypad is within about 200 feet of the base station. Then check that the base station is properly connected. If the problem still exists, the base station has malfunctioned and must be repaired.
Preventive MeasuresIn small rooms the above keypad problems will most likely never appear. However, in larger rooms that are setup for 300 or more people, you must be more careful of equipment placement.
Do not place the Reply base station next to projectors, metal objects, or any device that may generate radio noise.
You should also leave ample setup time, so that you can test the entire system well before its use. For very large rooms, you should obtain floor plans ahead of time, and decide on equipment placement. And, be sure to have Communications Technology's phone number (800 328-VOTE) with you, for further technical assistance if needed.
Synthesis XP-IQ Page 80
Facilitation
Overview
The meeting Facilitator will have a major impact on the value derived from your Audience Response Presentation. Therefore, the following areas should be carefully reviewed by all those who will be involved in facilitation.
o Define Meeting Objectives
o Develop Appropriate Questions
o At Meeting Time, Introduce the System
o Provide an Interpretation of Results
o Promote Interaction
o Remember the Do's and Don'ts
Define Meeting Objectives
Your Audience Response system is a powerful communications tool. It is therefore important, to use it in a way which supports the primary objectives of your meeting.
For example, you may suspect that your organization needs to change in a number of areas. The system can be used to identify: the importance of change in each area; the best plan for change; and the level of support that a plan will have.
On the other hand, you may have already defined a plan for change, and your objective may be to secure "Buy-In". During your presentation, you can include questions that basically ask, "Do you understand my plan? Do you agree with my plan? Will you support me?"
The point is, be sure to use the system in a way which supports the objectives of this particular meeting. We strongly suggest that you write your Presentation first, then insert Audience Response Questions that support the topic.
Developing Questions
The wording of a question (or statement) is the critical element in obtaining a clear and fair response. So, you should follow some basic guidelines as closely as possible.
Use "Simple" questions, or declarative statements. "Simple" questions typically concern either past, present or future events. They usually ask for factual information (how much, which one, etc.) Here you are looking for the audience to supply information, as opposed to the declarative statement, which assumes the information.
Declarative statements concern either past, present or future events. They can maintain a factual position (has, is, will), or evaluate a position (should have, might.) They usually search for the degree of acceptance on a "Strongly Disagree to Strongly Agree" or "Poor to Excellent" continuum. Use positive phrasing. It is generally better to allow people to disagree with a positively phrased statement than to agree with a negatively phrased one.
Include only one happening or event per question. Simplicity is the key to clarity. If the issue you need to deal with is complex, split it into components.
Synthesis XP-IQ Page 81
Include a specific time frame wherever possible. A question like "Are you satisfied with the performance of the President of the United States?" is best when something like "over the past twelve months" is added.
Consider potential follow-up questions that delve further into the subject. Impromptu questions will usually help in getting to the core of an issue. For example:
"Since the group feels the Advertising budget should be increased for next year, select the percentage that you think is best."
Clearly state whether participants should make a selection based on personal judgment or their perception in a larger context. For example:
"By the year 2005, how important will a formal Flex-Time policy be, to the company as a whole?"
Choose an appropriate response range. Choosing a response range is important to obtaining a clear decisive response. Generally speaking, the fewer choices you give a group, the more they must commit to a position. There are four general categories of response ranges.
The Conventional Yes/NoThis is fairly straight forward. The group is asked to respond "yes" or "no" to an issue. You may add shades of gray by increasing the response range to include an "uncertain" category.
General Continuum:A continuous scale is used to define the response parameters. For example. "As an organization, we are focused on controlling costs."
1. Strongly disagree2. Disagree3. Neutral4. Agree5. Strongly agree
Quantified Continuum:Increments can be assigned quantities such as:
1 = 10%2 = 20%3 = 30%
Discrete (or preferential) selectionMultiple choice alternatives, comparing up to 10 different items at once, are presented. Participants select the one they most prefer. The winner is the tallest column. To arrive at a true pecking order, the winner would be eliminated and the remaining items voted on.
Introduce The System
The facilitator should provide a brief explanation of the system before asking the audience to use it. For example:
"The keypads in front of you are part of an audience response system. Throughout the day, we will present various questions, and ask for your input. We will then display a graph of the group's collective response. The system is totally anonymous, so please respond with your true feelings."
"Using the keypad is an easy process. When the question is presented, press the number associated with your choice. It will appear in the keypad's display for a few seconds, then extinguish."
Synthesis XP-IQ Page 82
"If you change your mind, you can simply re-vote. The system will record only your last response. However, once the graph is displayed, responses are no longer collected."
It is always desirable to ask some warm up questions to familiarize the group with the keypad operation. We suggest that at least two questions be used. They should be light-hearted, possibly roasting a person familiar to the group, or toying with a recently publicized event.
Interpretation of Results
During the session, a number of different types of "Result" graphs may be displayed. The facilitator should draw conclusions, or lead the group to an understanding of the information presented.
Each graph represents of the degree of consensus on a given issue. When these results are displayed, it typically leads participants to further thoughts. The graphic is an ideal springboard for open discussion and a deeper understanding of the issue. But, there must be an understanding of the graph itself.
Bell CurveThe greatest degree of consensus exists when the graph exhibits a Bell Curve. The center columns are highest with a rapid fall off on either side of center, forming a "bell."
Skewed DistributionThis occurs when most of the responses are located to one side of the graph or the other. A Skewed Distribution indicates a fair amount of agreement, depending on how widely distributed the responses happen to be.
The discussion here should center on the degree to which people agree. This may indicate a general agreement with some reservation.
Bimodal CurveA Bimodal Curve has two peaks, clearly separated, instead of the single peak of the Bell curve. A Bimodal Curve does not necessarily indicate conflict or difference in judgment.
Often, it indicates a difference in perception or understanding which leads people who are essentially in agreement to apply a different perspective to the same issue.
Discussion here is important. After clarification of the issue and a re-vote, the Bimodal Curve normally becomes more of a Bell.
Rectangular DistributionA Rectangular Distribution occurs when responses are spread across all or most of the response categories. This may indicate confusion over the statement or question, lack of knowledge, or just lack of agreement by the group as a whole.
It is often beneficial to ask different functional people the same questions to see if different groups are at odds. If you have asked a functional demographic, you can cut the data by group. If not, you can ask Impromptu questions. For example:
"Let's ask that same question with only the marketing people responding," or, "just the production department," etc.)
Do's and Don'ts
As with any meeting, there are number of guidelines to keep in mind.
Do: Prepare handouts when the issues require considerable participant forethought.
Do: Read the question aloud when it is presented.
Synthesis XP-IQ Page 83
Do: Use demographic questions whenever possible.
Do: Take notes, or assign someone else to take them.
Don't: Let the meeting bog down. This can happen when confusing questions are asked.
Don't: Wait too long for the total population to respond. Typically a certain percentage of the audience will abstain or fail to respond in a reasonable time. Don't let 10% of the audience slow the meeting down.
Don't: Let one person ramble on. Ask the group, "Do you feel that you understand Joe's point?" If so, move on.
Promote Interaction
If the purpose of the session is to create discussion and interaction, Audience Response is the perfect tool. It is even more valuable when there is a mix of senior and junior people, or different functional disciplines in attendance. The system allows everyone to express an opinion, free of political or peer pressure.
Creating interaction in the session is beneficial to the group as a whole. The graphs display how the group feels and the ensuing discussion indicates "why" the group feels this way.
There are some simple ways to promote discussion. You can ask provocative follow up questions.
For example:
"We have general agreement that marketing expenditures should not be increased in the next 5 years. Does that mean that we are spending too much on marketing now?"
When the graph shows opposing viewpoints, ask the group why such a difference in opinion exists. "What are some of the reasons why someone might have responded in this way."
If the graph shows a Rectangular distribution ask the audience, "Is everyone clear on that question?", or "Maybe we can phrase that question differently, any suggestions?"
In the beginning of the session, people will be less likely to speak up. After the session gets rolling, it's often difficult to stop them. If you feel the session is getting off track, a good approach is to ask an Impromptu question. "Is this issue relevant, Yes/No". If the majority response is "No," move on.
Synthesis XP-IQ Page 84
Appendix
The Home Page
During a presentation, "Home" is the computer operator's "safe haven." It is a place to go when there is a pause in the action, or when you just need to display a neutral screen.
During the Presentation, press the keyboard letter "H" from any screen to go home.
From here you will see which slide number is next in queue (in the status box, lower right corner of the screen). Also, you can review slides, jump to slides, compare slides, test keypads, or End the presentation.
In order to end the presentation, you must be at the Home Page. Customize your Home Page from the Presentation Setup form, on the Options tab.
About Quick Files
It is easiest if you think of a Quick File as a sort of container that stores all of your Presentation Setup Options. You can have as many Quick Files as you would like.
Most users create a "Master Quick File" that is set up for how they like to run a Presentation. Then, when they create a new Presentation, they open their Master Quick File, change the Presentation File name and save the Quick File using the same name as the Presentation File.
Custom Layouts
Once you select Custom Layout, the link between the Polling Screen and the Results Screen is removed. So, if you make changes to the Polling Screen, the Results Screen will not be updated. When using the Custom Layout, any changes must be made to both screens independently.
The screen that your audience sees when you ask them to respond to a question. This is also called Part "A" of a slide.
The screen that your audience sees when you display a graph of how they voted. This is also called Part "B" of a slide.
Global Change
Global Change allows you to make changes across the entire presentation, or to a range of slides that you specify. The items that you can change will vary, depending upon exactly what was selected when you opened Global Change.
If your Polling Screen was selected and no text boxes were highlighted, Global Change will allow you set parameters for the entire Polling Screen (use "Text Layout"). If a box was selected, Global Change will allow you to set parameters for this box number only.
If the Results Screen was selected and no text boxes were highlighted, Global Change will allow you set parameters for the graph itself. If a box was selected, Global Change will allow you to set parameters for this box number only.
It is important to understand that Global change will load all of the settings for the current slide (or box). Make your new selections and be sure to mark its checkbox. Only items that are checked, will be changed.
The And/Or Operator - Demographic Comparisons
Generally speaking, when combining groups from different questions use "And."

Synthesis XP-IQ Page 85
When combining groups from the same question use "Or."
Avoid using both in a single definition, unless you clearly understand the impact.
The definition SWestSalesWomen can be though of as: Females, who also said they are from the Southwest, who also said they are in Sales.
The definition Eastern Region can be thought of as: People from the Northeast "or" People from the Southeast.
But the definition of Northeast "And" Southeast will result in zero responses because it is not possible for one person to belong to both groups.
Note: Applying "OR" to groups from different questions provides valid results, but these results are typically meaningless.
Weighted Voting
If you want to give certain people more than one vote, you can do so without giving them extra keypads. You assign the number of votes in a Roster file. But you also choose, on a slide-by-slide basis, whether to display results based on one vote per person, or on weighted voting.
Regardless of whether you choose to display the Weighted Vote or not, you can toggle between weighted and non-weighted voting during the presentation by pressing the letter 'W' at your results screen.
You can assign a weight of 1 to a maximum of 10,000.
Synthesis XP-IQ Page 86
Software License Agreement
ComTec XP-IQ software products along with their documentation are copyrighted with all rights reserved under copyright laws.
The software may not be copied or reproduced in whole or in part, without the prior written consent of Communications Technology International, Inc. (ComTec) except for the purpose of creating backup installation disk sets.
ComTec XP-IQ may reside on any number of computers within the licensee’s organization. However, the licensee may run only one “live audience” presentation at a time, for each license owned.
ComTec does not warrant that the software or the hardware peripheral will operate in every hardware-software configuration. ComTec has thoroughly tested the software and reviewed the documentation, but in no way warrants the result of any given application. As a result, thissoftware is licensed "as is".
ComTec will not be liable for direct or indirect damages associated with the use or inability to use the program. ComTec will have no liability for any data or programs stored or used with the software. Trademarks for product names used in this manual belong to the following companies:
o PC is a registered trademark of International Business Machines.
o Reply is a registered trademark of Fleetwood Electronics.
o Windows9x/NT/2000/XP/Vista are registered trademarks of Microsoft Corporation.
o Unity is a trademark of Communications Technology Int’l, Inc.
o Synthesis is a trademark of Communications Technology Int’l, Inc.
o Elect is a trademark of Communications Technology Int’l, Inc.
o Consensor is a trademark of Communications Technology Int’l, Inc.
Communications Technology Int'l Inc. (ComTec)100 Union Avenue - Suite TwoCresskill, NJ 07626
Phone: 201 266-6200http://www.comtec-ars.com