Broken chain business power point templates themes and backgrounds ppt themes

World Geography

What is Geography?
*It is the study of the earth
*Mixes up the physical and human aspects of our world into one field of study.
*Shows the relationship between people and the environment.
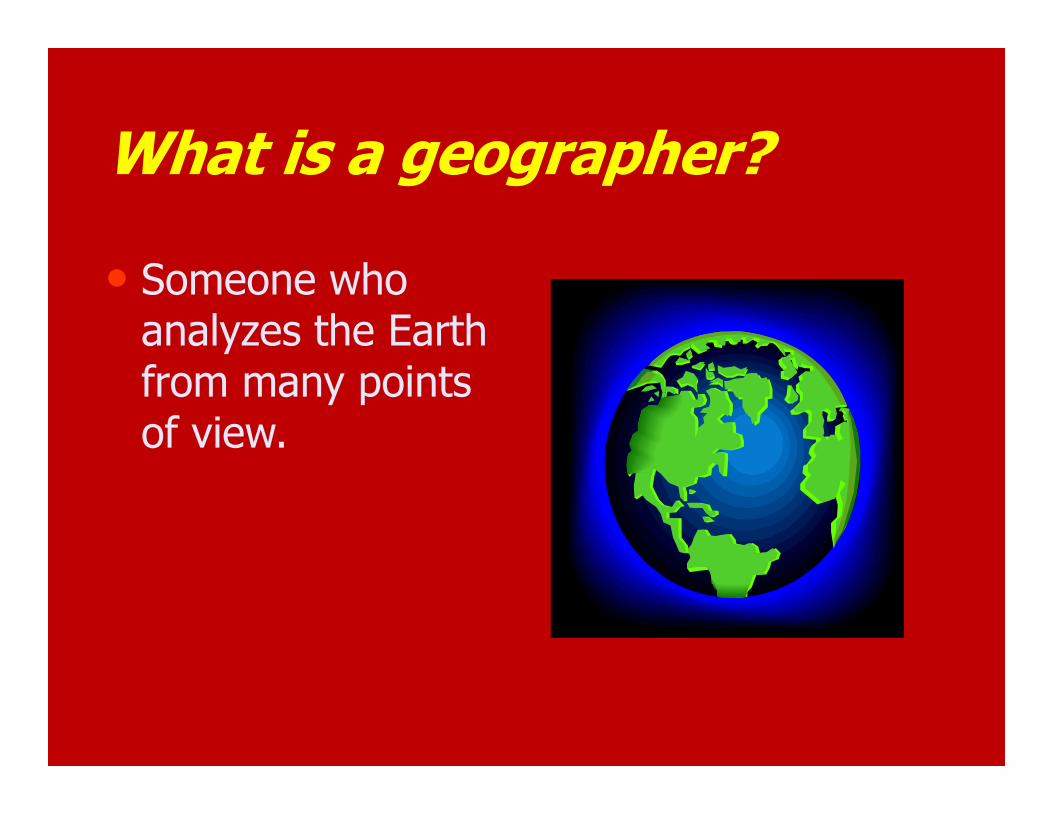
What is a geographer?
• Someone who analyzes the Earth from many points of view.

Things Geographers study:
• Oceans
• Vegetation
• Landforms
• People
• How the Earth and its people impact each other

The Five Themes of Geography
• There are five ways to look at the earth
• When geographers work, they are guided by two basic questions:
1) Where are things located?
2) Why are they there?
*To find these answers, geographers use five themes to organize information

The Five Themes:
1) Location – Where is the place of study?
2) Place – The physical and human features of a location.
3) Human-Environment Interaction – How people impact or shape physical characteristics of their natural surroundings and how does their surroundings (environment) impact them?

4) Movement – Explanation of how people, goods, and ideas get from one place to another.
5) Regions – Comparison of the climate, land, population, or history of one place to another and finding similarities

Location
• There are two ways to think about location:
1. absolute location – Exact position on the Earth, latitude and longitude
2. relative location – Explains where a place is by describing places near it

Place
• This includes a location’s physical and human features.– To describe physical features, you might say
that the climate is hot or cold or that the land is hilly.
– To describe human features, you might discuss how many people live there, what types of work they do, or what they do for fun.

Human-Environment Interaction
• How do people adjust to and change their environment? How does the environment adjust to and change the people?
• Geographers also use interaction to study the consequences of people’s actions.

Movement
• Explains how people, goods, and ideas move from one place to another.
• Helps geographers understand cultural changes.

Regions
• A region has a unifying characteristic, like climate, land, population, or history.
• On maps, geographers use color and shape or special symbols to show regions.

Examples:
1. Your address
2. Chinese Buddhists
3. Humans flying in planes
4. Buffalo roamingthe great plains
5. The Sahara desert
6. Tomatoes in Europe
7. Spaghetti sauce being made from tomatoes
8. The pyramids in Egypt
9. I walked on the Great Wall
10. Egyptians built the pyramids

The Geographer’s Tools
• Globes and Maps:
– As people explored the Earth, they collected information about it.
– Mapmakers wanted to present this information correctly.
– The best way was to put it on a globe, a round ball that represented the Earth.

– Because globes are not practical or easy to use to carry, flat maps were invented.
– However, the earth is round and a map is flat.
– Mapmakers had to find ways to make maps accurate.

How Latitude and Longitude Form the Global Grid

The Hemispheres

Globes and Maps
• The most accurate way to present information on the islands, continents, and bodies of water of the world is to put it all on a globe, a round ball like the Earth itself.
• The only difference between a globe and the Earth itself is the scale, or size, represented on the globe.

• Globes have a disadvantage: They cannot be complete enough to be useful and at the same time be small enough to be convenient.
• Therefore, people invented flat maps.

• Maps try to show the Earth, which is round, on a flat surface.
• This causes distortion, or a change in accuracy of the shapes and distances of places.
• It is impossible to show the Earth on a flat surface without some distortion.

• In 1569, a geographer named Gerardus Mercator created a flat map to help sailors navigate long journeys across the globe.
• The Mercator projection, or method of putting a map of the Earth onto a flat piece of paper, is used by nearly all deep-sea navigators.
• The Mercator projection is a conformal map, meaning that it shows correct shapes, but not true distances or sizes.
• There are many types of other projections of the globe.
Getting It All On the MapThe World: Mercator Projection

There are many ways to show a globe on a flat map. The interrupted projection map, on the left, shows real sizes and shapes of continents. The equal area map , below left, shows size accurately. The Peters projection, below, shows land and oceans areas and correct directions accurately
The World: Three ProjectionsInterrupted Projection
Equal-Area Projection
Peters Projection

The World: A Robinson Projection
ARCTIC OCEAN

The Parts of a Map
Compass Rose
• A compass rose is a model of a compass. It tells the cardinal directions, which are north, south, east, and west.
Scale
• The scale on a map tells you the relative distance on the map to the real world. For example, a map’s scale may tell you that one inch on the map equals one mile in the real world.

Key
• The key, or legend, on a map explains what the symbols on a map represent, such as triangles representing trees.
Grids
• Some maps use a grid of parallels and meridians. On a map of a small area, letters and numbers are often used to help you find your location.