Introduction - char.tuiasi.rochar.tuiasi.ro/doace/ · Introduction One of the most important...
10
Transcript of Introduction - char.tuiasi.rochar.tuiasi.ro/doace/ · Introduction One of the most important...


inhise
erhas
dious
andprob-
eata
ify-e
es
.
ents, a
moryd by
tterf how
IntroductionOne of the most important features of modern computing languages is the ability todynamically allocate memory blocks. This freedom allows algorithms to be createdmuch more flexible ways than is possible with static memory allocation. However, tfreedom comes with a price. A program does not always use dynamic memory in thmanner intended by the developer. As a result, memory leaks, bottlenecks and othproblems arise unexpectedly. Traditionally, the only way to counter such problemsbeen to add a lot of extra code to your application to print out information about thememory blocks that get allocated and freed. Unfortunately, this process is at best teand at worst not very informative.
This paper will describe the types of dynamic memory problems which developersend-users frequently encounter. A new tool which helps developers solve memorylems quickly and intuitively will also be described.
Use and Abuse of Dynamic MemoryMany modern algorithms make heavy use of dynamic memory, but few take any grprecautions to insure they achieve the best possible use of the memory system. Asresult, many applications can benefit from streamlining their memory usage or moding the order of their allocation requests to reduce the fragmentation that takes placwhen memory is allocated and freed.
Many algorithms also contain subtle “memory leaks” in which the program consumgrowing amounts of memory as it runs, until the resources of the host are finallyexhausted and the program crashes--sometimes days or even weeks after starting
As stated previously, the only solutions to these problems have involved print statemthat were time-consuming to set up and not always helpful once added. Fortunatelynew solution is now available to aid developers in optimizing memory usage.
A New Solution to Overcoming Memory ProblemsInuse, an Insure++ add-on, is a graphical tool designed to help developers avoid meproblems by displaying and animating in real time the memory allocations performean application.
By watching your program allocate and free dynamic memory blocks, you gain a beunderstanding of the memory usage patterns of your algorithms and also an idea oto optimize their behavior.
1

mostm-
m-msr
mory
forsedthat
ges,her
ortasilyThisthout
Inuse allows you to:
• Look for memory leaks.
• See how much memory your application uses in response to particularuser events.
• Check on the overall memory usage of your application to see if itmatches your expectations.
• Look for memory fragmentation to see if different allocation strategiesmight improve performance.
• Analyze memory usage by function, call stack, and block size.
Avoiding Memory Problems with InuseInuse can help you detect and avoid more than just memory leaks. It can show youcommon memory problems, including memory blowout, memory fragmentation, meory overuse, and memory bottlenecks.
Memory BlowoutMany programers are not aware of the danger which memory blowout poses for comercial and industrial applications. Memory blowout is very common in many prograbecause the operating system allocates pages of memory to the program and nevereleases them. Other programs running on this machine will then be starved for meand crash.
How does memory blowout happen? A program allocates a large chunk of memoryuse and after it is done with it, frees it. At that moment, the freed memory can be reuby the program, but it is not released to the operating system. The reason for this iswhen memory was allocated by the program, the operating system allocated all theneeded memory pages. The operating system then will not release the memory paeven after they are freed by the program, until the program is exited. As a result, otprograms running on the machine needing memory will ultimately crash.
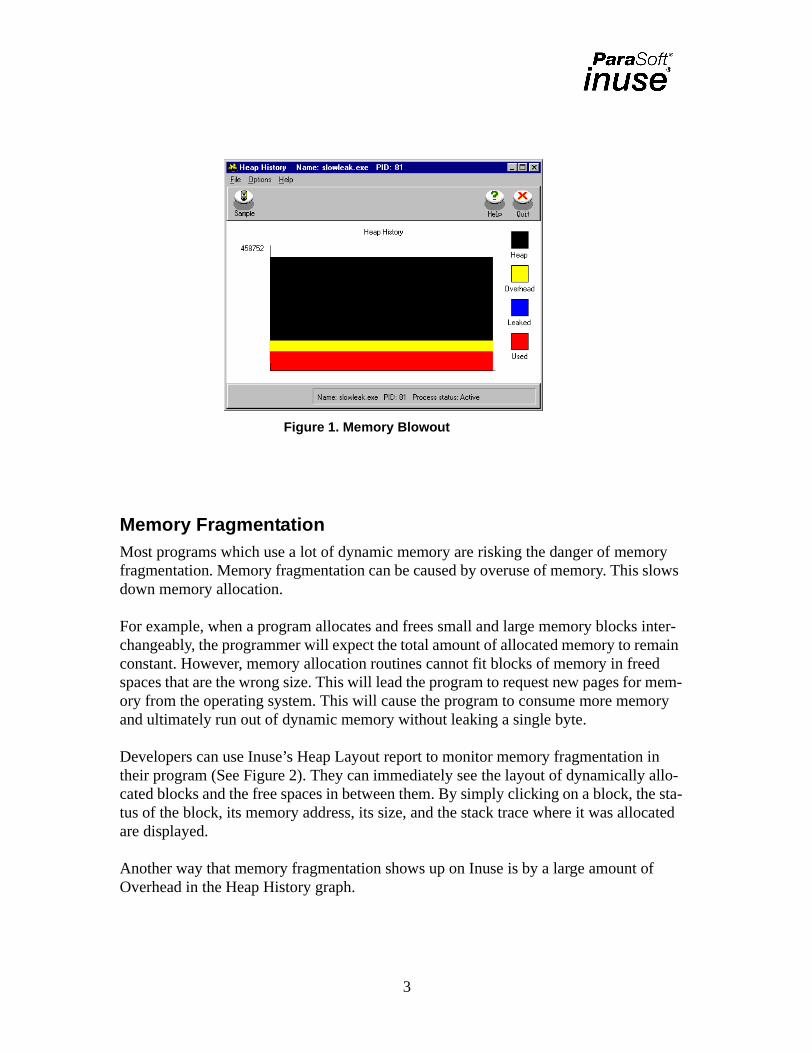
Inuse can help you prevent memory blowouts. Figure 1 shows the Heap History repgenerated by Inuse for a program showing memory blowout. This problem can be eidentified by the large size of the heap and the small amount of allocated memory.shows up on the Inuse display as a low ratio of allocated memory to heap space. WiInuse, it would be difficult-- if not impossible-- for most developers to detect thisimpending “catastrophe.”
2
rylows
nter-ain
mem-ory
inllo-
e sta-ated
f
Memory FragmentationMost programs which use a lot of dynamic memory are risking the danger of memofragmentation. Memory fragmentation can be caused by overuse of memory. This sdown memory allocation.
For example, when a program allocates and frees small and large memory blocks ichangeably, the programmer will expect the total amount of allocated memory to remconstant. However, memory allocation routines cannot fit blocks of memory in freedspaces that are the wrong size. This will lead the program to request new pages forory from the operating system. This will cause the program to consume more memand ultimately run out of dynamic memory without leaking a single byte.
Developers can use Inuse’s Heap Layout report to monitor memory fragmentationtheir program (See Figure 2). They can immediately see the layout of dynamically acated blocks and the free spaces in between them. By simply clicking on a block, thtus of the block, its memory address, its size, and the stack trace where it was allocare displayed.
Another way that memory fragmentation shows up on Inuse is by a large amount oOverhead in the Heap History graph.
Figure 1. Memory Blowout
3

s,
ndndd
Heapandryceeould
thatbe
Inuse can help developers identify and overcome many additional memory problemincluding Memory Overuse and Memory Bottlenecks.
Memory Overuse (Hogging)This is a common problem for many programs. Memory is allocated by a program anever freed. The memory is not leaked, because pointers still stay in the program acan be freed, but the program does not do it. As a result, the program uses more anmore memory until it runs out and crashes.
Memory overuse can be viewed on the Heap History graph. If the amount of leakedmemory is negligible and stays constant, or Insure++ does not report any leaks butHistory exhibits a stairway pattern (as in Figure 3), the program is hogging memoryeventually will run out of memory. In this case, the programmer should use the Quereport to look for totals of memory allocated for different stack traces. The stack trafor which the total amount of allocated memory continues growing likely points to thoffending line of the source code (see Figure 4). At that moment, the programmer shanalyze the code and verify that indeed, the program needs to allocate memory atstage and needs to keep it. If it doesn’t, this is an algorithmic problem and needs tofixed.
Figure 2. Monitoring Fragmented Memory
4

anrgeam.t
Memory BottlenecksBottlenecks occur when an operating system spends more time paging memory thrunning the program. Memory bottlenecks frequently arise when a program uses laamounts of dynamic memory or calls large amounts from different parts of the progrThey are particularly problematic because a program may perform well in-house bustop dead in the field.
Figure 3. Memory Hogging
Figure 4. Analyzing Memory with Query
5
ing,
ves am toiffer-
oryof
path,
iszing
p-pro-firstroad.
ee
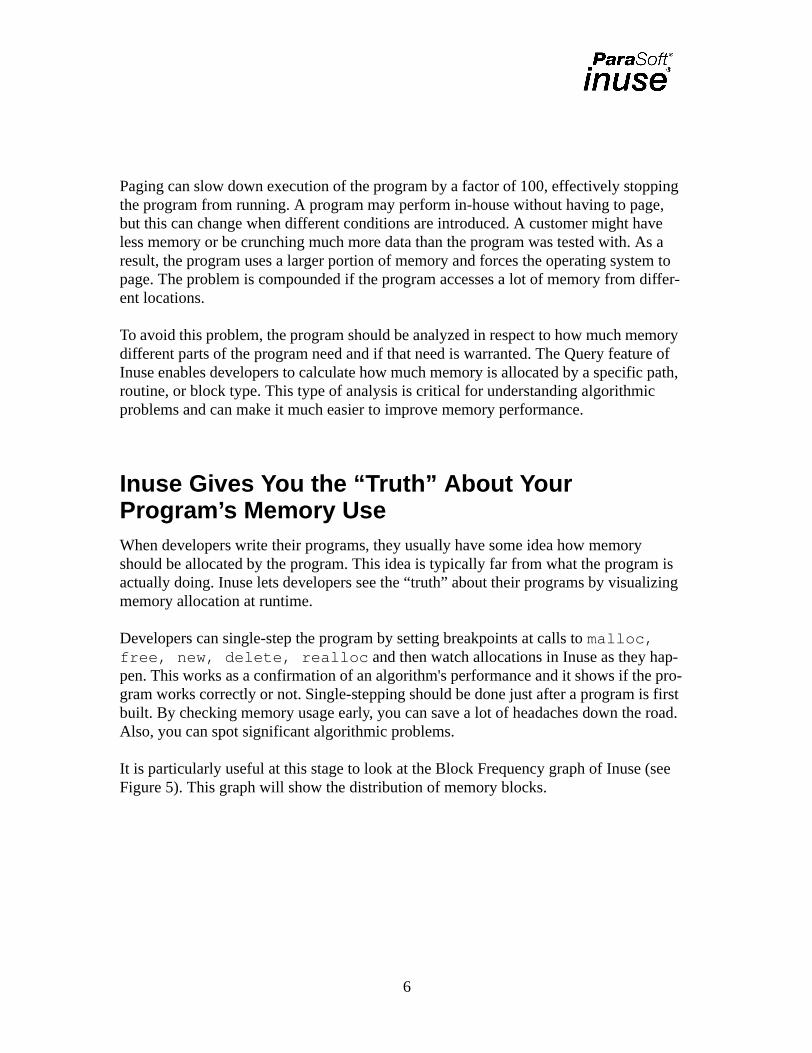
Paging can slow down execution of the program by a factor of 100, effectively stoppthe program from running. A program may perform in-house without having to pagebut this can change when different conditions are introduced. A customer might haless memory or be crunching much more data than the program was tested with. Aresult, the program uses a larger portion of memory and forces the operating systepage. The problem is compounded if the program accesses a lot of memory from dent locations.
To avoid this problem, the program should be analyzed in respect to how much memdifferent parts of the program need and if that need is warranted. The Query featureInuse enables developers to calculate how much memory is allocated by a specificroutine, or block type. This type of analysis is critical for understanding algorithmicproblems and can make it much easier to improve memory performance.
Inuse Gives You the “Truth” About YourProgram’s Memory UseWhen developers write their programs, they usually have some idea how memoryshould be allocated by the program. This idea is typically far from what the programactually doing. Inuse lets developers see the “truth” about their programs by visualimemory allocation at runtime.
Developers can single-step the program by setting breakpoints at calls tomalloc,free, new, delete, realloc and then watch allocations in Inuse as they hapen. This works as a confirmation of an algorithm's performance and it shows if thegram works correctly or not. Single-stepping should be done just after a program isbuilt. By checking memory usage early, you can save a lot of headaches down theAlso, you can spot significant algorithmic problems.
It is particularly useful at this stage to look at the Block Frequency graph of Inuse (sFigure 5). This graph will show the distribution of memory blocks.
6

con-e
onesn be
raminitiallock
Cleaning Up LeaksNot all leaks in a program have to be cleaned. Leaks are only deadly if they reoccurstantly. Leaks which occur only at the beginning of a program can, in most cases, bignored. However, leaks which occur during the execution of a program--especiallyin parts containing loops--are deadly and need to be fixed. The severity of a leak caeasily determined using the Time Layout display of Inuse (See Figure 6). This diagshows blocks as they are allocated in time sequence. All leaks concentrated at thestage of program can be safely ignored. On the Time Layout display, clicking on a bwill show its size, address, and stack trace where it was allocated.
Figure 5. Viewing Block Frequency
Figure 6. Checking the Timing of a Leak
7
em-vail-
e pro-
usewillthe
m-INS1.
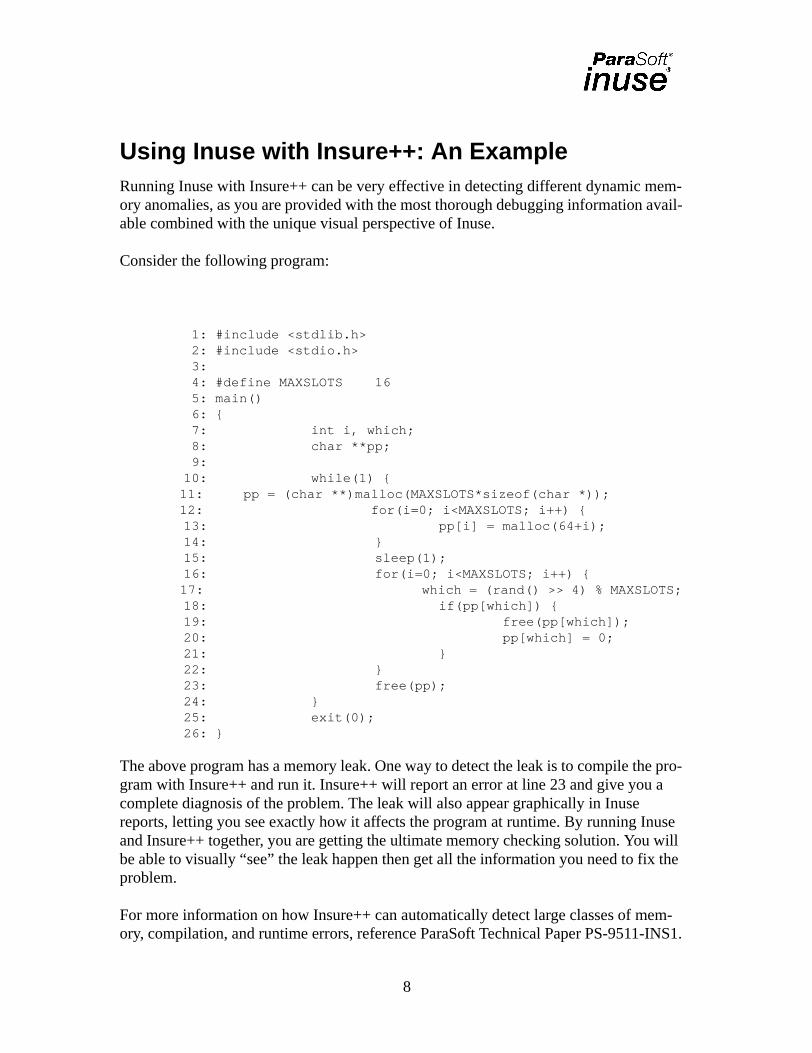
Using Inuse with Insure++: An ExampleRunning Inuse with Insure++ can be very effective in detecting different dynamic mory anomalies, as you are provided with the most thorough debugging information aable combined with the unique visual perspective of Inuse.
Consider the following program:
1: #include <stdlib.h>2: #include <stdio.h>3:4: #define MAXSLOTS 165: main()6: {7: int i, which;8: char **pp;9:
10: while(1) {11: pp = (char **)malloc(MAXSLOTS*sizeof(char *));12: for(i=0; i<MAXSLOTS; i++) {13: pp[i] = malloc(64+i);14: }15: sleep(1);16: for(i=0; i<MAXSLOTS; i++) {
17: which = (rand() >> 4) % MAXSLOTS;18: if(pp[which]) {19: free(pp[which]);20: pp[which] = 0;21: }22: }23: free(pp);24: }25: exit(0);26: }
The above program has a memory leak. One way to detect the leak is to compile thgram with Insure++ and run it. Insure++ will report an error at line 23 and give you acomplete diagnosis of the problem. The leak will also appear graphically in Inusereports, letting you see exactly how it affects the program at runtime. By running Inand Insure++ together, you are getting the ultimate memory checking solution. Yoube able to visually “see” the leak happen then get all the information you need to fixproblem.
For more information on how Insure++ can automatically detect large classes of meory, compilation, and runtime errors, reference ParaSoft Technical Paper PS-9511-
8

es.m-
ro-
sing
boutand
ConclusionDynamic memory is a powerful and convenient feature of modern computing languagHowever, it can be difficult for a developer to fully understand the implications of dynaically allocating memory blocks in a program. Inuse was designed to automate this pcess and present memory usage data in an intuitive, informative format. With theintroduction of Inuse, developers can finally understand just how their programs are u(and abusing) memory.
Inuse is available now (as an Insure++ add-on) at www.parasoft.com. To learn more ahow Inuse and other ParaSoft development tools can help your department preventdetect errors, talk to a Software Quality Specialist today at 1-888-305-0041, or visitwww.parasoft.com.
9