Introduction - catsr.vse.gmu.edu€¦ · Web viewThe word "event" refers to what has triggered...
78
ASSESSMENT OF SOCCER REFEREE PROFICIENCY IN TIME-SENSITIVE DECISION-MAKING George Mason University Senior Design Project: B. Sc. Systems Engineering Final Report Group Leader Instructor /Faculty Sponsor Nathan Jones 703-439-0753 [email protected] Dr. Lance Sherry 703-993-1711 [email protected] Group Members Andrew Cann Hina Popal Saud Almashhadi
Transcript of Introduction - catsr.vse.gmu.edu€¦ · Web viewThe word "event" refers to what has triggered...
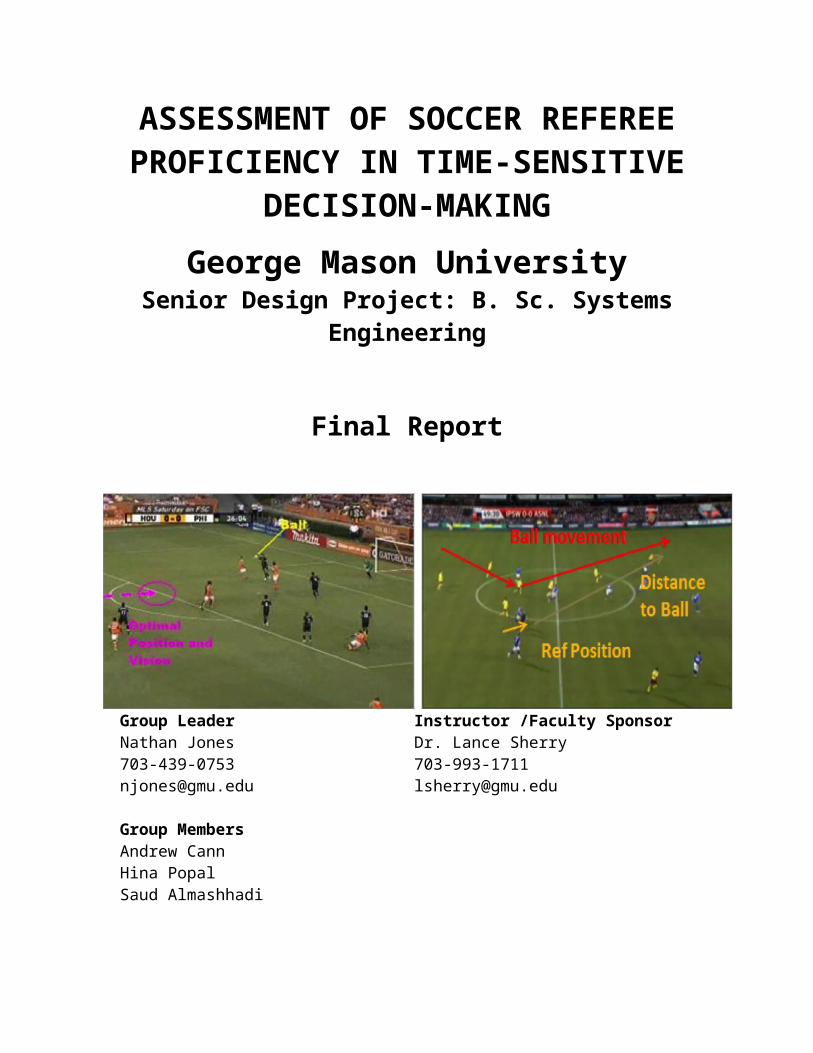
ASSESSMENT OF SOCCER REFEREE PROFICIENCY IN TIME-SENSITIVE
DECISION-MAKING
George Mason UniversitySenior Design Project: B. Sc. Systems Engineering
Final Report
Group Leader Instructor /Faculty SponsorNathan [email protected]
Dr. Lance [email protected]
Group MembersAndrew CannHina PopalSaud Almashhadi

On behalf of the Assessment of Soccer Referee Proficiency in Time-Sensitive Decision-Making George Mason University Senior Design Group (2011-2012) we would like to extend a special thanks to our project sponsor Pat Delany (Metro-DC Virginia State
Referee Program) and our faculty sponsor Dr. Lance Sherry.
Sponsor Testimony:
“The analysis done by the students has been incredibly eye-opening. They have changed the way our management at MDCVSRP think about referee development and
where to use our budget.” Pat Delaney, MDCVSRP

Table of Contents
Introduction.................................................................................................................................................. 1
Organization of American Referees....................................................................................................3
Referee Call Making Process..................................................................................................................5
Evaluation of Referee Quality................................................................................................................7
Problem Statement.....................................................................................................................................8
Need Statement............................................................................................................................................8
Design Alternatives.................................................................................................................................... 8
Baseline Fitness Test............................................................................................................................ 9
Estimated Cost....................................................................................................................................9
Game Flow Evaluation...................................................................................................................... 10
Estimated Cost.................................................................................................................................10
Combined Evaluation........................................................................................................................ 11
No Assessment......................................................................................................................................11
Evaluation of Alternatives....................................................................................................................12
Part I: Discrete Event Soccer Game Simulator............................................................................13
Part 2: Monte Carlo Analysis...............................................................................................................22
Results........................................................................................................................................................... 24
Discrete Event Soccer Game Simulator Results.....................................................................24
Monte Carlo Analysis Results.........................................................................................................25
Utility/Cost Analysis And Recommendation...............................................................................26
Additional Findings................................................................................................................................. 27
Management............................................................................................................................................... 30
Works Cited................................................................................................................................................ 38
Appendix.......................................................................................................................................................... i
ANOVA Analysis....................................................................................................................................... i
Arsenal.................................................................................................................................................... i
Manchester........................................................................................................................................... ii
Stoke...................................................................................................................................................... iiiSYST 495 Final Report
Wigan..................................................................................................................................................... iv
Simulation Output: Regression Analysis......................................................................................v
Data Points........................................................................................................................................... v
General Regression Analysis: Accuracy versus Fitness, GFU.........................................v
Monte Carlo Trials...............................................................................................................................vii
Survey Administered to MDCVSRP Senior Referees..........................................................viii
Electronic Appendix.......................................................................................................................... xiv
SYST 495 Final Report

Table of Figures
Figure 1: Professional Sports Generated Revenue Between 2009 and 2010..................1
Figure 2: Referee Positioning (MR - Main Referee, AR - Assistant Referee).....................2
Figure 3: Grade Progression for U.S. Soccer Referees................................................................3
Figure 4: Distribution of Male Referees by Grade – 2010.........................................................4
Figure 5: System Component Interaction........................................................................................4
Figure 6: Referee Call Making Process..............................................................................................5
Figure 7: Stochastic Discrete Event Soccer Game Simulator................................................12
Figure 8: Movement Polygons............................................................................................................14
Figure 9: Cycle of Events.......................................................................................................................15
Figure 10: Possession Change Between Two Teams................................................................16
Figure 11: Guardian Chalkboard Data............................................................................................17
Figure 12: Referee 2-D Movement Area.........................................................................................19
Figure 13: Call Event Probabilities Based on Field Location................................................20
Figure 14: Call Accuracy Function (Distance <20 yards).......................................................20
Figure 15: Call Accuracy Function (Distance >20 yards).......................................................21
Figure 16: Normal Distribution for Referee Attributes...........................................................23
Figure 17: Analysis of 25 Profiles: Call Accuracy (Fitness, GFU)........................................24
Figure 18: Cost vs. Utility Analysis for Alternatives.................................................................27
Figure 19: Impact of Team Combinations on Referee Call Accuracy................................28
Figure 20: Distance from Calls for United vs. United and Stoke vs. Stoke......................29
Figure 21: Total Work Breakdown Structure for SYST 490/495.......................................30
Figure 22: Work Breakdown Structure for SYST 490..............................................................30
Figure 23: Work Breakdown Structure for SYST 495..............................................................31
Figure 24: PERT Chart............................................................................................................................35
Figure 25: Earned Value Chart...........................................................................................................37
Figure 26: Arsenal - Pass Completion Percentage by Time/Score.........................................i
Figure 27: Manchester United - Pass Completion Percentage by Time / Score..............ii
Figure 28: Stoke City - Pass Completion Percentage by Time / Score...............................iiiSYST 495 Final Report
Figure 29: Wigan - Pass Completion Percentage by Time / Score.......................................iv
Table of Tables
Table 1: Assessment Methods...............................................................................................................7
Table 2: Design Alternatives..................................................................................................................9
Table 3: Admin Material Cost for Baseline Fitness Test............................................................9
Table 4: Assessor Cost for Baseline Fitness Test.......................................................................10
Table 5: Total Estimated Cost for Baseline Fitness Test.........................................................10
Table 6: Equipment Cost for Game-Flow Evaluation...............................................................10
Table 7: Total Estimated Cost for Game Flow Evaluation......................................................11
Table 8: Solomon et. Al Simulation vs. New Simulation..........................................................13
Table 9: Effect of Game Situation on Pass Completion............................................................17
Table 10: Referee Profiles.................................................................................................................... 22
Table 11: Design Alternatives Attribute Cutoffs.........................................................................23
Table 12: Call Accuracy Regression Analysis...............................................................................25
Table 13: Utilities for Grade 8 Evaluation Alternatives..........................................................26
Table 14: Task Breakdown.................................................................................................................. 31
Table 15: Task Budgeting..................................................................................................................... 35
Table 16: Earned Value..........................................................................................................................36
Table 17: Regression Analysis Data Points......................................................................................v
Table 18: Monte Carlo Trials...............................................................................................................vii
Table of Equations
Equation 1: Number of Refresh Rates.............................................................................................13
Equation 2: New Polygon Movement Algorithm........................................................................16
SYST 495 Final Report
Assessment of Soccer Referee Proficiency in Time-Sensitive Decision-Making 4/23/2012
INTRODUCTIONSoccer is generally recognized as the most popular sport in the world.
Between 2009 and 2010, European soccer alone generated roughly $21.6 billion in
revenue, with the English Premier League accounting for $3.2 billion (Figure 1) [1].
This is significantly higher then other popular American sports such as football and
baseball. International soccer competitions such as the FIFA World Cup and UEFA
Champions League also draw the highest average attendance for international club
competitions.
Figure 1: Professional Sports Generated Revenue Between 2009 and 2010
Much of soccer’s recent success and growth in popularity can be attributed to
improvement in viewer experiences. With rapid increases in camera technology,
fans can now watch games from angles, at a high resolution, and view replays of key
events.
Two teams, each fielding eleven players, compete against one another in a
soccer match. The duration of the match is commonly two, forty-five minute
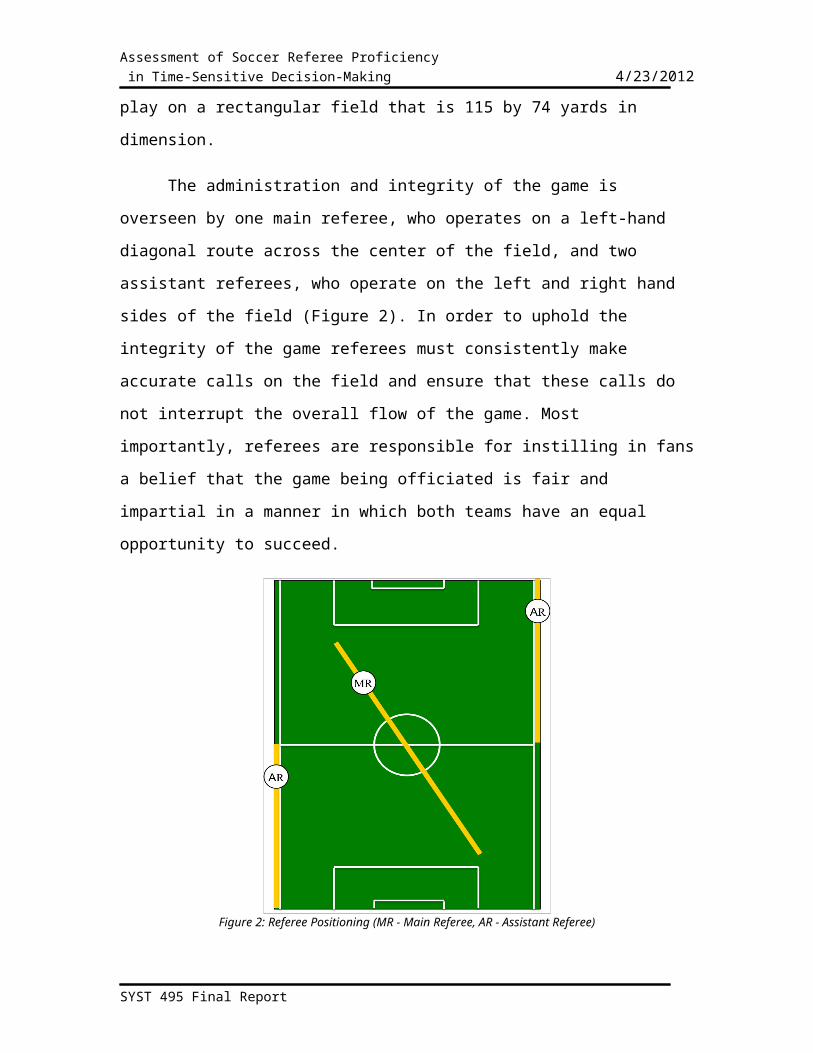
periods. The teams play on a rectangular field that is 115 by 74 yards in dimension.
The administration and integrity of the game is overseen by one main
referee, who operates on a left-hand diagonal route across the center of the field,
and two assistant referees, who operate on the left and right hand sides of the field
(Figure 2). In order to uphold the integrity of the game referees must consistently
make accurate calls on the field and ensure that these calls do not interrupt the
overall flow of the game. Most importantly, referees are responsible for instilling in
SYST 495 Final Report

Assessment of Soccer Referee Proficiency in Time-Sensitive Decision-Making 4/23/2012
fans a belief that the game being officiated is fair and impartial in a manner in which
both teams have an equal opportunity to succeed.
Figure 2: Referee Positioning (MR - Main Referee, AR - Assistant Referee)
Although technical upgrades have been implemented to enhance viewer
experience, the governing bodies of soccer have been mostly unwilling to implement
referee support technology, such as replays, for fear that it will interfere with game
flow [2]. Thus, as the quality of soccer broadcasting has improved, the tools
available to the referee have remained the same. This imbalance of technology has
lead to an asymmetry in information where fans often have better information for
judging the accuracy of a call than the referees on the field. This allows fans to easily
identify injustices in the administration of the game, and has caused backlashes
against the sport when incorrect calls alter the outcome of the match [2]. Therefore,
poor referee performance can be considered one of the greatest threats currently
facing the sport of soccer.
SYST 495 Final Report

Assessment of Soccer Referee Proficiency in Time-Sensitive Decision-Making 4/23/2012
ORGANIZATION OF AMERICAN REFEREES
Within the United States, soccer referees undergo a structured training and
evaluation process. The process is broken into eight levels of seniority (grades) in
which grades 8-7 represent entry level referees, 6-5 contain state referees, 4-3
comprise national referees, and 2-1 are reserved for FIFA international referees
[3,4] (Figure 3). Grade 8 referees are typically referred to as “junior” referees
whereas referees in grade 7-1 are referred to as “senior” referees.
Figure 3: Grade Progression for U.S. Soccer Referees
Progression of referees beyond grade 8 is voluntary and requires classes, written
examinations, fitness tests, and game performance evaluations. A referee’s grade
determines the level of game he is recommended to officiate [4].
The United States Soccer Federation (USSF) oversees all referees in grades 4-
1 where those in grades 8-5 are overseen by state level referee organizations [4].
The state level organization within the Common Wealth of Virginia, the Metro DC
Virginia State Referee Program (MDCVSRP), serves as the sponsor for this project.
Within the MDCVSRP, 96.8% of referees reside within grade 8 while the remaining
3.2% of referees are distributed throughout grade 7-1 (Figure 4) [5]. The USSF
provides funding to the MDCVSRP in exchange for the MDCVSRP training and
promoting top-level, high-quality referees to the national level. The interactions of
the MDCVSRP and with its stakeholders can be seen in Figure 5.
SYST 495 Final Report
Assessment of Soccer Referee Proficiency in Time-Sensitive Decision-Making 4/23/2012
Figure 4: Distribution of Male Referees by Grade – 2010
Figure 5: System Component Interaction
The success of efforts to improve on-field performance hinges on an ability to
evaluate referee quality. Evaluating referee quality is key to progressing referees to
more senior grades and properly assigning referees to games [4,6].
SYST 495 Final Report

Assessment of Soccer Referee Proficiency in Time-Sensitive Decision-Making 4/23/2012
REFEREE CALL MAKING PROCESS
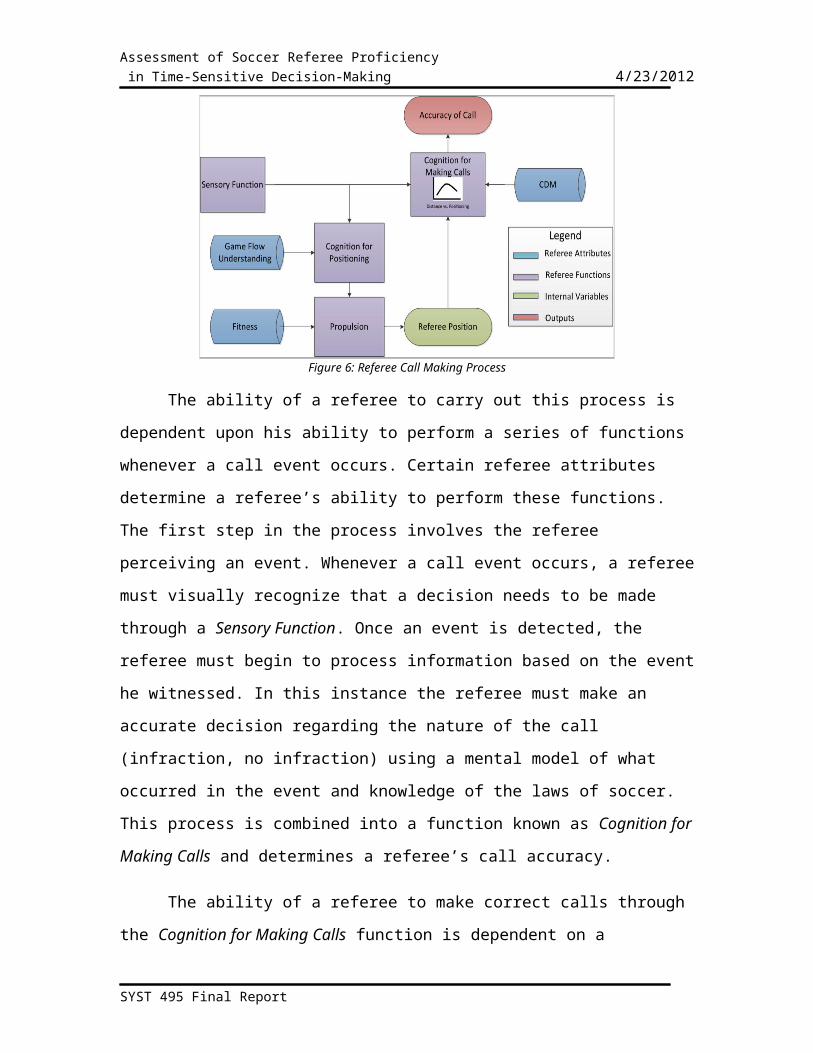
A referee’s quality is defined as the percent of correct calls during games. A
referee’s call accuracy is dependent upon on how effectively he is able to carry out a
standard decision making process whenever a call event is triggered (Figure 6).
Figure 6: Referee Call Making Process
The ability of a referee to carry out this process is dependent upon his ability
to perform a series of functions whenever a call event occurs. Certain referee
attributes determine a referee’s ability to perform these functions. The first step in
the process involves the referee perceiving an event. Whenever a call event occurs, a
referee must visually recognize that a decision needs to be made through a Sensory
Function. Once an event is detected, the referee must begin to process information
based on the event he witnessed. In this instance the referee must make an accurate
decision regarding the nature of the call (infraction, no infraction) using a mental
model of what occurred in the event and knowledge of the laws of soccer. This
process is combined into a function known as Cognition for Making Calls and
determines a referee’s call accuracy.
The ability of a referee to make correct calls through the Cognition for Making
Calls function is dependent on a referee’s distance from the call, which is
determined through the interaction of two functions. The first function, Cognition
SYST 495 Final Report

Assessment of Soccer Referee Proficiency in Time-Sensitive Decision-Making 4/23/2012
for Positioning, defines a referee’s ability to choose an optimal position to make calls.
This function is dependent on a referee’s Sensory Function and mental model of
game flow. Referees may either reactively position themselves based on game flow,
or if they have a high level of game flow understanding, they may proactively
position themselves to make calls. The second function, Propulsion, is a physical
function determining a referee’s ability to move to the position identified during the
Cognition for Positioning function in a time effective manner. Once a referee has
processed all of the information necessary to make a decision, the referee must then
take physical action and executes their command based on the information
processed.
The ability of a referee to carry out the Cognition for Making Calls, Cognition
for Positioning, and Propulsion functions is assumed to depend on three attributes.
Game flow understanding (GFU) is the ability of a referee to perform Cognition for
Positioning. Game flow understanding describes a referee’s ability to interact with
the flow of the game and to either reactively position oneself based on ball
movement or to proactively positions oneself based on probable ball movement and
call events. Fitness is the ability of a referee to carry out Propulsion, which involves a
referee’s athletic ability to transition themselves from a starting location to a
desired end location in a timely manner. Call decision-making (CDM) is the ability of
a referee to carry out Cognition for Making Calls. This involves the referee’s ability to
construct a mental model of the occurred event and draw upon his knowledge of the
rules of the game to make an accurate decision with regards to the nature of the
event.
SYST 495 Final Report

Assessment of Soccer Referee Proficiency in Time-Sensitive Decision-Making 4/23/2012
EVALUATION OF REFEREE QUALITY
Evaluating referee quality focuses on assessing referees in terms of their
game flow understanding, fitness, and call decision-making attributes.
Currently, the MDCVSRP implements three different assessment methods to
assess these attributes (Table 1). Game flow understanding is currently evaluated
indirectly through annual on field assessments conducted by official assessors1 for
referees grades 7 -1 [4]. Fitness is evaluated through various fitness tests including
a series of sprints and long distance runs. This test is comparable to the
“presidential” fitness test administered to public high school students. The fitness
test is administered annually to referees grade 7-1 [4]. Call decision-making is
evaluated through written examinations administered to all referees and annual on
field assessments for referee’s grades 7-1 [4]. Performance metrics for each of these
assessment methods vary and increase in difficulty as the grade of the referee being
tested progresses.
Table 1: Assessment Methods
Referee Attributes Assessment MethodFitness Fitness Test (Senior Referees)
Call Decision Making (CDM) Written exam on rules (All referees)
Game Flow Understanding (GFU)Indirectly using on field assessment
(Senior Referees)
This current assessment methodology has significant gaps in assessing
referees based on attributes. In particular, referees in grade 8, which account for the
majority (96%) of referees within the Commonwealth of Virginia, do not receive any
evaluations for game flow understanding or fitness [6].
PROBLEM STATEMENT
1 “Assessors are experienced coach-mentors, whose referee experience enables themto observe how the referees handle the challenges presented to them by the match” [7]. Assessors must have experience at the senior referee level before converting to Assessors.
SYST 495 Final Report

Assessment of Soccer Referee Proficiency in Time-Sensitive Decision-Making 4/23/2012
Due to the gaps in assessment methodology, 96% of Metro DC Virginia State
Referee Program referees (Grade 8) currently do not undergo assessments for game
flow understanding and fitness attributes as predictors of call accuracy.
NEED STATEMENT
An evaluation system is needed to predict the quality (call accuracy) of grade
8 referees overseen by the MDCVSRP based on their fitness and/or game flow
understanding attributes.
DESIGN ALTERNATIVES
Four evaluation system concepts have been identified to assess the quality of
grade 8 referees (Table 2). The specifics of design and implementation of these
concepts are considered outside the scope of this project. The cost of each
alternative is defined as the investment necessary to purchase required physical
resources and carry out a one-time quality evaluation of all grade 8 referees. Three
alternatives would involve a Baseline Fitness Test and a Game Flow Evaluation,
either single or in combination. A fourth alternative would involve no testing (status
quo).
Table 2: Design Alternatives
# Alternative Description Tests Total Cost (5,139
SYST 495 Final Report
Assessment of Soccer Referee Proficiency in Time-Sensitive Decision-Making 4/23/2012
Referees)
1 Fitness Test
A baseline fitness test equivalent to those
administered to grade 7-1.
Fitness $26.990
2Game Flow Evaluation
Video performance assessments conducted
by official assessors.
Game-Flow Understanding
$337,995
3Combined Evaluation
Combination of first two evaluations
Fitness and Game-Flow
Understanding$341,870
4 No AssessmentNot conducting any referee evaluations
(status quo).None $0.00
Baseline Fitness Test
This alternative involves a baseline fitness test administered to all grade 8
referees within MDCVSRP. The results of the baseline fitness test would be used to
assign each referee a fitness attribute rating as a means of assessing overall quality.
This would be the same fitness test currently administered to referee grades 7-1.
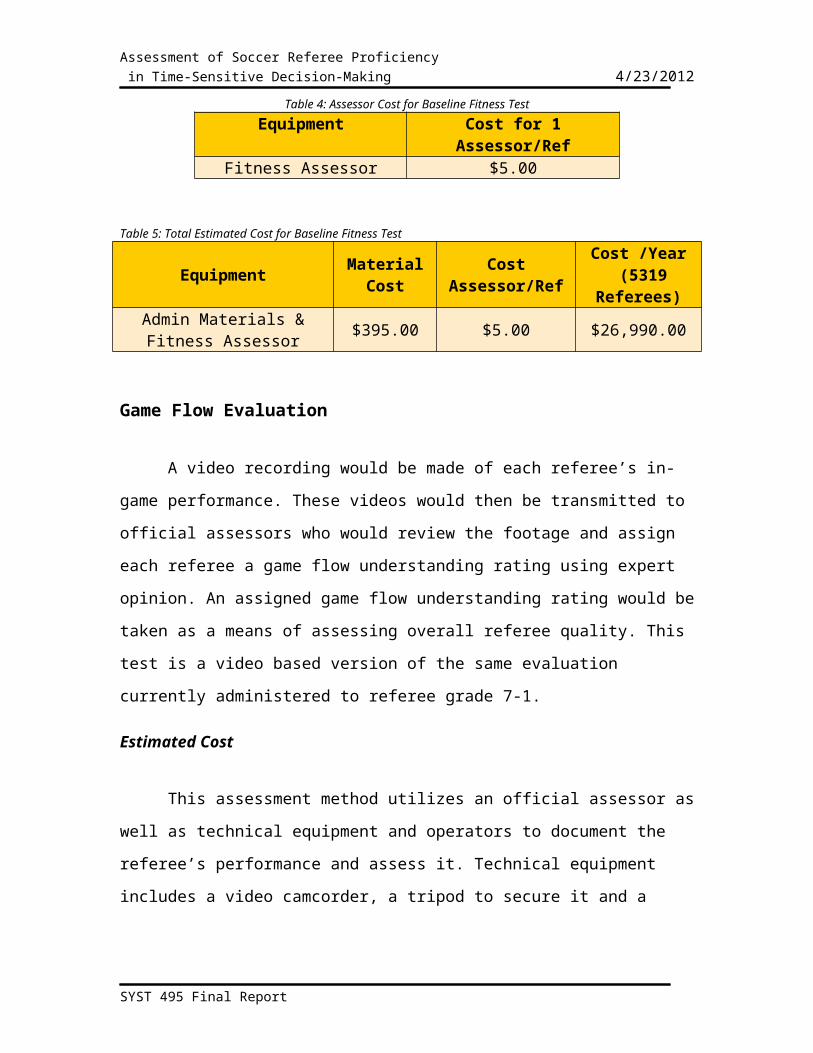
Estimated Cost
The estimated cost for this assessment method involves the rate of pay for
the fitness assessor, who would be responsible for administering the fitness tests
and noting the referees’ performances. The administrative resources necessary to
complete this test were also factored in to the total estimated cost, which summed
out at $26,990.
Table 3: Admin Material Cost for Baseline Fitness Test
Admin Material
Cost for 1 Set Needed Sets Total Cost
Clipboards (24) $40.00 5 $200.00
Pens (60) $7.00 17 $200.00
Paper (2500) $19.00 4 $76.00
Total $66.00 26 $395.00
SYST 495 Final Report

Assessment of Soccer Referee Proficiency in Time-Sensitive Decision-Making 4/23/2012
Table 4: Assessor Cost for Baseline Fitness Test
Equipment Cost for 1 Assessor/RefFitness Assessor $5.00
Table 5: Total Estimated Cost for Baseline Fitness Test
EquipmentMaterial
CostCost
Assessor/Ref
Cost /Year (5319
Referees)Admin Materials & Fitness
Assessor$395.00 $5.00 $26,990.00
Game Flow Evaluation
A video recording would be made of each referee’s in-game performance.
These videos would then be transmitted to official assessors who would review the
footage and assign each referee a game flow understanding rating using expert
opinion. An assigned game flow understanding rating would be taken as a means of
assessing overall referee quality. This test is a video based version of the same
evaluation currently administered to referee grade 7-1.
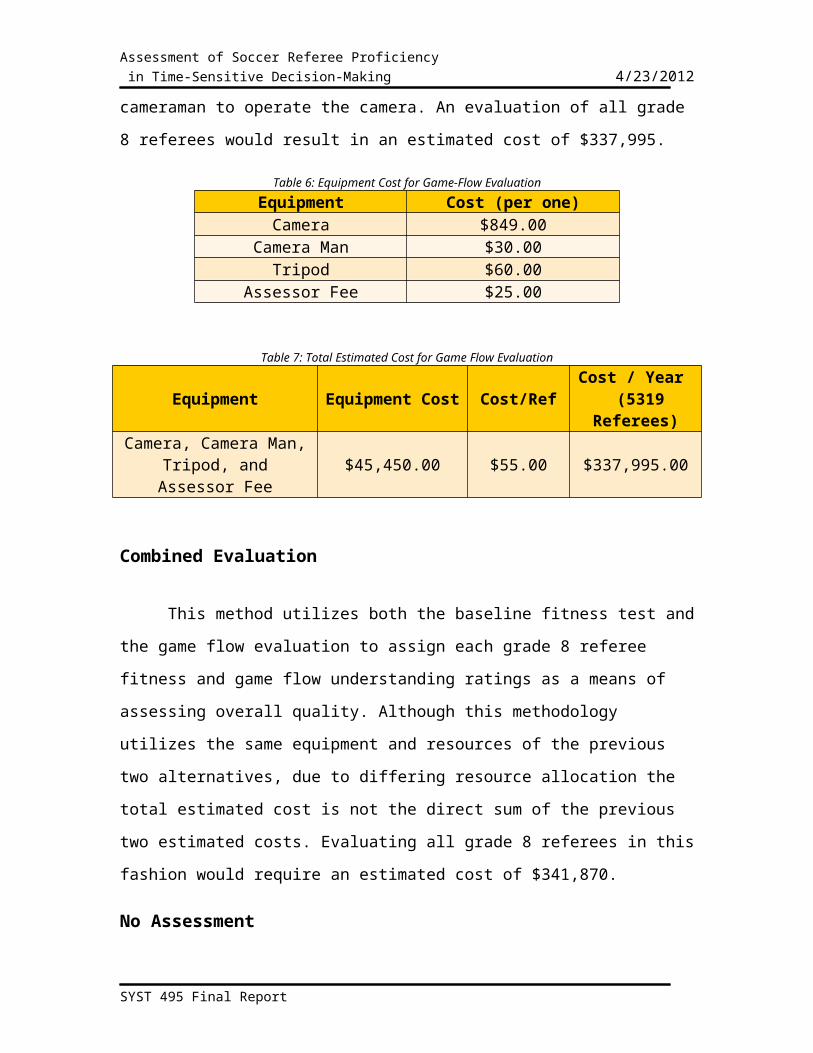
Estimated Cost
This assessment method utilizes an official assessor as well as technical
equipment and operators to document the referee’s performance and assess it.
Technical equipment includes a video camcorder, a tripod to secure it and a
cameraman to operate the camera. An evaluation of all grade 8 referees would
result in an estimated cost of $337,995.
Table 6: Equipment Cost for Game-Flow Evaluation
Equipment Cost (per one)Camera $849.00
Camera Man $30.00Tripod $60.00
SYST 495 Final Report

Assessment of Soccer Referee Proficiency in Time-Sensitive Decision-Making 4/23/2012
Assessor Fee $25.00
Table 7: Total Estimated Cost for Game Flow Evaluation
Equipment Equipment Cost Cost/RefCost / Year
(5319 Referees)
Camera, Camera Man, Tripod, and Assessor Fee
$45,450.00 $55.00 $337,995.00
Combined Evaluation
This method utilizes both the baseline fitness test and the game flow
evaluation to assign each grade 8 referee fitness and game flow understanding
ratings as a means of assessing overall quality. Although this methodology utilizes
the same equipment and resources of the previous two alternatives, due to differing
resource allocation the total estimated cost is not the direct sum of the previous two
estimated costs. Evaluating all grade 8 referees in this fashion would require an
estimated cost of $341,870.
No Assessment
Under this alternative, no assessment is conducted to assess the game flow
understanding or fitness attributes of referees. This alternative exists as a point of
reference against which to compare the cost and benefit of the three preceding
alternatives and represents the status quo for assessments at the grade 8 level
requiring no implementation cost.
SYST 495 Final Report

Assessment of Soccer Referee Proficiency in Time-Sensitive Decision-Making 4/23/2012
EVALUATION OF ALTERNATIVES
The utility of each alternative is defined as the expected call accuracy of the
top 100 referees identified using each alternative within the junior referee pool of
MDCVSRP (roughly 5000 referees). In order to determine the utility of each
alternative, a two part analysis was conducted to select the most beneficial system
for grade 8 referees.
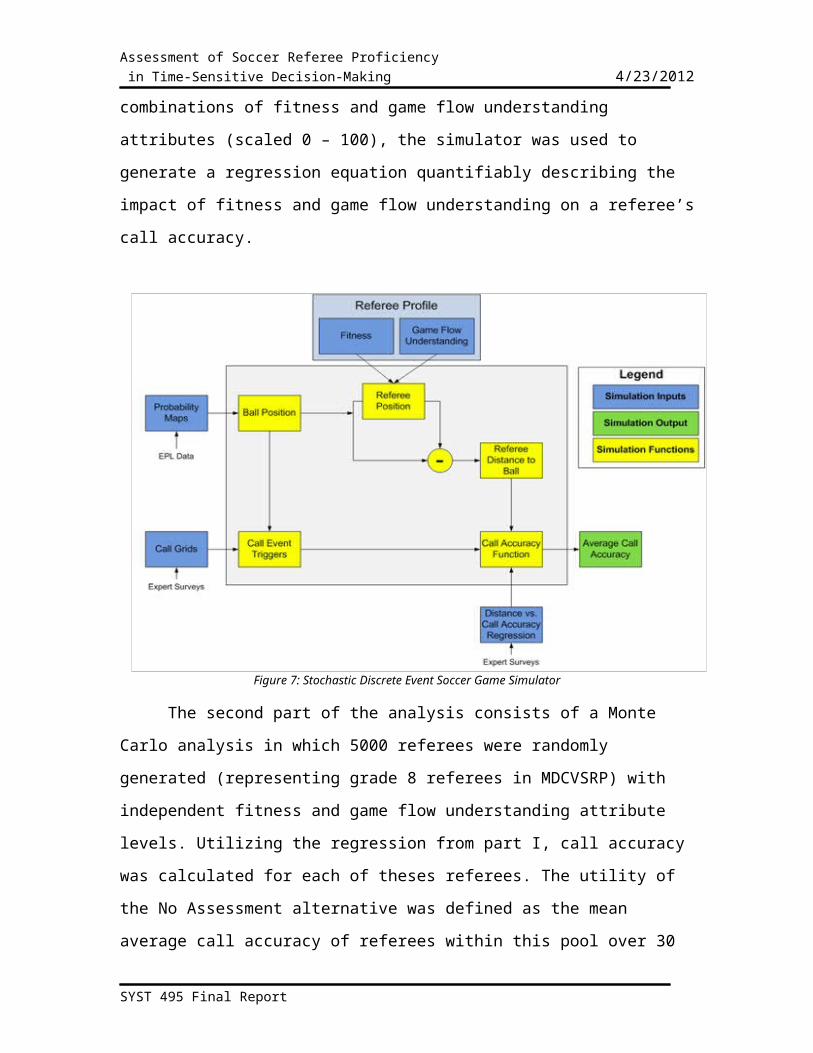
The first part of the analysis utilized a stochastic discrete event simulator
modeling a referee’s ability to position and make calls based on fitness and game
flow understanding attribute levels (Figure 7). Through performance evaluation of
25 referee profiles defined as combinations of fitness and game flow understanding
attributes (scaled 0 – 100), the simulator was used to generate a regression
equation quantifiably describing the impact of fitness and game flow understanding
on a referee’s call accuracy.
Figure 7: Stochastic Discrete Event Soccer Game Simulator
SYST 495 Final Report

Assessment of Soccer Referee Proficiency in Time-Sensitive Decision-Making 4/23/2012
The second part of the analysis consists of a Monte Carlo analysis in which
5000 referees were randomly generated (representing grade 8 referees in
MDCVSRP) with independent fitness and game flow understanding attribute levels.
Utilizing the regression from part I, call accuracy was calculated for each of theses
referees. The utility of the No Assessment alternative was defined as the mean
average call accuracy of referees within this pool over 30 scenarios. Each remaining
evaluation program is used to identify the top 100 referees for each of the 30
scenarios. The mean average call accuracy of these 100 referees is used to represent
the utility for each alternative.
PART I: DISCRETE EVENT SOCCER GAME SIMULATOR
The original concept for this simulator was derived from a previous George
Mason University student project [8]. This concept consisted of probability guided
ball movement over a soccer field grid where a modeled referee would position and
respond to randomly generated call events [8]. From this initial concept, the
simulator used in this project was redesigned and coded independently of past
work. For a direct comparison between the simulator used in this project verses the
pervious simulator, see Table 8.
Table 8: Solomon et. Al Simulation vs. New Simulation
Simulation Element Solomon, et. Al. New Simulation
Probability Maps1 map for all teams, all time
and all score19 maps dependent on team, time, and score
Ball Position Function 1 event 4 state cycle scaled to time
Referee Position Function1-D, chase ball on left
diagonal2-D, based on GFU, scaled to
timeFitness 3 levels 5 levels
Game Flow Understanding None5 levels based on probability
maps
Call Grids NoneDetermined from survey
administered to 16 senior state referees
Call Event Trigger Simple ProbabilityCall grids and position in
cycleDistance vs. Call Accuracy Estimated Figure of Merit Determined from survey
SYST 495 Final Report

Assessment of Soccer Referee Proficiency in Time-Sensitive Decision-Making 4/23/2012
Functionadministered to 16 senior
state referees and generated regression
Number of Teams in Game Home vs. Home Home vs. Away (4 options)Number of Teams Simulated 1 4
Team Strategy Changes Never Time / ScoreReferee/Ball Movement
Scaled to TimeNo Yes
Ball Movement
The stochastic soccer game simulator divides a soccer field into a fine set of
8,510 square cells where each cell represents a 1 x 1 yard area. Each of these cells is
allocated to 1 of 60 movement polygons (Figure 8) and 1 of 24 call grids.
Figure 8: Movement Polygons
Throughout a 90 minute simulated game, the ball moves from cell to cell
adhering strictly to a play cycle of four events. This cycle begins with a pass
reception (0.5s) and transitions into local dribbling (4.5s) in which the ball moves
within its current polygon. This is followed by either a shot on goal (0.5s) or a pass
(0.5s) (Figure 9). If a pass, the ball will move to its reception location over a period
of time depending on the distance traveled (See Equation 1). This play cycle repeats
until the simulation terminates.
SYST 495 Final Report

Assessment of Soccer Referee Proficiency in Time-Sensitive Decision-Making 4/23/2012
Figure 9: Cycle of Events
Number of RefreshRates=2√(Start x−Finish x)2+(Start y−Finish y )2
Speed∈ yardsseconds
Equation 1: Number of Refresh Rates
As the ball moves throughout the play cycle, it refreshes its position every 0.5
seconds of simulated game time. At any instant, the ball is possessed by one of two
teams, each executing its own unique strategy. For each team, a set of probability
maps represents that team’s strategy and style of play. For each of the 60 polygons,
these maps specify the probability that the ball moves to any other polygon or is
shot at the goal. A further dimension of the map indicates probabilities that a pass or
shot is successful. Changes in possession occur due to failed passes or shot events
(Figure 10).
SYST 495 Final Report
Assessment of Soccer Referee Proficiency in Time-Sensitive Decision-Making 4/23/2012
Figure 10: Possession Change Between Two Teams
Based on data collected from 80 English Premier League games, probability
map sets were formulated for 4 teams: Wigan, Manchester United, Arsenal, and
Stoke. These teams were chosen to give a broad representation of different play
styles and enable the simulator to replicate a vast number of game flow situations.
Data was collected from the Guardian Chalkboard website which tracks English
Premier League games and records all pass and shot events in the form of vectors
(Figure 11). In order to collect this data a java based data collection tool was created
and with it over 35,000 shot and pass events (80 games) were collected manually.
SYST 495 Final Report
Assessment of Soccer Referee Proficiency in Time-Sensitive Decision-Making 4/23/2012
Figure 11: Guardian Chalkboard Data
Using pass completion as a metric representing team strategy, an ANOVA
analysis was conducted (Table 9) to determine if teams changed their strategy
based on score differential (ahead, behind, tie) or elapsed game time (divided into 6
discrete 15 minute time periods). The results of this analysis were used to
determine how many probability maps were needed to encapsulate each team’s
strategy and when maps should be changed, based on situation, to reflect strategy
alterations.
Table 9: Effect of Game Situation on Pass Completion
Situation Arsenal United Stoke WiganTime p = 0.777 p = 0.142 p = 0.001 p = 0.001Score p = 0.231 p = 0.001 p = 0.000 p = 0.000
Time*Score p = 0.338 p = 0.000 p = 0.000 p = 0.116
It was concluded that Arsenal utilizes a single probability map for all game
situations. Stoke, Manchester United, and Wigan utilize six probability maps each
representing situations where the team is ahead, behind, or tied in the first and
second half respectively (19 total maps formulated).
SYST 495 Final Report

Assessment of Soccer Referee Proficiency in Time-Sensitive Decision-Making 4/23/2012
Upon concluding the dribbling event in the play cycle, the probability that the
ball is passed (versus shot at the goal) depends on game situation determined using
the active probability map of the team with possession. If a shot occurs, the active
map indicates the destination polygon of the pass and chance of success (Equation
2).
Polygon (n+1 )=Polygon (n )× Probability MapEquation 2: New Polygon Movement Algorithm
If a shot occurs, the active map indicates the probability that the shot will
result in a goal. Executing passes and shots in this fashion allows the simulator to
accurately represent the flow of a soccer game in which a referee must interact.
To ensure the time of ball movement accurately represents that of a soccer
game, whenever the ball is being dribbled or passes a single destination cell is set.
The ball moves to that destination in a straight-line trajectory, which it follows for a
duration of simulated time (Equation 1).
Referee Movement
In the simulation, a single referee is modeled running within a standard
diagonal system of control 2 – dimensional area (Figure 12). The speed of the
referee is calibrated to represent the fitness level of the referee profile being tested.
Every 0.5 seconds, the referee sets his desired position using one of two
movement scripts. In script I, the referee sets his destination to the closest cell
within 11 – 13 yards of the ball’s current location. This script represents a referee
positioning himself in a reactive manner. In script II, the referee sets his destination
to the closest cell with 11 – 13 yards of the next most probably pass destination as
determined using the active probability map of the team with possession. This script
represents a referee positioning himself in a proactive manner
SYST 495 Final Report
Assessment of Soccer Referee Proficiency in Time-Sensitive Decision-Making 4/23/2012
Figure 12: Referee 2-D Movement Area
Upon setting his destination using script I or II, a referee will begin moving
towards his destination using the same straight line movement algorithm described
previously for ball movement (Equation 1).
At the beginning of each play cycle, the probability that the referee utilizes
script II is determined by the referee’s game flow understanding level (higher game
flow understanding yields higher probability). Furthermore, this same game flow
understanding probability is used to determine the likelihood that if a call were to
occur in the current cycle, the referee will recognize the buildup to the call and
switch to script I until the call transpires.
Call Events
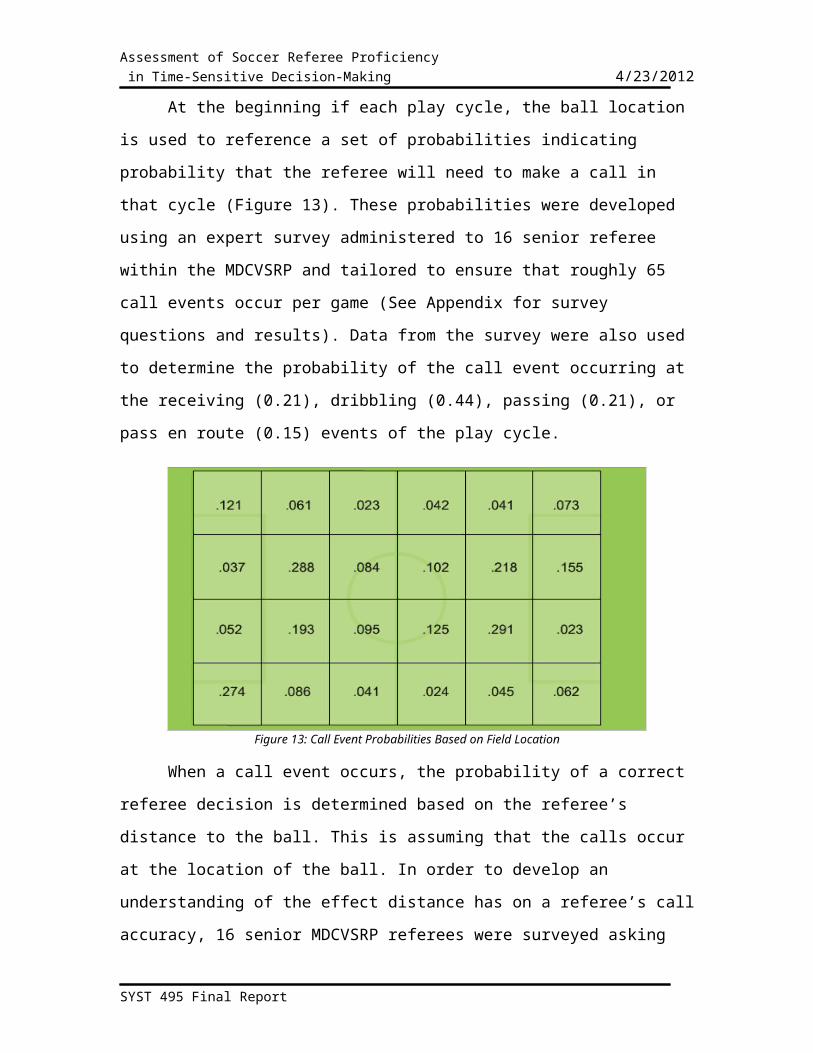
At the beginning if each play cycle, the ball location is used to reference a set
of probabilities indicating probability that the referee will need to make a call in that
cycle (Figure 13). These probabilities were developed using an expert survey
administered to 16 senior referee within the MDCVSRP and tailored to ensure that
roughly 65 call events occur per game (See Appendix for survey questions and
results). Data from the survey were also used to determine the probability of the call
event occurring at the receiving (0.21), dribbling (0.44), passing (0.21), or pass en
route (0.15) events of the play cycle.
SYST 495 Final Report

Assessment of Soccer Referee Proficiency in Time-Sensitive Decision-Making 4/23/2012
Figure 13: Call Event Probabilities Based on Field Location
When a call event occurs, the probability of a correct referee decision is
determined based on the referee’s distance to the ball. This is assuming that the
calls occur at the location of the ball. In order to develop an understanding of the
effect distance has on a referee’s call accuracy, 16 senior MDCVSRP referees were
surveyed asking them to rate call accuracy at a series of 12 distances. Using the
results of this survey, a regression was performed relating the probability of making
a correct call to a referee’s distance from the call (Figures 14, 15).
Figure 14: Call Accuracy Function (Distance <20 yards)
SYST 495 Final Report

Assessment of Soccer Referee Proficiency in Time-Sensitive Decision-Making 4/23/2012
Figure 15: Call Accuracy Function (Distance >20 yards)
The results of this regression was a piecewise equation with call accuracy
peaking at around 11-13 yards and decreasing at a rapid pace past 20 yards getting
to as low as ~28% at 60 yards. It should be noted however that the average
standard deviation for the 12 distances polled on the survey was 21.3%, indicating
disagreement among participants.
Over the course of the simulated game, the call accuracy of a referee is
defined as the number of correct calls divided by the total number of calls made.
Simulation Methodology
To determine the impact of fitness and game flow understanding on call
accuracy, each of the 25 distinct referee profiles representing different
combinations of fitness and game flow understanding (scale from 0 – 100) was
simulated through 2000 games representing 200 games for each combination of the
Arsenal, Manchester United, Stoke, and Wigan play styles. Referee speeds
corresponding to profile fitness ranged linearly from 2.023 yards/second at fitness
= 0 to 3.911 yards/second at fitness = 100. Probabilities corresponding to profile
game flow understanding ranged linearly from 0.25 at GFU = 0 to 0.90 at GFU = 100
(Table 10). The average call accuracy for each profile over the simulated games was
SYST 495 Final Report

Assessment of Soccer Referee Proficiency in Time-Sensitive Decision-Making 4/23/2012
used to formulate a multivariate regression for call accuracy as a function of fitness
and game flow understanding level.
Table 10: Referee Profiles
PART 2: MONTE CARLO ANALYSIS
For each Monte Carlo scenario, 5000 referees are randomly generated under
the assumption that each referee’s fitness and game flow understanding levels are
uncorrelated and represent independent draws from normal distributions (mean
50, standard deviation 15) (Figure 16). In Figure 16, the variable X on the x-axis
represents one of the two independent referee traits.
SYST 495 Final Report

Assessment of Soccer Referee Proficiency in Time-Sensitive Decision-Making 4/23/2012
Figure 16: Normal Distribution for Referee Attributes
Using the regression from the part I analysis, average call accuracy for each
referee profile was determined. Using normal cumulative density functions to
ensure the selection of roughly 100 top referees, fitness and/or game flow
understanding cutoffs were defined for the first three alternatives based on
attributes (Table 11).
Table 11: Design Alternatives Attribute Cutoffs
AlternativeAttribute Assessed
CutoffAvg. # of
Referees ChosenFitness Test Fitness Fitness > 81 97Game Flow Evaluation
Game Flow Understanding
GFU > 81 97
Combined Evaluation
Fitness, Game Flow Understanding
Fitness > 66 &Game Flow
Understanding > 66102
No Assessment N/A N/A 100
The mean average call accuracy of selected referees over 30 scenarios was
used to define the utility of these alternatives. The utility of the No Assessment
alternative was defined simply as the mean average call accuracy of referees within
each pool. The analytical method assumes that each alternative has an idealized
ability to evaluate the attributes assessed.
SYST 495 Final Report

Assessment of Soccer Referee Proficiency in Time-Sensitive Decision-Making 4/23/2012
RESULTS
Discrete Event Soccer Game Simulator Results
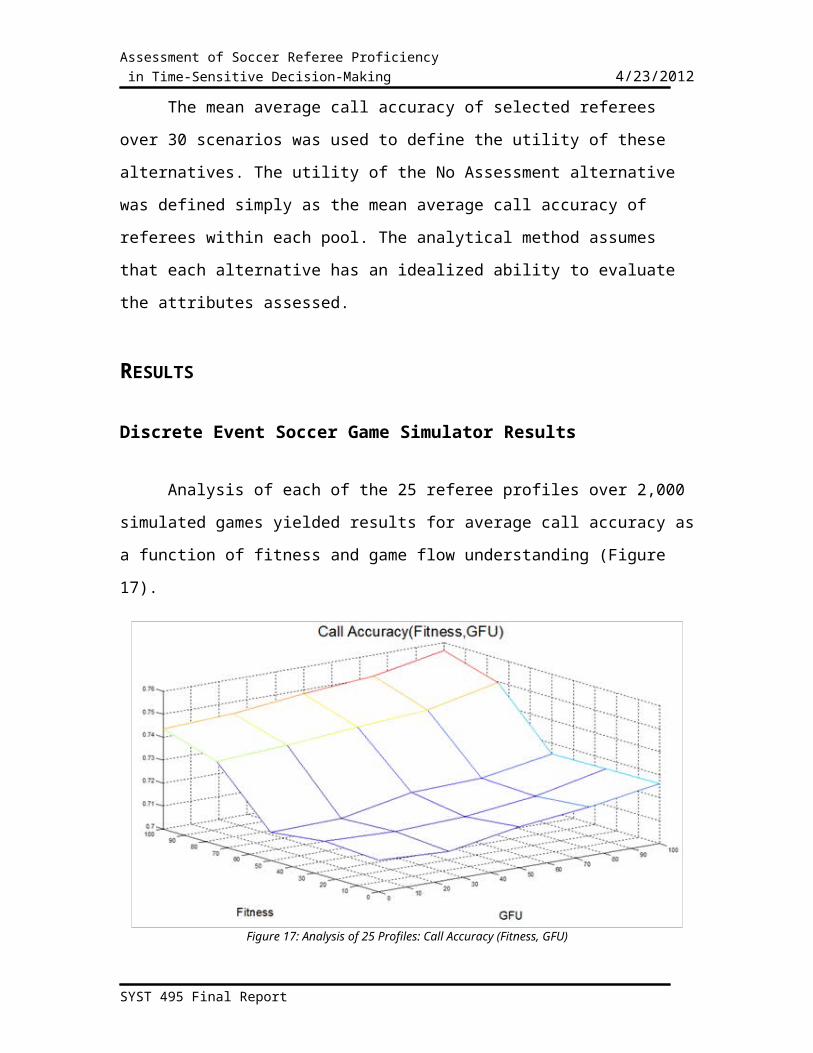
Analysis of each of the 25 referee profiles over 2,000 simulated games
yielded results for average call accuracy as a function of fitness and game flow
understanding (Figure 17).
Figure 17: Analysis of 25 Profiles: Call Accuracy (Fitness, GFU)
Fitness and game flow understanding levels are scaled where a rating of 0 is
the worst possible and 100 the best possible. In Figure 17, the z-axis represents the
call accuracy where as the x-axis and the y-axis represent the fitness and game flow
understanding levels. Across the referee profiles, call accuracy ranged from 71.22%
to 75.67%. The highest call accuracy resulted during the highest levels of fitness and
game flow understanding levels. By increasing fitness to its maximum, call accuracy
peaked at roughly 74.5% where as increasing a referee’s game flow understanding
level to its maximum resulted in a peak accuracy of roughly 72.5%. This implies that
a referee’s fitness level has a greater impact on their ability to make a correct call
then their game flow understanding attribute. These findings are fairly intuitive
when analyzed. A referee can have a high game flow understanding level and be able
SYST 495 Final Report

Assessment of Soccer Referee Proficiency in Time-Sensitive Decision-Making 4/23/2012
to proactively position themselves based on probable ball movement but no matter
how well the referee can understand the flow of the game if they are physically inept
from moving from one point to another their high level of game flow understanding
is decently minimized. Over the 25 profiles, the average 95% confidence interval
half-width for mean call accuracy was 2.866e-3. This indicates an acceptable level of
confidence in the data points.
A multivariate regression for call accuracy was computed with an R-squared
value of 99.51% representing a strong fit (Equation 3).
Call Accuracy ( Fitness ,GFU )=¿0.713491+(0.000923486 × Fitness )+ (1.28791×10⁻⁵× GFU )−(6.4846 ×10⁵ × Fitness2)+ (1.12504 ×GFU 2)+ (1.26193× 10⁻⁶ × Fitness3 )−(6.75305× 10⁻⁹ × Fitness4)
Equation 3: Call Accuracy Regression Function
The regression analysis indicates that accuracy varies nonlinearly with
fitness and game flow understanding. Adding polynomial terms for fitness and game
flow understanding until p-values for leading terms jumped above acceptable levels
(p > 0.05) resulted in a fitness degree of 4 and game flow understanding degree 2
(Table 12). The generated regression does not include an interaction term between
fitness and game flow understanding, since adding an interaction term resulted in a
p-value of 0.813.
Table 12: Call Accuracy Regression Analysis
Term T P - valueConstant 1042.55 0.000Fitness 7.84 0.000Fitness2 -10.97 0.000Fitness3 13.35 0.000Fitness 4 -14.36 0.000
GFU 0.55 0.590GFU2 4.99 0.000
Monte Carlo Analysis Results
SYST 495 Final Report

Assessment of Soccer Referee Proficiency in Time-Sensitive Decision-Making 4/23/2012
Utilizing the Call Accuracy equation generated from the regression above, the
expected call accuracy was calculated for the 5000 randomly generated referees in
each Monte Carlo scenario. Using the established attribute cut offs the mean call
accuracy was calculated for each referee pool selected using each assessment
alternative. The Monte Carlo analysis implied that the most effective evaluation
method was the Fitness test, which had an average call accuracy of 74.9%, followed
by the Combined Evaluation (74.2%), Game Flow Evaluation (72.7%), and No
Assessment (72.1%) (Table 13).
Table 13: Utilities for Grade 8 Evaluation Alternatives
Alternative CutoffAvg. Call Accuracy
95% Half-Width Call Accuracy
Fitness Test Fitness > 81 0.74926 0.00012Game Flow Evaluation
Game Flow Understanding > 81
0.72693 0.0028
Combined Evaluation
Fitness > 66 & Game Flow
Understanding > 660.74174 0.00021
No Assessment N/A 0.72099 0.00004
The extremely small 95% confidence interval half-widths indicate a high
level of confidence in the results.
UTILITY/COST ANALYSIS AND RECOMMENDATION
Based on a cost vs. utility analysis conducted on alternatives (Figure 18) it
can be concluded that the Fitness Test dominates both the Combined Evaluation and
Game Flow Evaluation due to its higher utility and lower cost. Therefore, the choice
of alternatives lies between conducing a Fitness Test at grade 8 (74.9% Accuracy,
$26,990 Cost) and conducting no assessments at this level (72.1% Accuracy, $0
Cost). As the average accuracy of the top 100 referees selected using the Fitness
Test exceeds the overall referee accuracy by only 2.8 percentage points, the
improvement in selection due to implementing the Fitness Test over the status quo
can be considered statistically but not practically significant. Thus, the benefit of
SYST 495 Final Report

Assessment of Soccer Referee Proficiency in Time-Sensitive Decision-Making 4/23/2012
implementing Fitness Tests for all grade 8 referees is outweighed by its cost. It is
therefore the recommendation of this project that the status quo be maintained and
no referee evaluations be conducted for fitness and/or game flow understanding at
the grade 8 level.
Figure 18: Cost vs. Utility Analysis for Alternatives
ADDITIONAL FINDINGS
To determine the effect of game flow on a referee’s call accuracy, an analysis
was conducted on the extent to which referee call accuracy was affected by the
playing styles of the teams competing in a game (See Figure 25). Based on the range
of performance from best performing referee profile to worst profile (indicated by
error bars), it can be concluded that team playing styles can have a significant
impact on referee performance.
SYST 495 Final Report
Assessment of Soccer Referee Proficiency in Time-Sensitive Decision-Making 4/23/2012
Figure 19: Impact of Team Combinations on Referee Call Accuracy
Given this finding, further analysis was conducted to determine why certain
team combinations result in decreased referee performance. 500 simulated games
were run using referee profile 33 (fitness =50, game flow understanding = 50) for
Stoke vs. Stoke and United vs. United play styles. Over these games, the simulated
referee made roughly 30,000 calls for each team combination. For all call events, the
distance from the call was recorded and analyzed.
It was concluded that differences exist in the distributions of call distance as
a result of team play styles. United vs. United games resulted in density
concentrating heavily around 11-13 yards and decreasing consistently with further
increases in distance (See Figure 26). However, Stoke vs. Stoke games resulted in a
bimodal density concentrating around 11-13 yards and again at around 44-47 yards
(See Figure 26). This second peak along with the increased density between peaks
accounts for the decreased referee performance in Stoke vs. Stoke games due to the
referee more frequently being out of position to make calls. This analysis shows that
the same referee when placed in two different games can have a decreased
performance and be out of position far more often in one game due exclusively to
different team combinations and their effect on game flow.
SYST 495 Final Report

Assessment of Soccer Referee Proficiency in Time-Sensitive Decision-Making 4/23/2012
Figure 20: Distance from Calls for United vs. United and Stoke vs. Stoke
The results of this finding are nontrivial and point to a key characteristic that
is currently lacking in referee criticism and evaluation. When assessing the in-game
call performance of a referee, the difficulty of the match being officiated (in terms of
game flow) must be taken into account due to its large and unavoidable effect on call
performance. Furthermore, when comparing the performance of different referees,
the games in which referees are evaluated must be synchronized to ensure that
team combination does not act as a confounding variable in the analysis.
SYST 495 Final Report
Assessment of Soccer Referee Proficiency in Time-Sensitive Decision-Making 4/23/2012
MANAGEMENT
The following figure is the work breakdown structure for the entire project.
Its split up into two sections, the first is for SYST 490 and the second part is the
work that was completed during SYST 495.
Figure 21: Total Work Breakdown Structure for SYST 490/495
The following figure shows the work that was completed for Systems 490. It
focused mainly on gathering data for the discrete soccer game simulator.
Figure 22: Work Breakdown Structure for SYST 490
SYST 495 Final Report

Assessment of Soccer Referee Proficiency in Time-Sensitive Decision-Making 4/23/2012
The following figure shows the work that was completed for Systems 495. It
focused on creating the simulation, formulating conclusions, and presenting the
project in conferences.
Figure 23: Work Breakdown Structure for SYST 495
The following table shows the entire list of tasks that were set out for this
project. It shows the dates for each task, the amount of hours that have been
allocated to the task, and who is assigned to complete the task. The project was
budgeted to take a total of 1462 hours. At $30.00 an hour the total cost of this
project is estimated to be $43,860.
Table 14: Task Breakdown
Outline Number Task Name Duratio
n Start Finish Hours Assignee
1
Soccer Referee
Evaluation System
248 days
Mon 8/29/11
Thu 5/3/12 1462
1.1 Research 219 days
Mon 8/29/11
Tue 4/3/12
1.1.1 Preliminary Research
48 days
Mon 8/29/11
Sat 10/15/1
160 All
1.1.2 Ongoing 171 Sun Tue 75 All
SYST 495 Final Report

Assessment of Soccer Referee Proficiency in Time-Sensitive Decision-Making 4/23/2012
Research days 10/16/11 4/3/12
1.2 Referee/Game Data
138 days
Fri 9/2/11
Tue 1/17/12
1.2.1Simulation input data Collection
138 days
Fri 9/2/11
Tue 1/17/12
1.2.1.1 Ball speed data
29 days
Mon 12/19/1
1
Tue 1/17/12 30 Saud
1.2.1.2Ball
movement data
88 days
Fri 9/2/11
Mon 11/28/1
1
1.2.1.2.1 Develop data collector
50 days
Fri 9/2/11
Fri 10/21/1
120 Nathan
1.2.1.2.2Team
selection for strategy
7 days Mon 10/3/11
Mon 10/10/1
12 Saud
1.2.1.2.3 Data collection 30 days
Sat 10/22/1
1
Mon 11/21/1
175 All
1.2.1.2.4Data analysis for strategy
trends7 days
Mon 11/21/1
1
Mon 11/28/1
120 Andrew
1.2.1.3Call Ability &
Frequency Function
11 days
Fri 11/18/1
1
Mon 11/28/1
1
1.2.1.3.1Situational
Characteristics Survey
9 daysFri
11/18/11
Sat 11/26/1
1
1.2.1.3.1.1 Create survey 2 days
Fri 11/18/1
1
Sun 11/20/1
110 Hina
1.2.1.3.1.2
Send survey to referees 4 days
Mon 11/21/1
1
Fri 11/25/1
115 Hina
1.2.1.3.1.3
Analyze survey results 1 day
Fri 11/25/1
1
Sat 11/26/1
110 Hina
1.2.1.3.2 Create call ability function 1 day
Sun 11/27/1
1
Mon 11/28/1
12 Hina
1.2.2 Simulation 30 Mon Wed
SYST 495 Final Report
Assessment of Soccer Referee Proficiency in Time-Sensitive Decision-Making 4/23/2012
input data analysis days 11/28/1
112/28/1
1
1.2.2.1Creation of
call accuracy functions
30 days
Mon 11/28/1
1
Wed 12/28/1
140 Hina
1.2.2.2
Creation of ball
movement matrices
30 days
Mon 11/28/1
1
Wed 12/28/1
125 Nathan
1.2.2.3Creation of
call occurance matrices
30 days
Mon 11/28/1
1
Wed 12/28/1
120 Nathan
1.3Referee
Evaluation Simulator
37 days
Mon 12/19/1
1
Tue 1/24/12
1.3.1 Development 36 days
Mon 12/19/1
1
Mon 1/23/12
1.3.1.1 Define "sim" referees 7 days Mon
1/9/12Mon
1/16/12 20 Andrew
1.3.1.2 Develop simulator
30 days
Mon 12/19/1
1
Tue 1/17/12 250 Nathan/Hina/
Andrew
1.3.1.3 Test simulator 7 days Mon 1/16/12
Mon 1/23/12 20 Nathan
1.3.2 Evaluation 8 days Tue 1/17/12
Tue 1/24/12
1.3.2.1Run "Sims"
through simulator
7 days Tue 1/17/12
Tue 1/24/12 10 Nathan
1.3.2.2 Record "Sim" performance 7 days Tue
1/17/12Tue
1/24/12 3 Nathan
1.4 Formulation of Conclusions
14 days
Wed 1/25/12
Wed 2/8/12
1.4.1 Analyze "sim" performance
14 days
Wed 1/25/12
Wed 2/8/12 30 All
1.4.2
Determine ratings for
survey metric combinations
14 days
Wed 1/25/12
Wed 2/8/12 10 All
1.5 Literature Review
49 days
Mon 2/13/12
Mon 4/2/12 300 All
SYST 495 Final Report

Assessment of Soccer Referee Proficiency in Time-Sensitive Decision-Making 4/23/2012
1.6 Communication of Results
215 days
Fri 9/30/11
Thu 5/3/12
1.6.1 Preparation of Deliverables
185 days
Fri 9/30/11
Mon 4/2/12
1.6.1.1 Preliminary Project Plan 2 days Fri
9/30/11Sun
10/2/11 25 All
1.6.1.2 Final Report Proposal
10 days
Fri 11/25/1
1
Mon 12/5/11 40 All
1.6.1.3 Proposal Final Report Slides
10 days
Fri 11/25/1
1
Mon 12/5/11 20 Hina
1.6.1.4 Conference Paper Draft
15 days
Sun 11/20/1
1
Mon 12/5/11
40 All
1.6.1.5 Poster Draft 15 days
Sun 11/20/1
1
Mon 12/5/11
40 All
1.6.1.6 SIEDS Abstracts Due (University of
Virginia)
5 days Wed 2/8/12
Mon 2/13/12
20 All
1.6.1.7 Final Conference
Paper
48 days
Tue 2/14/12
Mon 4/2/12
30 All
1.6.2 Presentations 213 days
Mon 10/3/11
Thu 5/3/12
1.6.2.1 Project Briefing # 1
0 days Mon 10/3/11
Mon 10/3/11
30 All
1.6.2.2 Project Briefing # 2
0 days Mon 10/24/1
1
Mon 10/24/1
1
40 All
1.6.2.3 Dry Run Final Presentation
0 days Wed 11/9/11
Wed 11/9/11
50 All
1.6.2.4 Faculty Presentation
0 days Fri 12/2/11
Fri 12/2/11
30 All
1.6.2.5 SIEDS Conference (University
and Virginia)
0 days Fri 4/27/12
Fri 4/27/12
20 All
1.6.2.6 Westpoint Capstone
Conference
0 days Thu 5/3/12
Thu 5/3/12
30 All
SYST 495 Final Report

Assessment of Soccer Referee Proficiency in Time-Sensitive Decision-Making 4/23/2012
The following chart is the PERT chart for the project. It shows that the
Referee Evaluation Simulator had no slack time. In order to make sure the simulator
was completed properly within the allotted time, a test as you go coding method
was used to reduce the time of the debugging process. Formulating conclusions
must be completed by the identified date. If needed, additional hours will be added
into the budget to make sure that these tasks are completed.
Figure 24: PERT Chart
The following charts show the project cost. The earned value and planned
value are very close showing that the project was completed on time. The actual cost
is lower than anticipated. The reason for this is was that work was completed more
efficiently than initially anticipated. In addition, the Cost Performance Index (0.955)
and the Schedule Performance Index (0.967) are both in a range indicating the
project was carried out successfully.
Table 15: Task Budgeting
Task Predicted Velocity Cost
Research 135 hours $4,050
Referee/Game Data 244 hours $7,320
Referee Evaluation Simulator 303 hours $9,090
Formulation of Conclusions 40 hours $1,200
SYST 495 Final Report

Assessment of Soccer Referee Proficiency in Time-Sensitive Decision-Making 4/23/2012
Communication of Results 415 hours $12,450
Project Management 330 hours $9,900
Total 1467 hours $44,010
Table 16: Earned Value
Week Planned Value Actual CostEarned Value
1 11.42 17.95 8.572 22.84 43.05 19.983 34.26 71.65 31.414 45.68 102.05 42.845 82.1 178.45 109.276 125.52 207.75 122.77 136.94 250.85 134.148 179.79 298.55 1379 201.54 334.55 137
10 253.29 368.05 205.7511 295.04 416.05 224.512 326.79 447.05 253.2513 451.79 488.05 33214 576.04 552.55 39615 600.29 554.55 39616 624.54 556.55 39617 718.79 589.55 41618 791.79 622.55 478.519 864.79 655.55 54120 957.79 701.05 613.521 997.79 733.05 736.2522 1020.79 762.05 780.523 1043.79 788.05 831.7524 1066.79 827.55 88925 1116.94 861.05 928.7926 1167.09 881.05 988.5827 1217.24 904.05 1030.3728 1267.39 926.55 1047.8729 1317.54 956.55 1047.8730 1367.69 981.05 1055.1631 1417.84 1016.05 1062.4532 1427.84 1029.05 1069.74
SYST 495 Final Report

Assessment of Soccer Referee Proficiency in Time-Sensitive Decision-Making 4/23/2012
33 1437.84 1092.85 142034 1447.8435 1457.8436 1467.84
1 4 7 10 13 16 19 22 25 28 31 340
300
600
900
1200
1500
Earned Value Chart
Planned ValueActual CostEarned Value
Week (starting 8/29/2011)
Co
st (
ho
urs
)
Figure 25: Earned Value Chart
Cost Performance Index=¿
Earned Value∗Project Completion PercentageActual Cost
=0.955
Schedule Performance Index=¿
Earned Value∗Project Completion PercentagePlanned Value
=0.96
SYST 495 Final Report

Assessment of Soccer Referee Proficiency in Time-Sensitive Decision-Making 4/23/2012
WORKS CITED[1] C. Gordine-Wright, Z. Reilly, (2011, June 9) European football market grows
to €16.3 billion. [online]. Available: http://www.deloitte.com/view/en_NL/nl/7fdea05260570310VgnVCM2000001b56f00aRCRD.htm
[2] J. Wilson. (2010, June) Soccer could use instant replay, but not at expense of sport’s flow. [online]. Available: http://sportsillustrated.cnn.com/2010/soccer/world-cup-2010/writers/jonathan_wilson/06/28/soccer.technology/index.html
[3] (2003, April) United States Soccer Federation Referee Grades. [online]. Available: http://www.pawestsoccer.org/Assets/ documents/Announcement forgradechanges.pdf
[4] Definitions of Referee Grades [online]. Available: http://www.vadcsoccerref.com/docs/DEFINITION%20OF%20REFEREE%20GRADES.pdf
[5] Pat Delaney (2011, January 3) Annual Assessor, Assignor, Instructor and Administrator Meeting. [Presentation].
[6] Pat Delaney (2011, November 10) MDCVSRP Sponsor Meeting [Verbal]
[7] Assessment Program Handbook [online]. Available:http://www.ussoccer.com/Referees/Referee-Development/~/media/729EB9FF07A34EC5AAD7504A6E78ECCB.ashx
[8] A. Solomon, A. Paik, T. Phan, A. Alhauli, (2011) A Decision Support System for the Professional Soccer Referee in Time-Sensitive Operations. [online]. Available: http://catsr.ite.gmu.edu/SYST490/DSTSO_IEEE_SIEDS.pdf
SYST 495 Final Report

Appendix 4/23/2012
APPENDIX
ANOVA Analysis
Arsenal
One Two Three Four Five Six74.00%
76.00%
78.00%
80.00%
82.00%
84.00%
86.00%
Arsenal - Pass Completion Percentage by Time / Score
AheadTieBehind
15 Minute Time Period
Pas
s Co
mle
tion
Per
cen
tage
Figure 26: Arsenal - Pass Completion Percentage by Time/Score
General Linear Model: Pass Success versus Time Period, Score Factor Type Levels ValuesTime Period fixed 6 1, 2, 3, 4, 5, 6Score fixed 3 Ahead, Behind, Tie
Analysis of Variance for Pass Success, using Adjusted SS for Tests
Source DF Seq SS Adj SS Adj MS F PTime Period 5 0.8009 0.3850 0.0770 0.50 0.777Score 2 0.6035 0.4526 0.2263 1.47 0.231Time Period*Score 10 1.7369 1.7369 0.1737 1.13 0.338Error 9393 1448.8720 1448.8720 0.1543Total 9410 1452.0134S = 0.392747 R-Sq = 0.22% R-Sq(adj) = 0.04%
SYST 495 Final Report i

Appendix 4/23/2012
Manchester
One Two Three Four Five Six0.00%
10.00%
20.00%
30.00%
40.00%
50.00%
60.00%
70.00%
80.00%
90.00%
Manchester United - Pass Completion Percentage by Time / Score
AheadTieBehind
15 Minute Time Period
Pas
s Co
mle
tion
Per
cen
tage
Figure 27: Manchester United - Pass Completion Percentage by Time / Score
General Linear Model: Pass Success versus Time Period, Score
Factor Type Levels ValuesTime Period fixed 6 1, 2, 3, 4, 5, 6Score fixed 3 Ahead, Behind, Tie
Analysis of Variance for Pass Success, using Adjusted SS for Tests
Source DF Seq SS Adj SS Adj MS F PTime Period 5 1.5800 1.2753 0.2551 1.65 0.142Score 2 0.5949 2.2746 1.1373 7.37 0.001Time Period*Score 10 10.5742 10.5742 1.0574 6.85 0.000Error 7915 1221.5527 1221.5527 0.1543Total 7932 1234.3018
S = 0.392854 R-Sq = 1.03% R-Sq(adj) = 0.82%
SYST 495 Final Report ii

Appendix 4/23/2012
Stoke
One Two Three Four Five Six0.00%
10.00%
20.00%
30.00%
40.00%
50.00%
60.00%
70.00%
80.00%
Stoke City - Pass Completion Percentage by Time / Score
AheadTieBehind
15 Minute Time Period
Pas
s Co
mle
tion
Per
cen
tage
Figure 28: Stoke City - Pass Completion Percentage by Time / Score
General Linear Model: Pass Success versus Time Period, Score
Factor Type Levels ValuesTime Period fixed 6 1, 2, 3, 4, 5, 6Score fixed 3 Ahead, Behind, Tie
Analysis of Variance for Pass Success, using Adjusted SS for Tests
Source DF Seq SS Adj SS Adj MS F PTime Period 5 3.4782 4.5499 0.9100 4.05 0.001Score 2 24.9770 22.2408 11.1204 49.44 0.000Time Period*Score 10 23.8346 23.8346 2.3835 10.60 0.000Error 7947 1787.4596 1787.4596 0.2249Total 7964 1839.7494
S = 0.474260 R-Sq = 2.84% R-Sq(adj) = 2.63%
SYST 495 Final Report iii

Appendix 4/23/2012
Wigan
One Two Three Four Five Six0.00%
10.00%
20.00%
30.00%
40.00%
50.00%
60.00%
70.00%
80.00%
Wigan - Pass Completion Percentage by Time / Score
AheadTieBehind
15 Minute Time Period
Pas
s Co
mle
tion
Per
cen
tage
Figure 29: Wigan - Pass Completion Percentage by Time / Score
General Linear Model: Pass Success versus Time Period, Score
Factor Type Levels ValuesTime Period fixed 6 1, 2, 3, 4, 5, 6Score fixed 3 Ahead, Behind, Tie
Analysis of Variance for Pass Success, using Adjusted SS for Tests
Source DF Seq SS Adj SS Adj MS F PTime Period 5 3.8064 4.2898 0.8580 4.28 0.001Score 2 10.6004 6.7613 3.3807 16.87 0.000Time Period*Score 10 3.0990 3.0990 0.3099 1.55 0.116Error 9225 1848.5016 1848.5016 0.2004Total 9242 1866.0074
S = 0.447638 R-Sq = 0.94% R-Sq(adj) = 0.76%
SYST 495 Final Report iv

Appendix 4/23/2012
Simulation Output: Regression Analysis
Data Points
Table 17: Regression Analysis Data Points
Profile Fitness GFUAccurac
y11 0 0 0.713912 0 25 0.712513 0 50 0.717914 0 75 0.721315 0 100 0.726221 25 0 0.715322 25 25 0.714223 25 50 0.715524 25 75 0.719125 25 100 0.725831 50 0 0.712232 50 25 0.713033 50 50 0.719034 50 75 0.720135 50 100 0.725441 75 0 0.736342 75 25 0.738243 75 50 0.740844 75 75 0.743045 75 100 0.749551 100 0 0.743552 100 25 0.744953 100 50 0.748454 100 75 0.750855 100 100 0.7567
General Regression Analysis: Accuracy versus Fitness, GFURegression Equation
Accuracy = 0.713491 + 0.000923486 Fitness + 1.28791e-005 GFU - 6.4846e-005 Fitness*Fitness + 1.12504e-006 GFU*GFU + 1.26193e-006 Fitness*Fitness*Fitness - 6.75305e-009 Fitness*Fitness*Fitness*Fitness
Coefficients
SYST 495 Final Report v

Appendix 4/23/2012
Term Coef SE Coef T PConstant 0.713491 0.0006844 1042.55 0.000Fitness 0.000923 0.0001177 7.84 0.000Fitness*Fitness -0.000065 0.0000059 -10.97 0.000Fitness*Fitness*Fitness 0.000001 0.0000001 13.35 0.000Fitness*Fitness*Fitness*Fitness -0.000000 0.0000000 -14.36 0.000GFU 0.000013 0.0000235 0.55 0.590GFU*GFU 0.000001 0.0000002 4.99 0.000
Summary of Model
S = 0.00117864 R-Sq = 99.51% R-Sq(adj) = 99.35%PRESS = 0.0000473882 R-Sq(pred) = 99.07%
Analysis of Variance
Source DF Seq SS Adj SS Adj MS FRegression 6 0.0050711 0.0050711 0.0008452 608.397 Fitness 1 0.0035778 0.0000855 0.0000855 61.526 Fitness*Fitness 1 0.0005429 0.0001672 0.0001672 120.354 Fitness*Fitness*Fitness 1 0.0001382 0.0002477 0.0002477 178.319 Fitness*Fitness*Fitness*Fitness 1 0.0002863 0.0002863 0.0002863 206.086 GFU 1 0.0004913 0.0000004 0.0000004 0.300 GFU*GFU 1 0.0000346 0.0000346 0.0000346 24.913Error 18 0.0000250 0.0000250 0.0000014Total 24 0.0050961
Source PRegression 0.000000 Fitness 0.000000 Fitness*Fitness 0.000000 Fitness*Fitness*Fitness 0.000000 Fitness*Fitness*Fitness*Fitness 0.000000 GFU 0.590477 GFU*GFU 0.000095ErrorTotal
Fits and Diagnostics for Unusual Observations
Obs Accuracy Fit SE Fit Residual St Resid 6 0.715322 0.713129 0.0006844 0.0021936 2.28597 R 13 0.719050 0.716541 0.0005977 0.0025088 2.46965 R
R denotes an observation with a large standardized residual.
SYST 495 Final Report vi

Appendix 4/23/2012
Monte Carlo TrialsTable 18: Monte Carlo Trials
SYST 495 Final Report vii
Fitness Virtual Both Nothing0.74969572
3 0.726793193 0.741860637 0.721207750.74945932
7 0.726480148 0.742312934 0.721023880.74898779
2 0.727937977 0.7412423020.72104507
60.74931834
9 0.726535364 0.7412058160.72088827
50.74880053
6 0.726326643 0.74146514 0.721029220.74962531
4 0.728024425 0.7432878510.72097714
30.74945335
3 0.727459887 0.7412372820.72088934
80.74955406
3 0.726086242 0.7419398430.72095182
90.74907090
2 0.727370923 0.7412265320.72110788
7
0.7484863 0.726851215 0.741076590.72084940
70.74920919
4 0.725415465 0.7419955040.72105511
80.74892375
2 0.726986663 0.7424869490.72090563
50.74963521
3 0.726578691 0.741948181 0.721066410.74942863
7 0.727739189 0.741744458 0.720897280.74937041
1 0.726607546 0.7411405640.72105886
40.74936226
5 0.726649863 0.7413251370.72081892
50.74959925
1 0.726643132 0.7412892530.72104055
40.74978618
6 0.728142026 0.7422515420.72104107
30.74915812
7 0.727288764 0.7419184380.72094958
30.74936796
6 0.725400257 0.742010705 0.72096444
0.74896588 0.727781771 0.7416446660.72095585
10.74926543
4 0.726033107 0.7418641010.72094249
50.74912048
5 0.728528591 0.7422377080.72118001
30.74917125
2 0.726735782 0.74130510.72095286
10.74841404
9 0.726793865 0.740461490.72120146
70.74903986
2 0.726566538 0.7417923050.72081306
30.74970903 0.72112837

Appendix 4/23/2012
Survey Administered to MDCVSRP Senior Referees Soccer Referee Simulator
Data Collection Survey
Nathan Jones, Hina Popal, Andrew Cann, Saud Almashhadi [email protected]
Personal Information:
Name: _______________
Email:_______________
Grade: _______________
Years of Experience: _______________
Call Occurrence Questions:
** Calls refer to both direct and indirect free kicks
How many calls (estimated) would you expect to make in a typical game: _______________
SYST 495 Final Report viii

Appendix 4/23/2012
Given the Field image below:
Please estimate the percent of total calls that occur in each cell: (Sum of percent designated to cells should be 100)
1:________ 13:_________
2:________ 14:_________
3:________ 15:_________
4:________ 16:_________
5:________ 17:_________
6:________ 18:_________
7:________ 19:_________
8:________ 20:_________
SYST 495 Final Report ix

Appendix 4/23/2012
9:________ 21:_________
10:_______ 22:_________
11:_______ 23:_________
12:_______ 24:_________
Please estimate what percentage of calls occur when: (Total sum of percentages should equal 100)
A player is dribbling the ball:_________
A player is in the process of passing the ball:_________
A passed ball is in route from one player to another: _________
A player is in the process of receiving a pass: _________
None of the above (Please Specify): _________
Referee Call Accuracy Questions:
The following questions are asking about the call making ability of a referee with regards to their distance from the call event. The word "event" refers to what has triggered the need for a call. Please answer the following questions to the best of your ability.
At a distance of 5 yards from the event, what percent chance does a referee have of making a correct call? __________
At a distance of 10 yards from the event, what percent chance does a referee have of making a correct call? __________
SYST 495 Final Report x

Appendix 4/23/2012
At a distance of 15 yards from the event, what percent chance does a referee have of making a correct call? __________
At a distance of 20 yards from the event, what percent chance does a referee have of making a correct call? __________
At a distance of 25 yards from the event, what percent chance does a referee have of making a correct call? __________
At a distance of 30 yards from the event, what percent chance does a referee have of making a correct call? __________
At a distance of 35 yards from the event, what percent chance does a referee have of making a correct call? __________
At a distance of 40 yards from the event, what percent chance does a referee have of making a correct call? __________
At a distance of 45 yards from the event, what percent chance does a referee have of making a correct call? __________
At a distance of 50 yards from the event, what percent chance does a referee have of making a correct call? __________
At a distance of 55 yards from the event, what percent chance does a referee have of making a correct call? __________
At a distance of 60 yards from the event, what percent chance does a referee have of making a correct call? __________
SYST 495 Final Report xi

Appendix 4/23/2012
The following questions are asking about the call making ability of a referee regarding blind spots with respect to where they are located from the call event. The word "event" refers to what has triggered the need for a call. Please answer the following questions to the best of your ability.
If a referee is 40 yards behind the event, what is the chance he misses a call due to obstruction of vision? _________
If a referee is 35 yards behind the event, what is the chance he misses a call due to obstruction of vision? _________
If a referee is 30 yards behind the event, what is the chance he misses a call due to obstruction of vision? _________
If a referee is 25 yards behind the event, what is the chance he misses a call due to obstruction of vision? _________
If a referee is 20 yards behind the event, what is the chance he misses a call due to obstruction of vision? _________
If a referee is 15 yards behind the event, what is the chance he misses a call due to obstruction of vision? _________
If a referee is 10 yards behind the event, what is the chance he misses a call due to obstruction of vision? _________
If a referee is 5 yards behind the event, what is the chance he misses a call due to obstruction of vision? _________
If a referee is even with the event, what is the chance he misses a call due to obstruction of vision? _________
SYST 495 Final Report xii

Appendix 4/23/2012
If a referee is 5 yards ahead of the event, what is the chance he misses a call due to obstruction of vision? _________
If a referee is 10 yards ahead of the event, what is the chance he misses a call due to obstruction of vision? _________
If a referee is 15 yards ahead of the event, what is the chance he misses a call due to obstruction of vision? _________
If a referee is 20 yards ahead of the event, what is the chance he misses a call due to obstruction of vision? _________
If a referee is 25 yards ahead of the event, what is the chance he misses a call due to obstruction of vision? _________
If a referee is 30 yards ahead of the event, what is the chance he misses a call due to obstruction of vision? _________
If a referee is 35 yards ahead of the event, what is the chance he misses a call due to obstruction of vision? _________
If a referee is 40 yards ahead of the event, what is the chance he misses a call due to obstruction of vision? _________
SYST 495 Final Report xiii

Appendix 4/23/2012
Electronic AppendixThe following elements can be found in the electronic appendix attached to the back of this report:
1. English Premier League Strategy Analysis – this includes the complete set of collected data, the analysis done for team strategy and the polygon output for each team.
2. Monte-Carlo Analysis – This includes the output of the excel based Monte-Carlo simulation system.
3. Simulation Output Analysis – This includes the complete data set for all 25-referee profiles. The output analysis for each referee profile, team-by-team output analysis and complete referee profile analysis. In all this portion of the appendix includes 36 pages of simulation output analysis.
4. Source code for software – This includes the source code for all developed software utilized throughout this project. This entails the source code for the data collection tool, the simulator, and the VBA strategy analysis scripts, which were used to analyze the English Premier League collected data for team strategy.
5. Impact of Teams Analysis – This includes the output from the call distance simulation trials for United vs. United and Stoke vs. Stoke (Mentioned in the additional findings section).
6. Software – This includes the compiled source code (functioning software) for the Simulator and the Data Collection tool.
7. Assessment Criteria National Assessment Program – This is a pdf copy of the National Assessment Program’s Assessment Criteria. This pdf was taken from the www.ussoccer.com. This document is the official assessment sheet utilized by assessors when assessing referees during their on-field assessments. This document provides insight into the qualitative and quantitative elements of the on-field assessment process.
8. Referee Administration Handbook – This is a pdf copy of the Referee Administration Handbook taken from www.ussoccer.com. This document is a complete guide for all referees and includes information such as: Referee Grade Definitions, Certification Criteria (e.g., Fitness Tests, Exams, Assessments, etc.), and logistical policies and procedures for referee conduct.
9. Referee Survey output Analysis – This is an excel file providing all information submitted as part of referee surveys. It also includes quantitative computations used to help generate probabilities and regressions for the discrete soccer game simulation.
10. Literature Review – This section of the electronic appendix includes a volume of academic articles relating to the scope of the work done for this project. It provides a compiled pdf with multiple articles for further reading to help expand upon the nature of this work for future iterations.
SYST 495 Final Report xiv