Introduction and Background · Web viewFor pretopped double tee diaphragms, welded mechanical...
39
Double Tee Flange Connections – Experimental Evaluation Greg Lucier 1 , Clay Naito 2 , Andrew Osborn 3 , Mohamed Nafadi 4 , Sami Rizkalla 5 Introduction and Background Double tee beams in parking decks utilize flange-to-flange connectors for diaphragm continuity and alignment purposes (see Figure 1). For pretopped double tee diaphragms, welded mechanical connections are used for vertical alignment and shear and axial force transfer. Some systems are developed with welded connections intended for shear only, or for tension in chord connections. These systems may include cast- in-place concrete strips (wet connections) at the double tee ends for chords where higher strength or deformation demand are critical. 1 Manager, Constructed Facilities Laboratory, Department of Civil, Construction, and Environmental Engineering, North Carolina State University, 2414 Campus Shore Drive, Raleigh, NC, email: [email protected] 2 Professor, Department of Civil and Environmental Engineering, Lehigh University, 13 E Packer Ave, Bethlehem, PA 18015, Email: [email protected] 3 Senior Principal, Wiss Janney Elstner Associates Inc., Boston, MA 02210, Email: [email protected] 4 Post-Doctoral Fellow, Department of Civil, Construction, and Environmental Engineering, North Carolina State University 5 Professor, Department of Civil, Construction, and Environmental Engineering, NC State University Page 1 of 39
Transcript of Introduction and Background · Web viewFor pretopped double tee diaphragms, welded mechanical...

Double Tee Flange Connections – Experimental EvaluationGreg Lucier1, Clay Naito2, Andrew Osborn3, Mohamed Nafadi4, Sami Rizkalla5
Introduction and Background
Double tee beams in parking decks utilize flange-to-flange connectors for diaphragm continuity and
alignment purposes (see Figure 1). For pretopped double tee diaphragms, welded mechanical connections
are used for vertical alignment and shear and axial force transfer. Some systems are developed with
welded connections intended for shear only, or for tension in chord connections. These systems may
include cast-in-place concrete strips (wet connections) at the double tee ends for chords where higher
strength or deformation demand are critical.
Figure 1: Precast double tee connections
Dry double tee flange connections consist of a steel assembly embedded into the edge of a concrete
double tee flange. The embedded steel assembly is welded to a similar assembly embedded in an
adjacent double tee using a steel slug or jumper plate to span the gap. Thus, a typical flange connection
consists of two embedded connectors joined by a jumper plate (or round slug), connected with two field-
applied welds, as illustrated in Figure 2. Embedded connectors are available in several different styles
from various manufacturers, but are generally stamped metal assemblies designed to anchor a flat,
1 Manager, Constructed Facilities Laboratory, Department of Civil, Construction, and Environmental Engineering, North Carolina State University, 2414 Campus Shore Drive, Raleigh, NC, email: [email protected] 2 Professor, Department of Civil and Environmental Engineering, Lehigh University, 13 E Packer Ave, Bethlehem, PA 18015, Email: [email protected] Senior Principal, Wiss Janney Elstner Associates Inc., Boston, MA 02210, Email: [email protected] Post-Doctoral Fellow, Department of Civil, Construction, and Environmental Engineering, North Carolina State University5 Professor, Department of Civil, Construction, and Environmental Engineering, NC State University
Page 1 of 29

exposed weld surface into the concrete of the double tee flange. Two commercially available connectors
are shown in Figure 3.
Figure 2: Typical Flange to Flange Connection (Shown Without Concrete for Clarity)
Manufacturer 1 Manufacturer 2Figure 3: Two Commercially Available Connectors
Behavior of Flange to Flange Connections
Flange connections serve the important function of joining a series of adjacent double tees into a floor
system that behaves as a continuous diaphragm. These connections act to resist both in-plane and out of
plane forces applied to the diaphragm. In-plane demands are generated by both thermal changes in the
diaphragm and due to lateral (wind or seismic) induced forces within the plane of the double tee flange.
In-plane forces on welded connections can act in shear parallel to the longitudinal joint, or in tension or
compression across the joint. In-plane forces could also develop at some intermediate angle, resulting in
a combination of tension and shear. When connections are placed in in-plane tension they can be designed
to be elastic or ductile. Where high in-plane tension forces are expected, such as at the ends of the double
tee, welded chord connection details or pour strips are often used. It should be noted that applied tension
loads will reduce shear capacity and applied shear loads will reduce tension capacity.
Page 2 of 29

Flange to flange connections are also used as a means to correct for differential camber between tees, to
transfer wheel load forces as vehicles pass over the longitudinal joint and to resist possible tire-changing
jack loads, specified as 3000 lbs. by code. The double tee flange is designed to support uniform traffic
loading without relying on their flange-flange connections. When designing for vehicular live loads,
flanges are typically assumed by the designer to act as a simple span or as a free cantilever, depending on
the location of the flange segment relative to the supporting stems. Flange connections designed for
flange alignment and in-plane shear will also act to transmit moving traffic loads as they cross the joints.
Figure 4: Free Flanges vs. Connected Flanges
Internal reinforcement is provided in the flange to enable the flange to resist the required applied uniform
and concentrated loads. The addition of flange connections turns the free cantilever into a propped
cantilever (and the internal assumed simple span into a continuous span), as is shown in Figure 4. Instead
of a rigid prop, the support at the tip of the loaded cantilever can be thought of as a spring of certain
stiffness, that stiffness related to the stiffness of the connection and the stiffness of the supporting flange.
In addition, a small concentrated moment at the tip of the loaded cantilever can be thought of as a model
for the rotational rigidity of the flange connection itself. Neglecting these effects from a design
perspective would be conservative, as reinforcement demands would be reduced were these effects
considered. Neglecting the effects for design purposes, however, does not prevent them from developing
in the field. Thus, a designer needs to be aware that vertical forces will develop in flange connections
even if they are intended primarily for in-plane loads. Furthermore, flange connections are desirable from
Page 3 of 29

the perspective of vertical load transfer as they add redundancy to the flange system by turning a statically
determinant flange into a continuous span.
The behavior of flange connections under vertical loading is arguably more complicated than the behavior
of the same connections under in-plane loading. The main reason for this added complexity in the
vertical direction is that the embedded connectors, jumper plate, and flange are all relatively flexible in
the vertical direction, and are loaded eccentrically due to the gap between double tees. Under vertical
loading, the flange on one side of the joint deforms downward, taking the welded connection and opposite
flange with it. The degree to which load is transferred across the connection depends on the relative
vertical stiffness of each flange and of the connection (along with other factors to be discussed later).
When the connector embedded in the loaded flange moves downward, it generates a complex distribution
of shear and flexure on the weld through the deformation of the faceplate, in turn rotating and translating
the jumper plate. The jumper plate is supported by the weld on the opposite embedded plate, which
imparts an opposing flexure and shear to the faceplate of the second connector which in turn deforms and
transfers the demands into the anchored legs of the connector. This load path allows some portion of the
applied force ultimately to make its way into the opposite flange.
The vertical relative deformation at the edge of a flange loaded by a tire can be attributed to four primary
components: localized flexure of the flange relative to the double tee stem, global vertical deflection of
the entire double tee, global torsional rotation of the cross-section itself, and the connection resistance
across the flange to flange joint. The local flange flexure and connection resistance is a function of the
load location and magnitude, the cross-section properties of the flange and the connection spacing and
stiffness. The two global behaviors are influenced by double tee cross-sectional properties, span and the
location of the applied load with respect to that span.
The Complicating Third Dimension
So far, the discussion of flange behavior in this paper has largely focused on a two dimensional
assumption where the flange is acting as an idealized propped cantilever. A two dimensional assumption
already requires substantial complexity in modeling connection deformations, but this complexity is
further magnified when the problem is considered in three dimensions. In a real double tee floor system,
connections are spaced at regular intervals along the span, typically 5 ft to 8 ft, with closer spacing
sometimes used at midspan, depending on the standard practices of the precast producer and the design
requirements. Under an applied concentrated load, the flange deforms as a semi-rigid membrane with
vertical deformations decreasing with increased distance from the load in both directions of the horizontal
plane. The flange cantilever is behaving in two-way bending, as illustrated in Figure 5.
Page 4 of 29

Figure 5: (a) Flange Cantilever Deformations under Concentrated Load, (b) Relative Magnitude of Force Transfer at Connections, (c) Deformed Connection Shapes
A series of connections spaced along the edge of the flange shown in Figure 5 will act to reduce the
vertical deflections of the loaded flange by transferring loads to the unloaded flange in inverse proportion
to the distance between a given connection and the applied load. The actual reduction is a function of the
local flange stiffness and the spacing and stiffness of connections along the joint. Loads transferred to the
unloaded flange through connections will cause the unloaded flange to deflect vertically downward in a
similar two-way pattern to the loaded flange, however, the deflection magnitudes on the unloaded side
will be less.
Problem Statement
The above discussion leads an engineer examining welded flange connections to ask one simple question:
How much vertical force should I assume is transferred across a typical welded flange connection? The
question is simple, but, as we have seen thus far, the answer is complex and is not addressed by current
codes and design handbooks. One might propose that a conservative approach would be to design each
connection to transfer the entire wheel load, but this would be unnecessarily conservative, since flange
connections are not required to resist uniformly distributed live loading. Another approach would be to
design the flange connections for some intermediate level of force, but analyzing for the chosen level
would require a complex iterative process for each design as the parameters of flange geometry,
connection type and spacing, and connection stiffness were optimized.
A third approach, which closely mirrors current industry practice, is to recognize that the vertical force
transferred across a welded flange connector is not critically relevant so long as that force (and the cycles
of that force over time) do not degrade the ability of the connector to serve its primary function of lateral
load transfer. If this third approach is taken, then the simple question posed above can be modified into a
slightly different form: How can I be assured that the vertical load capacity of my typical welded flange
connection does not degrade with vertical load cycles?
A study of this question was recently undertaken by a PCI Task Group. The overall study included
analytical modeling, in-situ testing of existing parking structures, finite element modeling, component
Page 5 of 29

testing, and full-scale testing. The goal of the full-scale testing is to generate detailed measurements on
the response of a prototype floor diaphragm to out-of-plane loading. The results of the study are used to
both illustrate the response and to verify numerical models that can be used to conduct parametric study
of the force transfer across the joint. The in-situ and full-scale testing programs are presented below.
Other elements of the broader PCI study are reported elsewhere [Naito et. al. 2017].
In-Situ Testing
Tests were performed at two garages, one in Bethlehem PA and the other in Henrico VA. Linear
potentiometers were used in Bethlehem and dial gages were used in Henrico at the joints to measure the
differential deflection that occurs as a vehicle was driven across the joint. In these tests, axle loads were
20 to 35% greater than assumed in the analysis described above. Results of these tests were as follows:
Bethlehem, PA GarageDouble tee dimensions: 15 ft. wide by 60.5 ft. span by 30 in. deepGap dimension: not measuredAge: Garage built 2005Concrete strength: Minimum at 28-day 7000 psiConnector type: Manufacturer 1 flange connectors spaced at 5 ft. on center in drive lanesJumper plate width – not measuredWeld size – not measuredCar weight: 4520 lbs. (2530 lbs. front 1990 lbs. rear) plus driver Car alignment: Wheels centered between flange connectors. Car dimensions: wheel base = 118 in., wheel spacing = 68.5 in.
Test results (Average of 2 tests)Differential displacement 1 (wheel on one side of joint) = -0.014 in.Differential displacement 2 (wheel passes to opposite side of joint) = +0.002 in.Dynamic displacement at 15 mph similar to static.
Henrico VA GarageDouble tees dimensions: 12 ft wide by 60 ft span by 30 in. deepGap dimension: not measuredAge: Garage built 2013. Concrete strength: 7000 to 9000 psi at 28 daysConnector type: Manufacturer 1 flange connectors spaced at 5 ft. on center in drive lanesJumper plate width – not measuredWeld size – not measuredCar weight: 5080 lbs. (2820 lbs. front axle, 2260 lbs. rear axle) plus driver Car alignment: Wheels centered on connectors. Car dimensions: Wheel base = 126 in. Wheel spacing = 66 in.
Test results (Average of 3 tests)Differential displacement 1 (wheel on one side of joint) = -0.009 in. (Figure 6 shows Test 1)Differential displacement 2 (wheel passes to opposite side of joint) = +0.003 in.Dynamic displacement at 15 mph similar to static
Page 6 of 29

Figure 6: Test in Henrico, VA. In these photos, wheel to left of joint causes relative displacement 0.011
in. Wheel to right of joint causes relative displacement of -0.005 in.
Full Scale Tests - Experimental Plan
A complete study of the behavior of welded flange connections necessarily includes an experimental
component. It was decided to conduct full-scale experiments on three adjacent connected double tees in
an effort to capture all the complexities of their behavior. The experiment was based on field-realistic 60
ft long by 12 ft wide by 30 in. deep double tees joined together with industry-standard connections.
Instrumentation was provided to characterize the transfer of forces across those connections when point
loads of up to 3000 lbs. were applied to the surface of the double tee deck. It was assumed that a point
load of 1500 lbs. was conservatively representative of a service level wheel load (i. e.: a 3000 lbs. axle
load and total vehicle weight of about 6000 lbs, including passengers.. Given that the average vehicle
weight plus 300 lbs. in 2015 was 4035 lbs. [EPA 2016], a concentrated load of 3000 lbs. substantially
exceeds the service level condition. The goal of the full-scale experimentation was to measure flange
deflections and connection strains under various loading conditions in an effort to determine the level of
force being transferred through the connections. The experimental results were also used to calibrate a
finite element model for further analytical studies [Naito et. al. 2017].
The shop ticket for one of the three double tees used in the test (FTA-001) is shown in Figure 7 and
Figure 8. The second and third tees (FTA-002 and FTA-003, respectively) were identical to FTA-001
except that FTA-002 had a line of one type of connectors down one flange only and FTA-003 had a line
of the other type of connectors down one flange only. Tees were longitudinally prestressed, and the
flange was reinforced in the transverse direction with a welded wire D4.9 reinforcement spaced at 6 in.
Flange connections were spaced 5 ft apart with a connection 2.5 ft on either side of midspan. The
concrete compression strength assumed in the design was 5000 psi. The concrete strength measured from
three 4x8 in. cylinders on the day of double tee testing (35 days after casting) was 5400 psi. The modulus
of elasticity of the concrete was determined experimentally to be 4,400 ksi, or 59,900 times the square
root of the compression strength (in psi), effectively matching the design assumptions.
Page 7 of 29

Figure 7: Typical Double Tee Plan (One of Three Tees Used in the Test)
Figure 8: Typical Double Tee Cross-Section (One of Three Tees Used in the Test)
Page 8 of 29

The three double tees were each supported on a simple span using concrete blocks and bearing pads under
each stem. The gap between adjacent tee flanges was maintained at ¾ in., and the connection details
shown in Figure 9 were used. Manufacturer 1 connectors were only joined to other Manufacturer 1
connectors, and Manufacturer 2 only to other Manufacturer 2. The connectors and connection details
used are typical of current industry practice and followed manufacturer’s instructions.
Figure 9: Connection Details for Manufacturer 1 (left) and Manufacturer 2 Connectors (right)
A test frame was assembled over the three adjacent double tees, as shown in Figure 10 and Figure 11.
The frame consisted of a long rectangular steel tube, concrete mass blocks, wooden blocking, steel
connection tubing, and threaded bars. The frame was designed to enable placing a 3000 lbs force at any
point on the connected flange surface, or a pair of 1500 lb. forces directly over the stems of any of the
three double tees. Loads were applied by a hydraulic jack placed between the bottom surface of the steel
frame and the top surface of the flange. A 6 in. square by ¾ in. thick steel bearing plate and 6 in. square
by ¼ in. thick neoprene pad were used to transfer the load from the jack to the flange surface. A load cell
was used to monitor the applied load, bonded foil gauges were used to measure strains in the connection
components and welds, and linear potentiometers were used to measure vertical flange deformations. All
deflection measurements were taken from an independent instrumentation frame supported on the ground.
The hydraulic jack(s) could be located at any point along the loading frame, and the loading frame could
be located at any point along the double tee span. In this way, a point load could be applied to any
Page 9 of 29
location on the surface of the connected double tees. The independent instrumentation frame was also
designed to enable it to be moved up and down the double tee span.
Figure 10: Isometric Sketch of Test Setup
Figure 11: Test Setup with Loading and Instrumentation Frames 7.5 ft from End of Double Tees
Prior to connecting the three double tees together by welding the flange connections (and chord steel
connections), each double tee was loaded with a pair of point loads applied at midspan, one load centered
over each stem. The two loads were increased together from 0 to 4000 lbs each and unloaded 3 times to
enable calculation of the stiffness of each double tee from measured data. Deflection measurements were
taken at midspan (under each load point) and at diagonal supports. The average support deflections were
subtracted from the average midspan displacements to provide the net midspan deflection of each double
tee. All three tees were nearly identical, behaved in a linear fashion at the selected load level, and
Page 10 of 29

exhibited an average measured stiffness at midspan of 38 kip/in. This was marginally higher than the
expected stiffness of 35 kip/in. based on measured material properties. The difference is believed to be
related to longitudinal restraint at bearings. After the global double tee stiffness tests were completed, all
connections were welded by experienced, certified welders used to working with precast connections. A
typical welded connection is shown in Figure 12.
Figure 12: Typical Connection after Welding
The connections all met the required tolerance limits allowed by PCI. Variations in each connection did
exist, however. All welded connections were measured prior to testing in accordance with the dimension
labels established in Figure 13. The average measurements for all connections of a given type are
presented in Table 1.
Figure 13: Measurements Taken for Each Connection
Table 1: Average Measured Values for Connections of a Given TypeType ∆1 (in.) ∆2 (in.) G (in.) L (in.) Sw (in.) Sl (in.) St (in.) dol (in.) dir (in.) Wo (in.) Wor (in.) Wi (in.) Wir (in.) Wto (in.) Wti (in.)
Manufacturer 1 0.30 0.14 1.25 6.05 1.16 3.13 0.31 1.08 1.08 2.98 0.09 2.99 0.07 0.30 0.30Manufacturer 2 0.19 0.13 1.34 6.18 1.22 3.10 0.31 0.89 0.90 3.04 0.05 2.35 0.03 0.29 0.26
Page 11 of 29

Specific measurements of weld sizes and distance to the concrete surface were made after testing by
Tindall, and are reported in Figure 14. Then Tindall cut out two connections and sent them to the
researchers for additional examination and precise measurement. The results of those precise
measurements are presented in Figure 15.
Figure 14: Weld Sizes and Depth of Jumper Plate from Top Surface
Page 12 of 29

Manufacturer 1 Manufacturer 2Figure 15: Polished Cross-sections through Two Tested Connectors Shown at their Relative Depths in Flange
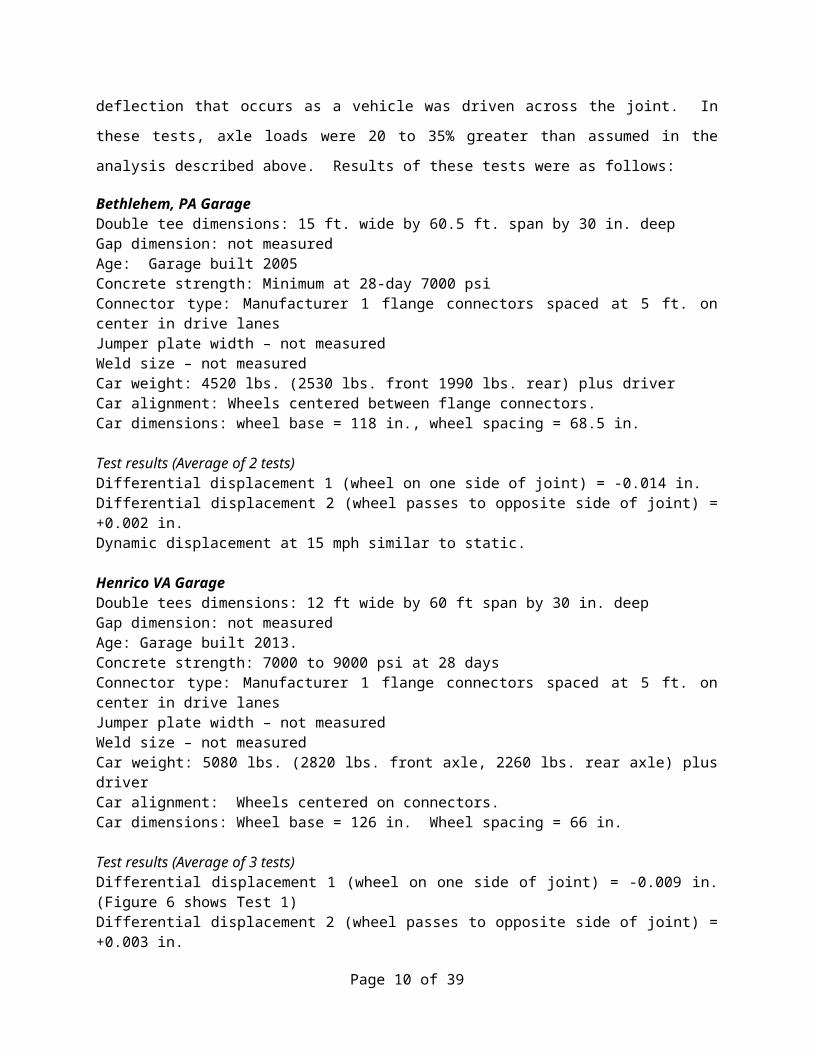
A naming convention was established to facilitate identifying the series of tests planned for the connected
double tee deck. This convention is illustrated on a plan view of the connected double tee deck in Figure
16. Terms top, bottom, left, and right refer to the selected orientation of the test setup. Primary row
stations of A, B, C, and D correspond to outside edges of the test setup or joints between adjacent double
tees. Additional rows are identified as needed by a suffix of “i" or “o”, indicating “inside” or “outside”.
Thus, row Bo is to the outside of row B and row Ci is to the inside of row C. Similarly, row Boo is to the
outside of row Bo and so forth. Column stations are identified numerically as the distance in feet from
the zero position, defined as the left edge of the test setup. An individual point on the deck can be
identified as a {Row,Column} pair – for example, B-27.5 identifies the connection between FTA-003 and
FTA-001 that is located 2.5 ft to the left of midspan.
Page 13 of 29

Figure 16: Naming Convention
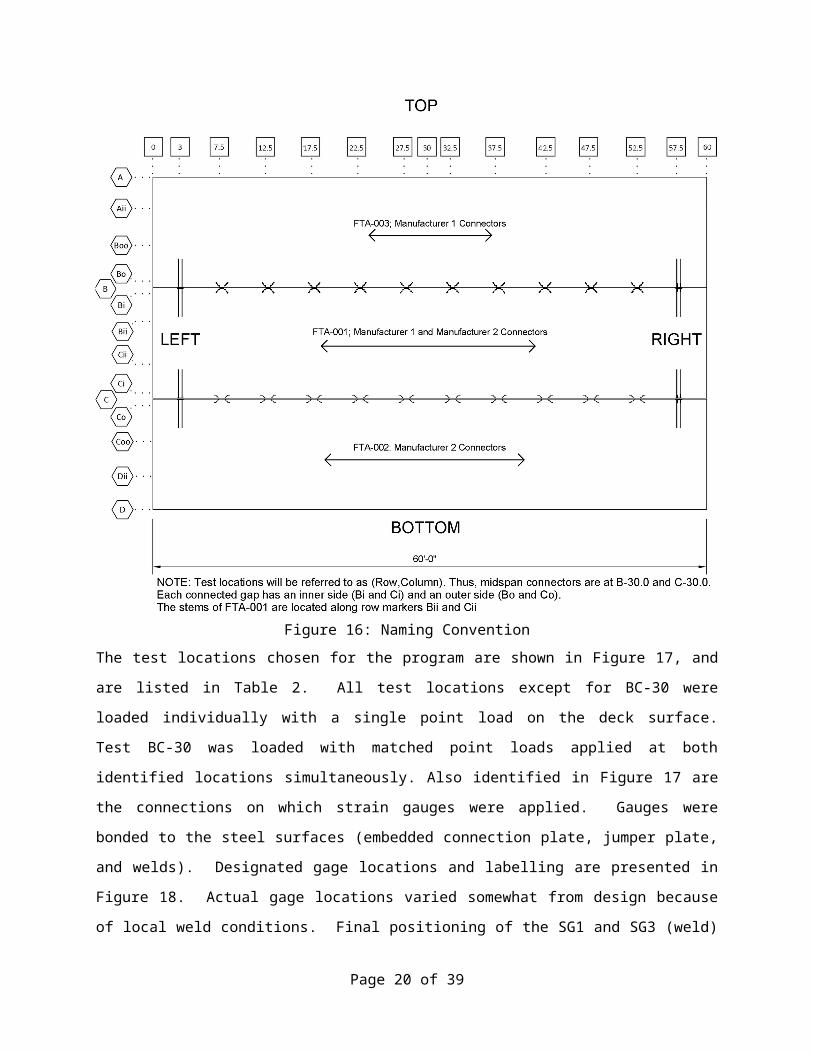
The test locations chosen for the program are shown in Figure 17, and are listed in Table 2. All test
locations except for BC-30 were loaded individually with a single point load on the deck surface. Test
BC-30 was loaded with matched point loads applied at both identified locations simultaneously. Also
identified in Figure 17 are the connections on which strain gauges were applied. Gauges were bonded to
the steel surfaces (embedded connection plate, jumper plate, and welds). Designated gage locations and
labelling are presented in Figure 18. Actual gage locations varied somewhat from design because of local
weld conditions. Final positioning of the SG1 and SG3 (weld) gages is indicated in Figure 19. Vertical
deflection measurement were also taken with each test location, and were referenced to an independent
instrumentation frame as described above. Deflection measurement general locations and instrument
labels are shown in Figure 20 relative to a selected test location. This grid of deflection instrumentation
was moved along with the hydraulic jack, and was arranged in the same relative configuration for each
test. Specific deflection gage locations at the load point were positioned adjacent to the ram pressure
Page 14 of 29

plate (offset 3 inches longitudinally from the center of load). All deflection measurements along the
flange edges were positioned within 1 inch of the edge (Figure 21).
Figure 17: Test Locations and Strain Gauged Connections
Page 15 of 29

Table 2: List of Test LocationsTest # Test Label Test Row Station Test Column Station Test Description
1 T-BC-30 Bii and Cii Load middle tee at midspan on stems with connections welded.2 T-Bo-30 Bo3 T-Bi-30 Bi4 T-Ci-30 Ci 5 T-Co-30 Co6 T-Bo-32.5 Bo7 T-Bi-32.5 Bi8 T-Ci-32.5 Ci 9 T-Co-32.5 Co
10 T-Bo-27.5 Bo11 T-Bi-27.5 Bi12 T-Ci-27.5 Ci 13 T-Co-27.5 Co14 T-Bo-17.5 Bo15 T-Bi-17.5 Bi16 T-Ci-17.5 Ci 17 T-Co-17.5 Co18 T-Bo-10 Bo19 T-Bi-10 Bi20 T-Ci-10 Ci 21 T-Co-10 Co22 T-Bo-7.5 Bo23 T-Bi-7.5 Bi24 T-Ci-7.5 Ci 25 T-Co-7.5 Co
Near end, at connector
30
32.5
27.5
17.5
10
7.5
Midspan, between connectors
Near midspan, at connector
Near midspan, at connector
Near 1/3 span, at connector
Near end, between connectors
Figure 18: Strain Gauge Location on Connection
Page 16 of 29

Figure 19: Dimension from End of Jumper Plate to Center of Strain Gauges on Weld
Figure 20: Deflection Measurement Locations (Relative to Each Test Location)
Page 17 of 29

Figure 21: Typical Deflection Measurement at Typical Joint
Figure 22: Measurement Locations for the Dual Test Location Only
Page 18 of 29

Results and Discussion
Test results confirmed that the applied loads of up to 3000 lbs did not cause any visible damage, cracking,
spalling, or other distress. Connections were visibly inspected after testing, and all were found to be free
of deformations, spalling, or cracking that differed from their pre-test conditions. A typical connection
before and after testing is shown Figure 23. Deflections, strains, and applied loads were measured and
recorded as intended for further analysis. Selected data are presented here for the sake of discussion. In
reviewing the data, positive loads are applied vertically downward, positive deflections are considered as
vertically downward motion, and positive strains are considered as tension.
Figure 23: Typical Connection Before (left) and after (right) Testing
The initial test case presented in this section is T-BC-30, the case where a pair of identical loads were
applied at the midspan location, one load centered over each stem. The loads were each increased
simultaneously from 0 to 1500 lbs., released, and reloaded three times. Deflections were measured in the
locations shown in Figure 22.
Analysis of the measured deflection data began with an examination of the relative motion of flange
motions at eight locations due to a point load placed at the midspan of the center tee. Relative flange
motion at each location was determined by subtracting the measured vertical deflection of the supporting
stem from the measured flange motion, as shown in Figure 24 (see Figure 22 for instrumentation layout).
The “net” nomenclature used in Figure 24 implies the relative deflection at the specified location,
calculated by subtracting the stem deflection from the flange deflection. For example, LP2net is the LP2
measurement less the LP1 measurement. The relative net flange motions illustrate that the flanges on the
loaded double tee are moving up relative to their supporting stems, even-though the loaded cross-section
as a whole is moving down. As the loaded double tee deflects downward, the flange tips are restrained
from free vertical movement by their connections, and pull those connections downward. The
connections in turn pull down on the flanges of the adjacent tees, causing those flanges to move down
relative their supporting stems. In other words, the center tee forms a concave up deflected shape and the
Page 19 of 29
exterior tees go concave downward. Thus, relative deflection of flanges adjacent to the loaded tee (i.e.:
locations L2net, LP3net, LP10net, and LP11net) are positive as those flanges move down relative to their
supporting stem. Likewise, relative deflections of flanges on the loaded tee are negative (LP4net, LP5net,
PL8net, and LP9net), indicating that those flanges have moved downward less than their supporting stem.
Maximum relative flange deflection is on the order of 0.015 in. at the maximum applied load (two 1500
lb loads).
Figure 24: Relative Net Flange Deflections from Test T-BC-30
It is also interesting to note that the behavior at locations mirrored about the centerline of the middle tee
are identical, as would be expected (ie: LP2net matches LP10net; LP3net matches LPLP11net, etc.). This
result confirms that no measureable difference existed between the two types of connections tested when
subject to global double tee loading. It would further be expected for behavior to be symmetric about the
midspan. While close, the net deflection values compared between locations mirrored about the midspan
are not quite identical. A consistent small difference is seen between mirrored locations, implying a small
difference in alignment or specimen geometry (ie: LP2net slightly exceeds LP3net; LP10net slightly
exceeds LP11net; etc.).
The relative difference between deflection measurements on either side of a given connection can be
considered as the deflection of the connection itself. Referring to Figure 5c, this deflection can be
thought of as analogous to a support settlement and support rotation problem for a beam with fixed ends
(the jumper plate being the analogous beam). The relative difference between displacements measured on
opposite sides of the joint are plotted for connections B27.5, B32.5, C27.5, and C32.5 in Figure 25. In the
Page 20 of 29

figure, the positive sign convention implies that the portion of the connection on the loaded side of the
joint is vertically lower than the connection on the unloaded side of the joint. The behavior of all four
monitored connections is nearly identical, and a peak relative connection displacement of less than 0.005
in. is observed in all four cases. The small measured values are approaching the instrument accuracy
which is estimated as better than 0.001 in.
Figure 25: Connection Displacements Calculated from Test T-BC-30
The strains measured from one connection (B-27.5) during the T-BC-30 load test are presented in Figure
26. Measured strains confirm very low connection stresses during this test. The peak measurement of
just under 50 microstrain corresponds to a stress of less than 1500 psi, assuming an elastic modulus for
steel of 29,000 ksi (Gauge #5, see Figure 18 for gauge locations).
Page 21 of 29

Figure 26: Strains Measured at Connection B-27.5 during Test T-BC-30
The analysis for the dual load case above is repeated for a selected single load case near midspan, T-Bi-
30. In this case, a single point load was applied and released up to 3000 lbs 3 times. The difference
between displacements measured on opposite sides of the joint are shown in Figure 27 (inset sketch is
from Figure 20). The load was located between connections, and the joint immediately next to the point
of load application exhibited the largest relative deflection across the joint (LP9-LP5). The relative
deflection across the connections closest to the load are represented by the values (LP8-LP4) and (LP10-
LP6), and both these locations behaved virtually identically. The peak relative joint displacement
(directly next to the load, not at a connection) was measured to be about 0.025 in., and the peak relative
deflection at a connection was measured to be about 0.01 in. It is important to note that these peak values
occurred at an applied load of 3000 lbs., or twice the service level. At the service load level of 1500 lbs.,
the maximum relative joint displacement was 0.015 in. and the peak relative displacement across the
nearest connections was about 0.005 in.
Strains measured on connection B-32.5 during test T-Bi-30 are shown in Figure 28. Strain behavior is
linear and maximum strains are small. The peak measured strain at 3000 lbs was about 150 microstrain in
compression, or the equivalent of 4350 psi. At the service load level of 1500 lbs., the measured strains
were half of this value, or about 75 microstrain which equates to a stress level of 2175 psi.
Page 22 of 29

Figure 27: Deflections Measured at Various Points along the Span during Test T-Bi-30
Figure 28: Strains Measured at Connection B-32.5 during Test T-Bi-30
The above analysis is repeated again for a single point load test at a connection near the end, T-Co-7.5.
As is shown in Figure 29, the relative deflection across connection C-7.5, adjacent to the load, was
approximately 0.015 in. at 1500 lbs and 0.030 in. at 3000 lbs. Interestingly, these values are very similar
to the relative deflections measured across the joint (with no connection present) at a location adjacent to
the load in the test of T-Bi-30. Such a result implies that the connection spacing tested is optimal for the
Page 23 of 29

cross-section and flange thickness, and relative flange deflections are controlled to the same degree either
adjacent to a connection or between connections. Relative flange deformations at locations one half a
connection spacing on either side of the loaded connection were nearly ½ the value of the loaded
connection, implying that the load transferred to adjacent connections was minimal for this test near the
end of the tee.
Figure 29: Deflections Measured at Various Points along the Span during Test T-Co-7.5
Measured strains for the test of T-Co-7.5 remained minimal through 3000 lbs. of applied load. Peak
strain magnitudes remained below 120 microstrain at 3000 lb and below 60 microstrain at 1500 lbs.
These strain levels correspond to stresses below of 4150 psi and 2100, respectively.
The highest strains were measured at welds when the load was applied to the near-midspan connectors
located at 27.5 and 32.5. Figure 31 is a plot of differential displacements across the joint, for all of the
midspan connection load cases. The differential displacements at 1500 lbs. range from 0.002 in. to 0.008
in., less than half the differential displacement at location 30. Figure 32 is a plot of weld strains SG1 and
SG3, again for loading at locations 27.5 and 32.5. The maximum strains are compressive and occur on
welds on the loaded side of the joint. These strains ranged from 70 to 270 microstrain. A summary of
weld stresses, and stress ranges, at connection locations 27.5 and 32.5 for all tests where concentrated
loads were also applied at those locations is presented in Figure 33. The maximum stress ranges were
10,500 psi and 6,270 psi for Manufacturer 1 and Manufacturer 2, respectively at applied loads of 1,500
lbs.
Page 24 of 29

Figure 30: Strains Measured at Connection C-7.5 during Test T-Co-7.5
Page 25 of 29

B C
27.5
32.5
Figure 31: Differential Displacements at Connection Locations 27.5 and 32.5
Page 26 of 29

B C
27.5
32.5
Figure 32: Weld Strains at Connection Locations 27.5 and 32.5
Page 27 of 29

Figure 33: Summary of Weld Stresses at Connectors near Midspan of the Test Specimen. (Stress reported at 1500 lbs load is determined from the microstrain at 3000 lb load x 29 (MOE) / 2)
In comparing the results from load case T-Co-7.5 (near the support) to load case T-Bi-30 (at midspan), it
can be seen that the relative joint displacement adjacent to the applied load is nearly the same in each
case. However, the absolute values of displacements LP9 and LP5 (those used to calculate relative
motion near the load) were nearly twice the level of the test T-Co-7.5 in the midspan test. This result
illustrates the effects of global flexure and torsion on flange behavior. At locations near the midspan, the
global section is far more flexible both vertically (in flexure) and rotationally (torsion). This flexibility
enables both the loaded double tee and the adjacent connected double tees to more effectively redistribute
forces across the connections.
Conclusions
An experimental program was conducted on 12 ft wide 60 ft long double tee beams. The beams were
attached using two commercially available flange to flange connectors. One joint consisted of one type of
connectors and the other joint consisted of a second type. The deformation and strain were measured for
a series of point loads placed adjacent to the joint at various locations along the span. The results of the
study indicate:
The measured relative deformation across the joint increased linearly with increasing applied load
over the ranges tested. Loads up to twice the service load level for a typical vehicle were applied.
Differential vertical displacements across connections in DT floors for point loads are a maximum of
about 0.018 in. at a single applied load of 1500 lbs. at midspan between connections. When loads
were applied adjacent to the connections near midspan, at locations 27.5 and 32.5, the differential
displacement across the joint at 1500 lbs. was 0.005 in. +/- 0.003 in. Loading at the flange tip is more
Page 28 of 29

severe than loading on or between the stems. For balanced loading conditions (a pair of 1500 lb.
loads directly over the stems), the measured relative connection deformations were on the order of
0.005 in.
Deformation along the joint is most sensitive to loads placed adjacent to the connection. In the test of
T-Co-7.5 presented here, joint deformation at adjacent locations 2.5 ft. away from the loaded location
was 50% of the deformation at the loaded location. Deformation had dropped to virtually zero in
another 2.5 ft. Thus, relative flange displacements appear to drop off rapidly along the length of the
joint and is typically close to zero within 5 feet from the point load.
Relative deformations in the connection nearest to the end of the double-tee span were higher than
relative deformations across connections at midspan. The flexibility of the double tees in both flexure
and torsion near midspan appears to play a significant role in allowing the connections and the flange
itself to redistribute load.
Across the entire set of tests up to 1500 lbs. loading, the maximum absolute strain value measured
was 276 microstrain in compression. This strain level corresponds to a stress of 8,000 psi, or less
than 12% of the yield stress of E70 weld material. Typical measured strain values were far lower,
well under 50 microstrain (1500 psi or 2% yield) in the majority of cases.
A significant body of data has been generated that can be used for calibration of finite element studies
of flange connection behavior.
Acknowledgements
The authors of this paper would like to acknowledge the Precast / Prestressed Concrete Institute for
sponsoring the research effort. Numerous talented people worked on behalf of the Institute to offer
comments and advice that proved critical to the research. In addition, the authors would like to thank
Tindall Corporation for their generosity in casting the test specimens and in hosting the experimental
work at their Petersburg, VA facility. Finally, the staff and students at the Constructed Facilities
Laboratory at NC State University ultimately made the field testing possible, namely Johanthan McEntire,
Jerry Atkinson, and Omar Khalaf Alla.
References
EPA, “Light-Duty Automotive Technology, Carbon Dioxide Emissions, and Fuel Economy Trends: 1975 Through 2013,” Trends Report, Report No. EPA-420-R-16-010, United States Environmental Protection Agency, November, 2016.
Naito, C., Osborn, A., Rahmani, E., Hendricks, R., “Double Tee Flange Connections - Analytical Evaluation,” 2017 PCI Convention Proceedings, Cleveland, OH.
PCI Industry Handbook Committee, “PCI Design Handbook Precast and Prestressed Concrete,” 7th Edition, Precast/Prestressed Concrete Institute, Chicago, IL, 2010.
Page 29 of 29