Introduction
23
Introduction •I have been following Hulbert for 15 yrs •I have used Hulbert Financial Digest To select Stock…But not for timing •Hulbert Newsletters with the highest return which often have high Beta’s •My objective is not to buy & hold
description
Introduction. I have been following Hulbert for 15 yrs I have used Hulbert Financial Digest To select Stock…But not for timing Hulbert Newsletters with the highest return which often have high Beta’s My objective is not to buy & hold. Hulbert. - PowerPoint PPT Presentation
Transcript of Introduction

Introduction• I have been following Hulbert for 15 yrs• I have used Hulbert Financial Digest
To select Stock…But not for timing• Hulbert Newsletters with the highest
return which often have high Beta’s • My objective is not to buy & hold

Hulbert• Hulbert says easiest way to loss money, follow Last Year’s hottest
NL.
• Best results – NL’s with good 10–15 yr returns
• Hulbert says that a NL’s can be a goodstock pickers or good timers but not both
• Timing - Pat Finnegan's Stock Chart timing signalUsing signals for Stock Entry and Exsist

Studying News Letters
• Hulbert has been publishing for 33 yrs
• Looking for NL to help select stocks
• Hulbert Financial Digest tracks 189 NL

Out Line of Presentation• A Newletters can contain one Portfolio or as many as 9 portfolios
• Hulbert data base:NL’s monthly return (1 - 9 Portfolios) Every Portfolio’s (inside NL) monthly return
• Hulbert is reporting monthly on 541Portfolio’s at this time. NL-P

Hulbert • Goal is find Newsletters that have
good performance over 15, 10, 5 years
• Some of these top Portfolios suffer major declines during Financial Crisis & early 2000. It appears that Portfolio’s with high returns also have a very high Beta.
• (When the market is going down these Portfolios go down fast, you lose more than the market averages).

Raw Return NL-P• First slide covers YTD July 2013 1/13 - 07/13
• Second slide covers 2012 12 months 1/12 - 12/12
• Third slide reviews last three years 1/10 - 12/12
• Fourth slide will review last five years 1/08 - 12/12
• Fifth slide looks at the last ten years 1/03 – 12/12
• Fifth slide looks at the last ten years 1/98 – 12/12

July YTD 2013 Performance
• Investment Reporter-Higher Risk Stks 26%
• Medical Technology Stk- Trader Portfolio 106% • Buyback Letter – Health & Bio Tech 39%
• Turnaround Letter – Small-Cap >1B 21%
• Linde Equity Report 1P 39%
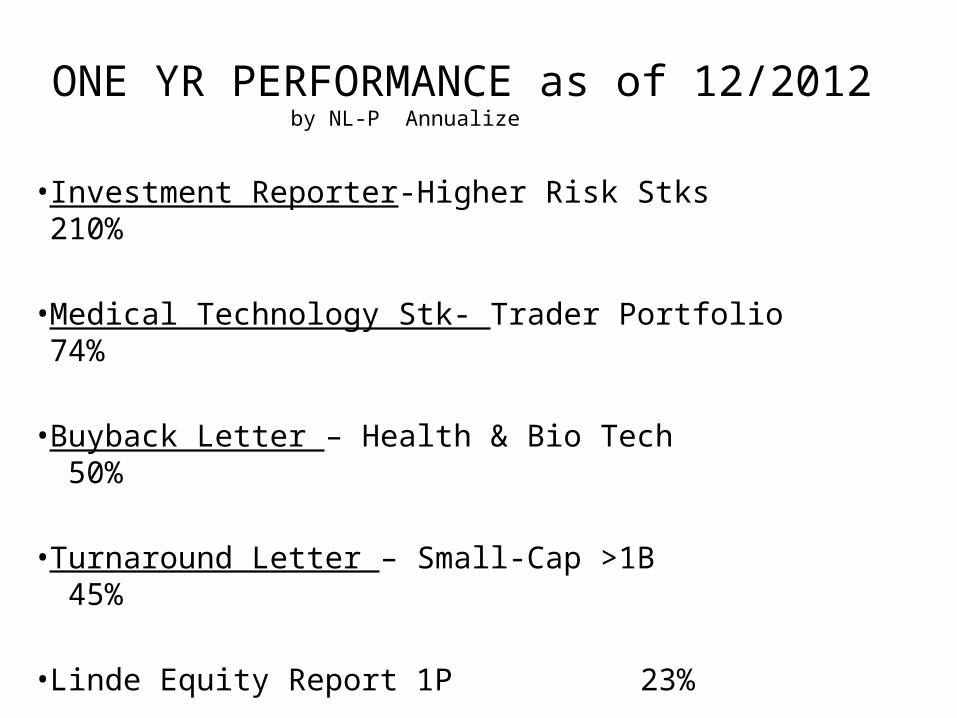
ONE YR PERFORMANCE as of 12/2012by NL-P Annualize
• Investment Reporter-Higher Risk Stks 210%
• Medical Technology Stk- Trader Portfolio 74% • Buyback Letter – Health & Bio Tech 50%
• Turnaround Letter – Small-Cap >1B 45%
• Linde Equity Report 1P 23%

Three Yr Performance as of 12/12 by NL-P Annualized
• Investment Reporter-Higher Risk Stk 73%
• Medical Technology–Traders Portfolio 21%
• Buyback Letter – Health & Bio – Tech 24%
• Turnaround Letter – Small Cap >$1B 22%
• Linde Equity Report 1P 11%

Five YR as of 12/2012by NL-P Annualized Beg 1/08
• Investment Reporter- Higher Risk Stks 17%
• Medical Technology Stk – Trader P -14%
• Buyback Letter – Health & Bio Tech 8%• • Turnaround Letter – Small Cap >1B 0%
• Linde Equity Report 1P 6%
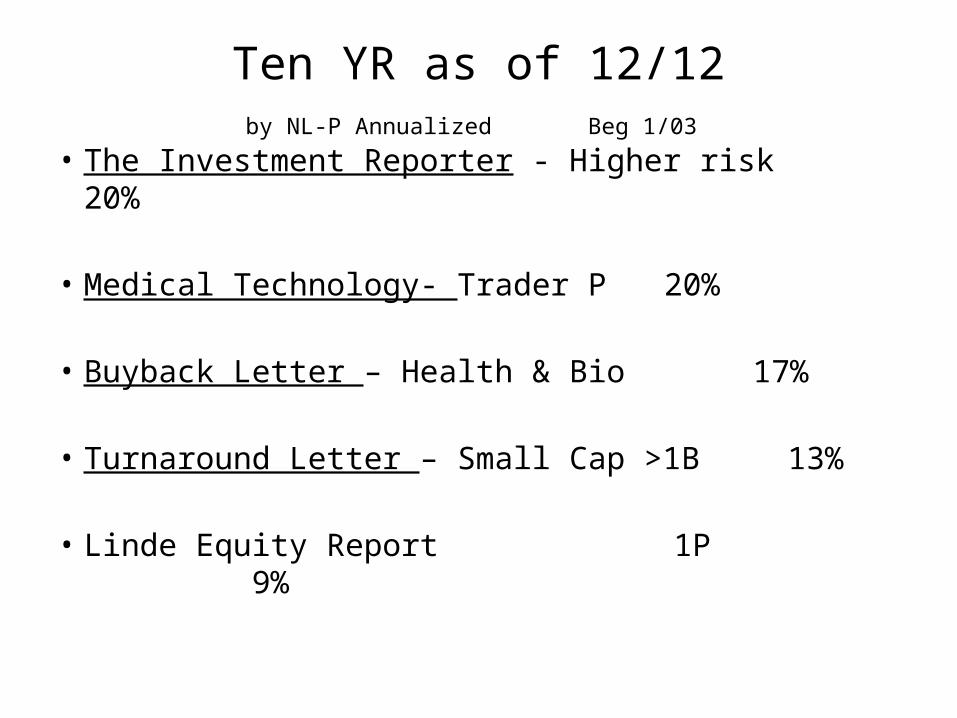
Ten YR as of 12/12 by NL-P Annualized Beg 1/03
• The Investment Reporter - Higher risk 20%
• Medical Technology- Trader P 20%
• Buyback Letter – Health & Bio 17%
• Turnaround Letter – Small Cap >1B 13%
• Linde Equity Report 1P 9%

Fifteen YRs Jan 1998 - Dec 2012• The Investment Reporter - Higher risk 8%
• Medical Technology- Trader P XX
• Buyback Letter – Health & Bio XX
• Turnaround Letter – Small Cap >1B 10%
• Linde Equity Report 1P XX
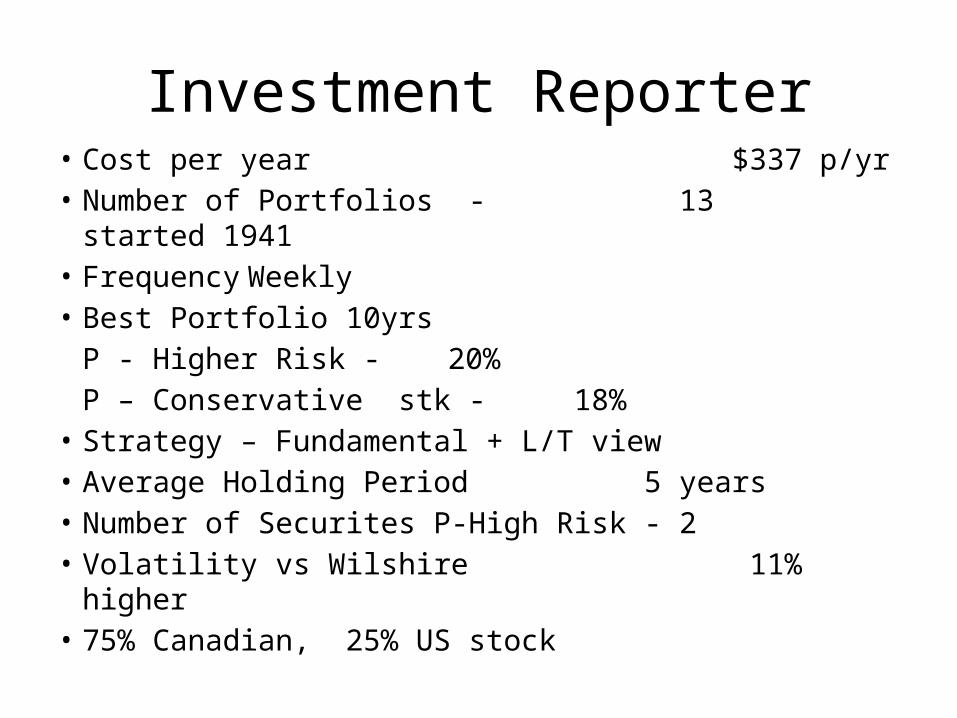
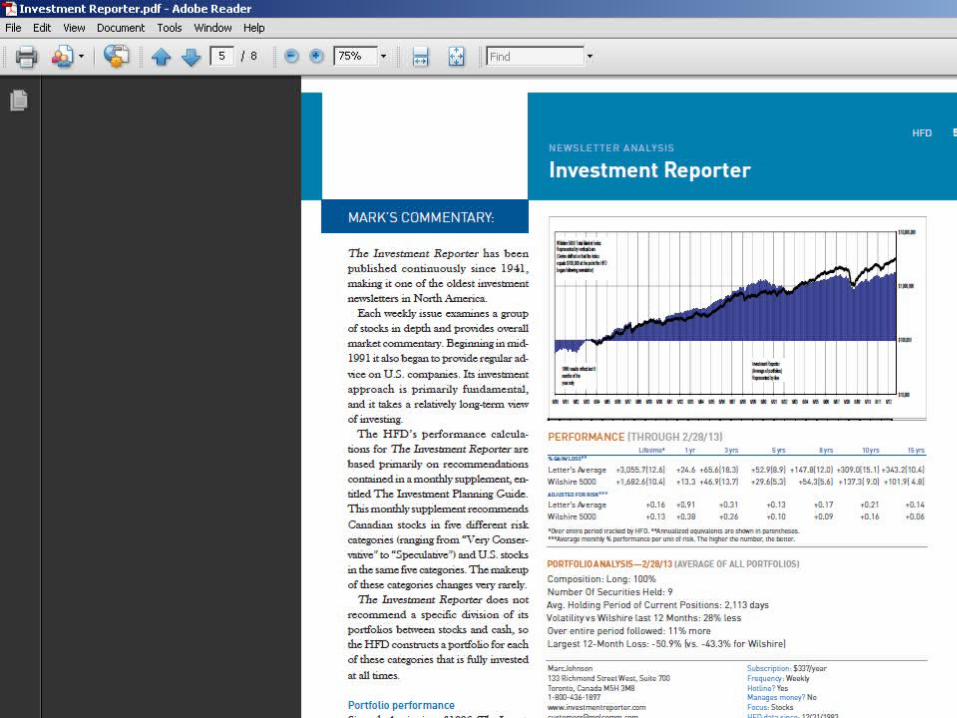
Investment Reporter• Cost per year $337 p/yr• Number of Portfolios - 13 started 1941• Frequency Weekly• Best Portfolio 10yrs
P - Higher Risk - 20%P – Conservative stk - 18%
• Strategy – Fundamental + L/T view • Average Holding Period 5 years• Number of Securites P-High Risk - 2• Volatility vs Wilshire 11% higher• 75% Canadian, 25% US stock

Buyback Letter
• Cost per year $195 p/yr• Number of Portfolios - 9 started 1997 • Frequency Monthly• Portfolios 5P Best Health & Bio Tech • Strategy – Efficient market over looks stk
buyback• Average Holding Period 11 Months• Volatility vs Wilshire 5% less


Turnaround Letter
• Cost per year $ 195p/yr• No. of Portfolio 3 started 1987• Strategy– Stk to recover from previous period• Number of Securites – 19• Average Holding period 863 days• Volatility vs Wilshire 70% more


Forbes Special Situation• Cost per year $295 p/yr• Number of Portfolios one started 2001• Strategy – Fundamental• Frequency once a month with 1 stk p/mo • Number of Securites – 13• Average Holding period 231 days• Volatility vs Wilshire 70% higher
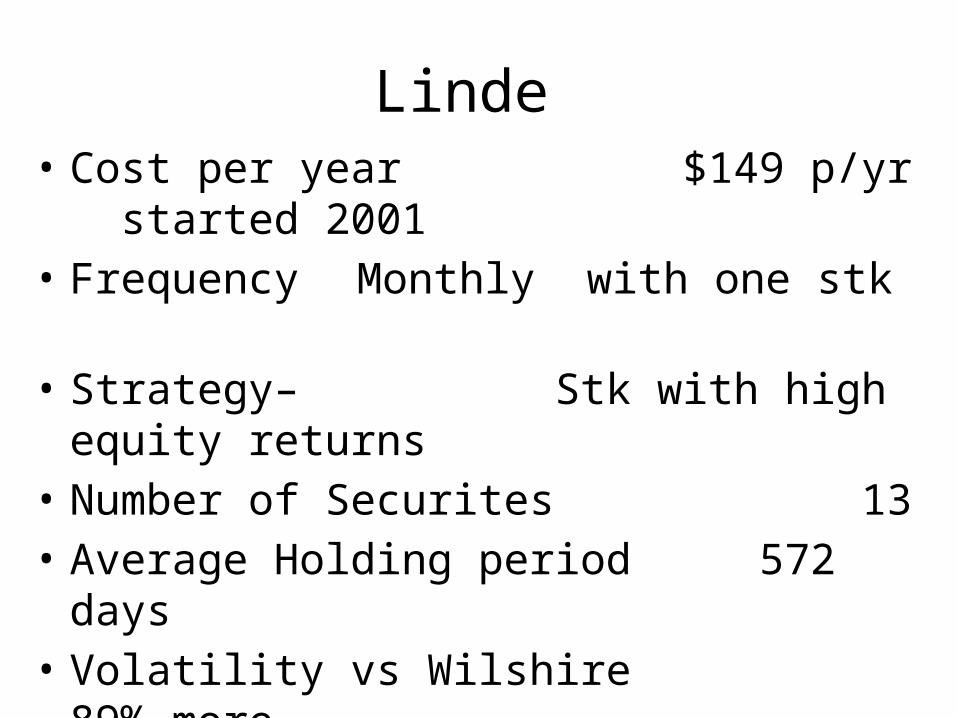
Linde • Cost per year $149 p/yr started 2001• Frequency Monthly with one stk
• Strategy– Stk with high equity returns• Number of Securites 13• Average Holding period 572 days• Volatility vs Wilshire 89% more

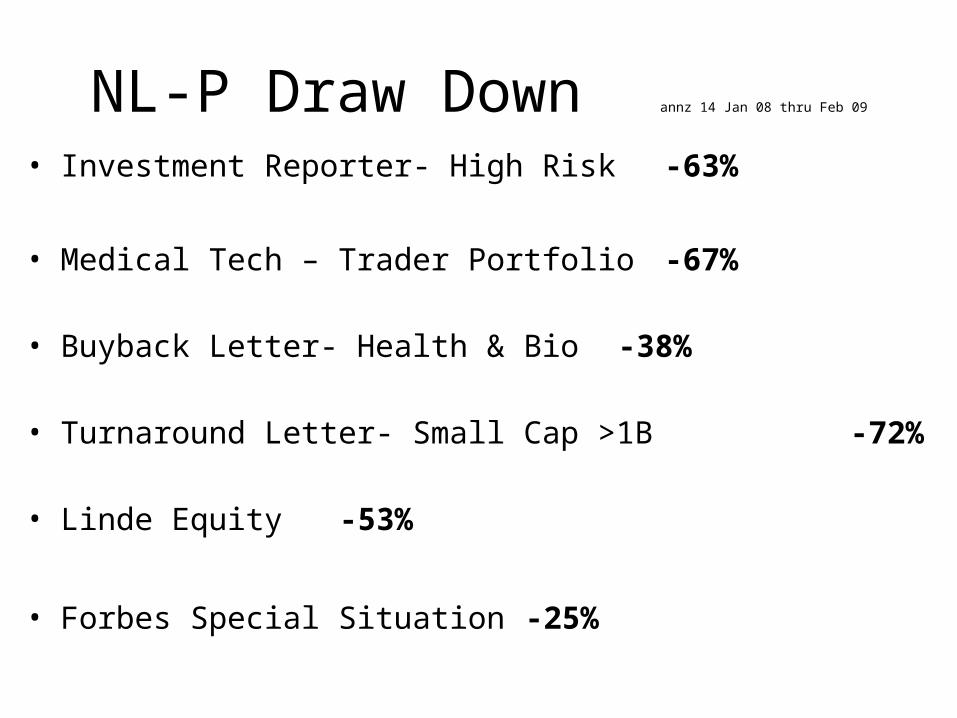
NL-P Draw Down annz 14 Jan 08 thru Feb 09
• Investment Reporter- High Risk -63%
• Medical Tech – Trader Portfolio -67%
• Buyback Letter- Health & Bio -38%
• Turnaround Letter- Small Cap >1B -72% • Linde Equity -53%
• Forbes Special Situation -25%
Conclusion
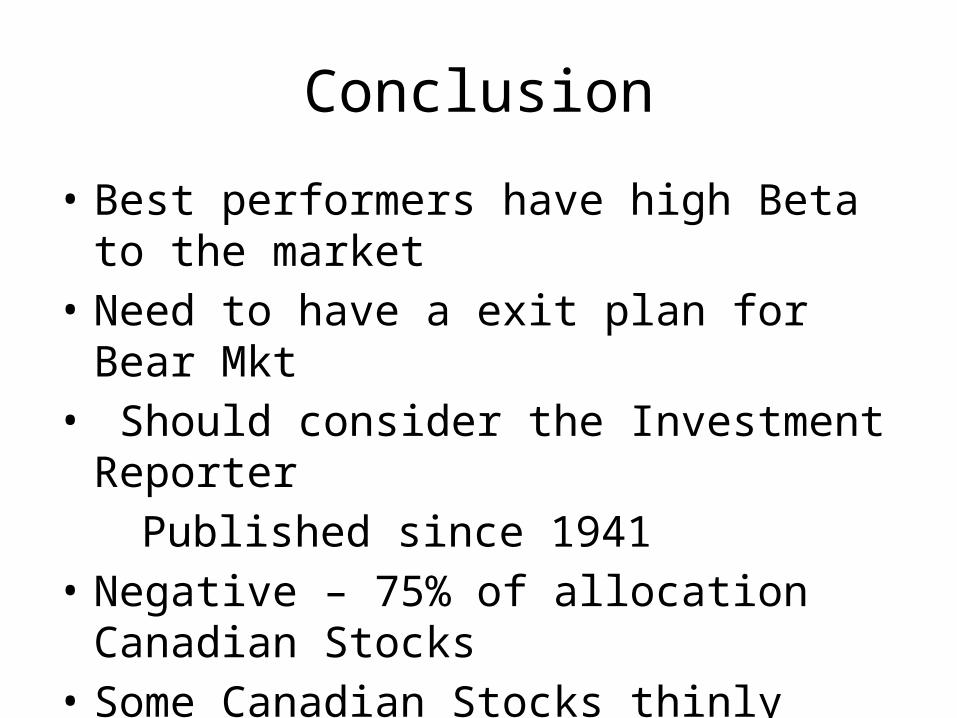
• Best performers have high Beta to the market• Need to have a exit plan for Bear Mkt• Should consider the Investment Reporter
Published since 1941• Negative – 75% of allocation Canadian Stocks• Some Canadian Stocks thinly traded