Introducing the INPACT Assessment Process
77
The Change Equation© Imaginist 2009 9/7/2010 Introducing the INPACT Assessment Process O R G A N IS A T IO N A L CA P A B ILIT Y TH E P R O JE C T C ultu re Process £ O R G A N IS A T IO N A L CA P A B ILIT Y TH E P R O JE C T C ultu re Process £ The Change Equation How to manage complex change projects – and succeed! Peter Duschinsky Managing Director, The Imaginist Company
-
Upload
rahim-wallace -
Category
Documents
-
view
32 -
download
3
description
The Change Equation How to manage complex change projects – and succeed!. Introducing the INPACT Assessment Process. Peter Duschinsky Managing Director, The Imaginist Company. Who are we?. The Imaginist Company is a change management consultancy - PowerPoint PPT Presentation
Transcript of Introducing the INPACT Assessment Process

The Change Equation© Imaginist 2009 9/7/2010
Introducing the INPACT Assessment ProcessORGANISATI ONAL CAPABILITY
THE PROJ ECT
Culture Proce
ss
£
ORGANISATI ONAL CAPABILITY
THE PROJ ECT
Culture Proce
ss
£
The Change Equation
How to manage complex change projects – and succeed!
Peter DuschinskyManaging Director, The Imaginist Company
The Change Equation© Imaginist 2009 9/7/2010
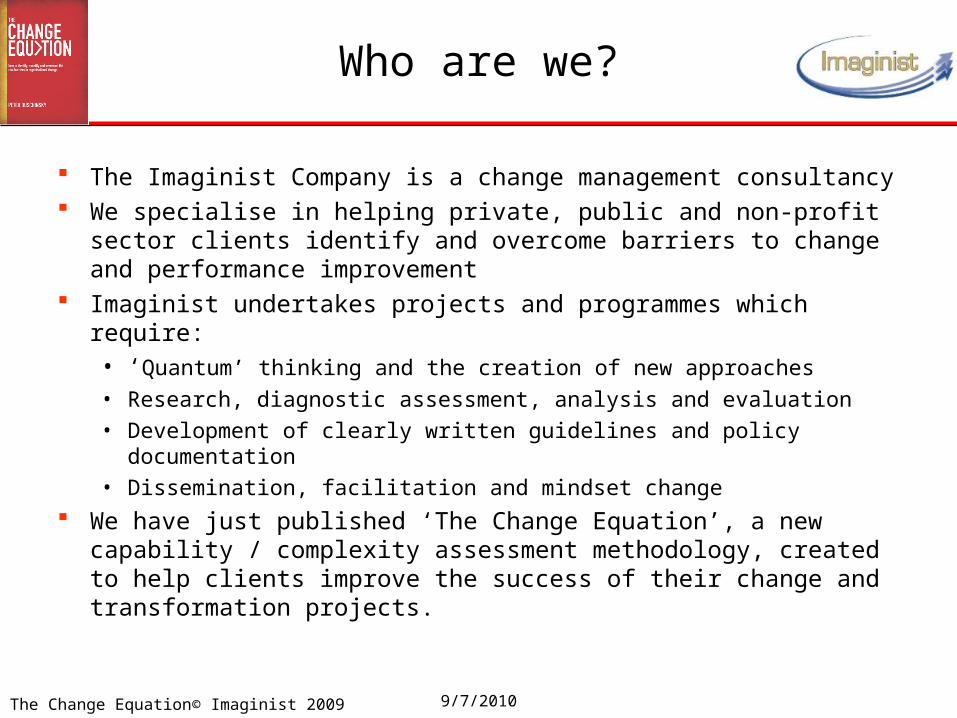
Who are we?
The Imaginist Company is a change management consultancy We specialise in helping private, public and non-profit sector clients
identify and overcome barriers to change and performance improvement
Imaginist undertakes projects and programmes which require: • ‘Quantum’ thinking and the creation of new approaches
• Research, diagnostic assessment, analysis and evaluation
• Development of clearly written guidelines and policy documentation
• Dissemination, facilitation and mindset change
We have just published ‘The Change Equation’, a new capability / complexity assessment methodology, created to help clients improve the success of their change and transformation projects.

The Change Equation© Imaginist 2009 9/7/2010
Who are we?
Our Associates and Partners

The Change Equation© Imaginist 2009 9/7/2010 4
‘The Change Equation’ is based on some key contentions:1. The success or failure of a change project is dependent on the
complexity of the project being within the capability of the organisation
2. The management of change cannot be achieved within the lifecycle of the project – it has to start earlier and go on afterwards
3. A conventional approach to management of a complex project (i.e. control and intervention) will not achieve a successful outcome
4. Management typically:
• underestimates the complexity of the project,
• employs project teams with the wrong skillsets, and
• Is unwilling to invest in change management early enough
The Change Equation

The Change Equation© Imaginist 2009 9/7/2010 5
So the objective of running an INPACT assessment is to change mindsets
In order to do this we need to provide clear and simple top-level indicators that managers can understand quickly
We use a dashboard approach, including route-maps and RED / AMBER / GREEN traffic light indicators
V.HighV.HighV.High
V.HighV.HighHigh
V.HighHighHigh
HighHighHigh
HighHighHigh
HighHighMedMedMed
MedMedMedLow
MedLowLow
LowLow
5432Level 1
9. Pragmatic/Empowered
8. Systemist
7. Imaginist
6. Empiricist
5. Pragmatic/ Aligned
4. Aligned
3. Dialectic
2. Structuralist
1. Pragmatic/ Anarchic
Management Culture
Business Process Capability
V.HighV.HighV.High
V.HighV.HighHigh
V.HighHighHigh
HighHighHigh
HighHighHigh
HighHighMedMedMed
MedMedMedLow
MedLowLow
LowLow
5432Level 1
9. Pragmatic/Empowered
8. Systemist
7. Imaginist
6. Empiricist
5. Pragmatic/ Aligned
4. Aligned
3. Dialectic
2. Structuralist
1. Pragmatic/ Anarchic
Management Culture
9. Pragmatic/Empowered
8. Systemist
7. Imaginist
6. Empiricist
5. Pragmatic/ Aligned
4. Aligned
3. Dialectic
2. Structuralist
1. Pragmatic/ Anarchic
Management Culture
Business Process Capability
9 Pragmatist/Empowered9
8SystemistImaginist
7
6Empiricist
5
3Dialectic
INTERNALFOCUS
(Individual)
EXTERNALFOCUS
(Organisation)
Pragmatist1
3Rationalist
4Aligned
Structuralist2
5 Pragmatist/Aligned
9 Pragmatist/Empowered9
8SystemistImaginist
7
6Empiricist
5
3Dialectic
INTERNALFOCUS
(Individual)
EXTERNALFOCUS
(Organisation)
Pragmatist1
3Rationalist
4Aligned
Structuralist2
5 Pragmatist/Aligned
9 Pragmatist/Empowered9
8SystemistImaginist
7
6Empiricist
5
3Dialectic
INTERNALFOCUS
(Individual)
EXTERNALFOCUS
(Organisation)
Pragmatist1
3Rationalist
4Aligned
Structuralist2
5 Pragmatist/Aligned
9999
8SystemistImaginist
7Imaginist
7
6Empiricist
6Empiricist
6Empiricist
55555
3Dialectic
3Dialectic
INTERNALFOCUS
(Individual)
INTERNALFOCUS
(Individual)
INTERNALFOCUS
(Individual)
EXTERNALFOCUS
(Organisation)
EXTERNALFOCUS
(Organisation)
EXTERNALFOCUS
(Organisation)
Pragmatist1Pragmatist1
3Rationalist
3Rationalist
4Aligned
Structuralist2
Structuralist2
StructuralistStructuralist2
5 Pragmatist/Aligned
1.InitialAd hoc process
Chaotic
2.RepeatableStable process
Controlled environmentBasic
management control
3.DefinedStandard process
Consistent ExecutionProcess
definition
4.ManagedMeasured process
Quality and Productive Improvement
Process measurement
5.OptimisedEffective process
Continuing ImprovementProcess control
1.InitialAd hoc process
Chaotic1.InitialAd hoc process
Chaotic
2.RepeatableStable process
Controlled environmentBasic
management control
2.RepeatableStable process
Controlled environmentBasic
management control
3.DefinedStandard process
Consistent ExecutionProcess
definition
3.DefinedStandard process
Consistent ExecutionProcess
definition
4.ManagedMeasured process
Quality and Productive Improvement
Process measurement
4.ManagedMeasured process
Quality and Productive Improvement
Process measurement
5.OptimisedEffective process
Continuing ImprovementProcess control
5.OptimisedEffective process
Continuing ImprovementProcess control
75 4803600
10800
32400
72000
05000
1000015000
2000025000
3000035000
4000045000
5000055000
6000065000
7000075000
80000
1 2 3 4 5 6
Simple project
Not simple -needs some
project management
A complex project –needs an
experienced project
manager
Beyond this point your project is too complex –
break it down into separate projects
and employ a programme
manager
75 4803600
10800
32400
72000
05000
1000015000
2000025000
3000035000
4000045000
5000055000
6000065000
7000075000
80000
1 2 3 4 5 6
Simple projectSimple projectSimple project
Not simple -needs some
project management
Not simple -needs some
project management
A complex project –needs an
experienced project
manager
A complex project –needs an
experienced project
manager
Beyond this point your project is too complex –
break it down into separate projects
and employ a programme
manager
Beyond this point your project is too complex –
break it down into separate projects
and employ a programme
manager
- %Total potential impact on benefits
+ %Total potential impact on project timescales/costs
Other factors impact estimated at:
IT Solution9
Relationship with suppliers8
OTHER FACTORS
Delivery of Project Impact estimated at:
Benefits Realisation7
Distrust factor6
Visibility of process5
DELIVERY OF PROJECT
Project Impact estimated at:
Complexity of project4
Clarity of objectives3
PROJECT
Capability Impact estimated at:
Capability Maturity2
Management Culture1
ORGANISATION
Benefits-%
Time/Cost +%
Potential ImpactStatusComponent
Time & Cost
Distrust
(Trust % - 100)
People trust each other, relationships are good = Speedy change = Low cost = SUCCESS Levels of trust are poor, relationships
difficult = Slow or no change = Costs go up = FAILURE
Time & Cost
Distrust
(Trust % - 100)
People trust each other, relationships are good = Speedy change = Low cost = SUCCESS Levels of trust are poor, relationships
difficult = Slow or no change = Costs go up = FAILURE
Possible OutcomesAccountability?
Plan in place?
No
No
Yes
Yes
This project will not achieve its savings objectivesNo
Without formal framework, local managers will not be held accountable in practice – put one in place
Yes
Make local managers accountable for adopting the new processes and redeploying released resources to drive improved performance, or the benefits will not be realised
No
This project has a good chance of achieving the planned benefits
Yes
Complexity
Too ComplexComplex
Not SimpleSimple
Low
Med
High
Capability
Complexity
Too ComplexComplex
Not SimpleSimple
Low
Med
High
Capability
The Change Equation

The Change Equation© Imaginist 2009 9/7/2010 6
Today we will look at how to take two models:
1. the Organisational Culture Evolution spiral
2. the Business Process Capability ladder
…and combine them to provide a baseline:the Organisational Capability Indicator
Then see how to assess the complexity and risks of a change project (3)
By analysing and quantifying the gap between Organisational Capability and Project Complexity, you can predict the likely success or failure of a change project
We can then add other tools to enrich the gap analysis
The Change Equation
ORGANI SATI ONAL CAPABI LI TY
THE PROJ ECT
Culture Proce
ss
£
ORGANI SATI ONAL CAPABI LI TY
THE PROJ ECT
Culture Proce
ss
£
£
1 2
3

The Change Equation© Imaginist 2009 9/7/2010
Only 32% of change projects are successful
That’s not our opinion, it comes from accredited sources:
Standish Group annual survey 2009 confirms that:• Only 32% of projects deliver the full benefits, on time and within
budget • 68% of projects are late, over budget and deliver less than the
expected benefits • 24% fail completely and are abandoned before they finish!

The Change Equation© Imaginist 2009 9/7/2010
Change projects often fail to deliver

The Change Equation© Imaginist 2009 9/7/2010
More evidence of the same trend
The Harvard Business School tracked the impact of change efforts among the Fortune 100 and they also found that only 30% produced a positive bottom-line improvement…
A recent survey of change programmes in <400 European organisations quoted by Prof. John Oakland, Emeritus Professor, Leeds University Business School found that:
• 90% of change programmes faced major implementation problems
• Only 30% delivered measurable business improvements

The Change Equation© Imaginist 2009 9/7/2010
More evidence of the same trend -2
Management consultant PricewaterhouseCoopers (March 2007) claim that:
• 25% of IT projects succeed
• 25% fail and
• 50% are late or over budget
A CIPD survey of 800 executives found that reorganisations failed to deliver real improvement in performance in 40% of cases
Why do so many change projects fail to deliver?
25% FAIL 25% SUCCEED50% PARTIALLY SUCCEED

The Change Equation© Imaginist 2009 9/7/2010
Why do so many change projects fail to deliver?
Here are some of the reasons we all know about:
• a focus on the technology instead of the business benefits
• poor specification of the system and lack of due diligence on supplier capability
• failure to gain senior management championship
• inadequate resources
• poor project management
• lack of user involvement
But if we all know about the reasons, why are change projects still going wrong so often?

The Change Equation© Imaginist 2009 9/7/2010
“The Terminal 5 debacle is a national disgrace” Daily Mail, 14 April 2008
Some examples… Terminal 5

The Change Equation© Imaginist 2009 9/7/2010
So what went wrong?
1. Shortage of staff car parking spaces
2. Only one employee security checkpoint operating
3. Some staff unable to log on to the computer system
4. Hand-held communication software running slow
5. No managers on the ground to re-allocate work
6. Shortage of bar-reading storage bins
Baggage handling staff late in arriving
60 staff queue to get into terminal
6am: 3 planes leave without bags
Bags pile up, unattended
By midday 20 flights cancelled
4pm: baggage conveyor belt grinds to a halt, BA suspends all baggage check-in
The result: Over 28,000 lost bags, 700 cancelled planes and more than 150,000 disrupted passengers

The Change Equation© Imaginist 2009 9/7/2010
C-Nomis
2004: HM Prison Service commissions C-NOMIS to give prison and probation officers real-time access to offenders’ records
June 2005: the approved lifetime cost of the project is quoted as £234m
March 2007: Home Secretary John Reid: “the main C-NOMIS base release, encompassing full prison and probation functionality, will be available no later than July 2008"
July 2007: [just 4 months later!] £155m has been spent, C-NOMIS is two years behind schedule; estimated lifetime project costs are now £690m. The Ministry of Justice suspends the project
How can they have let a Minister do that? Surely someone knew…?

The Change Equation© Imaginist 2009 9/7/2010
What went wrong?
National Audit Office report:• The project board accepted assurances that the project was “all
going well” and nobody knew what was being delivered for the money being spent
• There were insufficient resources and structures in place to deliver such a complex project
• Over time policy developed and stakeholder requirements changed, but there was no cumulative view of the impact of change requests on costs and timescales
• No resources were allocated to simplifying and standardising business processes across the 139 prisons and 42 probation areas, each of which had their own ways of working
The Commons Public Accounts Committee report verdict: “a spectacular failure – in a class of its own”

The Change Equation© Imaginist 2009 9/7/2010
More examples…
Passport Office: • In 1999 delays in processing British passport applications,
following the introduction of the Passport Agency’s new system, cost £12 million
• £16,000 was allegedly spent on umbrellas to shelter those queuing in the rain to collect their passports!
MOD: • In 2002 a project to replace the British Army, Royal Navy and
Royal Air Force inventory systems with a single system (the Defence Stores Management Solution) was brought to a halt after £130 million had been spent
• Hardware worth a little over £12 million was able to be used elsewhere but the remaining £118 million was written off as a loss.

The Change Equation© Imaginist 2009 9/7/2010
More examples…
The London Ambulance Service Computer-Aided Dispatch System
October 26, 1992: the London Ambulance Service CAD system goes live – and fails
A total of 46 people didn’t get an ambulance in time and DIED!

The Change Equation© Imaginist 2009 9/7/2010
What went wrong?
The sequence of the collapse was:1. Poorly trained staff did not update system with location and
status of units
2. The increasingly out-of-date database meant units were being despatched non-optimally and multiple units were being sent to the same calls
3. A software bug generated a large number of exception messages– and un-responded exception messages generated repeat messages…
4. Lists scrolled off the top of the screens and were lost
5. The public repeated un-responded calls, adding to the chaos

The Change Equation© Imaginist 2009 9/7/2010
What went wrong? cont…
6. The system grinds to a halt:• One ambulance arrived to find the patient dead and taken away by
undertakers• Another ambulance answered a ’stroke’ call after 11 hours, and 5 hours
after the patient had made their own way to hospital
7. CAD system partly disabled. Part-manual system seizes up completely
8. Operators now using tape recordings of calls, then reverting to a totally manual system
9. 29 October 2002: (3 days after confidently launching the system) Chief Executive resigns
The original estimate for the work was £1.25million. By the time the project was abandoned, £7.5million had been
spent. A total of 46 people didn’t get an ambulance in time and DIED!

The Change Equation© Imaginist 2009 9/7/2010
Some conclusions
“The the small software error was the straw that broke the camel's back, but the responsibility for the LAS's CAD system failure does not lie solely on the single developer who made the error or even the developing organization to which he belonged. Rather, the attitudes of key LAS members toward the project and the unreasonable restraints they placed on the project allowed the failure to occur.” National Audit Office report
The Change Equation© Imaginist 2009 9/7/2010
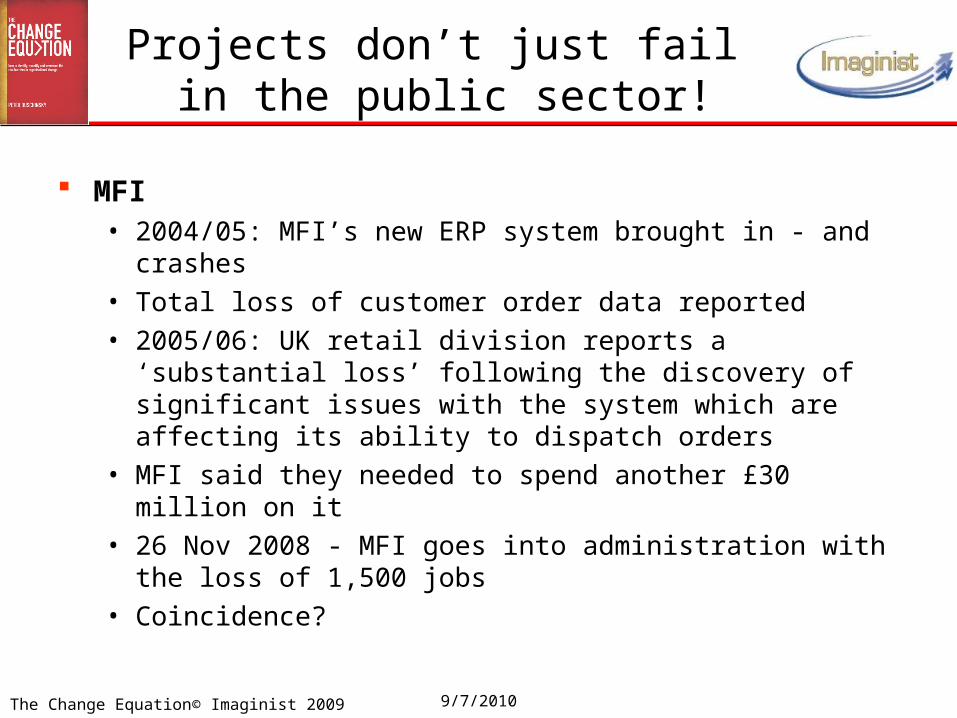
Projects don’t just fail in the public sector!
MFI• 2004/05: MFI’s new ERP system brought in - and crashes• Total loss of customer order data reported• 2005/06: UK retail division reports a ‘substantial loss’ following
the discovery of significant issues with the system which are affecting its ability to dispatch orders
• MFI said they needed to spend another £30 million on it• 26 Nov 2008 - MFI goes into administration with the loss of
1,500 jobs • Coincidence?

The Change Equation© Imaginist 2009 9/7/2010
HP• In 2004, HP's project managers knew all of the things that could
go wrong with their ERP centralisation programme. But they just didn't plan for so many of them to happen at once.
• The project eventually cost HP $160 million in order backlogs and lost revenue—more than five times the project's estimated cost.
• Gilles Bouchard, then-CIO of HP's global operations, says: "We had a series of small problems, none of which individually would have been too much to handle. But together they created the
perfect storm." There’s a clue in there, somewhere…
Projects don’t just fail in the public sector!

The Change Equation© Imaginist 2009 9/7/2010
Complexity is EXPONENTIAL!
Conclusion?

The Change Equation© Imaginist 2009 9/7/2010
We’re surrounded by examples of exponential growth: For example, compound interest:
• "Scientists have developed a powerful new weapon that destroys people but leaves buildings standing – it's called the 17% interest rate.” Johnny Carson, The Tonight Show, 1980
• All that we had borrowed up to 1985 was around $5 billion, and we have paid about $16 billion; yet we are still being told that we owe about $28 billion. If you ask me what is the worst thing in the world, I will say it is compound interest.
President Obasanjo of Nigeria, 2000
Complexity is Exponential

The Change Equation© Imaginist 2009 9/7/2010
Complexity is Exponential
The world population is growing at an exponential rate:
…and consumption of resources is following close behind -our energy usage is depleting the world’s natural resources exponentially
You are here!
(6,792,142,533)

The Change Equation© Imaginist 2009 9/7/2010
Complexity is Exponential
And climate change is also following an exponential runaway profile

The Change Equation© Imaginist 2009 9/7/2010
Complexity is Exponential
"The greatest shortcoming of the human race is our inability to understand the exponential function.
We live in a world that can change exponentially – but we have brains that are hardwired to plot things out linearly - the software in our brains compels us to think about progressions as being simple arithmetic ones
So as a species, and a society, we deal poorly with uncertainty in non-linear domains.”
Prof Albert Bartlett, emeritus Professor of Physics, University of Colorado
As a consequence of this, the complexity of a project is usually UNDERESTIMATED

The Change Equation© Imaginist 2009 9/7/2010
Managing Exponential Complexity
Exponential complexity = exponential RISK So we should be able to apply risk management techniques to
address it Everyone happy with that? According to David Christiansen, most risk management
approaches work something like this:• Make a list of risks• Estimate the likelihood the risk will occur (call it X)• Estimate the cost the risk will create if it occurs (call it Y)• Multiple X by Y (David Christiansen, Information Technology Dark
Side, a Corporate IT Survival Guide)
So let’s draw up a table with all the risk factors and score them…
The Change Equation© Imaginist 2009 9/7/2010
Managing Exponential Risk
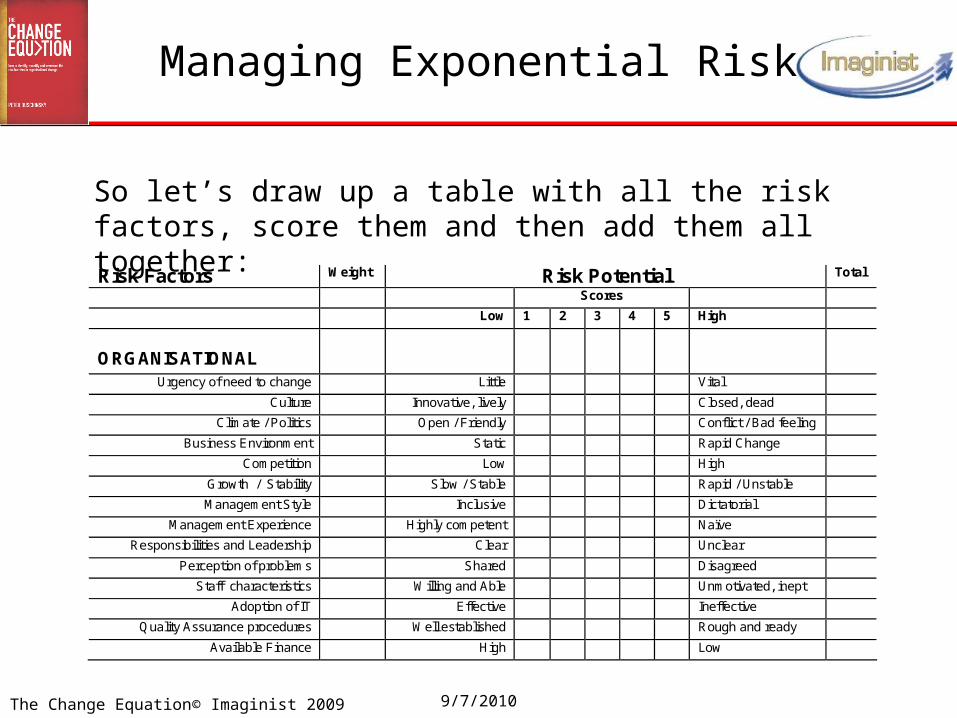
So let’s draw up a table with all the risk factors, score them and then add them all together:
Risk Factors Weight Risk Potential Total
Scores
Low 1 2 3 4 5 High
ORGANISATIONAL
Urgency of need to change Little Vital
Culture Innovative, lively Closed, dead
Climate / Politics Open / Friendly Conflict / Bad feeling
Business Environment Static Rapid Change
Competition Low High
Growth / Stability Slow / Stable Rapid / Unstable
Management Style Inclusive Dictatorial
Management Experience Highly competent Naïve
Responsibilities and Leadership Clear Unclear
Perception of problems Shared Disagreed
Staff characteristics Willing and Able Unmotivated, inept
Adoption of IT Effective Ineffective
Quality Assurance procedures Well established Rough and ready
Available Finance High Low
The Change Equation© Imaginist 2009 9/7/2010
Managing Exponential Risk
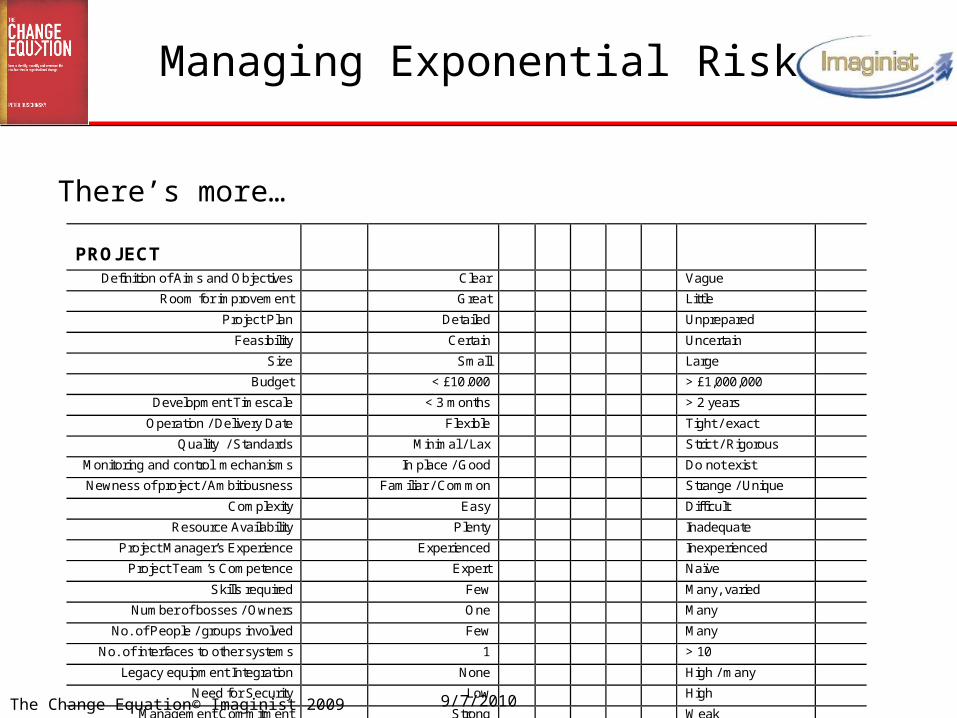
There’s more…
PROJECT
Definition of Aims and Objectives Clear Vague
Room for improvement Great Little
Project Plan Detailed Unprepared
Feasibility Certain Uncertain
Size Small Large
Budget < £10.000 > £1,000,000
Development Timescale < 3 months > 2 years
Operation / Delivery Date Flexible Tight / exact
Quality / Standards Minimal / Lax Strict / Rigorous
Monitoring and control mechanisms In place / Good Do not exist
Newness of project / Ambitiousness Familiar / Common Strange / Unique
Complexity Easy Difficult
Resource Availability Plenty Inadequate
Project Manager’s Experience Experienced Inexperienced
Project Team’s Competence Expert Naïve
Skills required Few Many, varied
Number of bosses / Owners One Many
No. of People / groups involved Few Many
No. of interfaces to other systems 1 > 10
Legacy equipment Integration None High / many
Need for Security Low High
Management Commitment Strong Weak
User demand Keen Hostile
Anticipated User involvement High throughout Minimal
Staff Capability High, adaptable Low, untrained

The Change Equation© Imaginist 2009 9/7/2010
Managing Exponential Risk
And still more…
You think this is daunting? Have you looked at government’s Gateway Review?
OPTIONS
Operational Matches objectives Fits few of the needs
Financial Well within budget Over budget limit
Economic return Good investment Poor investment
Social upset / Staff happiness Improvement Anger & disruption
Achievability of Schedule Easily on Time May be late
Amount of change caused Highly beneficial Little difference
Potential User Impact / Retraining needs
Low High
Legal / Ethical problems Few Many
Number of Suppliers 1 > 5
Supplier support High, reliable Low, inadequate
Security Risk Low High
Newness of technology Tried and tested Frontier breaking
Build or Buy Modular package Bespoke software

The Change Equation© Imaginist 2009 9/7/2010
Managing Exponential Complexity
So what’s wrong with that approach?
The Change Equation© Imaginist 2009 9/7/2010
Managing Exponential Complexity
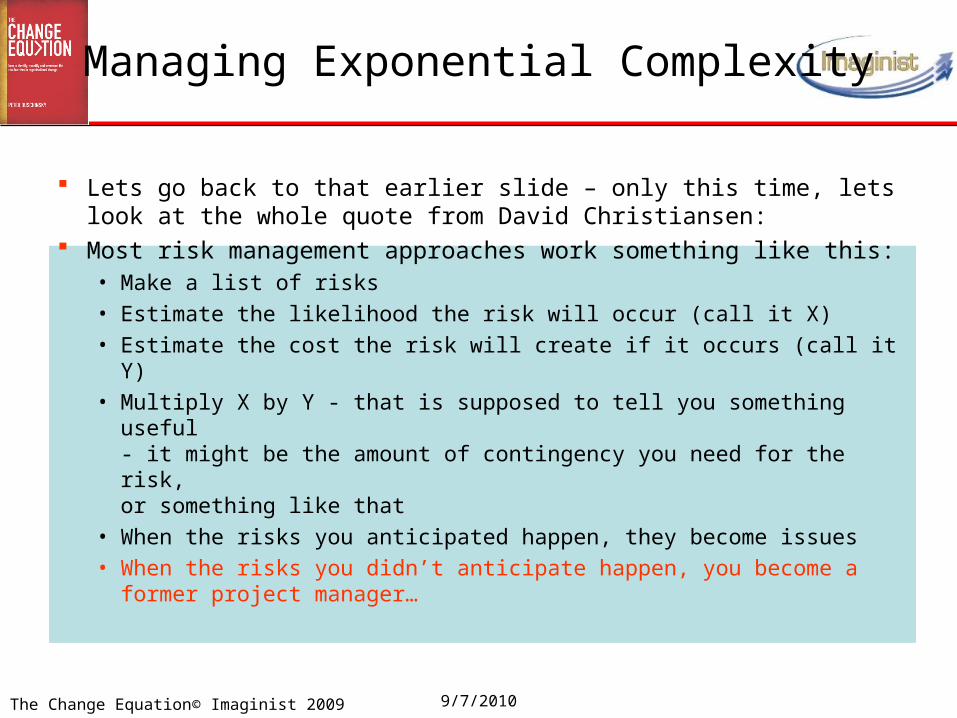
Lets go back to that earlier slide – only this time, lets look at the whole quote from David Christiansen:
Most risk management approaches work something like this:• Make a list of risks• Estimate the likelihood the risk will occur (call it X)• Estimate the cost the risk will create if it occurs (call it Y)• Multiply X by Y - that is supposed to tell you something useful
- it might be the amount of contingency you need for the risk, or something like that
• When the risks you anticipated happen, they become issues• When the risks you didn’t anticipate happen, you become a
former project manager…

The Change Equation© Imaginist 2009 9/7/2010
Managing Exponential Complexity
Wouldn’t it be great if we could find a simple, high-level indicator of project complexity?
It wouldn’t obviate the need for a detailed risk analysis But it would give us a high-level indication of whether the
complexity of the project had been judged correctly when allocating budgets, skilled resources and roll-out timescales
Well, we can…

The Change Equation© Imaginist 2009 9/7/2010
Managing Exponential Risk
If complexity is exponential, we actually only need 3 factors to build an exponential scale: X * Y * Z
That won’t represent all the risks, but if we select the right factors, it will give us a good indicator
So what are our 3 factors?
0
100000
200000
300000
400000
500000
600000
700000
800000
900000
1000000
1 2 3 4 5 6 7 8 9 10 11 12 13 14 15 16 17 18 19 20
X
Y
Z
Complexity Factor

The Change Equation© Imaginist 2009 9/7/2010
Assessing Complexity
Which 3 factors? They must be:
• Common to all projects• Quantifiable (at least to a good approximation) by stakeholders• Sufficiently powerful in combination to lead to an accurate
assessment of the complexity of a project
The Change Equation© Imaginist 2009 9/7/2010
Managing Exponential Risk
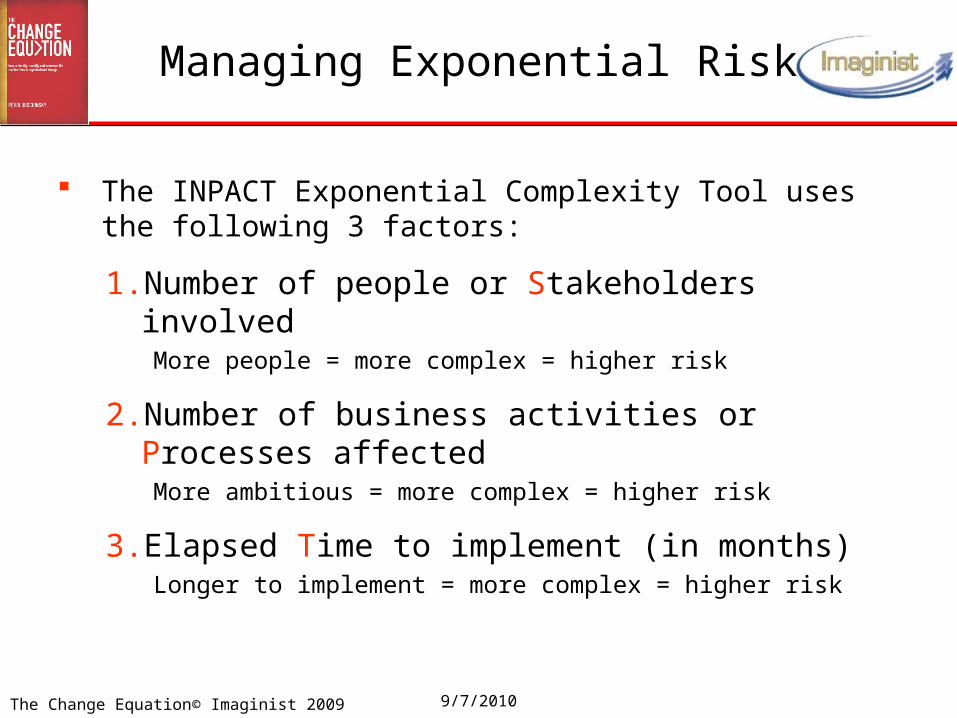
The INPACT Exponential Complexity Tool uses the following 3 factors:
1. Number of people or Stakeholders involvedMore people = more complex = higher risk
2. Number of business activities or Processes affected More ambitious = more complex = higher risk
3. Elapsed Time to implement (in months) Longer to implement = more complex = higher risk

The Change Equation© Imaginist 2009 9/7/2010
The INPACT Exponential Complexity Tool
Think about a project you are familiar with. Where do you think you are? Now do the numbers: Stakeholders x Processes x Time (in months) Where are you actually?
Co
mp
lexi
ty F
ac
tor
75 4803600
10800
32400
72000
0
5000
1000015000
20000
25000
30000
3500040000
45000
50000
55000
60000
6500070000
75000
80000
1 2 3 4 5 6
Not simple –needs
experienced project
management
A complex project –
needs dedicated
project team
Beyond this point your project is too complex – break it down into smaller
projects and employ a skilled programme
manager
Simple project – needs some
project management
Co
mp
lexi
ty F
ac
tor
75 4803600
10800
32400
72000
0
5000
1000015000
20000
25000
30000
3500040000
45000
50000
55000
60000
6500070000
75000
80000
1 2 3 4 5 6
Not simple –needs
experienced project
management
Not simple –needs
experienced project
management
Not simple –needs
experienced project
management
A complex project –
needs dedicated
project team
A complex project –
needs dedicated
project team
Beyond this point your project is too complex – break it down into smaller
projects and employ a skilled programme
manager
Beyond this point your project is too complex – break it down into smaller
projects and employ a skilled programme
manager
Simple project – needs some
project management
Simple project – needs some
project management
Simple project – needs some
project management

The Change Equation© Imaginist 2009 9/7/2010
The model can also be used to understand whether a project that is going wrong can be rescued - or needs to be stopped
The INPACT Exponential Complexity Tool
Premature Termination
Possible Recovery
Conventional Management

The Change Equation© Imaginist 2009 9/7/2010
Complexity and the Implications for Change Management
“Complexity arises through connectivity and processes of feedback and emergence” Eve Middleton-Kelly, Director, Complexity Research
Programme, London School
of Economics
This feedback loop is also a feature of Chaos Theory But in Chaos Theory, new, coherent and stable patterns eventually
arise through repeated cycles of iteration In a change project, the participants are constantly evolving, so the
rules of interaction are in flux, making the final outcome ultimately unknowable• “Technically complex projects are complex because of the human
aspects and not the technical intricacies, which are just complicated” Thomas Docker, citi, 2008
- Complicated = not simple, but ultimately knowable
- Complex = not simple and never fully knowable

The Change Equation© Imaginist 2009 9/7/2010
Complexity and the Implications for Change Management
In a complex project, new ways of working are created and new forms of organisation will emerge which are attuned to the culture of the organisation – and will therefore work
These need to be recognised, supported and embedded, not managed and controlled
This has important implications for Change Management

The Change Equation© Imaginist 2009 9/7/2010
Complexity and the Implications for Change Management
Conventional change management interventions attempt to design and control the outcomes
This imposes changes in behaviour and over-rides the individual’s need to ‘invent their own route to the future’
That approach blocks and constrains the naturally emergent patterns of behaviour…so people give up, fall back on ‘what’s in it for me’ and the change project fails
However, if the right enabling infrastructure is put in place to facilitate, nurture and support the new relationships and behaviours, the change project will have a good chance of succeeding
Are “nurturing” and “enabling” descriptions you would use of most project managers you know?

The Change Equation© Imaginist 2009 9/7/2010
Why else do change projects fail?
So that’s complexity – we typically underestimate it, so we under-resource it and our expectations of outcomes are too optimistic
Why else do change projects fail?
Look at these quotes:
• “85% of project success is dependent on factors related to people” Ohio Center for Information Based Competition
• “Even amongst successful implementations, 47% of companies reported serious challenges with end-user adoption that often put projects in jeopardy” - AMR Research
• “Companies that spend less than 17% of ERP implementation budgets on training put their projects at increased risk of failure” Gartner

The Change Equation© Imaginist 2009 9/7/2010
Why else do change projects fail?
It turns out that success rests as much on the capability of the people in the organisation to cope with change and take advantage of new systems, as on how well the project was planned and implemented
The complexity of the project needs to be within the capability of the organisation
We’ve seen how to assess the complexity of a project How do we assess the capability of the organisation? By looking at its Culture and its Process Management
Capability ORGANI SATI ONAL CAPABI LI TY
THE PROJ ECT
Culture Proce
ss
£
ORGANI SATI ONAL CAPABI LI TY
THE PROJ ECT
Culture Proce
ss
£

The Change Equation© Imaginist 2009 9/7/2010
Assessing an Organisation’s Culture
There is an underlying tension between the individual and the organisation
Successful change needs an integrated approach encompassing people and process in a balanced approach
Point of balance
ORGANISATION‘External’ Focus:• The organisation’s
needs and direction• Systems and processes• Efficiency
THE INDIVIDUAL‘Internal’ Focus:• Culture• People’s perceptions, attitudes,
motivations, aspirations• Effectiveness

The Change Equation© Imaginist 2009 9/7/2010
Imagine thependulum swinging and rising at the same time…
Assessing an Organisation’s Culture
ORGANISATION‘External’ Focus:• The organisation’s
needs and direction• Systems and processes• Efficiency
THE INDIVIDUAL‘Internal’ Focus:• Culture• People’s perceptions, attitudes,
motivations, aspirations• Effectiveness

The Change Equation© Imaginist 2009 9/7/2010
5
8
Systemist
Imaginist7
6Empiricist
3Dialectic
1 Pragmatist/Anarchic
4
Aligned
Structuralist2
5 Pragmatist/ Aligned
9 Pragmatist/ Empowered
Assessing an Organisation’s Culture
That gives us the basis for our Culture Evolution Model
ORGANISATION‘External’ Focus
THE INDIVIDUAL‘Internal’ Focus

The Change Equation© Imaginist 2009 9/7/2010
It indicates how well the organisation will cope with change
EXTERNALFOCUS
(Organisation)
5
INTERNALFOCUS
(Individual)
8
SystemistImaginist7
6Empiricist
3Dialectic
1 Pragmatist/Anarchic
4
Aligned
Structuralist2
5 Pragmatist/ Aligned
9 Pragmatist/ Empowered
This model allows us to identify the predominant organisational culture
Each point on the spiral represents a separate, definable culture
Each culture builds upon the earlier ones, progressing up the spiral
Assessing an Organisation’s Culture

The Change Equation© Imaginist 2009 9/7/2010
Mapping your Management Culture
Which of the following descriptions most accurately describes your organisation (or your part of it)?• You might be able to identify more than one - that’s because
they are not discrete styles• Each is only achievable when those below it on the spiral are in
place• The chances are you will focus mainly on the negative aspects
of your management culture• But each style has positive and negative elements - if not
nurtured, they degrade over time

The Change Equation© Imaginist 2009 9/7/2010
This is where we all start
In this entrepreneurial organisation, it’s results that count
The boss may be micro-managing everything or leaving members of the team to do more or less what they like, as long as they achieve results
Either way, success is what counts, not how you get there – ‘just do it’
There are some laid-down procedures, but people only follow them or takeup a new initiative if they see benefits for themselves in doing so
The Management Culture model: Level 1
8SystemistImaginist
7
6Empiricist
5 Pragmatist/Aligned
9 Pragmatist/Empowered
5
1 Pragmatist/AnarchicStructuralist
2
3Dialectic Aligned
4

The Change Equation© Imaginist 2009 9/7/2010
Rules, devolved authorities and formal procedures govern how this organisation works
That has allowed the organisation’s operations to be scaled up, but it will also have allowed ‘silo working’ to emerge, hindering the sharing of ideas and knowledge across the organisation
Change is slow and painful; decisions are often passeddown, with formal but inadequate consultation;initiatives are not encouraged
8SystemistImaginist
7
6Empiricist
5 Pragmatist/Aligned
9 Pragmatist/Empowered
3Dialectic Aligned
4
1 Pragmatist/Anarchic
Structuralist2
The Management Culture model: Level 2

The Change Equation© Imaginist 2009 9/7/2010
The organisation wasn’t efficient, so management brought in the Business Process Redesign consultants, the LEAN specialists and an ERP system
Your organisation is now streamlined, focusing on cost cutting and efficiency, with modern,rationalised and automated processes
But it still doesn’t seem to be working very well,does it?
Why not?
8SystemistImaginist
7
6Empiricist
5 Pragmatist/Aligned
9 Pragmatist/Empowered
Structuralist2
Aligned4
1 Pragmatist/Anarchic
3Dialectic
The Management Culture model: Level 3
4Rationalist

The Change Equation© Imaginist 2009 9/7/2010
Well perhaps we didn’t spend enough time gaining the ownership for the changes…
It might be better if:
Then silo working might stop being such a significant barrier to change
8SystemistImaginist
7
6Empiricist
5 Pragmatist/Aligned
9 Pragmatist/Empowered
Structuralist2
Aligned4
1 Pragmatist/Anarchic
3Dialectic
The Management Culture model: Level 3
People were valued more than processes
Sharing knowledge wasvalued, as opposed to having (and protecting) knowledge
Managers and staff were encouraged to network and exchange ideas and information across the organisation

The Change Equation© Imaginist 2009 9/7/2010
Now, as a result of strong leadership and a good level of dialogue between people, the values and aspirations of the staff in your organisation are in line with its policies and strategic direction
People feel valued and understand how they fit into the scheme of things, so are more motivated to accept change that will benefit the organisation, even if it doesn’t reduce their workload.
Because people and processes are aligned, things work well
Sounds like a good place to work, doesn’t it?
8SystemistImaginist
7
6Empiricist
5 Pragmatist/Aligned
9 Pragmatist/Empowered
Structuralist2
1 Pragmatist/Anarchic
3Dialectic
4Aligned
The Management Culture model: Level 4

The Change Equation© Imaginist 2009 9/7/2010
Once people feel valued and share information the organisation starts to function differently
Managers trust their staff to act in the best interests of the organisation
Decisions can be made closer to the customer, quickly and effectively
Staff are actively encouraged to get involved in innovation and performance improvement initiatives
Things get done, change becomes easier
The Management Culture model:Level 5
8SystemistImaginist
7
6Empiricist
9 Pragmatist/Empowered
Structuralist2
1 Pragmatist/Anarchic
3Dialectic Aligned
4
5 Pragmatist/Aligned

The Change Equation© Imaginist 2009 9/7/2010
Now the organisation is not so inward-facing and obsessed with internal power-plays, it can function better in the ‘real world’
Key information about your customers, suppliers, competition etc. flows across departments, as well as up and down the management hierarchy
Because it does not suffer delays or distortion from passing through departmental silos, the information is timely and accurate, which means that management decisions are well-informed and effective
The Management Culture model: Level 6
8SystemistImaginist
7
9 Pragmatist/Empowered
Structuralist2
1 Pragmatist/Anarchic
3Dialectic Aligned
4
6Empiricist
5 Pragmatist/Aligned

The Change Equation© Imaginist 2009 9/7/2010
Because your organisation is working well, senior managers are not focused on short-term fire-fighting and intervention, allowing them the time to concentrate on longer-term planning and more important issues
They are operating with timely and accurate information, which means they can make intuitive, high quality and far-reaching decisions - and that means the organisation is able to cope well with change
This requires a different calibre of manager, the Imaginist
The Management Culture model: Level 7
8Systemist
9 Pragmatist/Empowered
Structuralist2
1 Pragmatist/Anarchic
3Dialectic Aligned
4
5 Pragmatist/Aligned
7Imaginist
6Empiricist

The Change Equation© Imaginist 2009 9/7/2010
The organisation now recognises its place in its business, economic, social and community contexts – and plans and manages accordingly
Your CEO makes him/herself visible and available, and is vocal in championing changesand issues that are critical to the organisation’s success, but his/her leadership style is to steer from behind and focus on building longer-term capability, rather than intervening in operational issues
This works because the organisation has a strong and effective Board and an aligned workforce
The Management Culture model: Level 8
9 Pragmatist/Empowered
Structuralist2
1 Pragmatist/Anarchic
3Dialectic Aligned
4
5 Pragmatist/Aligned6
Empiricist
Imaginist7 8
Systemist

The Change Equation© Imaginist 2009 9/7/2010
Finally, if you are lucky enough to be working in an organisation that has set itself the challenge of being the best in class:
You are fully empowered to plan and manage your own workload, within a supportive management culture
This includes working collaboratively in teams and leading and participating in change projects, to continually improve the effectiveness of the organisation to meet its customers’ needs
This is a learning organisationWe’re a long way from the culture of blame and focus on short-term gain, where we started
The Management Culture model: Level 9
Structuralist2
1 Pragmatist/Anarchic
3Dialectic Aligned
4
5 Pragmatist/Aligned6
Empiricist
Imaginist7
9 Pragmatist/Empowered
8Systemist
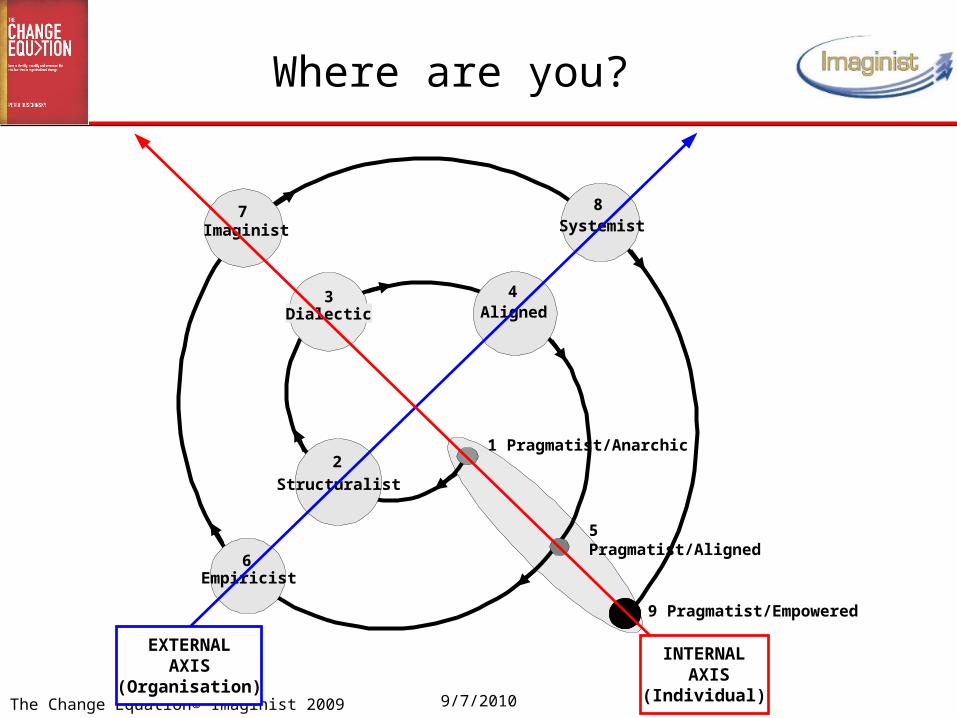
The Change Equation© Imaginist 2009 9/7/2010
Structuralist
21 Pragmatist/Anarchic
3Dialectic Aligned
4
5 Pragmatist/Aligned
6Empiricist
Imaginist7
9 Pragmatist/Empowered
8Systemist
EXTERNAL AXIS
(Organisation)
INTERNAL AXIS
(Individual)
Where are you?

The Change Equation© Imaginist 2009 9/7/2010
ORGANI SATI ONAL CAPABI LI TY
THE PROJ ECT
Culture Proce
ss
£
ORGANI SATI ONAL CAPABI LI TY
THE PROJ ECT
Culture Proce
ss
£
Organisational Capability- the next step
We have looked at management culture Now let’s focus on the organisation’s capability to manage its
business processes

The Change Equation© Imaginist 2009 9/7/2010
Organisations with aspects of their operation at levels 1 and 2 will find it difficult to introduce standard systems and processes
Assessing an Organisation’s Process Management Capability
1. Initial Ad hoc process
Chaotic
2. RepeatableStable process
Controlled environment
3. Defined Standard process
Consistent Execution
4. Managed Measured process
Quality and Productive Improvement
5. Optimised Effective process
Continuing Improvement
Software Engineering Institute
We use the Process Capability Maturity Model (CMM) to assess the organisation’s process capability – the discipline and consistency with which processes are managed

The Change Equation© Imaginist 2009 9/7/2010
The Organisational Capability Indicator
V.HighV.HighV.High
V.HighV.HighHigh
V.HighHighHigh
HighHighHigh
HighHighHigh
HighHighMedMedMed
MedMedMedLow
MedLowLow
LowLow
5432Level 1
9. Pragmatic/Empowered
8. Systemist
7. Imaginist
6. Empiricist
5. Pragmatic/ Aligned
4. Aligned
3. Dialectic
2. Structuralist
1. Pragmatic/ Anarchic
Management Culture
Business Process Capability Combining these two assessments gives us a high level indication of the Organisational Capability
So, for example, a level 2 culture and level 3 process capability suggests a Medium overall capability to cope with change

The Change Equation© Imaginist 2009 9/7/2010
Where on the exponential complexity scale was your project?
Co
mp
lexi
ty F
ac
tor
75 4803600
10800
32400
72000
0
5000
1000015000
20000
25000
30000
3500040000
45000
50000
55000
60000
6500070000
75000
80000
1 2 3 4 5 6
Not simple –needs
experienced project
management
A complex project –
needs dedicated
project team
Beyond this point your project is too complex – break it down into smaller
projects and employ a skilled programme
manager
Simple project – needs some
project management
Co
mp
lexi
ty F
ac
tor
75 4803600
10800
32400
72000
0
5000
1000015000
20000
25000
30000
3500040000
45000
50000
55000
60000
6500070000
75000
80000
1 2 3 4 5 6
Not simple –needs
experienced project
management
Not simple –needs
experienced project
management
Not simple –needs
experienced project
management
A complex project –
needs dedicated
project team
A complex project –
needs dedicated
project team
Beyond this point your project is too complex – break it down into smaller
projects and employ a skilled programme
manager
Beyond this point your project is too complex – break it down into smaller
projects and employ a skilled programme
manager
Simple project – needs some
project management
Simple project – needs some
project management
Simple project – needs some
project management
?
Was it significantly further up the scale than you had thought?

The Change Equation© Imaginist 2009 9/7/2010
Combining Capability and Complexity
Capability
High
Med
Low
SimpleNot Simple Complex
Too Complex
Complexity
= The project looks as if it’s within your capability
= This project is at risk of not realising expected benefits
= This project is not within your organisation’s capability
Put the project’s complexity status into the context of your organisation’s capability, to show the relative complexity of the project - the gap between the organisation’s capability and that required to manage the project and cope with the changes it requires people to make

The Change Equation© Imaginist 2009 9/7/2010
Combining Capability and Complexity
Capability
High
Med
Low
SimpleNot Simple Complex
Too Complex
Complexity
= The project looks as if it’s within your capability
= This project is at risk of not realising expected benefits
= This project is not within your organisation’s capability
In this example, the project is at risk of not realising expected benefits and, as planned, may actually be beyond your organisation’s capability to cope with the changes it would bring

The Change Equation© Imaginist 2009 9/7/2010
Other models and tools
We now have a reasonably good assessment of the likely success or failure of the project
A typical assessment process involves face-to-face interviews with stakeholders which would also provide the stories and rich detail that is needed to make sense of these top-line results
There are other models we use to add further to our understanding:• The Trust/cost model• The Dynamic Benefits Realisation model
etc

The Change Equation© Imaginist 2009 9/7/2010
Measuring Trust
We measure the 3 dimensions of relationships to give a Cost/trust Indicator:1. How far do you trust your boss
to represent your interests, consult you when necessary and keep you fully informed?
2. How far do you trust your staff to work without your keeping an eye on them?
3. How far do you trust your colleagues to share accurate information and keep you informed about changes that might affect you?
Dimension 1:Relationship with my manager
Dimension 2:Relationship with my staff
Dimension 3:Relationship with my colleagues

The Change Equation© Imaginist 2009 9/7/2010
Measuring Trust
Score each of these on a scalewhere:0 = not at all
1 = not sure
2 = mostly
3 = totally
Add these up (max 9)
Convert into %... eg 4/9 = 45%
Invert that to find your Distrust Factor
so 45% –100 = 55% distrust
Dimension 1:Relationship with my manager
Dimension 2:Relationship with my staff
Dimension 3:Relationship with my colleagues

The Change Equation© Imaginist 2009 9/7/2010
Measuring Trust
The higher the levels of distrust, the more time and effort the project will require and the higher the cost, so add at least 55% to planned time and cost
55%
Time & Cost
Distrust
100%
People trust each other, relationships are good = Speedy change = Low cost = SUCCESS
Levels of trust are poor, relationships difficult = Slow or no change= Costs go up = FAILURE
0%
Time & Cost
Distrust
100%
People trust each other, relationships are good = Speedy change = Low cost = SUCCESS
People trust each other, relationships are good = Speedy change = Low cost = SUCCESS
Levels of trust are poor, relationships difficult = Slow or no change= Costs go up = FAILURE
0%
HighLow

The Change Equation© Imaginist 2009 9/7/2010
Calculating the Impact
This is where we calculate the potential impact of these indicators on the business case
We consider the status of each of the elements identified in the assessment and calculate the impact on costs or benefits, or both
This gives us an overall impact on the project’s bottom line
That’s the language senior managers understand!
- %Total potential impact on benefits
+ %Total potential impact on project timescales/costs
Other factors impact estimated at:
IT Solution9
Relationship with suppliers8
OTHER FACTORS
Delivery of Project Impact estimated at:
Benefits Realisation7
Distrust factor6
Visibility of process5
DELIVERY OF PROJECT
Project Impact estimated at:
Complexity of project4
Clarity of objectives3
PROJECT
Capability Impact estimated at:
Capability Maturity2
Management Culture1
ORGANISATION
Benefits-%
Time/Cost +%
Potential ImpactStatusComponent

The Change Equation© Imaginist 2009 9/7/2010
Deliverables: Action Plan & Route Map
Organisation
Component Implication Action required
Management Culture
The lack of information-sharing, alignment and empowerment will jeopardise the success of the project. At the very least it will mean poor take-up and a lower than planned level of benefits.
A programme of interaction and dialogue across the organisation is urgently needed to improve the management culture. This needs to include increasing trust, see below.
ProcessCapability
The organisation’s process capability is poor. This means that any projects which seek to standardise and improve processes to achieve greater efficiency will be very difficult to achieve.
Consider carrying out a programme to raise the levels of process capability ahead of implementing the project or using the project itself to inject the necessary disciplines. In this case it is crucial for the Board to make compliance to the new processes mandatory.
We develop an Action Plan to overcome the barriers, mitigate the risks and help clients plan for success

The Change Equation© Imaginist 2009 9/7/2010
Using the Culture Evolution model, we develop a Route-Map to improve the organisation’s capability for change
We ask two questions:
• If you are here now, where do you need to be?
• What will happen if you don’t change?
The first question identifies what needs to change
The second gives you the ammunition you might need to defend the change – it describes the future if you stay where you are
Structuralist2
3Dialectic
Structuralist2
3Dialectic
The more mature the management culture, the better the organisation will adapt and respond to change
Deliverables: Action Plan & Route Map

The Change Equation© Imaginist 2009 9/7/2010
To summarise:
Projects fail when the complexity of the project exceeds the capability of the organisation to cope
Complexity is exponential and is typically underestimated Conventional change management interventions which attempt
to design and control the outcomes can cause a change project to fail
Capability barriers (comprising both organisational culture and process management weaknesses) - the focus of ‘change management’ - can be assessed
A ‘gap analysis’ will predict whether a project is likely to fail and what to do about it
But the barriers and risks cannot normally be overcome within the implementation lifecycle of a project – you have to start earlier and continue after the completion of the project

The Change Equation© Imaginist 2009 9/7/2010
The Change Equation is about changing mindsets
Is your organisation underestimating the complexity of its change project/s?
Does it have the capability to cope with the changes? Are you investing in change management early enough? What more do you need to do to ensure that your change
project/s will succeed?
V.HighV.HighV.High
V.HighV.HighHigh
V.HighHighHigh
HighHighHigh
HighHighHigh
HighHighMedMedMed
MedMedMedLow
MedLowLow
LowLow
5432Level 1
9. Pragmatic/Empowered
8. Systemist
7. Imaginist
6. Empiricist
5. Pragmatic/ Aligned
4. Aligned
3. Dialectic
2. Structuralist
1. Pragmatic/ Anarchic
Management Culture
Business Process Capability
V.HighV.HighV.High
V.HighV.HighHigh
V.HighHighHigh
HighHighHigh
HighHighHigh
HighHighMedMedMed
MedMedMedLow
MedLowLow
LowLow
5432Level 1
9. Pragmatic/Empowered
8. Systemist
7. Imaginist
6. Empiricist
5. Pragmatic/ Aligned
4. Aligned
3. Dialectic
2. Structuralist
1. Pragmatic/ Anarchic
Management Culture
9. Pragmatic/Empowered
8. Systemist
7. Imaginist
6. Empiricist
5. Pragmatic/ Aligned
4. Aligned
3. Dialectic
2. Structuralist
1. Pragmatic/ Anarchic
Management Culture
Business Process Capability
9 Pragmatist/Empowered9
8SystemistImaginist
7
6Empiricist
5
3Dialectic
INTERNALFOCUS
(Individual)
EXTERNALFOCUS
(Organisation)
Pragmatist1
3Rationalist
4Aligned
Structuralist2
5 Pragmatist/Aligned
9 Pragmatist/Empowered9
8SystemistImaginist
7
6Empiricist
5
3Dialectic
INTERNALFOCUS
(Individual)
EXTERNALFOCUS
(Organisation)
Pragmatist1
3Rationalist
4Aligned
Structuralist2
5 Pragmatist/Aligned
9 Pragmatist/Empowered9
8SystemistImaginist
7
6Empiricist
5
3Dialectic
INTERNALFOCUS
(Individual)
EXTERNALFOCUS
(Organisation)
Pragmatist1
3Rationalist
4Aligned
Structuralist2
5 Pragmatist/Aligned
9999
8SystemistImaginist
7Imaginist
7
6Empiricist
6Empiricist
6Empiricist
55555
3Dialectic
3Dialectic
INTERNALFOCUS
(Individual)
INTERNALFOCUS
(Individual)
INTERNALFOCUS
(Individual)
EXTERNALFOCUS
(Organisation)
EXTERNALFOCUS
(Organisation)
EXTERNALFOCUS
(Organisation)
Pragmatist1Pragmatist1
3Rationalist
3Rationalist
4Aligned
Structuralist2
Structuralist2
StructuralistStructuralist2
5 Pragmatist/Aligned
1.InitialAd hoc process
Chaotic
2.RepeatableStable process
Controlled environmentBasic
management control
3.DefinedStandard process
Consistent ExecutionProcess
definition
4.ManagedMeasured process
Quality and Productive Improvement
Process measurement
5.OptimisedEffective process
Continuing ImprovementProcess control
1.InitialAd hoc process
Chaotic
2.RepeatableStable process
Controlled environmentBasic
management control
3.DefinedStandard process
Consistent ExecutionProcess
definition
4.ManagedMeasured process
Quality and Productive Improvement
Process measurement
5.OptimisedEffective process
Continuing ImprovementProcess control
1.InitialAd hoc process
Chaotic1.InitialAd hoc process
Chaotic
2.RepeatableStable process
Controlled environmentBasic
management control
2.RepeatableStable process
Controlled environmentBasic
management control
3.DefinedStandard process
Consistent ExecutionProcess
definition
3.DefinedStandard process
Consistent ExecutionProcess
definition
4.ManagedMeasured process
Quality and Productive Improvement
Process measurement
4.ManagedMeasured process
Quality and Productive Improvement
Process measurement
5.OptimisedEffective process
Continuing ImprovementProcess control
5.OptimisedEffective process
Continuing ImprovementProcess control
75 4803600
10800
32400
72000
05000
1000015000
2000025000
3000035000
4000045000
5000055000
6000065000
7000075000
80000
1 2 3 4 5 6
Simple project
Not simple -needs some
project management
A complex project –needs an
experienced project
manager
Beyond this point your project is too complex –
break it down into separate projects
and employ a programme
manager
75 4803600
10800
32400
72000
05000
1000015000
2000025000
3000035000
4000045000
5000055000
6000065000
7000075000
80000
1 2 3 4 5 6
Simple projectSimple projectSimple project
Not simple -needs some
project management
Not simple -needs some
project management
A complex project –needs an
experienced project
manager
A complex project –needs an
experienced project
manager
Beyond this point your project is too complex –
break it down into separate projects
and employ a programme
manager
Beyond this point your project is too complex –
break it down into separate projects
and employ a programme
manager
- %Total potential impact on benefits
+ %Total potential impact on project timescales/costs
Other factors impact estimated at:
IT Solution9
Relationship with suppliers8
OTHER FACTORS
Delivery of Project Impact estimated at:
Benefits Realisation7
Distrust factor6
Visibility of process5
DELIVERY OF PROJECT
Project Impact estimated at:
Complexity of project4
Clarity of objectives3
PROJECT
Capability Impact estimated at:
Capability Maturity2
Management Culture1
ORGANISATION
Benefits-%
Time/Cost +%
Potential ImpactStatusComponent
- %Total potential impact on benefits
+ %Total potential impact on project timescales/costs
Other factors impact estimated at:
IT Solution9
Relationship with suppliers8
OTHER FACTORS
Delivery of Project Impact estimated at:
Benefits Realisation7
Distrust factor6
Visibility of process5
DELIVERY OF PROJECT
Project Impact estimated at:
Complexity of project4
Clarity of objectives3
PROJECT
Capability Impact estimated at:
Capability Maturity2
Management Culture1
ORGANISATION
Benefits-%
Time/Cost +%
Potential ImpactStatusComponent
Time & Cost
Distrust
(Trust % - 100)
People trust each other, relationships are good = Speedy change = Low cost = SUCCESS Levels of trust are poor, relationships
difficult = Slow or no change = Costs go up = FAILURE
Time & Cost
Distrust
(Trust % - 100)
People trust each other, relationships are good = Speedy change = Low cost = SUCCESS Levels of trust are poor, relationships
difficult = Slow or no change = Costs go up = FAILURE
Possible OutcomesAccountability?
Plan in place?
No
No
Yes
Yes
This project will not achieve its savings objectivesNo
Without formal framework, local managers will not be held accountable in practice – put one in place
Yes
Make local managers accountable for adopting the new processes and redeploying released resources to drive improved performance, or the benefits will not be realised
No
This project has a good chance of achieving the planned benefits
Yes
Possible OutcomesAccountability?
Plan in place?
No
No
Yes
Yes
This project will not achieve its savings objectivesNo
Without formal framework, local managers will not be held accountable in practice – put one in place
Yes
Make local managers accountable for adopting the new processes and redeploying released resources to drive improved performance, or the benefits will not be realised
No
This project has a good chance of achieving the planned benefits
Yes
Complexity
Too ComplexComplex
Not SimpleSimple
Low
Med
High
Capability
Complexity
Too ComplexComplex
Not SimpleSimple
Low
Med
High
Capability

The Change Equation© Imaginist 2009 9/7/2010
Any questions?
Peter Duschinsky
‘The Change Equation’
is available from Amazon.co.uk