Introducing Simple Harmonic Motion A Teaching Module in a ...
17
Paper ID #33237 Introducing Simple Harmonic Motion – A Teaching Module in a First-Year Engineering Course Dr. Christopher Horne, North Carolina Agricultural and Technical State University Since 2011, Dr. Horne has been a Lecturer at NC AandT State University and East Carolina University. He currently teaches freshman a course in problem solving using MATLAB. He combines twenty years’ experience in management and engineering with a passion to help students learn STEM-related material. He is a licensed professional engineer and holds masters and Ph.D. from North Carolina State University and North Carolina AandT State University, respectively. His current research is in novel pedagogical methods for enhancing student learning of math and engineering. He also does research in non-linear fiber optics and electromagnetics. Dr. Alexandra Kurepa is professor of mathematics at NC AandT State University where her research focuses on the effects of active learning on students’ perception of mathematics through their engagement, satisfaction, and perceived performance in the class. Dr. Alexandra Kurepa, North Carolina Agricultural and Technical State University c American Society for Engineering Education, 2021
Transcript of Introducing Simple Harmonic Motion A Teaching Module in a ...

Paper ID #33237
Introducing Simple Harmonic Motion – A Teaching Module in a First-YearEngineering Course
Dr. Christopher Horne, North Carolina Agricultural and Technical State University
Since 2011, Dr. Horne has been a Lecturer at NC AandT State University and East Carolina University.He currently teaches freshman a course in problem solving using MATLAB. He combines twenty years’experience in management and engineering with a passion to help students learn STEM-related material.He is a licensed professional engineer and holds masters and Ph.D. from North Carolina State Universityand North Carolina AandT State University, respectively. His current research is in novel pedagogicalmethods for enhancing student learning of math and engineering. He also does research in non-linearfiber optics and electromagnetics.
Dr. Alexandra Kurepa is professor of mathematics at NC AandT State University where her researchfocuses on the effects of active learning on students’ perception of mathematics through their engagement,satisfaction, and perceived performance in the class.
Dr. Alexandra Kurepa, North Carolina Agricultural and Technical State University
c©American Society for Engineering Education, 2021

Introducing Simple Harmonic Motion – A Teaching Module in a
First Year Engineering Course
Abstract
This work-in-progress describes a unique teaching method used for explaining Simple Harmonic Motion (SHM) to engineering and mathematics students in the COVID-19 learning environment. First Year Engineering Student (FYES) retention and overall success is predicated on their recent academic success in high school. Too often a struggling first semester student has limited knowledge of how a mathematical equation relates to a physical concept, for example, SHM. Student-centered active learning, in which students are asked to “do” something beyond listening and note taking, as this paper suggests, should be used in STEM courses, especially during the COVID-19 learning environment.
A freshman engineering student typically takes Algebra/Trigonometry, Pre-Calculus or Calculus where functions are presented. They often do not make the ‘link’ between an equation and the physical system. The teaching method used for explaining SHM uses the sine wave function, MATLAB, a smartphone as well as the new experiment along with lessons learned. Through practical lecture material on wave motion and hands-on experimentation, during the COVID-19 learning environment, freshmen student learning is enhanced. Survey results from a freshmen engineering course are compared against upperclassmen in mathematics courses and the overall response is favorable.
Course modules were taught in the Problem Solving for Engineers course for freshman and in the mathematics department two courses: Applied Mathematics and Partial Differential Equations for upperclassmen in Fall of 2020. The Problem Solving for Engineers course teaches students how to apply mathematics to the real-world including problems encountered in everyday life. Most of the students are considered underrepresented.
Students were surveyed on their understanding of SHM including the frequency, period and the meaning of a sine wave function. SHM was conceptualized in terms of a mass-spring system using a Smartphone to measure displacement and acceleration. Survey results indicate that 'hands-on' exercises are necessary to increase the learning effectiveness of freshmen and understanding of SHM. Student feedback on the hands-on experiment was positive among 94.5 % of the students. The authors would like to present the paper as a poster.
Introduction
Simple harmonic motion (SHM) follows logically from linear motion and circular motion. However fundamental it may be to engineering students, SHM is one of the more demanding topics and
often misunderstood. Researchers found that passive instruction by talented teachers imparted little
conceptual understanding of Newtonian mechanics [1]. Good physical insight can lead to a deeper
understanding of displacement and oscillation, which is a pervasive phenomenon in STEM. Each
course module has two parts: a) three virtual lecture classes with PowerPoint presentation on
trigonometry, wave motion and MATLAB coding and b) a hands-on lab exercise using a mass-
spring system and the phone app Phyphox™ to record one-dimensional wave motion quantities.
The freshman class was taught virtually while the two mathematics classes were conducted face-
to-face by the co-author mathematics professor.
One-hundred and nine (109) students were included for the learning study of SHM. Freshmen
learning outcomes, such as interpretation of the displacement equation, are compared to
upperclassmen. Forty-eight freshmen, 31 sophomores and 14 junior students in the Problem Solving
for Engineers were evaluated for their understanding of SHM. Nine Applied Math students, as well
as seven upperclassmen in Partial Differential Equations, were also surveyed on their understanding
on simple harmonic motion.
The online pre-survey on wave motion is presented along with a manual survey from the SHM
hands-on exercise. Targeted assessments explore whether the approach of the smartphone motion
experiment might improve learning and how students think about wave motion. Students were
asked to answer questions after the smartphone motion experiment. The questions represent
concepts taught in class and prompt the students for written explanation. The student’s responses
indicate the hands-on SHM experiment is vital to learning during the COVID-19 pandemic.
Teaching Methods
With little warning or training, STEM teachers across the country were expected to transition from
in-person to distance learning within a matter of days in response to the COVID-19 pandemic. What
is effective teaching to engage students when they aren’t in class? How can STEM activities remain
fun and interactive in the COVID-19 academic environment? Whether in-person, hybrid, or remote
learning environment, STEM teachers have likely grappled with one or more of these questions as
they entered the Fall 2020 school year.
Researchers are overwhelmingly convinced that students who engage in active learning are more
motivated and focused than students who only receive passive information (vis-à-vis lectures).
Moreover, new research suggests active visual learning improves student understanding of STEM
concepts [2].
Four course modules were taught in the Problem Solving course for FYES, in the Fall of 2020. The
course modules consisted of lecture classes with PowerPoint presentations on trigonometry, wave
motion, MATLAB coding and simple harmonic motion. Homework was assigned for finding the
height of a light pole using trigonometry and ‘SOH-CAH-TOA’. The sine function and angular
frequency were derived from the unit circle.
This teaching and learning study on simple harmonic motion is also based on demonstrations and
hands-on experiments in a freshmen engineering course (Problem Solving with MATLAB). The
two mathematics courses for upperclassmen: Applied Math as well as Partial Differential Equations
were taught in the traditional manner face to face.
The importance of the sine wave
A few researchers have presented technology and surveys to aid students in their understanding of
the application of trigonometry [3]. As most high school students are presented the unit circle, all
of our FYES did not understand that there is a ‘mapping’ between the unit circle and the sine
function. Recall, the sine and cosine functions relate real number values to the x– and y- coordinates
of a point on the unit circle. The sine is the ratio of opposite (‘y value’) to hypotenuse of a triangle
formed inside a circle that varies like the movement on a unit circle. Consequently, a plot of the

sine or cosine function is readily shown on a virtual whiteboard. When the students were shown an
animation video several students immediately affirmed the relationship of the unit circle x and y
values to the sine function curve.
Circles have sine values but the student’s understanding of ‘SOH-CAH-TOA’ and the sine function were either ‘mixed together’ or confusing. Seeing the sine inside a circle is like pulling an egg out of an omelette. Fig. 1 displays a unit circle with the ‘y-value’ along the perimeter tied to sine values on the sine wave. Additionally, the input, ‘ϴ’, in the sine function was described as how far along (radians or degrees) the wave is in the cycle while the output was described as the ‘y values’. The concept of angular frequency is briefly presented. As a change in ϴ over some time, t, has the units of radians per second, we write Δϴ/Δt = ω. As the maximum value of ϴ is 2π radians, we write ω = 2πF, where F is the frequency or cycles per second. (Units of F are 1/sec). Prior to the introduction of the sine function, students were also given the problem of calculating the height of a light pole. The only information given was the length of a shadow created by the sun. The students were asked to imagine themselves standing a shadow’s length from the pole and raising their arm at a specific angle. They could use the sine, cosine or tangent ratios to calculate the pole height.
Fig. 1: Unit circle mapping to a sine wave The sine function is an important math relationship that covers a wide variety of research, design and practical engineering activities. Initial designs by engineering students are almost always done on paper using a mathematical representation of the problem. It is very common for trigonometry to be involved the first year. In sophomore courses, the sine function is employed to describe alternating waveforms in electrical generators where a sine wave is produced when a coil of wire is rotated within a magnetic field. Other courses like dynamics are designed and analyzed using trigonometric functions. Even earthquake wave motion can be described with the sine function. It is this sine function that became the basis for introducing the sine function in MATLAB programming to create a melodious sound. The sine function was also introduced after the demonstration of a laboratory-grade mass spring system while measuring SHM using a Vernier™ Motion Detector.
MATLAB and Wave Motion
Engineering educators have previously presented algorithmic tools like MATLAB to solve for sinusoidal-based models for projectile motion [4]. Some researchers have acknowledged the retention of FYES by presenting hands-on experiments and using MATLAB first to plot functions including sinusoids [5].

Often there is a disconnect between what freshmen learn in pre-calculus and physical concepts. The oscillator equation in time describing oscillation and wave motion of a mass on a spring, is typically taught the sophomore year. This dynamic model is extended to partial derivatives in space, so as to come up with the wave equation, which describes oscillations both in time and space. One educator uses MATLAB to model ordinary differential equations describing the mass-spring system [6]. Thus, the use of the one-dimensional sine function in MATLAB, can offer visual experiments, so students appreciate wave motion in time from motion on the unit circle. Consequently, our teaching focuses on using Matlab to visualize the pertinent parameters of the sine wave motion.
MATLAB Programming
The one-dimensional sine function in MATLAB can offer visual experimentation so students
appreciate wave motion. In a previous study [7], the authors demonstrated the effective learning
tool of building a sound wave using common instruments and then requiring students to program
MATLAB to create a melody or song. The previous study revealed 82 percent of freshmen
improved their understanding of the sine function and its properties. That method increased the
students’ awareness and appreciation for one-dimensional wave motion. Therefore, in this study
the authors present the sine wave function as a MATLAB command requiring the students to
experiment with the variables of time and frequency. To minimize this confusion, in the ZOOM
session, the author displayed a 6-foot long spring, shaking it, which looked like a sine wave. The
author then identified the amplitude or ‘strength’ of the wave and the distance between peaks or
crests. These exercises and a MATLAB homework assignment provided a basis for the end of
semester SHM experiment. Students were presented the sine function and lectures on MATLAB
variables, arrays, vectors and plot commands. Fig. 2 displays the MATLAB code required by the
students to generate sine waves.
% define each musical note t = 0:0.01:1 % create 101 points in time up to 1 second total time a=sin(2*pi*440*t); % sine wave function of frequency 440 cycles per second b=sin(2*pi*494*t); % sine wave function of frequency 494 cycles per second % assembling the notes into a melody song = [a,a,b,b,a,a,b,b]; % creates an array of notes (row vector) plot (t,a,t,b) %plots both sine waves on same graph
sound (song) % sends the song vector to the speaker and plays the sound at a rate of
8192 cycles per second
Fig. 2: MATLAB script file used to generate sine waves of different frequencies and sounds
Motion Detection and SHM
When a mass is hung vertically from a spring, the spring stretches. If the mass is pulled, the force
on the mass due to the spring is proportional to the amount the spring is stretched. The position of
a mass oscillating on a spring can be described by the following equation
𝑦 = 𝐴 sin( 𝜔 𝑡)
where ω is the angular frequency and t is the instantaneous time for the amount of displacement, y.

The units of ω are radians per second since on the unit circle, its maximum value is 2π radians and
its rate of movement is called the frequency, F. Thus, ω = 2πF. The amplitude, A, determines the
size of the oscillations, i.e. the maximum displacement from the equilibrium position. The phase
constant is not included to simplify the explanation. The concept of angular frequency and
understanding of the above equation, by the students, is determined by the end of course survey.
In the online freshman course, during a ZOOM session, near the beginning of the semester, a
Vernier™ Motion Detector connected to a microprocessor, recorded SHM. The
microprocessor/computer displayed a plot of displacement versus time. The motion detector emits
ultrasonic waves which measures distance by determining the length of time it takes for the reflected
waves to return to the detector. This demonstration was made to the freshman engineering students
virtually, that is in a real-time ZOOM session. Since each student cannot afford a motion detector,
the purpose of this teaching method was visual appreciation of and a basis for analytical study of
SHM. Fig. 3 below shows the set-up for the experiment presented in the ZOOM session. The
freshmen understanding of these concepts are analyzed in the surveys performed in this study.
Fig. 3: Vernier™ Motion Detector connected to a microprocessor recording SHM during virtual
presentation in online ZOOM classroom.
Classroom Demonstrations
Design of SHM Experiment
The study of simple harmonic motion is a natural extension of what most students already encounter
in everyday life. Students may see a child swinging on a playground, jumping on a trampoline or
a ball bouncing up and down. Understanding the relationship between wave motion and the sine
function is an important engineering concept for students to grasp. And one way to demonstrate this
relationship is by using a mass-spring system to conduct simple experiments.
We present a unique hands-on experiment for the COVID-19 learning environment to provide
freshmen engineering students with opportunities for meaningful discovery of wave motion,
equations and SHM. Activities in this experiment include: 1) Student assembly of rubber bands and
connection to a smartphone, 2) measurement of the system using a ruler, 3) student analysis of plots
of wave motion displayed by an app that uses the sensors in a smartphone and 4) student synthesis
of the equation of the displacement or SHM of the smartphone.
The authors mailed over 110 experimental motion kits to the freshmen class while upperclassmen
received 16 kits face-to-face in their classroom. The smartphone motion kit included 4 rubber bands,
a tack, and a 12 inch ruler. The kit included 3 pages of instructions written in a simple format with
pictures. The experiment can be conducted in less than 15 minutes. The freshman worked alone
while the upperclassmen in the math courses were able to see fellow students performing the
experiment. Experiments performed by students alone is considered active learning and the students
received extra credit if the answer sheet was submitted complete.
The purpose of the experiment is for students:
To gain practical experience with rubber band and spring motion
To analyze a mathematical plot of wave motion as result of building the mass-spring system
To synthesis and understand better the one-dimensional equation of motion.
The Cell Phone and SHM
Cell phones are an important part of college life and culture. Cell phones are being used in every possible campus location and especially during COVID-19 classroom settings. As cell phone technology continues its rapid development, the device appears capable of contributing to student learning and improved academic performance [8]. Researchers in the last two decades have speculated on both the positive and negative outcomes of the students’ continuous interface with technology. Nevertheless, during the COVID-19 learning environment, the authors believe hands-on experimentation is more important in the study and learning of basic engineering concepts like SHM. Researchers showed active learning results in a clearer understanding of concepts and increased student enthusiasm [9]. Therefore, visual tools like the Smartphone can be used to increase learning. Smartphones have an accelerometer. Acceleration is the measurement of the change in velocity divided by time. Typically, the sensor in a smartphone is a very tiny mechanical system (known as MEMS, "microelectromechanical system"), that measures the gravitational acceleration as a force acting on a sample mass. The piezoelectric effect is the most common form of accelerometer and uses microscopic crystal structures that become stressed due to accelerative forces. These crystals create a voltage from the stress, and the accelerometer interprets the voltage to determine velocity.
We propose an easy experiment that allows students to determine not only acceleration but key engineering parameters of period, frequency, and the equation for the phone’s displacement through a simple measurement using a smartphone. The concept of using the accelerometer sensor in mobile phones for physics experiments has become a well-known option for STEM teachers [10]. Since

these devices are readily available to most students and teachers, experiments can be set up at low cost while generating interest and motivation for learning. The smartphone app called Phyphox™ is used to record the accelerometer readings and report the earth's acceleration of 9.81 m/s² while the phone is resting (which is what we call "Acceleration with g"). In contrast, the physical acceleration is zero when the phone is resting (or moving at a constant speed), so there is a virtual sensor that subtracts the constant acceleration (usually by taking into account the data from other sensors as well). This is what we call "Acceleration (without g)" and it will actually report an acceleration of zero while the phone is not accelerated. Prior to the smartphone motion demonstration, the author performed SHM with a motion detector, to the freshmen.
The smartphone is attached to one end of a rubber band chain while the other end of the rubber
band chain is supported by a hand or a wooden door frame. The authors demonstrated SHM by
pulling the smartphone down vertically and observing the sine wave on the phone’s display screen.
Fig. 4 shows the phone secured by rubber band chain and a close up of Phyphox™ measurements.
(a) (b) (c)
Fig. 4: Smartphone experiment for measuring simple harmonic motion (a) supported by door frame
(b) phone secured by rubber band chain and (c) close up of Phyphox™ measurements,
The students were instructed to support their smartphones vertically from a chain of four rubber bands. The rubber band on one end of the chain was to be looped around the smartphone so the phone was in the upright position. The other end of the rubber band chain could be supported by a tack pressed into a wooden door frame. Alternatively, the authors demonstrated the experiment with one hand holding the chain while the other hand managed the smartphone app called Phyphox. Specifically, the following instructions were provided:

Step 1) Download the app called Phyphox to your cell phone. Phyphox is available for free on Android and iOS. You can directly install it from Google Play (Android) or the App Store (iOS) at https://phyphox.org/download.
Step 2) Open the “Acceleration (without g)” tool in Phyphox. The push arrow (triangle circled)
button is on the top menu of Phyphox. This button should only be pushed when you are ready to record the movement data.
Step 3) Stretch one of the end rubber bands around your phone as shown in the photo. Support
the rubber band chain and phone from a support. The kit sent to you includes a tack to push into a door frame. You can use your arm/hand to support the phone. The phone should not hit anything or move sideways. Do not let the rubber band touch electrical wires or a hot light.
Step 4) With the phone supported, and the ‘Acceleration (without g)’ app open, pull the
phone down, which stretches the rubber band chain. The top of the phone should be pulled down at least 10 inches from its resting position (see red arrow). Do not pull more than 14 inches. Using a ruler, record the distance the top of the phone changes (from resting to pull down) in units of inches.
Step 5) Still holding the phone pulled down 10 inches (or more), then with your second
finger, push the arrow (triangle) button on the top menu of Phyphox. Now release the phone. The phone should move up and down at least 5-7 times for about 6-10 seconds.
Step 6) When the phone returns to, or near, its resting position, hit the arrow button again
to stop the recording. Observe the graph of linear acceleration y as a function of time. Do not copy the photo to the left. The peak (max) acceleration in the y-direction on your phone is_____________ meters per second-squared (m/s^2)
Step 7) Press the middle graph (linear acceleration y). Then use the ‘Pick data’ function to
directly measure the acceleration and time for each trough or peak as shown in the figure. Measure at least the first four peaks of the middle graph. The period T of an oscillation (up and down movement) is defined as time of travel of the phone from peak to peak. The magnitude of the acceleration is ________________ in time. Now from this data, calculate the period of the movement is; it is: ______________ seconds.
The students were asked to write down a paragraph of their observations and answer 8 multiple
choice questions.
Survey Results
Initial Survey on Wave Motion
At the beginning of the fall semester, freshman engineering students and upperclassmen in an
applied math course were surveyed for their understanding of wave motion by an online research
tool called Qualtrics®. The questions asked in the survey included: “When I think of a wave, I
think of…..” and the answer choices were: a) the ocean, b) water flowing in a stream, c) one ampere
is the number of coulombs of charge per second, or d) a graph of s sine wave (shown). The next
question is “If you were to shake the end of a stretched spring up and down 10 times per second,
what would be the frequency and the period of the sinusoidal wave produced on the spring? The
other questions and student answers are shown in Tables 1 and 2 below.

Angular frequency was understood by only 16% of freshman and sophomores in Question 6 of the
smartphone experimental survey.
Table 1: Beginning of semester survey responses by freshman engineering students (F/E)1 and
upperclassmen in an applied math course (Jr/Sr, MA)
(1): 76 freshman responded (10 students were actually classified as sophomores)
Question 1 the oceanwater flowing in
a stream
one ampere is
the number of
coulombs of
charge per
second
a graph of a
sine wave
(shown)
When I think of a
wave I think of
35 (F, E);
9 (Jr/S, MA)
2 (F, E);
0 (Jr./S, MA)
2 (F, E);
0 (Jr./S, MA)
47 (F,E);
7 (Jr/S,MA)
Question 2
10 cycles per
second and 1/10
seconds
10 cycles per
second and 10
seconds
1 cycle in 10
seconds
If you were to
shake the end of a
stretched spring up
and down 10 times
per second, what
would be the
frequency and the
period of the
sinusoidal wave
produced on the
spring?
50 (F, E);
11 (Jr/S,MA)
28 (F, E);
4 (Jr./S,MA)
8 (F, E);
1 (MA)
Question 3
a mass
connected to a
thermometer
a mass-ruler
metronome
a mass's
displacement
being measured
Newton's Law
of gravityweighing a spring
This is a picture
of…(a mass is
shown connected to
a spring)
1(F,E); 0
(Jr/S,MA)
17 (F,E); 3
(Jr./S,MA)
42 (F,E); 9
(Jr./S,MA)
10 (F,E); 0
(Jr/S,MA)
16 (F,E); 4
(Jr/S,MA)

Table 2: Beginning of semester survey responses by freshman engineering students (F/E)1 and
upperclassmen in an applied math course (Jr/Sr, MA)
(1): 76 freshman responded (10 students were actually classified as sophomores)
Question 4
a mass
connected to a
thermometer
a mass-ruler
metronome
a mass's
displacement
being measured
Newton's Law
of gravityweighing a spring
This is a picture
of…(a mass is
shown connected to
a spring)
1(F, E);
0 (Jr/S,MA)
17 (F, E);
3 (Jr./S,MA)
42 (F, E);
9 (Jr./S,MA)
10 (F, E);
0 (Jr/S,MA)
16 (F, E);
4 (Jr/S,MA)
Question 5
the oscillatory
(harmonic)
motion of the
mass by a
position vs. time
plot
A sine wave of
2 cycles
the graph has
the shape of the
function y=2(t)
This is a picture
of…(a displacement
versus time sine
wave is shown)
56(F, E);
13 (Jr/S,MA)
28 (F, E);
3 (Jr./S,MA)
42 (F, E);
2 (Jr./S,MA)
Question 6
y = Asin(ωt)
where A is the
radius of a circle
and ω is the
period
y = Asin(ωt)
where A is
strength or
amplitude of the
sine wave and ω
is the period
y = Asin(ωt)
where A is
direction of the
sine wave and ω
is angular
frequency
y = Asin(ωt)
where A is the
amplitude of
the circle and
ω is the
angular
frequency
An object like a
spring on a mass,
experiencing simple
harmonic motion, is
traveling in one
dimension, and its
one-dimensional
motion is given by
an equation of the
form
13 (F, E);
0 (Jr/S,MA)
38 (F, E);
9 (Jr./S,MA)
21 (F, E);
2 (Jr./S,MA)
14 (F, E);
5 (Jr/S,MA)
Question 7African-
AmericanHispanic/Latino Asian White/Other
My race/ethnicity is 87 4 3 9

Final Course Survey on Smartphone and SHM
In the final two weeks of the Fall 2020 semester, the freshman engineering students and
upperclassmen in the two math courses were asked to complete a survey which was part of the
SHM experiment kit. The students were asked to write down a paragraph of their observations.
Some of the written responses are shown below. The 8 multiple choice questions are shown on the
next page.
Freshman responses to observations of the smartphone SHM experiment
EE major wrote: “This experiment gave an excellent visual of the ways that motion, mass,
elasticity relate to each other. This experiment gave me a new appreciation for the elasticity
of rubber bands.”
CPE major wrote: “Surprised the phone went up and down and I could record real data with
my phone.”
CPE major wrote: “I learned something cool – there is a quick ‘cool down’ speed after each
cycle and each bounce decreased exponentially.”
EE major wrote: “As the phone moves up and down it perfectly accounts for the peaks in
the Phyphox App.”
ME major wrote: “Motion can be seen as a sine wave. I never thought of motion as a sine
wave.”
CPE major wrote: “After several attempts, I was successful in recording the data and
answering the questions; it was helpful the professor sent a ruler because I did not own one.”
CPE major wrote: “It was interesting the wave got smaller and smaller as time went on.”
EE major wrote: “I will be using this App in the future; enjoyed the physics of this
experiment.”
CPE major wrote: “I did not know our phones had a lot more to offer than just texting and
calling.”
CPE major wrote: “A wave can be formed by motion.”
CPE major wrote: “Learned rate of change differed with pulling distance.”
CPE major wrote: “Learned the period is the time between the two peaks in the phone’s
plot.”
CPE major wrote: “The push pin was very strong so I could pull the phone with no problems
EE major wrote: “The data recorded by the App was extremely consistent; I learned what
harmonic motion is and the power of my phone’s computer.”
EE major wrote: “I learned the meaning of period because of this experiment.”
CPE major wrote: “I was a little confused but it was interesting using the same concepts
that I use in math class.”
Undeclared major: I learned acceleration is like a vector with magnitude and direction.”
CPE major (female, Latin American) wrote: “I could not remember the sine function but
thanks to this experiment I finally understood the difference between magnitude and
period.”

Upperclassmen/engineering - responses to observations of the smartphone SHM experiment
Jr. ME major wrote: “I learned how to calculate the frequency and movement and how to
do it accurately.”
So. CPE major wrote: “I did not realize prior to this experiment that period, T, could be
found without using frequency and only using the sine wave representation.”
So. Bio Eng major wrote: “I interpreted some of the questions with physics in mind so my
calculations may be wrong.”
So. CPE major wrote: “The peak of the wave is equal to the constant acceleration due to
gravity.”
So. CPE major wrote: “I learned what the term ‘trough’ of a wave is.”
So. CPE major wrote: “The peak value tends to reduce over time.”
Jr. EE major wrote: “The period of the bounces stays about the same even though the
distance travelled changes as the phone approaches equilibrium.”
So. CPE major wrote: “I learned wave motion produces a sinusoidal wave, not a linear
wave.”
So. CPE major wrote: “Learned ‘sine’ is short for sinusoidal.”
Jr. CPE major wrote: “Increasing displacement, increases acceleration.”
Jr. CPE major wrote: “The linear graph from a linear fall made it easier to understand.”
So. EE major wrote: “Experiment shows how the world around us works in different ways.”
Jr. CPE major wrote: “The period of the wave is calculated from adding the magnitude of
the peaks.”
Jr. Bio Eng wrote: “I learned waves are seen in motion, sound and electricity.”
Jr. Physics/Eng wrote: “Direction is determined by acceleration, positive or negative.”
Upperclassmen/Applied Math Course - responses to observations of the smartphone SHM
experiment
So. ME major wrote: “Sinusoidal wave where the magnitude of the wave decreased
gradually.”
Sr. Chem Eng wrote: “It bounces shorter distance over time.”
Sr. Applied Math major: “I observed the different peaks as the phone was suspended by the
rubber bands.”
Sr. Math major: “I noticed that each peak would be 1/2 than the last.”
Sr. Math major: “No matter what the distance was pulled, the waves still decreased at the
same rate.”
Sr. Math major: “I expected for the acceleration to be highest at the first point and slow
down over time.”
Sr. Bio Eng wrote: “I learned when the phone is released the waves represented how fast
the phone traveled up and down.”
Upperclassmen/Partial Differential Equations Course - responses to observations of the smartphone
SHM experiment
Sr. Indust. Eng wrote: “Did not know there were phone apps; it was interesting to use.”

Grad Student ME wrote down nine calculations he made of displacement and period based
the formula T = 2π√L/m where is the mass of the phone
Sr. Chem. Eng wrote: “I enjoyed the app and making the experiment.”
Grad Student ME wrote: “The App is good to observed acceleration.”
Sr. Applied Math major writes down additional measurements then comments: “The phone
comes down quicker than expected, possibly due to the elasticity of the rubber bands in a
chain. The velocity is depicted by the sine waves eventually die out as the phone reaches its
initial position.”
Grad Student Applied Math: “I did not realize that oscillatory movement in the y direction
has more or less the same period in between peaks.”
Sr. ME major wrote: “It was interesting to perform an experiment on something that we
use most of our time.”
Student feedback as comments on the hands-on experiment was positive among 94.5 % of the
students.
Questions to all students on the SHM hands-on experiment (responses in Table 3):
1. When you pulled the cell phone down and then released it, suppose it moved up and down
1.333 times per second, what would be the frequency and the period of the sinusoidal wave
produced on the rubber band?
a. 13.33 cycles per second and 1/3 seconds
b. 1.333 cycles per second and 0.75 seconds
c. 1.333 times for 1.333 seconds long
2. I found this experiment to be
a. Very challenging but fun
b. Easy and fun
c. Not too hard and not to easy
d. I just wanted the extra credit
3. The instructions for this experiment were
a. Easy to understand
b. Difficult to understand.
c. Mostly easy to understand
4. The graph shown on my phone is a
a. Sinusoidal wave
b. Non-linear graph
c. Linear graph
d. y = 1.00sin(6.28T)
5. The phone is a mass, experiencing simple harmonic motion and is traveling in one direction,
and its displacement (distance moved) is given by an equation
a. y = Asin(ω*T) where A is the length of the rubber band and ω is the period
b. y = Asin(2πF*T) where A is amplitude of the sine wave motion and F is the
frequency of the moving phone
c. y = Asin(2πF*T) where A is direction of the sine wave and F is the frequency of the
moving phone
d. y = Asin(2πF*T) where A is the weight of the phone and F is the frequency
6. I am a freshman b. sophomore c. Jr. or higher d. transfer student
7. My major is ____________________________
8. My race/ethnicity is a)African-American b. American Indian or Alaska Native c. Asian d.
Native Hawaiian or Other Pacific Islander e. White f. Hispanic/Latino
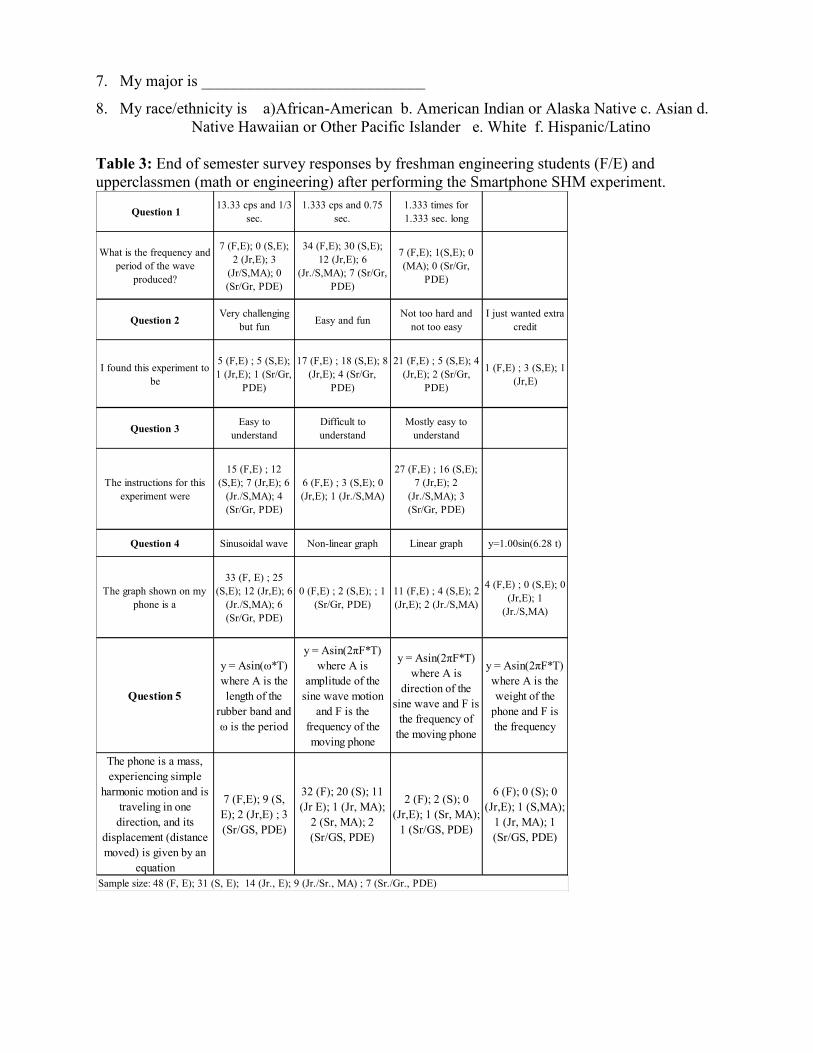
Table 3: End of semester survey responses by freshman engineering students (F/E) and
upperclassmen (math or engineering) after performing the Smartphone SHM experiment.
Question 113.33 cps and 1/3
sec.
1.333 cps and 0.75
sec.
1.333 times for
1.333 sec. long
What is the frequency and
period of the wave
produced?
7 (F,E); 0 (S,E);
2 (Jr,E); 3
(Jr/S,MA); 0
(Sr/Gr, PDE)
34 (F,E); 30 (S,E);
12 (Jr,E); 6
(Jr./S,MA); 7 (Sr/Gr,
PDE)
7 (F,E); 1(S,E); 0
(MA); 0 (Sr/Gr,
PDE)
Question 2Very challenging
but funEasy and fun
Not too hard and
not too easy
I just wanted extra
credit
I found this experiment to
be
5 (F,E) ; 5 (S,E);
1 (Jr,E); 1 (Sr/Gr,
PDE)
17 (F,E) ; 18 (S,E); 8
(Jr,E); 4 (Sr/Gr,
PDE)
21 (F,E) ; 5 (S,E); 4
(Jr,E); 2 (Sr/Gr,
PDE)
1 (F,E) ; 3 (S,E); 1
(Jr,E)
Question 3Easy to
understand
Difficult to
understand
Mostly easy to
understand
The instructions for this
experiment were
15 (F,E) ; 12
(S,E); 7 (Jr,E); 6
(Jr./S,MA); 4
(Sr/Gr, PDE)
6 (F,E) ; 3 (S,E); 0
(Jr,E); 1 (Jr./S,MA)
27 (F,E) ; 16 (S,E);
7 (Jr,E); 2
(Jr./S,MA); 3
(Sr/Gr, PDE)
Question 4 Sinusoidal wave Non-linear graph Linear graph y=1.00sin(6.28 t)
The graph shown on my
phone is a
33 (F, E) ; 25
(S,E); 12 (Jr,E); 6
(Jr./S,MA); 6
(Sr/Gr, PDE)
0 (F,E) ; 2 (S,E); ; 1
(Sr/Gr, PDE)
11 (F,E) ; 4 (S,E); 2
(Jr,E); 2 (Jr./S,MA)
4 (F,E) ; 0 (S,E); 0
(Jr,E); 1
(Jr./S,MA)
Question 5
y = Asin(ω*T)
where A is the
length of the
rubber band and
ω is the period
y = Asin(2πF*T)
where A is
amplitude of the
sine wave motion
and F is the
frequency of the
moving phone
y = Asin(2πF*T)
where A is
direction of the
sine wave and F is
the frequency of
the moving phone
y = Asin(2πF*T)
where A is the
weight of the
phone and F is
the frequency
The phone is a mass,
experiencing simple
harmonic motion and is
traveling in one
direction, and its
displacement (distance
moved) is given by an
equation
7 (F,E); 9 (S,
E); 2 (Jr,E) ; 3
(Sr/GS, PDE)
32 (F); 20 (S); 11
(Jr E); 1 (Jr, MA);
2 (Sr, MA); 2
(Sr/GS, PDE)
2 (F); 2 (S); 0
(Jr,E); 1 (Sr, MA);
1 (Sr/GS, PDE)
6 (F); 0 (S); 0
(Jr,E); 1 (S,MA);
1 (Jr, MA); 1
(Sr/GS, PDE)
Sample size: 48 (F, E); 31 (S, E); 14 (Jr., E); 9 (Jr./Sr., MA) ; 7 (Sr./Gr., PDE)

Conclusion and Lessons Learned
This study shows that students enjoy the SHM experiment with the smartphone and gain insight
into to the behavior of wave motion. Student feedback as comments on the hands-on experiment
was positive among 94.5 % of the students. The upperclassmen math students craved the group
setting in the classroom environment. This active learning technique is low-cost and readily
accessible to engineering instructors. Nevertheless, some review of the teaching methods before
the experiment are noted.
The quantity frequency was only mentioned by the students in final survey comments. Some
students did not understand how to calculate period, but understood the meaning of the
difference between peaks, in acceleration, corresponded to the time period. Period was more
common in the comments but it needs more attention since this quantity is critical for
engineering circuits and systems.
Most students do not understand the difference between linear and non-linear functions and their
graphs. Only 33 out of 48 freshmen and 25 of the 31 sophomores surveyed said the acceleration
plot on their smartphone was a sinusoidal function. Over 90% of the upperclassmen math
students said the wave represented a sine function.
Perhaps more important to engineering analysis is the varied responses to the question: “The
phone is a mass, experiencing simple harmonic motion and is traveling in one direction, and its
displacement (distance moved) is given by an equation.” The responses show the quantities in
the equation 𝑦 = 𝐴 sin( 2𝜋𝐹 ∗ 𝑡) are not well understood for wave motion.
Students in this study typically take General Physics I not until the second semester of their
freshman year. General Physics I is a calculus-based course that covers Newtonian mechanics,
heat, and thermodynamics. By teaching wave motion described here in the freshman engineering
course, the student will be more prepared for General Physics I.
Students whose family has STEM backgrounds are likely to have been exposed to aspects of the
mathematical-physical relationship described in this study. However, many of our students are
1st-generation college students not previously exposed to this material. Therefore, approaches
like this one that provide a visual and physical representation of abstract concepts are critically
important to student learning.
The authors plan to try different objects of different masses, for example, a coffee cup or a shoe
so that students can visualize changing periods.
The survey results will also be used in the Differential Equations course to better understand
effects of active learning on students’ perception of mathematics through their engagement,
satisfaction, and perceived performance in the class. To evaluate student learning more, a quiz or
test will be employed to further measure student comprehension of SHM.
Finally this technique can be used in asynchronous distant learning since it is a safe and simple
experiment that adds instructional value and enhanced learning during the COVID-19 pandemic.

References
[1] R. Hake, “Interactive-engagement versus traditional methods: A six-thousand-student
survey of mechanics test data for introductory physics courses,” American Journal of Physics, 66,
1, 64-74, 1998.
[2] R. Felder, M. Prince, R. Brent, “Active Student Engagement in Online STEM Classes:
Approaches and Recommendations, Advances in Engineering Education,
https://advances.asee.org/active-student-engagement-in-online-stem-classes-approaches-and-
recommendations/, [Accessed December 2020].
[3] Z. Zhou, L. Ni and H. Jung, “Enhancing First Year Engineering Students Trigonometry
Learning Experience,” Paper ID #13319, ASEE Annual Conference, June, 2015. Seattle, WA,
USA.
[4] J. Musto, A. Howard and R. Williams, Engineering Computations: An Introduction Using
Matlab and Excel, New York, NY USA: McGraw Hill, 2009.
[5] G. Bucks, K. Ossman, J. Kastner, F. Boerio, J. Torsella, “First-Year Engineering Courses' Effect
on Retention and Student Engagement,” Paper ID #8753, ASEE Annual Conference, June, 2014.
Indianapolis, IN, USA.
[6] A. Bower, Dynamics and Vibrations: MATLAB Tutorial, School of Engineering, Brown
University, December 2011.
[7] C. Horne, J. Kelly, “Study of Wave Motion and Teaching Methods in Engineering Problem Solving Course,” 2020 IEEE Global Engineering Education Conference (EDUCON), 279-283, April, 2020, Porto, Portugal.
[8] A. Lepp, .J Barkley, A. Karpinski, "The Relationship Between Cell Phone Use and Academic
Performance in a Sample of U.S. College Students". SAGE Open, Vol. 5, Issue 1, March, 2015.
[9] A. Kamat, H. Kazemiroodsari, L. Anderseon, “Classroom Demonstration Module for Two and
Three Dimensional Force Analysis : The Montessori Based Engineering (MBE) Mode,” Paper ID#
29395, ASEE Virtual Conference, June 2020.
[10] S. Staacks, S. Hütz, H. Heinke, and C. Stampfer, “Simple Time-of-Flight Measurement of the
Speed of Sound Using Smartphones,” The Physics Teacher, Vol. 57, Issue 2, January 2019.