Introducing New Instruments into Science: An Example from Experimental Economics George Mengov,...
56
-
Upload
kathlyn-williams -
Category
Documents
-
view
216 -
download
1
Transcript of Introducing New Instruments into Science: An Example from Experimental Economics George Mengov,...


Introducing New Instruments into Science: An Example from Experimental Economics
George Mengov, Ph.D.,
FEBA

Outline
• Does experimental economics need new instruments
• An experiment from economic psychology
• Analysis of the experimental data
• Unresolved issues

Experimental Economics
• Experimental economics is the use of experimental methods to evaluate theoretical predictions of economic behaviour. It uses controlled, scientifically-designed experiments to test economic theories under laboratory conditions.
• Economic theory depends on assumptions about the preferences of economic agents. Whether these assumptions are correct is not observable from economic activity. Preferences can only be inferred from choices. In laboratory conditions preferences are identified and their influence on economic choices is established.

New instruments in experimental economics
• Experimental economists study market performance (rationality) given individual valuations.
• In market experiments…the temptation is to ignore reality because it is poorly understood, and does not yield to our familiar but inadequate modeling tools…
(Vernon Smith, 2002 Nobel Lecture)

New instruments in experimental economics
• If people in certain context [economic experiment] make choices that contradict our formal theory of rationality, rather than conclude that they are irrational, we:– ask why [do they look irrational], – reexamine maintained hypothesis, including
procedures, payoffs, context, instructions – inquire what new concepts and experimental designs
can help us to better understand the behaviour.
(Vernon Smith)

New instruments in experimental economics
• Psychologists and “behavioral economists” who study decision behaviour almost uniformly report results contrary to rational choice theory. Psychologists, to their credit, have maintained an intensive programme examining the behavioral nature of these contradictions.
(Vernon Smith)

New instruments in experimental economics
• Therefore better understanding of economic agents’ behaviour might be achieved in synergy with behavioral economics / economic psychology
• Nowadays psychological instruments and methods are implemented side by side with economic research approaches.

An experiment from economic psychology
• The rationality tenet in economic decision making is vulnerable when the economic agents assume the role of consumers. Confronted with choices, they consider not only utility maximization, but also emotional factors.
• Understanding such complicated situations from the stand point of a purely economic theory is difficult.

An experiment from economic psychology
• In this study we analyze people’s choices in a controlled computer experiment which bears some resemblance to the market of mobile communications with two suppliers.

An experiment from economic psychology
• In each round a participant (a customer) receives an offer from one supplier. The offer is simple – an advertised price (Pa) that the consumer would probably pay at the round end. A few seconds later a final price (Pr) is announced. It may be higher or lower than the advertised price - to the disappointment or satisfaction of the customer. The latter is free to abandon this supplier at no cost, or continue with it.

A Possible Experimental Setting 1
Supplier in this round is company А

A Possible Experimental Setting 1
Supplier in this round is company А
Advertised price: 37

A Possible Experimental Setting 1
Supplier in this round is company А
Advertised price: 37Final price: 51

A Possible Experimental Setting 1
Would you like to change your supplier?
Supplier in this round is company А
Advertised price: 37Final price: 51
No Yes

A Possible Experimental Setting 1
Supplier in this round is company B

A Possible Experimental Setting 1
Supplier in this round is company B
Advertised price: 42

A Possible Experimental Setting 1
Supplier in this round is company B
Advertised price: 42Final price: 47

A Possible Experimental Setting 1
Would you like to change your supplier?
Supplier in this round is company B
Advertised price: 42Final price: 47
No Yes

A Possible Experimental Setting 1
Supplier in this round is company B

A Possible Experimental Setting 1
• In Setting 1 the decision to retain or abandon the current supplier depends on these factors:– Advertised price (Pa)– Final price (Pr)– Price difference (Pa – Pr)

A Possible Experimental Setting 1
• In Setting 1 the decision to retain or abandon the current supplier depends on these factors:– Advertised price (Pa)– Final price (Pr)– Price difference (Pa – Pr)– Immediately previous choice of supplier
(ChangeS)

A Possible Experimental Setting 1
• In Setting 1 the decision to retain or abandon the current supplier depends on these factors:– Advertised price (Pa)– Final price (Pr)– Price difference (Pa – Pr)– Immediately previous choice of supplier
(ChangeS)– All previous Pa, Pr, Pa – Pr, ChangeS

A Possible Experimental Setting 1
• Data

A Possible Experimental Setting 1
• Data• Analysis Objective:
determine the factors influencing the decision to change supplier

A Possible Experimental Setting 1
• Data• Analysis Objective:
determine the factors influencing the decision to change supplier
• Tool – Logistic Regression

A Possible Experimental Setting 1
• What logistic regression does

A Possible Experimental Setting 1
• What logistic regression does
It estimates models of this type. ChSi →{0;1}.
That is, based on
estimates of β0, β1, β2, and β3 are produced which are optimal in some mathematical sense. These betas are measures of the influence of each factor
NiChSPa iii ,...,1,,Pr,
13210 )Pr(exp1
1
iiiii ChSPaPa
ChS

A Possible Experimental Setting 1

A Possible Experimental Setting 1
• How adequate is this model– R2 and Radj
2 are useless for logistic regression (Gujarati, 1995)
– Counting coincidences of ‘1’ and’0’ is insufficient
– Use Rank Correlations. Dependent variable is formally dummy, however contains information about preferences between two suppliers, i.e., the scale is ordinal.

A Possible Experimental Setting 1
• Result for the model explaining ChS with (Pa – Pr) and previous ChS
Both Kendall and Spearman
Rank Correlations give 42.34%

A Possible Experimental Setting 1
• Result for the model explaining ChS with (Pa – Pr) and previous ChS
Both Kendall and Spearman
Rank Correlations give 42.34%
• Tossing a coin – a lot less than 1%

Experimental Setting 2
• Take into account the positive or negative emotion due to the difference (Pa – Pr)
• Develop a psychometric scale to measure this emotion

Experimental Setting 2
• Take into account the positive or negative emotion due to the difference (Pa – Pr)
• Develop a psychometric scale to measure this emotion
Extremely disappointed
Very disappointed
Disappointed More disappointed than satisfied
As much satisfied as
disappointed
More satisfied than
disappointed
Satisfied Very satisfied Extremely satisfied
-4 -3 - 2 - 1 0 1 2 3 4
_______________________________
Thanks are due to prof. E. Gerganov for developing the DS scale

Experimental Setting 2
A Detour in psycholinguistics
• Adverbs are multipliers to adjectives
(Norman Cliff, 1959)
• Example from the English language:
Adverb Value
Slightly 0.538
Rather 0.843
Very 1.254
Extremely 1.446

Supplier in this round is company А
Advertised price: 39Final price: 38
Please indicate your satisfaction or disappointment due to this particular outcome according to the following scale:
Extremely disappointed
Very disappointed
Disappointed More disappointed than satisfied
As much satisfied as
disappointed
More satisfied than
disappointed
Satisfied Very satisfied Extremely satisfied
-4 -3 - 2 - 1 0 1 2 3 4
Would you like to change your supplier?
No Yes
Experimental Setting 2

Supplier in this round is company А
Advertised price: 38Final price: 21
Please indicate your satisfaction or disappointment due to this particular outcome according to the following scale:
Extremely disappointed
Very disappointed
Disappointed More disappointed than satisfied
As much satisfied as
disappointed
More satisfied than
disappointed
Satisfied Very satisfied Extremely satisfied
-4 -3 - 2 - 1 0 1 2 3 4
Would you like to change your supplier?
No Yes
Experimental Setting 2
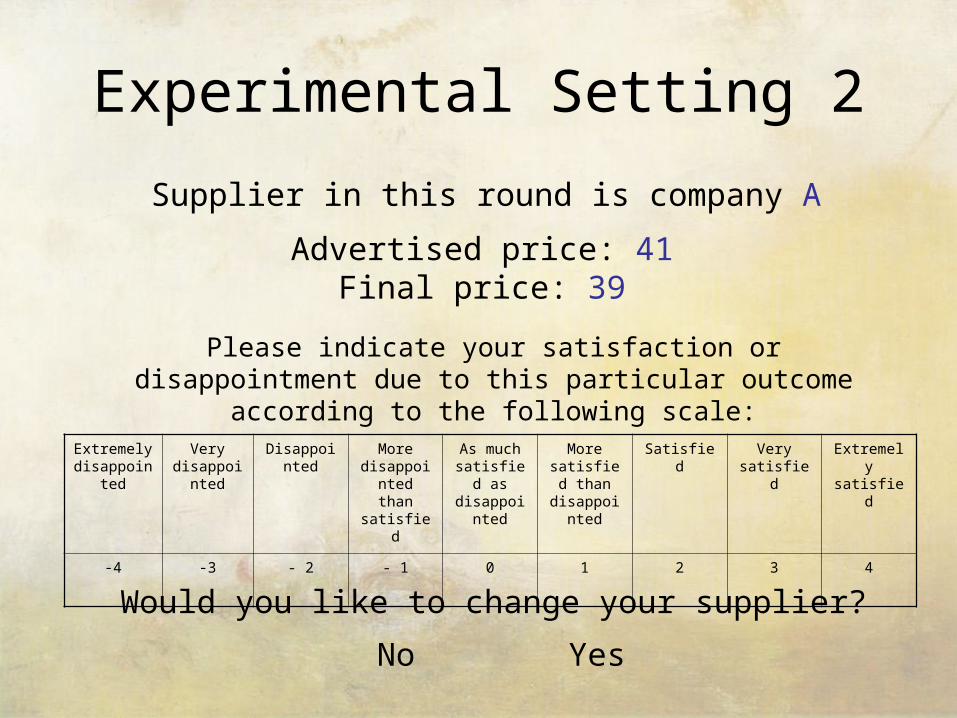
Supplier in this round is company А
Advertised price: 41Final price: 39
Please indicate your satisfaction or disappointment due to this particular outcome according to the following scale:
Extremely disappointed
Very disappointed
Disappointed More disappointed than satisfied
As much satisfied as
disappointed
More satisfied than
disappointed
Satisfied Very satisfied Extremely satisfied
-4 -3 - 2 - 1 0 1 2 3 4
Would you like to change your supplier?
No Yes
Experimental Setting 2

Experimental Setting 2

Experimental Setting 2
Significant Factors: DSi, ChSi-1. Rank Correlation: 55.12%

Experimental Setting 2
Insignificant Factor PrDiff = (Pa – Pr).

Experimental Setting 2
Significant Factors: DSi, DSi-1, ChSj-1. Rank Correlation: 55.53%

Experimental Setting 2
• Intermediate conclusions– The emotion is very important determinant of
consumer behaviour. DS improved model adequacy - rank correlations increased from 42.34% to 55.53%.
– The decision to retain or abandon a supplier depended on DS, not directly on Pa, Pr, or PrDiff.
– DSi and DSi-1 participated with opposite signs

Experimental Setting 2
• Four Experimental Conditions
• Pa was determined by interviewing students about their typical phone bills
• Pa was 40 ± 5 BGN• Each participant did
17 rounds
Distribution of Phone Bills
0
10
20
30
40
50
60
70
Fre
qu
en
cy

Treatment A
• A market with minor variability in price differences (Pa – Pr). Typical for saturated markets.
• 31 participants2.5 5 7.5 10 12.5 15
-15
-10
-5
5
Round #
Pa - Pr

Treatment B
• A market with suppliers aggressively attracting consumers with favourable prices. Pa – Pr > 0
• 34 participants
Round #
Pa - Pr
2.5 5 7.5 10 12.5 15
2.5
5
7.5
10
12.5
15
17.5

Treatment C
• Suppliers act to the disadvantage of their customers. Typical for state monopolies or cartels.
• Pa – Pr < 0 mostly
• 36 participants
Round #
Pa - Pr
2.5 5 7.5 10 12.5 15
-12.5
-10
-7.5
-5
-2.5
2.5

Treatment D
• A market with substantial price fluctuations. Typical for emerging markets.
• 28 participants
Round #
Pa - Pr
2.5 5 7.5 10 12.5 15
-15
-10
-5
5
10
15

Experimental Setting 2
• Next conclusions
Case Factors Rank Correlations
Treatment A(saturated)
DSi, ChSi-1 0.5586
Treatment B(favourable)
DSi, DSi-1, PrDiffi, ChSi-1 0.5903
Treatment C(unfavourable)
PrDiffi, DSi 0.5724
Treatment D(emerging)
DSi 0.5336

Experimental Setting 2
• What affects the positive or negative emotion
• Tool: Linear regression, model adequacy measured by R2 and Radj
2
• Example: Treatment A, the saturated market


Experimental Setting 2• Linear regression results on all treatments
Case Factors explaining DSi R2adj
Treatment A(saturated)
Pai, Pai-1, PrDiffi, PrDiffi-1, DSi-1 0.7035
Treatment B(favourable)
Pa, PrDiffi, PrDiffi-1, PrDiffi-2, DSi-1, DSi-2 0.5984
Treatment C(unfavourable)
PrDiffi, PrDiffi-1, DSi-1, DSi-2 0.6447
Treatment D(emerging)
PrDiffi, PrDiffi-1, DSi-1 0.7300
All 129 Pai, Pai-2, PrDiffi, PrDiffi-1, PrDiffi-2, DSi-1, DSi-2 0.6256
• Observation: Variables from current and previous rounds are significant for DSi

Conclusions… but not the end!
• By introducing a psychometric scale (DS) we understood consumer decisions better
• By regression analysis we conclude that choice of supplier is governed not by financial figures directly, but by emotion due to financial figures
• Paradox: (1) On many occasions participants expressed disappointment when they had to pay actually less than advertised. (2) Also people were occasionally satisfied even though they had to pay slightly more than announced.

The Paradox: disappointed when saving, satisfied when paying more
Total Number of Choices
Paradoxical Choices
Paradoxical in Total
Treatment A(saturated market)
527 36 6.83%
Treatment B(favourable market)
579 102 17.62%
Treatment C(unfavourable
market)
612 159 25.98%
Treatment D(emerging market)
476 46 9.66%

Unresolved Issues
• Generally, those regression models (linear and logistic) were not very good
• The need for a separate model for each treatment is a methodological issue
• Paradoxical behaviour intensified in the homogeneous treatments B and C