Introducing Financial Accounting…Jordan, tiger Woods, Maria Sharapova, om Brady, LeBron James, and...
39
Phil Knight majored in accounting and was a member of the track team at the University of Oregon. Today he is the chairman of the board of Nike, Inc., the largest sports and fitness company in the world. A few years after graduation, Knight teamed up with his former track coach, Bill Bowerman, to form a business called Blue Ribbon Sports to import, sell, and distrib- ute running shoes from Japan. Blue Ribbon Sports, or BRS as it came to be known, was started on a shoestring—Knight and Bowerman each contributed $500 to start the business. A few years later, BRS introduced its own line of running shoes called Nike. It also unveiled a new logo, the now familiar Nike swoosh. Following the over- whelming success of the Nike shoe line, BRS officially changed its company name to Nike, Inc. Today, the company is worth more than $60 billion. By 2014, Nike, Inc. products were marketed on six continents with total company sales of $28 billion and income of almost $2.7 billion. Nike owes much of its success to marketing prowess and innovative design and development of new products. The swoosh, along with advertising campaigns featuring taglines such as “just do it,” have made the company and its products instantly recognizable to consumers all over the world. Endorsements by the most recognizable icons in sports, including Michael Jordan, Tiger Woods, Maria Sharapova, Tom Brady, LeBron James, and Mike Trout, add to Nike’s brand recognition. In recent years, Nike has expanded its product lines beyond the traditional of- ferings of athletic shoes, athletic apparel and sports equipment to include eyewear, watches such as the Nike+ Sportwatch GPS, and Fuelband, a wearable wristband which tracks energy output. In recent years, Nike further expanded its product of- fering by acquiring other companies such as Converse, an established athletic shoe company; Hurley International, a leading designer and distributor of surf, skate, and snowboarding apparel and footwear; and Umbro, specializing in soccer equipment, footwear, and apparel. But as CEO Mark Parker recognizes, Nike needs to stay on its toes as newcom- ers Under Armour and Quiksilver challenge for customers. Nike also cannot ignore Adidas. As Nike’s main competitor, it is more than two-thirds of Nike’s size in terms of sales. Perhaps this situation, along with new product developments, explains Nike’s major new marketing commitment that reached $2.3 billion in 2014 and continues to grow. 1 Introducing Financial Accounting LEARNING OBJECTIVES 1. Identify the users of accounting information and discuss the costs and benefits of disclosure. (p. 4) 2. Describe a company’s business activities and explain how these activities are represented by the accounting equation. (p. 7) 3. Introduce the four key financial statements including the balance sheet, income statement, statement of stockholders’ equity, and statement of cash flows. (p. 11) 4. Describe the institutions that regulate financial accounting and their role in establishing generally accepted accounting principles. (p. 17) 5. Compute two key ratios that are commonly used to assess profitability and risk—return on equity and the debt-to-equity ratio. (p. 21) 6. Appendix 1A: Explain the conceptual framework for financial reporting. (p. 25) NIKE www.Nike.com A Focus Company introduces each chapter and illustrates the relevance of accounting in everyday business. Learning Objectives identify the key learning goals of the chapter.
Transcript of Introducing Financial Accounting…Jordan, tiger Woods, Maria Sharapova, om Brady, LeBron James, and...
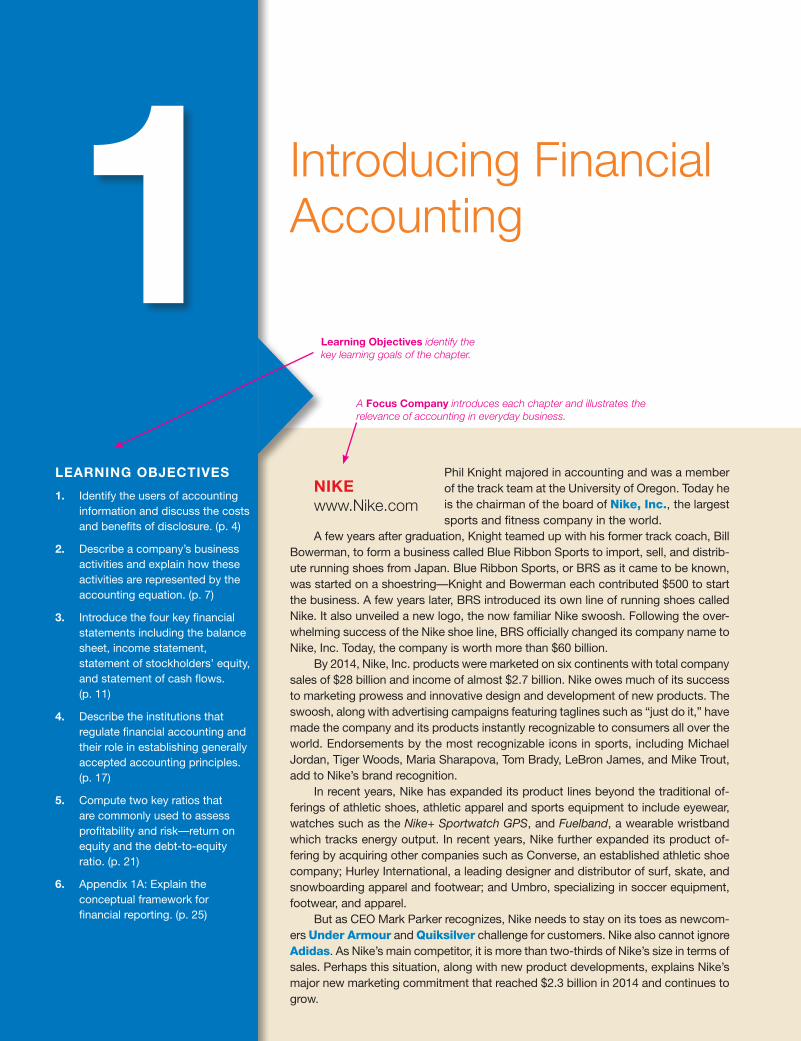
Phil Knight majored in accounting and was a member of the track team at the University of oregon. today he is the chairman of the board of Nike, Inc., the largest sports and fitness company in the world.
A few years after graduation, Knight teamed up with his former track coach, Bill Bowerman, to form a business called Blue Ribbon Sports to import, sell, and distrib-ute running shoes from Japan. Blue Ribbon Sports, or BRS as it came to be known, was started on a shoestring—Knight and Bowerman each contributed $500 to start the business. A few years later, BRS introduced its own line of running shoes called nike. it also unveiled a new logo, the now familiar nike swoosh. Following the over-whelming success of the nike shoe line, BRS officially changed its company name to nike, inc. today, the company is worth more than $60 billion.
By 2014, nike, inc. products were marketed on six continents with total company sales of $28 billion and income of almost $2.7 billion. nike owes much of its success to marketing prowess and innovative design and development of new products. the swoosh, along with advertising campaigns featuring taglines such as “just do it,” have made the company and its products instantly recognizable to consumers all over the world. Endorsements by the most recognizable icons in sports, including Michael Jordan, tiger Woods, Maria Sharapova, tom Brady, LeBron James, and Mike trout, add to nike’s brand recognition.
in recent years, nike has expanded its product lines beyond the traditional of-ferings of athletic shoes, athletic apparel and sports equipment to include eyewear, watches such as the Nike+ Sportwatch GPS, and Fuelband, a wearable wristband which tracks energy output. in recent years, nike further expanded its product of-fering by acquiring other companies such as Converse, an established athletic shoe company; hurley international, a leading designer and distributor of surf, skate, and snowboarding apparel and footwear; and Umbro, specializing in soccer equipment, footwear, and apparel.
But as CEo Mark Parker recognizes, nike needs to stay on its toes as newcom-ers Under Armour and Quiksilver challenge for customers. nike also cannot ignore Adidas. As nike’s main competitor, it is more than two-thirds of nike’s size in terms of sales. Perhaps this situation, along with new product developments, explains nike’s major new marketing commitment that reached $2.3 billion in 2014 and continues to grow.
1 Introducing Financial Accounting
leaRning obJecTiVes
1. identify the users of accounting information and discuss the costs and benefits of disclosure. (p. 4)
2. describe a company’s business activities and explain how these activities are represented by the accounting equation. (p. 7)
3. introduce the four key financial statements including the balance sheet, income statement, statement of stockholders’ equity, and statement of cash flows. (p. 11)
4. describe the institutions that regulate financial accounting and their role in establishing generally accepted accounting principles. (p. 17)
5. Compute two key ratios that are commonly used to assess profitability and risk—return on equity and the debt-to-equity ratio. (p. 21)
6. Appendix 1A: Explain the conceptual framework for financial reporting. (p. 25)
nikewww.Nike.com
A focus company introduces each chapter and illustrates the relevance of accounting in everyday business.
learning objectives identify the key learning goals of the chapter.
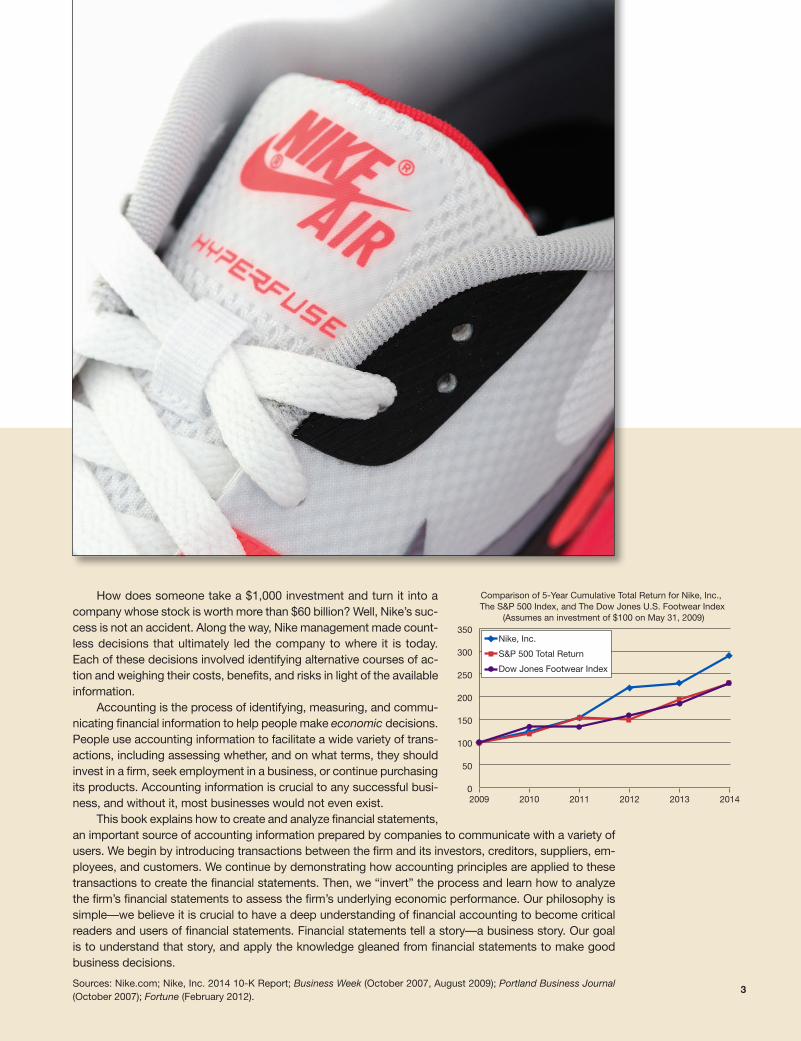
how does someone take a $1,000 investment and turn it into a company whose stock is worth more than $60 billion? Well, nike’s suc-cess is not an accident. Along the way, nike management made count-less decisions that ultimately led the company to where it is today. Each of these decisions involved identifying alternative courses of ac-tion and weighing their costs, benefits, and risks in light of the available information.
Accounting is the process of identifying, measuring, and commu-nicating financial information to help people make economic decisions. People use accounting information to facilitate a wide variety of trans-actions, including assessing whether, and on what terms, they should invest in a firm, seek employment in a business, or continue purchasing its products. Accounting information is crucial to any successful busi-ness, and without it, most businesses would not even exist.
this book explains how to create and analyze financial statements, an important source of accounting information prepared by companies to communicate with a variety of users. We begin by introducing transactions between the firm and its investors, creditors, suppliers, em-ployees, and customers. We continue by demonstrating how accounting principles are applied to these transactions to create the financial statements. then, we “invert” the process and learn how to analyze the firm’s financial statements to assess the firm’s underlying economic performance. our philosophy is simple—we believe it is crucial to have a deep understanding of financial accounting to become critical readers and users of financial statements. Financial statements tell a story—a business story. our goal is to understand that story, and apply the knowledge gleaned from financial statements to make good business decisions.
Sources: nike.com; nike, inc. 2014 10-K Report; Business Week (october 2007, August 2009); Portland Business Journal (october 2007); Fortune (February 2012).
0
50
100
150
200
250
300
350
201420132012201120102009
Nike, Inc.
S&P 500 Total Return
Dow Jones Footwear Index
Comparison of 5-Year Cumulative Total Return for Nike, Inc., The S&P 500 Index, and The Dow Jones U.S. Footwear Index
(Assumes an investment of $100 on May 31, 2009)
3
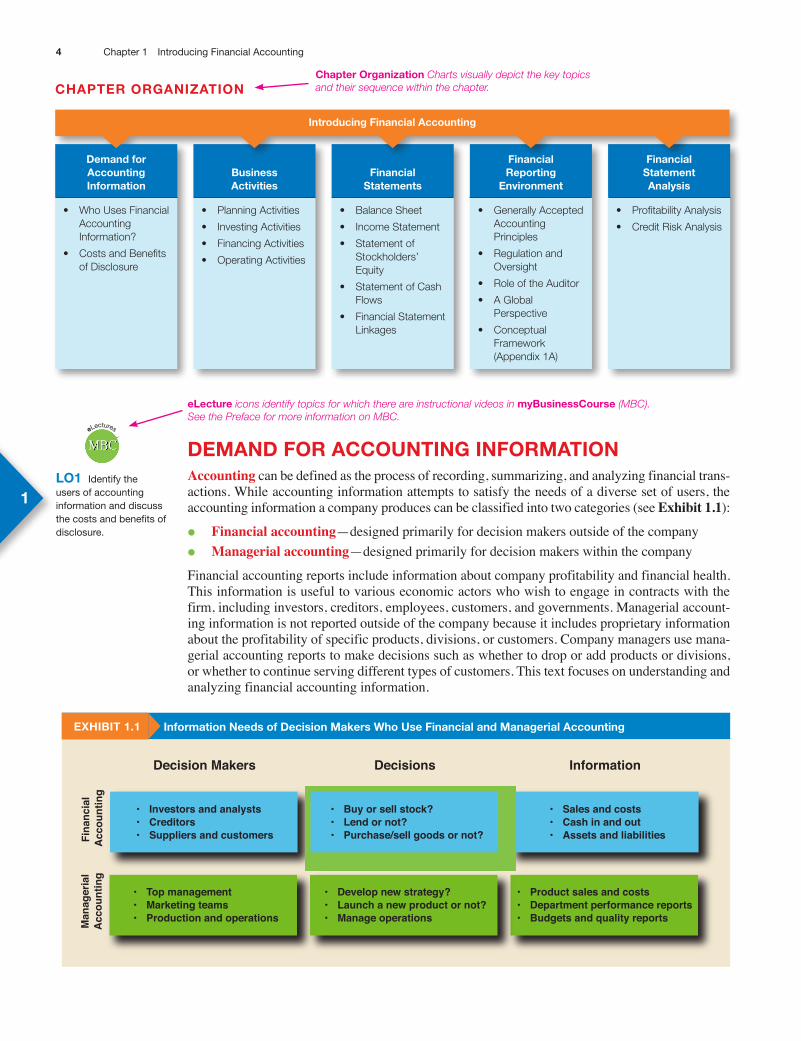
DemanD foR accoUnTing infoRmaTionAccounting can be defined as the process of recording, summarizing, and analyzing financial trans-actions. While accounting information attempts to satisfy the needs of a diverse set of users, the accounting information a company produces can be classified into two categories (see Exhibit 1.1):
• Financial accounting—designed primarily for decision makers outside of the company
• Managerial accounting—designed primarily for decision makers within the company
Financial accounting reports include information about company profitability and financial health. This information is useful to various economic actors who wish to engage in contracts with the firm, including investors, creditors, employees, customers, and governments. Managerial account-ing information is not reported outside of the company because it includes proprietary information about the profitability of specific products, divisions, or customers. Company managers use mana-gerial accounting reports to make decisions such as whether to drop or add products or divisions, or whether to continue serving different types of customers. This text focuses on understanding and analyzing financial accounting information.
exhibiT 1.1 information needs of Decision makers Who Use financial and managerial accounting
Decisions Information
Fina
ncia
l A
ccou
ntin
gM
anag
eria
lA
ccou
ntin
g
Decision Makers
• Sales and costs• Cash in and out• Assets and liabilities
• Investors and analysts• Creditors• Suppliers and customers
• Buy or sell stock?• Lend or not?• Purchase/sell goods or not?
• Product sales and costs• Department performance reports• Budgets and quality reports
• Top management• Marketing teams• Production and operations
• Develop new strategy?• Launch a new product or not?• Manage operations
lo1 identify the users of accounting information and discuss the costs and benefits of disclosure.
MBCeLectures
1
chaPTeR oRganizaTion
• Planning Activities
• Investing Activities
• Financing Activities
• Operating Activities
business activities
• Balance Sheet
• Income Statement
• Statement of Stockholders’ Equity
• Statement of Cash Flows
• Financial Statement Linkages
financial statements
• Generally Accepted Accounting Principles
• Regulation and Oversight
• Role of the Auditor
• A Global Perspective
• Conceptual Framework (Appendix 1A)
financial Reporting
environment
• Profitability Analysis
• Credit Risk Analysis
financial statement analysis
introducing financial accounting
• Who Uses Financial Accounting Information?
• Costs and Benefits of Disclosure
Demand for accounting information
4 Chapter 1 introducing Financial Accounting
chapter organization Charts visually depict the key topics and their sequence within the chapter.
electure icons identify topics for which there are instructional videos in mybusinesscourse (MBC). See the Preface for more information on MBC.

Who Uses financial accounting information?Demand for financial accounting information derives from numerous users including:
• shareholders and potential shareholders
• Creditors and suppliers
• Managers and directors
• Financial analysts
• Other users
shareholders and Potential shareholders Corporations are the dominant form of busi-ness organization for large companies around the world, and corporate shareholders are one impor-tant group of decision makers that have an interest in financial accounting information. A corpora-tion is a form of business organization that is characterized by a large number of owners who are not involved in managing the day-to-day operations of the company.1 A corporation exists as a legal entity that issues shares of stock to its owners in exchange for cash and, therefore, the owners of a corporation are referred to as shareholders or stockholders.
Because the shareholders are not involved in the day-to-day operations of the business, they rely on the information in financial statements to evaluate management performance and assess the company’s financial condition.
in addition to corporations, sole proprietorships and partnerships are also common forms of business ownership. A sole proprietorship has a single owner who typically manages the daily operations. small family-run businesses, such as corner grocery stores, are commonly organized as sole proprietorships. A partnership has two or more owners who are also usually involved in managing the business. Many professionals, such as lawyers and CPAs, organize their businesses as partnerships.
Most corporations begin as small, privately held businesses (sole proprietorships or partner-ships). As their operations expand, however, they require additional capital to finance their growth. One of the principle advantages of a corporation over sole proprietorships and partnerships is the ability to raise large amounts of cash by issuing (selling) stock. For example, as nike grew from a small business with only two owners into a larger company, it raised the funds needed for expan-sion by selling shares of nike stock to new shareholders. in the united states, large corporations can raise funds by issuing stock on organized exchanges, such as the New York Stock Exchange (NYSE) or NASDAQ (which is an acronym for the national Association of securities Dealers Auto-mated Quotations system). Corporations with stock that is traded on public exchanges are known as publicly traded corporations or simply public corporations.
Financial statements and the accompanying footnotes provide information on the risk and re-turn associated with owning shares of stock in the corporation, and they reveal how well manage-ment has performed. Financial statements also provide valuable insights into future performance by revealing management’s plans for new products, new operating procedures, and new strategic directions for the company as well as for their implementation. Corporate management provides this information because the information reduces uncertainty about the company’s future prospects which, in turn, increases the market price of its shares and helps the company raise the funds it needs to grow.
creditors and suppliers Few businesses rely solely on shareholders for the cash needed to operate the company. instead, most companies borrow from banks or other lenders known as creditors. Creditors are interested in the potential borrower’s ability to repay. They use financial accounting information to help determine loan terms, loan amounts, interest rates, and collateral. in addition, creditors’ loans often include contractual requirements based on information found in the financial statements.
1 Most countries have business forms that are similar in structure to those of a u.s. corporation, though they are referred to by different names. For example, while firms that are incorporated in the united states have the extension, “inc.” appended to their names, similar firms in the united Kingdom are referred to as a Public limited Company, which has the extension “PlC.”
FYI Shareholders of a corporation are its owners; although managers can own stock in the corporation, most shareholders are not managers.
FYI Financial statements are typically required when a business requests a bank loan.
5Chapter 1 introducing Financial Accounting
fyi features provide additional information that complements the text.
Suppliers use financial information to establish credit sales terms and to determine their long-term commitment to supply-chain relationships. supplier companies often justify an expansion of their businesses based on the growth and financial health of their customers. Both creditors and suppliers rely on information in the financial statements to monitor and adjust their contracts and commitments with a company.
managers and Directors Financial statements can be thought of as a financial report card for management. A well-managed company earns a good return for its shareholders, and this is re-flected in the financial statements. In most companies, management is compensated, at least in part, based on the financial performance of the company. That is, managers often receive cash bonuses, shares of stock, or other incentive compensation that is linked directly to the information in the financial statements.
Publicly traded corporations are required by law to have a board of directors. Directors are elected by the shareholders to represent shareholder interests and oversee management. The board hires executive management and regularly reviews company operations. Directors use financial accounting information to review the results of operations, evaluate future strategy, and assess management performance.
Both managers and directors use the published financial statements of other companies to per-form comparative analyses and establish performance benchmarks. For example, managers in some companies are paid a bonus for financial performance that exceeds the industry average.
bUsiness insighT
Recent court cases involving corporations such as Enron, Tyco, and WorldCom (now MCI) have found executives, including several CEos, guilty of issuing fraudulent financial statements. these execu-tives have received substantial fines and, in some cases, long jail sentences. these trials have resulted in widespread loss of reputation and credibility among corporate boards.
financial analysts Many decision makers lack the time, resources, or expertise to efficiently and effectively analyze financial statements. Instead, they rely on professional financial analysts, such as credit rating agencies like Moody’s investment services, portfolio managers, and security analysts. Financial analysts play an important role in the dissemination of financial information and often specialize in specific industries. Their analysis helps to identify and assess risk, forecast perfor-mance, establish prices for new issues of stock, and make buy-or-sell recommendations to investors.
other Users of financial accounting information external decision makers include many users of accounting information in addition to those listed above. For example, prospective employees often examine the financial statements of an employer to learn about the company be-fore interviewing for or accepting a new job.
Labor unions examine financial statements in order to assess the financial health of firms prior to negotiating labor contracts on behalf of the firms’ employees. Customers use accounting informa-tion to assess the ability of a company to deliver products or services and to assess the company’s long-term reliability.
Government agencies rely on accounting information to develop and enforce regulations, in-cluding public protection, price setting, import-export, taxation, and various other policies.2 Timely and reliable information is crucial to effective regulatory policy. Moreover, accounting information is often used to assess penalties for companies that violate various regulations.
costs and benefits of DisclosureThe act of providing financial information to external users is called disclosure. As with every decision, the benefits of disclosure must be weighed against the costs of providing the information.
2 A company’s tax returns are distinctly different from its financial statements. Tax returns are prepared for tax authorities in order to comply with income tax rules. The financial statements are prepared to provide information to investors, creditors and other decision makers outside of the business.
FYI The Sarbanes-Oxley Act requires issuers of securities to disclose whether they have a code of ethics for the senior officers.
6 Chapter 1 introducing Financial Accounting
One reason companies are motivated to disclose financial information to external decision makers is that it often lowers financing and operating costs. For example, when a company applies for a loan, the bank uses the company’s financial statements to help determine the appropriate interest rate. Without adequate financial disclosures in its financial statements, the bank is likely to demand a higher interest rate or perhaps not make the loan at all. Thus, in this setting, a benefit of financial disclosure is that it reduces the company’s cost of borrowing.
While there are benefits from disclosing financial information, there are also costs. Besides the obvious cost of hiring accountants and preparing the financial statements, financial disclosures can also result in costs being imposed by competitors. it is common practice for managers to scrutinize the financial statements of competitors to learn about successful products, new strategies, innova-tive technologies, and changing market conditions. Thus, disclosing too much information can place a company at a competitive disadvantage. Disclosure can also raise investors’ expectations about a company’s future profitability. if those expectations are not met, they may bring litigation against the managers.
There are also political costs that are potentially associated with accounting disclosure. highly visible companies, such as defense contractors and oil companies, are often the target of scrutiny by the public and by government officials. When these companies report unusually large account-ing profits, they are often the target of additional regulation or increased taxes.
stock market regulators impose disclosure standards for publicly traded corporations, but the nature and extent of the required disclosures vary substantially across countries. Further, because the requirements only set the minimum level of disclosure, the quantity and quality of informa-tion provided by firms will vary. This variation in disclosure ultimately reflects differences among companies in the benefits and costs of disclosing information to the public.
yoU make The call
you are a Product manager there is often friction between investors’ needs for information and a company’s desire to safeguard competitive advantages. Assume that you are the product manager for a key department at your company and you are asked for advice on the extent of information to disclose in the annual report on a potentially lucrative new product that your department has test marketed. What considerations affect the advice you provide and why? [Answer on page 29]
bUsiness acTiViTiesBusinesses produce accounting information to help develop strategies, attract financing, evaluate investment opportunities, manage operations, and measure performance. Before we can attempt to understand the information provided in financial statements, we must understand these business activities. That is, what does a business actually do? For example:
• Where does a company such as nike find the resources to develop new products and open new retail stores?
• What new products should nike bring to market?
• how much should nike spend on product development? On advertising? On executive compensation?
• how does nike’s management determine if a product is a success?
Questions such as these define the activities of nike and other companies.Exhibit 1.2 illustrates the activities of a typical business. All businesses plan business activities,
finance those activities, invest resources in those activities, and then engage in operating activities. Companies conduct all these activities while confronting a variety of external forces, including competition from other businesses, government regulation, economic conditions and market forces, and changing preferences of customers. The financial statements provide information that helps us understand and evaluate each of these activities.
lo2 describe a company’s business activities and explain how these activities are represented by the accounting equation.
MBCeLectures
2
7Chapter 1 introducing Financial Accounting
you make The call requires you to assume various roles within a business and use your accounting knowledge to address an issue. Solutions are at the end of the chapter.
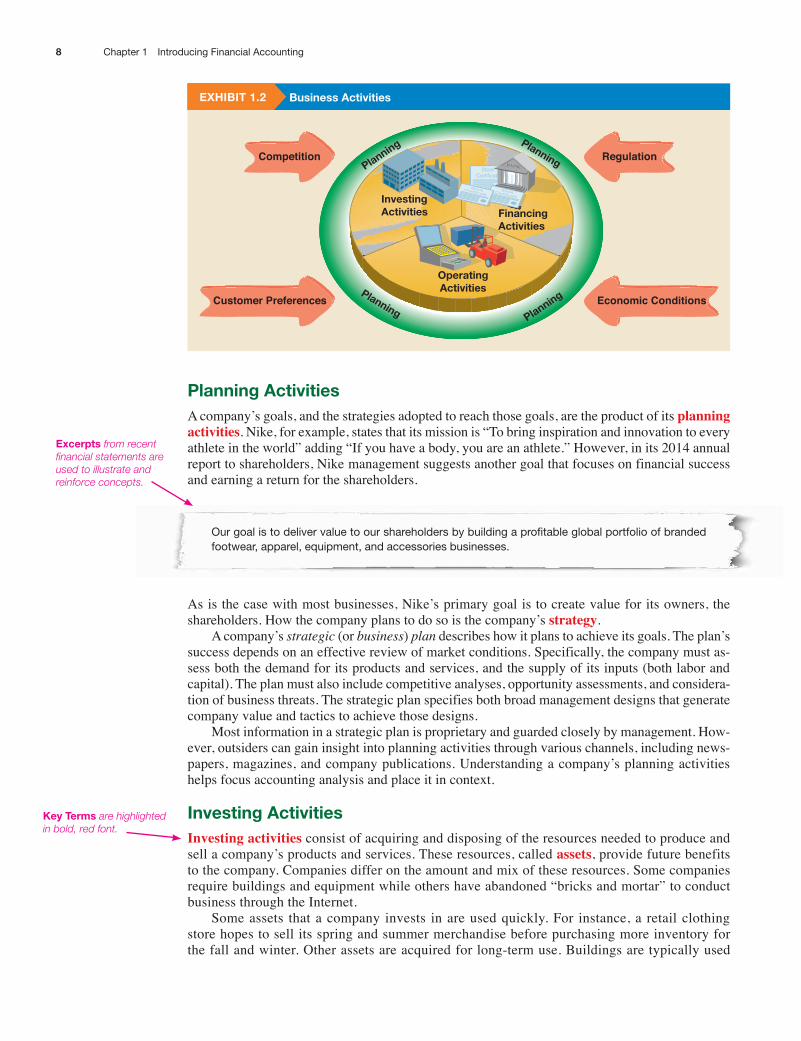
exhibiT 1.2 business activities
CompetitionStock
Certificate
StockCertificate
StockCertificate
InvestingActivities
Planning
Planning
Planning
Planning
FinancingActivities
OperatingActivities
Regulation
Economic ConditionsCustomer Preferences
Planning activitiesA company’s goals, and the strategies adopted to reach those goals, are the product of its planning activities. nike, for example, states that its mission is “To bring inspiration and innovation to every athlete in the world” adding “if you have a body, you are an athlete.” however, in its 2014 annual report to shareholders, nike management suggests another goal that focuses on financial success and earning a return for the shareholders.
our goal is to deliver value to our shareholders by building a profitable global portfolio of branded footwear, apparel, equipment, and accessories businesses.
As is the case with most businesses, nike’s primary goal is to create value for its owners, the shareholders. how the company plans to do so is the company’s strategy.
A company’s strategic (or business) plan describes how it plans to achieve its goals. The plan’s success depends on an effective review of market conditions. specifically, the company must as-sess both the demand for its products and services, and the supply of its inputs (both labor and capital). The plan must also include competitive analyses, opportunity assessments, and considera-tion of business threats. The strategic plan specifies both broad management designs that generate company value and tactics to achieve those designs.
Most information in a strategic plan is proprietary and guarded closely by management. how-ever, outsiders can gain insight into planning activities through various channels, including news-papers, magazines, and company publications. understanding a company’s planning activities helps focus accounting analysis and place it in context.
investing activitiesInvesting activities consist of acquiring and disposing of the resources needed to produce and sell a company’s products and services. These resources, called assets, provide future benefits to the company. Companies differ on the amount and mix of these resources. some companies require buildings and equipment while others have abandoned “bricks and mortar” to conduct business through the internet.
some assets that a company invests in are used quickly. For instance, a retail clothing store hopes to sell its spring and summer merchandise before purchasing more inventory for the fall and winter. Other assets are acquired for long-term use. Buildings are typically used
8 Chapter 1 introducing Financial Accounting
excerpts from recent financial statements are used to illustrate and reinforce concepts.
key Terms are highlighted in bold, red font.
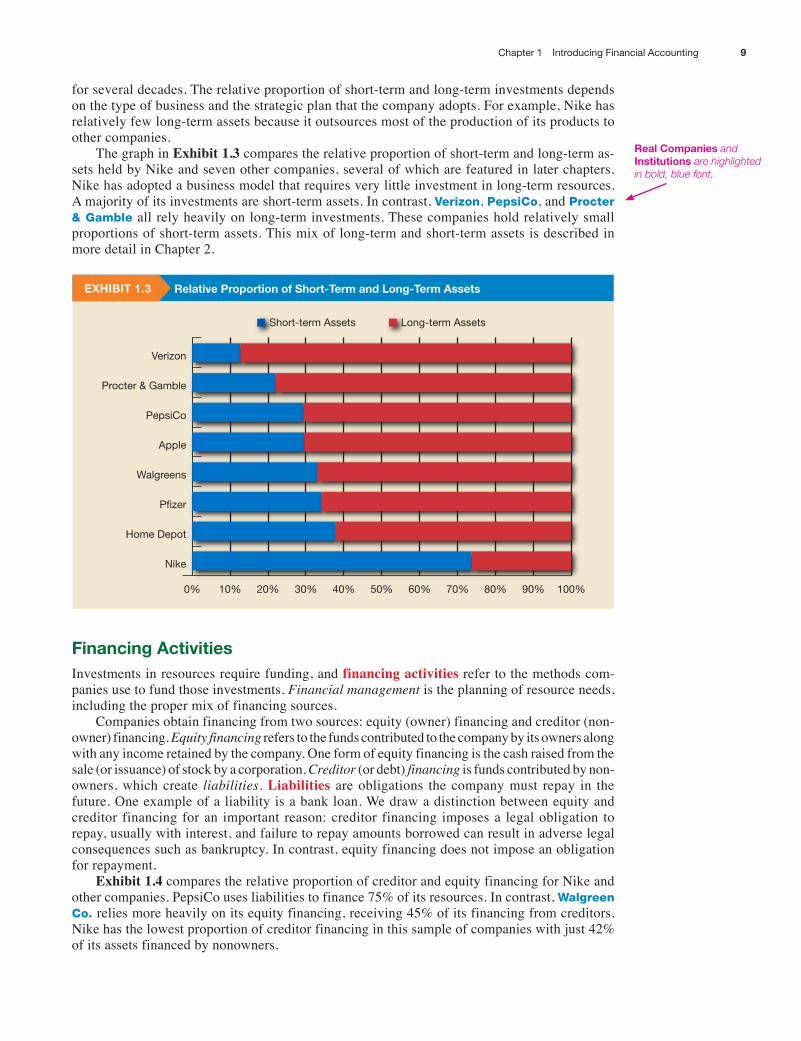
for several decades. The relative proportion of short-term and long-term investments depends on the type of business and the strategic plan that the company adopts. For example, nike has relatively few long-term assets because it outsources most of the production of its products to other companies.
The graph in Exhibit 1.3 compares the relative proportion of short-term and long-term as-sets held by nike and seven other companies, several of which are featured in later chapters. nike has adopted a business model that requires very little investment in long-term resources. A majority of its investments are short-term assets. in contrast, Verizon, PepsiCo, and Procter & Gamble all rely heavily on long-term investments. These companies hold relatively small proportions of short-term assets. This mix of long-term and short-term assets is described in more detail in Chapter 2.
exhibiT 1.3 Relative Proportion of short-Term and long-Term assets
0% 10% 20% 30% 40% 50% 60% 70% 80% 90% 100%
Nike
Home Depot
Pfizer
Walgreens
Apple
PepsiCo
Procter & Gamble
Verizon
Long-term AssetsShort-term Assets
financing activitiesinvestments in resources require funding, and financing activities refer to the methods com-panies use to fund those investments. Financial management is the planning of resource needs, including the proper mix of financing sources.
Companies obtain financing from two sources: equity (owner) financing and creditor (non-owner) financing. Equity financing refers to the funds contributed to the company by its owners along with any income retained by the company. One form of equity financing is the cash raised from the sale (or issuance) of stock by a corporation. Creditor (or debt) financing is funds contributed by non- owners, which create liabilities. Liabilities are obligations the company must repay in the future. One example of a liability is a bank loan. We draw a distinction between equity and creditor financing for an important reason: creditor financing imposes a legal obligation to repay, usually with interest, and failure to repay amounts borrowed can result in adverse legal consequences such as bankruptcy. in contrast, equity financing does not impose an obligation for repayment.
Exhibit 1.4 compares the relative proportion of creditor and equity financing for nike and other companies. PepsiCo uses liabilities to finance 75% of its resources. in contrast, Walgreen Co. relies more heavily on its equity financing, receiving 45% of its financing from creditors. nike has the lowest proportion of creditor financing in this sample of companies with just 42% of its assets financed by nonowners.
9Chapter 1 introducing Financial Accounting
Real companies and institutions are highlighted in bold, blue font.
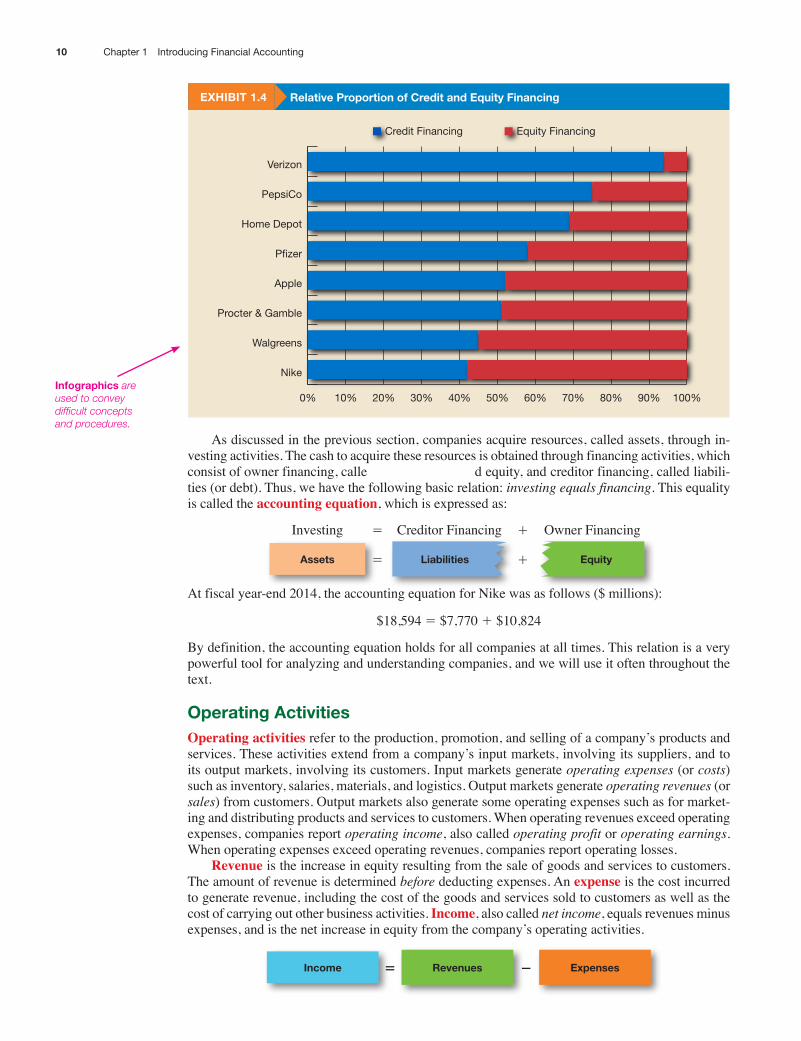
exhibiT 1.4 Relative Proportion of credit and equity financing
0% 10% 20% 30% 40% 50% 60% 70% 80% 90% 100%
Nike
Walgreens
Procter & Gamble
Apple
Pfizer
Home Depot
PepsiCo
Verizon
Equity FinancingCredit Financing
As discussed in the previous section, companies acquire resources, called assets, through in-vesting activities. The cash to acquire these resources is obtained through financing activities, which consist of owner financing, calle d equity, and creditor financing, called liabili-ties (or debt). Thus, we have the following basic relation: investing equals financing. This equality is called the accounting equation, which is expressed as:
investing 5 Creditor Financing 1 Owner Financing
assets 5 liabilities 1 equity
At fiscal year-end 2014, the accounting equation for nike was as follows ($ millions):
$18,594 5 $7,770 1 $10,824
By definition, the accounting equation holds for all companies at all times. This relation is a very powerful tool for analyzing and understanding companies, and we will use it often throughout the text.
operating activitiesOperating activities refer to the production, promotion, and selling of a company’s products and services. These activities extend from a company’s input markets, involving its suppliers, and to its output markets, involving its customers. input markets generate operating expenses (or costs) such as inventory, salaries, materials, and logistics. Output markets generate operating revenues (or sales) from customers. Output markets also generate some operating expenses such as for market-ing and distributing products and services to customers. When operating revenues exceed operating expenses, companies report operating income, also called operating profit or operating earnings. When operating expenses exceed operating revenues, companies report operating losses.
Revenue is the increase in equity resulting from the sale of goods and services to customers. The amount of revenue is determined before deducting expenses. An expense is the cost incurred to generate revenue, including the cost of the goods and services sold to customers as well as the cost of carrying out other business activities. Income, also called net income, equals revenues minus expenses, and is the net increase in equity from the company’s operating activities.
income 5 Revenues 2 expenses
10 Chapter 1 introducing Financial Accounting
infographics are used to convey difficult concepts and procedures.
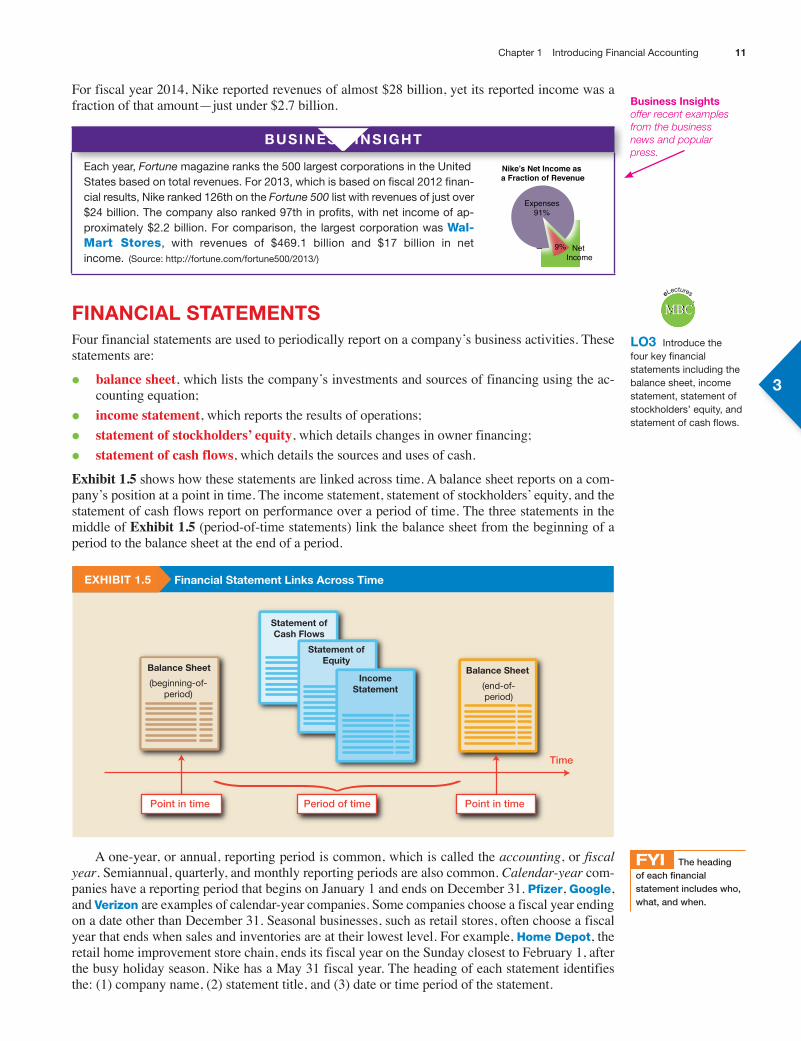
For fiscal year 2014, nike reported revenues of almost $28 billion, yet its reported income was a fraction of that amount—just under $2.7 billion.
bUsiness insighT
Each year, Fortune magazine ranks the 500 largest corporations in the United Nike’s Net Income as a Fraction of Revenue
Expenses91%
Net Income
9%
States based on total revenues. For 2013, which is based on fiscal 2012 finan-cial results, nike ranked 126th on the Fortune 500 list with revenues of just over $24 billion. the company also ranked 97th in profits, with net income of ap-proximately $2.2 billion. For comparison, the largest corporation was Wal-Mart Stores, with revenues of $469.1 billion and $17 billion in net income. (Source: http://fortune.com/fortune500/2013/)
financial sTaTemenTsFour financial statements are used to periodically report on a company’s business activities. These statements are:
• balance sheet, which lists the company’s investments and sources of financing using the ac-counting equation;
• income statement, which reports the results of operations;
• statement of stockholders’ equity, which details changes in owner financing;
• statement of cash flows, which details the sources and uses of cash.
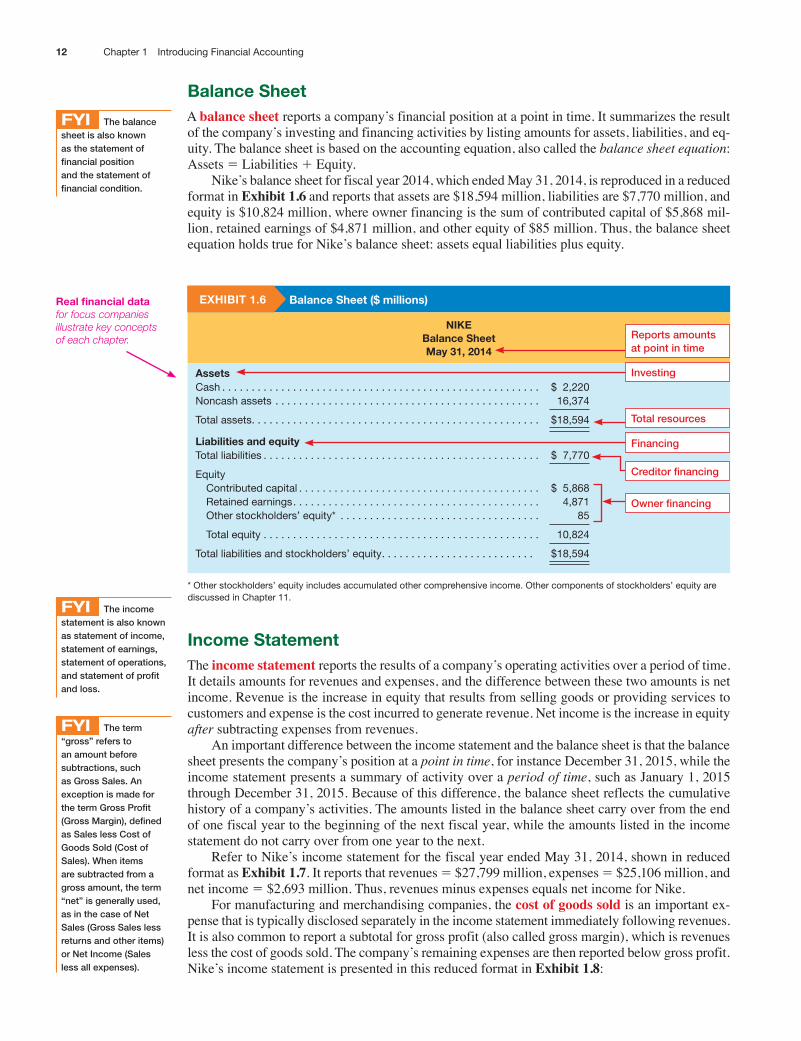
Exhibit 1.5 shows how these statements are linked across time. A balance sheet reports on a com-pany’s position at a point in time. The income statement, statement of stockholders’ equity, and the statement of cash flows report on performance over a period of time. The three statements in the middle of Exhibit 1.5 (period-of-time statements) link the balance sheet from the beginning of a period to the balance sheet at the end of a period.
exhibiT 1.5 financial statement links across Time
Balance Sheet
(beginning-of-period)
Balance Sheet
(end-of-period)
Balance Sheet
(end-of-period)
Statement ofCash Flows
Statement ofEquity
IncomeStatement
Time
Period of time Point in time Point in time
A one-year, or annual, reporting period is common, which is called the accounting, or fiscal year. semiannual, quarterly, and monthly reporting periods are also common. Calendar-year com-panies have a reporting period that begins on January 1 and ends on December 31. Pfizer, Google, and Verizon are examples of calendar-year companies. some companies choose a fiscal year ending on a date other than December 31. seasonal businesses, such as retail stores, often choose a fiscal year that ends when sales and inventories are at their lowest level. For example, Home Depot, the retail home improvement store chain, ends its fiscal year on the sunday closest to February 1, after the busy holiday season. nike has a May 31 fiscal year. The heading of each statement identifies the: (1) company name, (2) statement title, and (3) date or time period of the statement.
lo3 introduce the four key financial statements including the balance sheet, income statement, statement of stockholders’ equity, and statement of cash flows.
MBCeLectures
3
FYI The heading of each financial statement includes who, what, and when.
11Chapter 1 introducing Financial Accounting
business insights offer recent examples from the business news and popular press.
balance sheetA balance sheet reports a company’s financial position at a point in time. it summarizes the result of the company’s investing and financing activities by listing amounts for assets, liabilities, and eq-uity. The balance sheet is based on the accounting equation, also called the balance sheet equation: Assets 5 liabilities 1 equity.
nike’s balance sheet for fiscal year 2014, which ended May 31, 2014, is reproduced in a reduced format in Exhibit 1.6 and reports that assets are $18,594 million, liabilities are $7,770 million, and equity is $10,824 million, where owner financing is the sum of contributed capital of $5,868 mil-lion, retained earnings of $4,871 million, and other equity of $85 million. Thus, the balance sheet equation holds true for nike’s balance sheet: assets equal liabilities plus equity.
exhibiT 1.6 balance sheet ($ millions)
nikebalance sheetmay 31, 2014
assetsCash . . . . . . . . . . . . . . . . . . . . . . . . . . . . . . . . . . . . . . . . . . . . . . . . . . . . . . $ 2,220noncash assets . . . . . . . . . . . . . . . . . . . . . . . . . . . . . . . . . . . . . . . . . . . . . 16,374
total assets. . . . . . . . . . . . . . . . . . . . . . . . . . . . . . . . . . . . . . . . . . . . . . . . . $18,594
liabilities and equitytotal liabilities . . . . . . . . . . . . . . . . . . . . . . . . . . . . . . . . . . . . . . . . . . . . . . . $ 7,770
Equity Contributed capital . . . . . . . . . . . . . . . . . . . . . . . . . . . . . . . . . . . . . . . . . $ 5,868 Retained earnings. . . . . . . . . . . . . . . . . . . . . . . . . . . . . . . . . . . . . . . . . . 4,871 other stockholders’ equity* . . . . . . . . . . . . . . . . . . . . . . . . . . . . . . . . . . 85
total equity . . . . . . . . . . . . . . . . . . . . . . . . . . . . . . . . . . . . . . . . . . . . . . . 10,824
total liabilities and stockholders’ equity. . . . . . . . . . . . . . . . . . . . . . . . . . $18,594
* other stockholders’ equity includes accumulated other comprehensive income. other components of stockholders’ equity are discussed in Chapter 11.
income statementThe income statement reports the results of a company’s operating activities over a period of time. it details amounts for revenues and expenses, and the difference between these two amounts is net income. revenue is the increase in equity that results from selling goods or providing services to customers and expense is the cost incurred to generate revenue. net income is the increase in equity after subtracting expenses from revenues.
An important difference between the income statement and the balance sheet is that the balance sheet presents the company’s position at a point in time, for instance December 31, 2015, while the income statement presents a summary of activity over a period of time, such as January 1, 2015 through December 31, 2015. Because of this difference, the balance sheet reflects the cumulative history of a company’s activities. The amounts listed in the balance sheet carry over from the end of one fiscal year to the beginning of the next fiscal year, while the amounts listed in the income statement do not carry over from one year to the next.
refer to nike’s income statement for the fiscal year ended May 31, 2014, shown in reduced format as Exhibit 1.7. it reports that revenues 5 $27,799 million, expenses 5 $25,106 million, and net income 5 $2,693 million. Thus, revenues minus expenses equals net income for nike.
For manufacturing and merchandising companies, the cost of goods sold is an important ex-pense that is typically disclosed separately in the income statement immediately following revenues. it is also common to report a subtotal for gross profit (also called gross margin), which is revenues less the cost of goods sold. The company’s remaining expenses are then reported below gross profit. nike’s income statement is presented in this reduced format in Exhibit 1.8:
FYI The balance sheet is also known as the statement of financial position and the statement of financial condition.
Investing
Total resources
Financing
Creditor financing
Owner financing
Reports amounts at point in time
FYI The income statement is also known as statement of income, statement of earnings, statement of operations, and statement of profit and loss.
FYI The term “gross” refers to an amount before subtractions, such as Gross Sales. An exception is made for the term Gross Profit (Gross Margin), defined as Sales less Cost of Goods Sold (Cost of Sales). When items are subtracted from a gross amount, the term “net” is generally used, as in the case of Net Sales (Gross Sales less returns and other items) or Net Income (Sales less all expenses).
12 Chapter 1 introducing Financial Accounting
Real financial data for focus companies illustrate key concepts of each chapter.
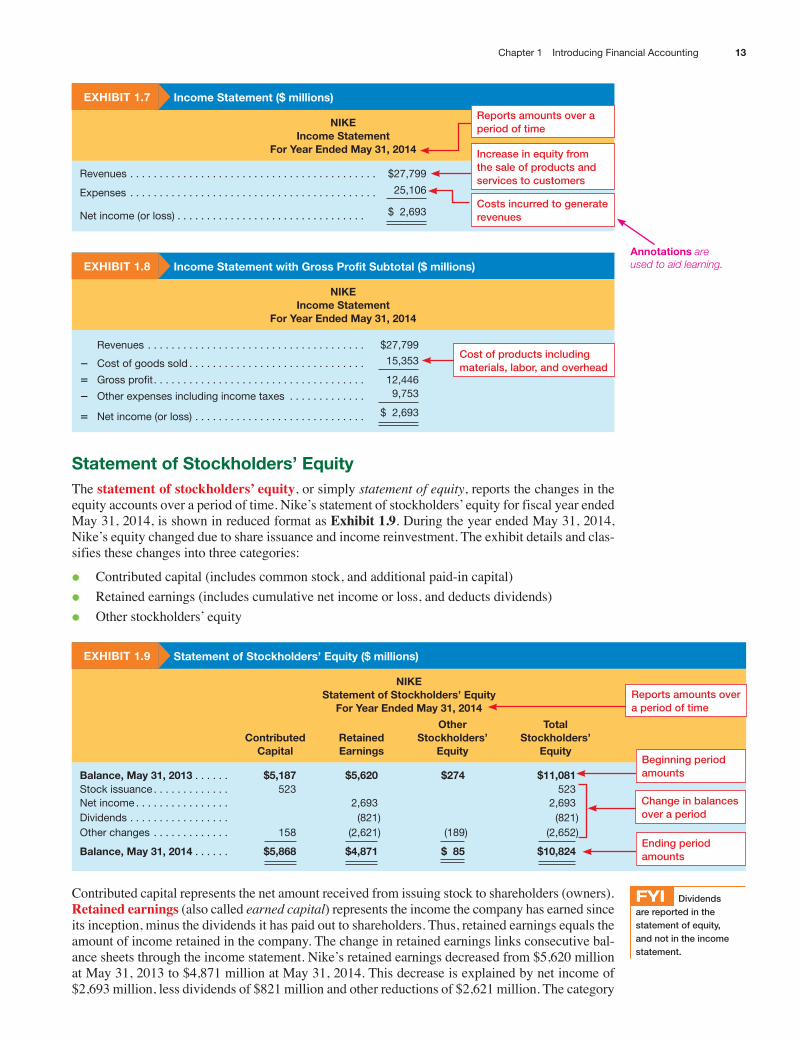
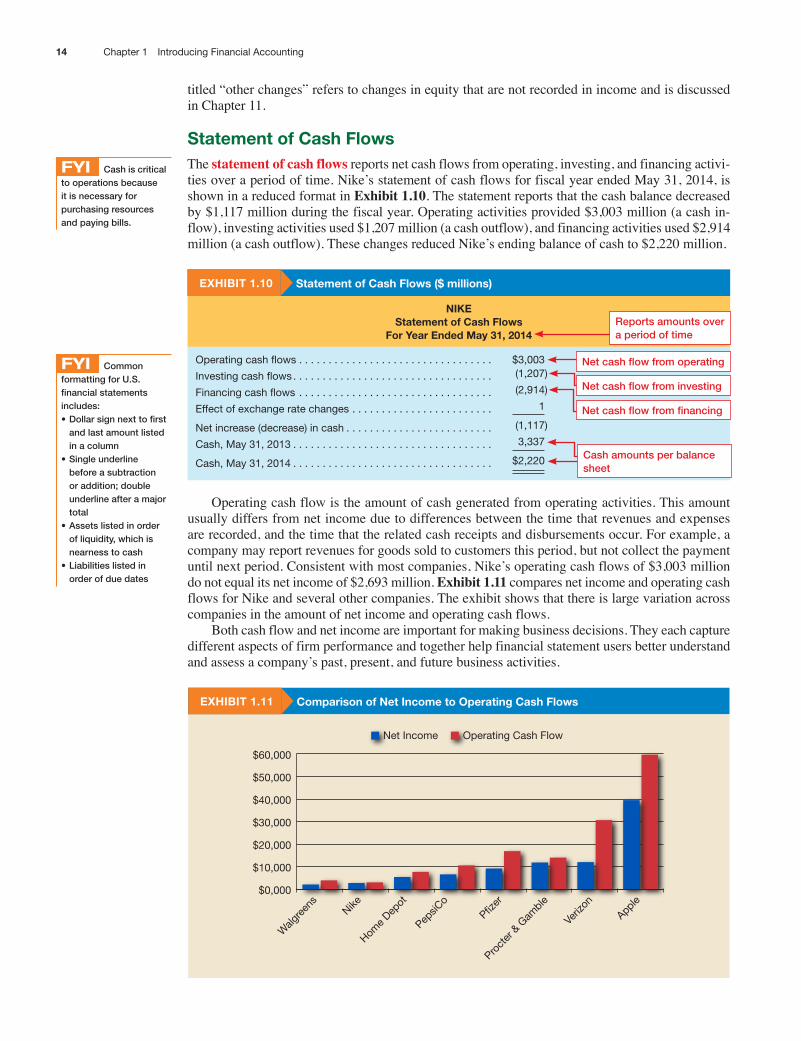
exhibiT 1.7 income statement ($ millions)
nikeincome statement
for year ended may 31, 2014
Revenues . . . . . . . . . . . . . . . . . . . . . . . . . . . . . . . . . . . . . . . . . . $27,799
Expenses . . . . . . . . . . . . . . . . . . . . . . . . . . . . . . . . . . . . . . . . . . 25,106
net income (or loss) . . . . . . . . . . . . . . . . . . . . . . . . . . . . . . . . $ 2,693
exhibiT 1.8 income statement with gross Profit subtotal ($ millions)
nikeincome statement
for year ended may 31, 2014
Revenues . . . . . . . . . . . . . . . . . . . . . . . . . . . . . . . . . . . . . $27,799
2 Cost of goods sold . . . . . . . . . . . . . . . . . . . . . . . . . . . . . . 15,353
5 Gross profit. . . . . . . . . . . . . . . . . . . . . . . . . . . . . . . . . . . . 12,446
2 other expenses including income taxes . . . . . . . . . . . . . 9,753
5 net income (or loss) . . . . . . . . . . . . . . . . . . . . . . . . . . . . . $ 2,693
statement of stockholders’ equityThe statement of stockholders’ equity, or simply statement of equity, reports the changes in the equity accounts over a period of time. nike’s statement of stockholders’ equity for fiscal year ended May 31, 2014, is shown in reduced format as Exhibit 1.9. During the year ended May 31, 2014, nike’s equity changed due to share issuance and income reinvestment. The exhibit details and clas-sifies these changes into three categories:
• Contributed capital (includes common stock, and additional paid-in capital)
• retained earnings (includes cumulative net income or loss, and deducts dividends)
• Other stockholders’ equity
exhibiT 1.9 statement of stockholders’ equity ($ millions)
nikestatement of stockholders’ equity
for year ended may 31, 2014
contributed capital
Retained earnings
other stockholders’
equity
Total stockholders’
equity
balance, may 31, 2013 . . . . . . $5,187 $5,620 $274 $11,081Stock issuance . . . . . . . . . . . . . 523 523net income . . . . . . . . . . . . . . . . 2,693 2,693dividends . . . . . . . . . . . . . . . . . (821) (821)other changes . . . . . . . . . . . . . 158 (2,621) (189) (2,652)
balance, may 31, 2014 . . . . . . $5,868 $4,871 $ 85 $10,824
Contributed capital represents the net amount received from issuing stock to shareholders (owners). Retained earnings (also called earned capital) represents the income the company has earned since its inception, minus the dividends it has paid out to shareholders. Thus, retained earnings equals the amount of income retained in the company. The change in retained earnings links consecutive bal-ance sheets through the income statement. nike’s retained earnings decreased from $5,620 million at May 31, 2013 to $4,871 million at May 31, 2014. This decrease is explained by net income of $2,693 million, less dividends of $821 million and other reductions of $2,621 million. The category
Reports amounts over a period of time
Increase in equity from the sale of products and services to customers
Costs incurred to generate revenues
Cost of products including materials, labor, and overhead
Reports amounts over a period of time
Beginning period amounts
Change in balances over a period
Ending period amounts
FYI Dividends are reported in the statement of equity, and not in the income statement.
13Chapter 1 introducing Financial Accounting
annotations are used to aid learning.
titled “other changes” refers to changes in equity that are not recorded in income and is discussed in Chapter 11.
statement of cash flowsThe statement of cash flows reports net cash flows from operating, investing, and financing activi-ties over a period of time. nike’s statement of cash flows for fiscal year ended May 31, 2014, is shown in a reduced format in Exhibit 1.10. The statement reports that the cash balance decreased by $1,117 million during the fiscal year. Operating activities provided $3,003 million (a cash in-flow), investing activities used $1,207 million (a cash outflow), and financing activities used $2,914 million (a cash outflow). These changes reduced nike’s ending balance of cash to $2,220 million.
exhibiT 1.10 statement of cash flows ($ millions)
nikestatement of cash flows
for year ended may 31, 2014
operating cash flows . . . . . . . . . . . . . . . . . . . . . . . . . . . . . . . . . $3,003
investing cash flows. . . . . . . . . . . . . . . . . . . . . . . . . . . . . . . . . . (1,207)
Financing cash flows . . . . . . . . . . . . . . . . . . . . . . . . . . . . . . . . . (2,914)
Effect of exchange rate changes . . . . . . . . . . . . . . . . . . . . . . . . 1
net increase (decrease) in cash . . . . . . . . . . . . . . . . . . . . . . . . . (1,117)
Cash, May 31, 2013 . . . . . . . . . . . . . . . . . . . . . . . . . . . . . . . . . . 3,337
Cash, May 31, 2014 . . . . . . . . . . . . . . . . . . . . . . . . . . . . . . . . . . $2,220
Operating cash flow is the amount of cash generated from operating activities. This amount usually differs from net income due to differences between the time that revenues and expenses are recorded, and the time that the related cash receipts and disbursements occur. For example, a company may report revenues for goods sold to customers this period, but not collect the payment until next period. Consistent with most companies, nike’s operating cash flows of $3,003 million do not equal its net income of $2,693 million. Exhibit 1.11 compares net income and operating cash flows for nike and several other companies. The exhibit shows that there is large variation across companies in the amount of net income and operating cash flows.
Both cash flow and net income are important for making business decisions. They each capture different aspects of firm performance and together help financial statement users better understand and assess a company’s past, present, and future business activities.
exhibiT 1.11 comparison of net income to operating cash flows
$0,000
$10,000
$20,000
$30,000
$40,000
$50,000
$60,000
Operating Cash FlowNet Income
Home D
epot
PepsiC
o
Veriz
on
Proct
er &
Gam
blePfiz
erNike
Walg
reen
s
Apple
FYI Cash is critical to operations because it is necessary for purchasing resources and paying bills.
Reports amounts over a period of time
FYI Common formatting for U.S. financial statements includes:•Dollarsignnexttofirst
and last amount listed in a column
•Singleunderlinebefore a subtraction or addition; double underline after a major total
•Assetslistedinorderof liquidity, which is nearness to cash
•Liabilitieslistedinorder of due dates
Net cash flow from operating
Net cash flow from investing
Net cash flow from financing
Cash amounts per balance sheet
14 Chapter 1 introducing Financial Accounting
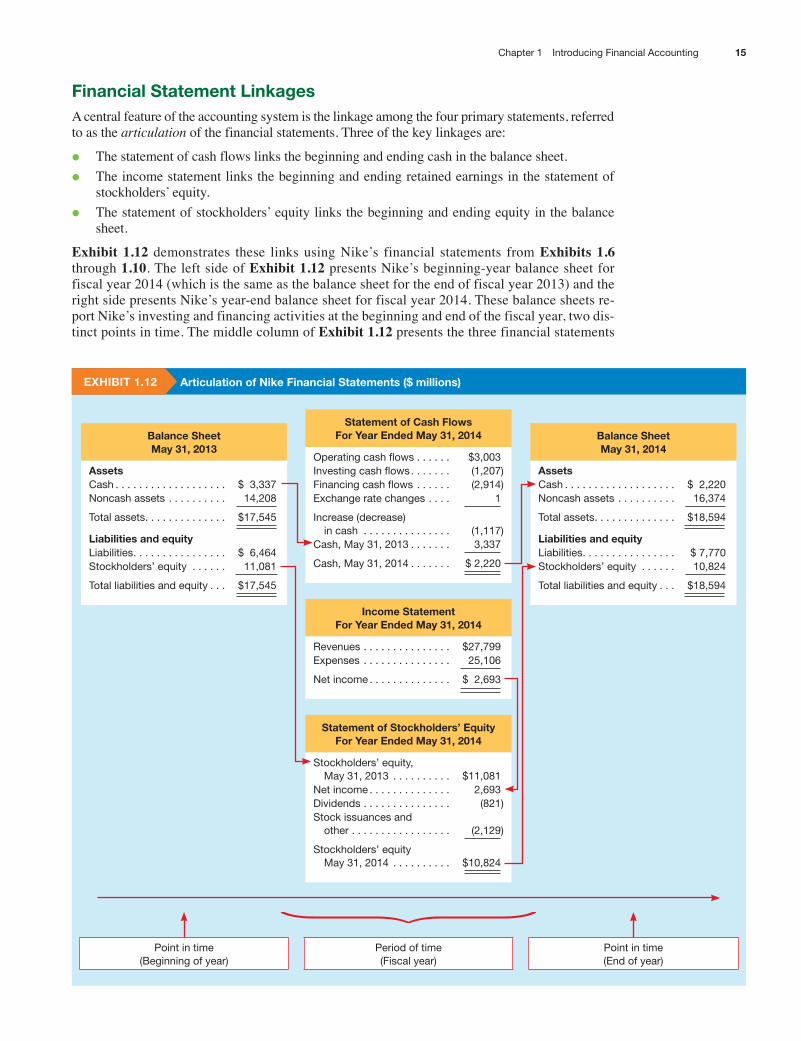
financial statement linkagesA central feature of the accounting system is the linkage among the four primary statements, referred to as the articulation of the financial statements. Three of the key linkages are:
• The statement of cash flows links the beginning and ending cash in the balance sheet.
• The income statement links the beginning and ending retained earnings in the statement of stockholders’ equity.
• The statement of stockholders’ equity links the beginning and ending equity in the balance sheet.
Exhibit 1.12 demonstrates these links using nike’s financial statements from Exhibits 1.6 through 1.10. The left side of Exhibit 1.12 presents nike’s beginning-year balance sheet for fiscal year 2014 (which is the same as the balance sheet for the end of fiscal year 2013) and the right side presents nike’s year-end balance sheet for fiscal year 2014. These balance sheets re-port nike’s investing and financing activities at the beginning and end of the fiscal year, two dis-tinct points in time. The middle column of Exhibit 1.12 presents the three financial statements
exhibiT 1.12 articulation of nike financial statements ($ millions)
statement of cash flowsfor year ended may 31, 2014
operating cash flows . . . . . . $3,003investing cash flows. . . . . . . (1,207)Financing cash flows . . . . . . (2,914)Exchange rate changes . . . . 1
increase (decrease) in cash . . . . . . . . . . . . . . .
(1,117)
Cash, May 31, 2013 . . . . . . . 3,337
Cash, May 31, 2014 . . . . . . . $ 2,220
income statementfor year ended may 31, 2014
Revenues . . . . . . . . . . . . . . . $27,799Expenses . . . . . . . . . . . . . . . 25,106
net income . . . . . . . . . . . . . . $ 2,693
statement of stockholders’ equityfor year ended may 31, 2014
Stockholders’ equity, May 31, 2013 . . . . . . . . . .
$11,081
net income . . . . . . . . . . . . . . 2,693dividends . . . . . . . . . . . . . . . (821)Stock issuances and other . . . . . . . . . . . . . . . . .
(2,129)
Stockholders’ equity May 31, 2014 . . . . . . . . . .
$10,824
balance sheetmay 31, 2013
assetsCash . . . . . . . . . . . . . . . . . . . $ 3,337noncash assets . . . . . . . . . . 14,208
total assets. . . . . . . . . . . . . . $17,545
liabilities and equityLiabilities. . . . . . . . . . . . . . . . $ 6,464Stockholders’ equity . . . . . . 11,081
total liabilities and equity . . . $17,545
balance sheetmay 31, 2014
assetsCash . . . . . . . . . . . . . . . . . . . $ 2,220noncash assets . . . . . . . . . . 16,374
total assets. . . . . . . . . . . . . . $18,594
liabilities and equityLiabilities. . . . . . . . . . . . . . . . $ 7,770Stockholders’ equity . . . . . . 10,824
total liabilities and equity . . . $18,594
Point in time (Beginning of year)
Period of time (Fiscal year)
Point in time (End of year)
15Chapter 1 introducing Financial Accounting
that report nike’s fiscal year 2014 business activities over time: the statement of cash flows, the income statement, and the statement of stockholders’ equity. The three key linkages shown in Exhibit 1.12 are:
• The statement of cash flows explains how operating, financing, and investing activities de-creased the cash balance by $1,117 million, from the $3,337 million reported in the beginning-year balance sheet, to the $2,220 million reported in the year-end balance sheet.
• The net income of $2,693 million reported in the income statement is added to retained earnings in the statement of stockholders’ equity.
• The statement of stockholders’ equity explains how total equity of $11,081 million, reported in the beginning-year balance sheet, becomes total equity of $10,824 million, reported in the year-end balance sheet.
information beyond financial statementsimportant information about a company is communicated to various decision makers through re-ports other than financial statements. These reports include the following:
• Management Discussion and Analysis (MD&A)
• independent Auditor report
• Financial statement footnotes
• regulatory filings, including proxy statements and other seC filings
We describe and explain the usefulness of these additional information sources throughout the book.
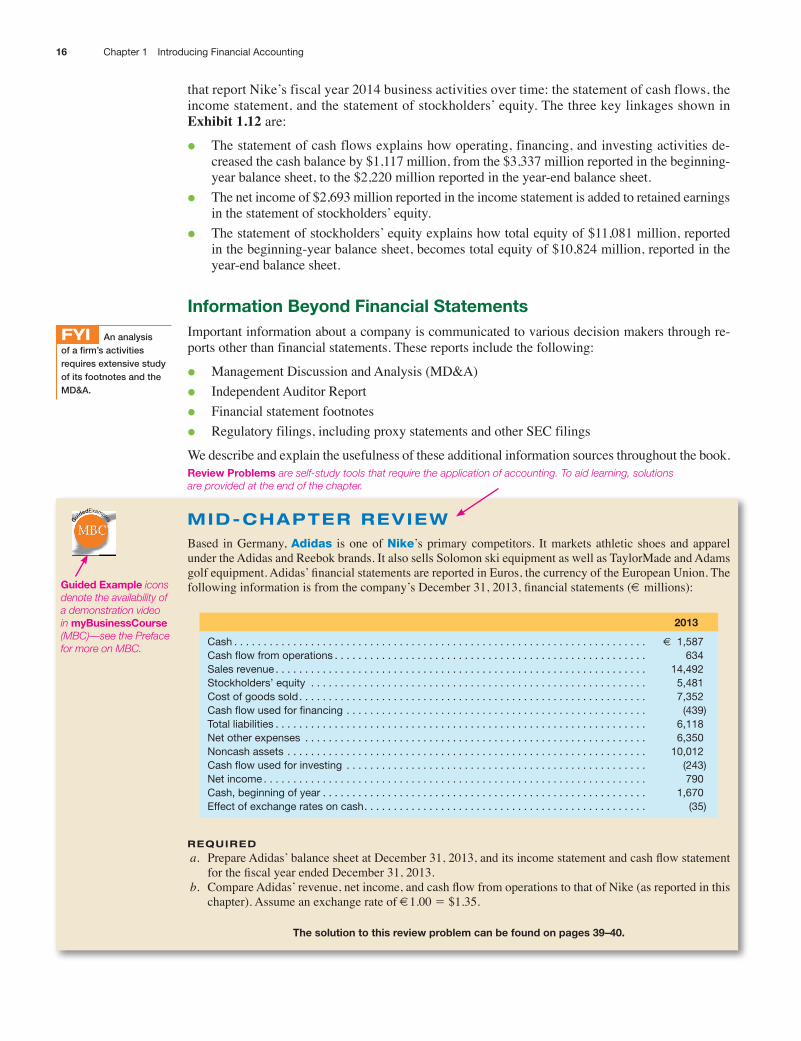
MID-CHAPtEr rEVIEWBased in Germany, Adidas is one of Nike’s primary competitors. it markets athletic shoes and apparel under the Adidas and reebok brands. it also sells solomon ski equipment as well as TaylorMade and Adams golf equipment. Adidas’ financial statements are reported in Euros, the currency of the European Union. The following information is from the company’s December 31, 2013, financial statements (€ millions):
2013
Cash . . . . . . . . . . . . . . . . . . . . . . . . . . . . . . . . . . . . . . . . . . . . . . . . . . . . . . . . . . . . . . . . . . . . . . € 1,587Cash flow from operations . . . . . . . . . . . . . . . . . . . . . . . . . . . . . . . . . . . . . . . . . . . . . . . . . . . . . 634Sales revenue . . . . . . . . . . . . . . . . . . . . . . . . . . . . . . . . . . . . . . . . . . . . . . . . . . . . . . . . . . . . . . . 14,492Stockholders’ equity . . . . . . . . . . . . . . . . . . . . . . . . . . . . . . . . . . . . . . . . . . . . . . . . . . . . . . . . . 5,481Cost of goods sold. . . . . . . . . . . . . . . . . . . . . . . . . . . . . . . . . . . . . . . . . . . . . . . . . . . . . . . . . . . 7,352Cash flow used for financing . . . . . . . . . . . . . . . . . . . . . . . . . . . . . . . . . . . . . . . . . . . . . . . . . . . (439)total liabilities . . . . . . . . . . . . . . . . . . . . . . . . . . . . . . . . . . . . . . . . . . . . . . . . . . . . . . . . . . . . . . . 6,118net other expenses . . . . . . . . . . . . . . . . . . . . . . . . . . . . . . . . . . . . . . . . . . . . . . . . . . . . . . . . . . 6,350noncash assets . . . . . . . . . . . . . . . . . . . . . . . . . . . . . . . . . . . . . . . . . . . . . . . . . . . . . . . . . . . . . 10,012Cash flow used for investing . . . . . . . . . . . . . . . . . . . . . . . . . . . . . . . . . . . . . . . . . . . . . . . . . . . (243)net income . . . . . . . . . . . . . . . . . . . . . . . . . . . . . . . . . . . . . . . . . . . . . . . . . . . . . . . . . . . . . . . . . 790Cash, beginning of year . . . . . . . . . . . . . . . . . . . . . . . . . . . . . . . . . . . . . . . . . . . . . . . . . . . . . . . 1,670Effect of exchange rates on cash. . . . . . . . . . . . . . . . . . . . . . . . . . . . . . . . . . . . . . . . . . . . . . . . (35)
rEquIrED
a. Prepare Adidas’ balance sheet at December 31, 2013, and its income statement and cash flow statement for the fiscal year ended December 31, 2013.
b. Compare Adidas’ revenue, net income, and cash flow from operations to that of Nike (as reported in this chapter). Assume an exchange rate of €1.00 5 $1.35.
The solution to this review problem can be found on pages 39–40.
FYI An analysis of a firm’s activities requires extensive study of its footnotes and the MD&A.
MBC
Guid
edExamples
16 Chapter 1 introducing Financial Accounting
Review Problems are self-study tools that require the application of accounting. To aid learning, solutions are provided at the end of the chapter.
guided example icons denote the availability of a demonstration video in mybusinesscourse (MBC)—see the Preface for more on MBC.

financial RePoRTing enViRonmenTinformation presented in financial statements is of critical importance to external decision makers. Financial statements affect the prices paid for equity securities and interest rates attached to debt securities. To the extent that financial performance and condition are accurately communicated to business decision makers, debt and equity securities are more accurately priced. By extension, fi-nancial reporting plays a crucial role in efficient resource allocation within and across economies. Accounting information contributes to the efficient operation of securities markets, labor markets, commodity markets, and other markets.
To illustrate, imagine the consequences of a breakdown in the integrity of financial report-ing. The enron scandal provides a case in point. At the beginning of 2001, Enron was one of the more, if not the most, innovative and respected companies in the united states. With revenues of over $l00 billion and total company value of over $60 billion, it was the fifth largest u.s. corporation based on market value. in October 2001, the company released its third quarter earn-ings report to the public. Although operating earnings were higher than in previous years, the income statement contained a $1 billion “special charge.” Financial analysts began investigat-ing the cause of this charge and discovered that it was linked to related-party transactions and questionable accounting practices. Once it became clear to the capital markets that enron had not faithfully and accurately reported its financial condition and performance, people became unwilling to purchase its securities. The value of its debt and equity securities dropped precipi-tously and the company was unable to obtain the cash needed for operating activities. By the end of 2001, enron was bankrupt!
The enron case illustrates the importance of reliable financial reporting. Accountants recognize the importance of the information that they produce and, as a profession, they agree to follow a set of standards for the presentation of financial statements and the disclosure of related financial information. in the following paragraphs, we discuss these standards, or principles, as well as the institutional and regulatory environment in which accountants operate.
generally accepted accounting PrinciplesDecision makers who rely on audited financial statements expect that all companies follow similar procedures in preparing their statements. in response to these expectations, u.s. accountants have developed a set of standards and procedures called generally accepted accounting principles (GAAP). GAAP is not a set of immutable laws. instead, it is a set of standards and accepted prac-tices, based on underlying principles, that are designed to guide the preparation of the financial statements. GAAP is subject to change as conditions warrant. As a result, specific rules are altered or new practices are formulated to fit changes in underlying economic circumstances or business transactions.
some people mistakenly assume that financial accounting is an exact discipline—that is, com-panies select the proper standard to account for a transaction and then follow the rules. The real-ity is that GAAP allows companies considerable discretion in preparing financial statements. The choice of methods often yields financial statements that are markedly different from one company to another in terms of reported income, assets, liabilities, and equity amounts. in addition, financial statements depend on numerous estimates. Consequently, even though two companies may engage in the same transactions and choose the same accounting methods, their financial statements will differ because their managements have made different estimates about such things as the amount to be collected from customers who buy on credit, the length of time that buildings and equipment will be in use, and the future costs for product warranties.
Accounting standard setters walk a fine line regarding choice in accounting. On one hand, they are concerned that management discretion in preparing financial statements will lead to abuse by those seeking to influence the decisions of those who rely on the statements. On the other hand, they are concerned that companies are too diverse for a “one size fits all” financial accounting system. ultimately, GAAP attempts to strike a balance by imposing constraints on the choice of accounting procedures, while allowing companies some flexibility within those constraints.
lo4 describe the institutions that regulate financial accounting and their role in establishing generally accepted accounting principles.
MBCeLectures
4
17Chapter 1 introducing Financial Accounting
learning objectives are repeated at the start of the section covering that topic.
yoU make The call
you are a financial analyst Accountants, business leaders, and politicians have long debated the importance of considering the economic consequences of accounting standards (GAAP). Should ac-counting standards be designed to influence behavior and affect social or economic change considered by, say, a government body or other interested group? Alternatively, should such standards be designed simply to provide relevant and reliable information on which economic decisions can be made by oth-ers with a reasonable degree of confidence? What do you believe the objectives of financial reporting should be? [Answers on page 29.]
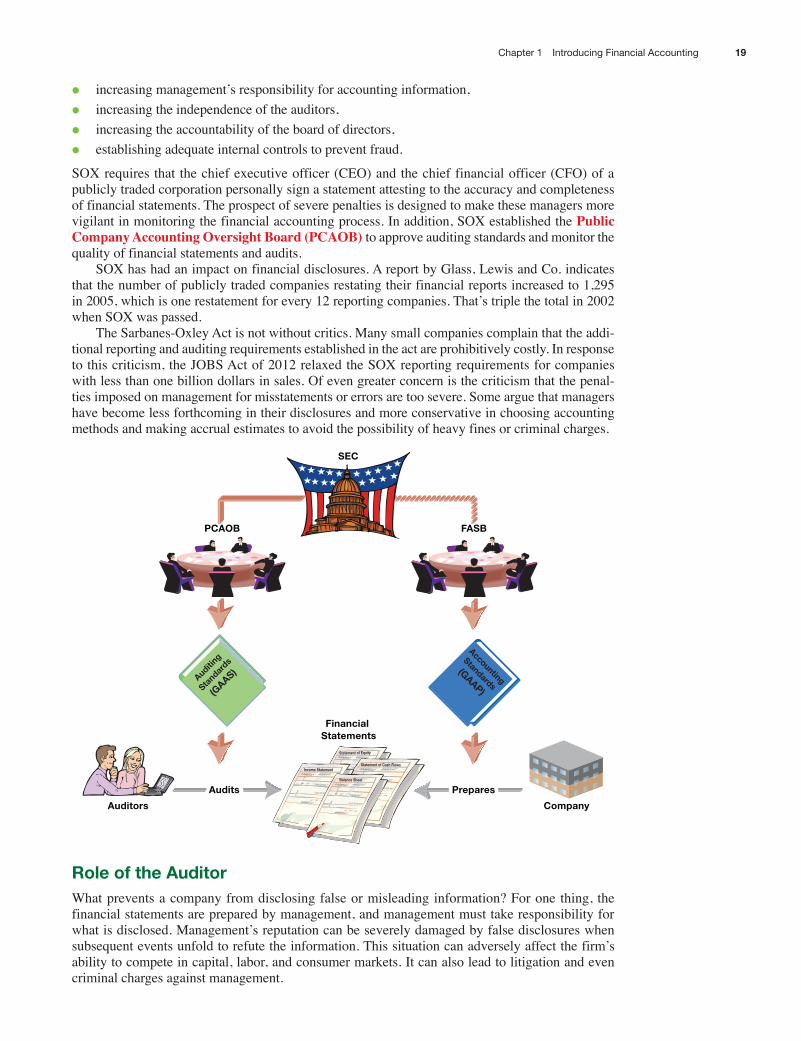
Regulation and oversightFollowing the u.s. stock market crash of 1929, the united states Congress passed the securities Acts of 1933 and 1934. These acts were passed to require disclosure of financial and other informa-tion about securities being offered for public sale and to prohibit deceit, misrepresentations, and other fraud in the sale of securities. The 1934 Act created the Securities and Exchange Commis-sion (SEC) and gave it broad powers to regulate the issuance and trading of securities. The act also provided that companies with more than $10 million in assets and whose securities are held by more than 500 owners must file annual and other periodic reports, including a complete set of financial statements.
While the seC has ultimate authority over financial reporting by companies in the united states, it has ceded the task of setting accounting standards to a professional body, the American Institute of Certified Public Accountants (AICPA). Over the years, this process has resulted in three standard-setting organizations.
Currently, accounting standards are established by the Financial Accounting Standards Board (FASB). The FAsB is a seven-member board that has the primary responsibility for setting financial accounting standards in the united states. it has published over 160 accounting statements governing the preparation of financial reports. These, along with numerous bulletins, interpretations, opinions, and earlier standards form the body of GAAP.
bUsiness insighT
accounting can be complicated—but rule-makers are trying to make it a little simpler.the Financial Accounting Standards Board, which sets accounting rules for U.S. companies, is expand-ing its effort to simplify some areas of accounting to make financial reporting a little less complex and reduce costs for companies and their accountants. the FASB has added five more projects it plans to tackle as part of that initiative, covering areas like how companies report their debt and when they record taxes on certain transactions.
the projects are low-hanging fruit—relatively narrow, straightforward changes in accounting that clearly would help reduce complexity and that the board expects to be able to make relatively quickly, without the years of work that often accompany major revisions in accounting rules.
“Complexity in accounting can be costly to both investors and companies,” FASB Chairman Russ Golden said. the simplification initiative, which FASB began in June 2014, “is focused on identifying areas that we can address quickly and effectively, without compromising the quality of information pro-vided to investors.”
Besides setting standards for financial accounting, the FAsB has developed a framework to form the basis for future discussion of proposed standards and serve as a guide to accountants for reporting information that is not governed by specific standards. A summary of this Conceptual Framework is presented in Appendix 1A at the end of this chapter.
in the wake of the enron, Tyco, AOl, Global Crossing, halliburton, Xerox, Adelphia, Bristol-Myers squibb, and WorldCom scandals, concerns over the quality of corporate financial reporting led Congress to pass the Sarbanes-Oxley Act in 2002. The goal of this Act—sometimes referred to as sOX—was to increase the level of confidence that external users, particularly investors, have in the financial statements. To accomplish this objective, sOX imposed a number of requirements to strengthen audit committees and improve deficient internal controls by:
18 Chapter 1 introducing Financial Accounting
• increasing management’s responsibility for accounting information,
• increasing the independence of the auditors,
• increasing the accountability of the board of directors,
• establishing adequate internal controls to prevent fraud.
sOX requires that the chief executive officer (CeO) and the chief financial officer (CFO) of a publicly traded corporation personally sign a statement attesting to the accuracy and completeness of financial statements. The prospect of severe penalties is designed to make these managers more vigilant in monitoring the financial accounting process. in addition, sOX established the Public Company Accounting Oversight Board (PCAOB) to approve auditing standards and monitor the quality of financial statements and audits.
sOX has had an impact on financial disclosures. A report by Glass, lewis and Co. indicates that the number of publicly traded companies restating their financial reports increased to 1,295 in 2005, which is one restatement for every 12 reporting companies. That’s triple the total in 2002 when sOX was passed.
The sarbanes-Oxley Act is not without critics. Many small companies complain that the addi-tional reporting and auditing requirements established in the act are prohibitively costly. in response to this criticism, the JOBs Act of 2012 relaxed the sOX reporting requirements for companies with less than one billion dollars in sales. Of even greater concern is the criticism that the penal-ties imposed on management for misstatements or errors are too severe. some argue that managers have become less forthcoming in their disclosures and more conservative in choosing accounting methods and making accrual estimates to avoid the possibility of heavy fines or criminal charges.
Company
PreparesPrepares
Auditing
Standar
ds
(GAAS)
PCAOB
Auditors
AuditsAudits
Accounting
Standards
(GAAP)
FASB
Statement of Equity
Statement of Cash FlowsIncome Statement
Balance Sheet
Financial Statements
SEC
Role of the auditorWhat prevents a company from disclosing false or misleading information? For one thing, the financial statements are prepared by management, and management must take responsibility for what is disclosed. Management’s reputation can be severely damaged by false disclosures when subsequent events unfold to refute the information. This situation can adversely affect the firm’s ability to compete in capital, labor, and consumer markets. it can also lead to litigation and even criminal charges against management.
19Chapter 1 introducing Financial Accounting

even though management must personally attest to the accuracy and completeness of the finan-cial statements, markets also demand assurances from independent parties. Therefore, the financial statements of publicly traded corporations must be audited by an independent audit firm. The auditors provide an opinion as to whether the statements present fairly and in all material respects a company’s financial condition and the results of its operations.
The audit opinion is not a guarantee. Auditors only provide reasonable assurance that the fi-nancial statements are free of material misstatements. even so, auditors provide a valuable service. Auditors effectively ensure that the information contained in the financial statements is reliable, thus increasing the confidence of outside decision makers in the information they use to make invest-ment, credit, and other decisions. Therefore, creditors and shareholders of privately held corpora-tions often demand that the financial statements be audited as well.
Public corporations are required to establish audit committees whose purpose is not to audit but, rather, to appoint the audit firm and assure that what is learned in the audit is disclosed to the firm’s directors and shareholders.
yoU make The call
you are a member of the board of Directors Until recently accounting firms were permitted to earn money for consulting activities performed for clients they audited. do you see any reason why this might not be an acceptable practice? do you see any advantage to your firm from allowing such activ-ity? [Answer on page 29.]
a global PerspectiveBusinesses increasingly operate in global markets. Consumers and businesses with access to the internet can purchase products and services from anywhere in the world. Products produced in one country are often made with parts and materials imported from many different countries. Businesses outsource parts of operations to other countries to take advantage of better labor markets in those countries. Capital markets are global as well. Corporations whose securities trade on the new York stock exchange may also trade on exchanges in london, Toronto, Tokyo, or hong Kong.
Because countries have a variety of laws and customs, accounting principles and practices vary considerably from one country to the next. Many companies based in countries other than the united states choose to present financial statements that conform to u.s. GAAP because they believe that doing so provides them better access to investors in the u.s. capital markets. Many other companies prepare financial statements following GAAP of the country in which they are based.
The globalization of capital markets, combined with the diversity of international accounting principles, has led to an effort to increase comparability of financial information across countries. The International Accounting Standards Board (IASB) oversees the development of accounting standards outside the united states. Over 100 countries, including those in the european union, require the use of International Financial Reporting Standards (IFRS) developed by the iAsB. The intention is to unify all public companies under one global set of reporting standards.
early in the 2000s, the Financial Accounting standards Board (FAsB) and the iAsB com-mitted to developing the highest-quality standards useable for both domestic and cross-border financial reporting and to assure the standards would (a) be fully compatible as soon as practi-cable and (b) maintain that compatibility. in May 2011, the seC proposed a transition method to incorporate iFrs into the u.s. reporting system but did not delineate a definitive time for implementation. A number of large international companies now issue iFrs-compliant financial statements, however without reconciling them with u.s. GAAP as previously required. statements prepared under iFrs and u.s. GAAP are quite similar, yet important differences remain. For example, balance sheets prepared under iFrs often classify assets in reverse order of liquidity to those prepared under GAAP. Thus, intangible assets are listed first and cash last on the balance sheet. Both approaches require the same basic set of four financial statements, with explanatory footnotes. We shall examine some of the more important differences under a Global Perspective heading as they arise in future chapters. Websites maintained by the larger accounting firms as well as both the FAsB and iAsB provide considerable information.
20 Chapter 1 introducing Financial Accounting
Because it is international in its scope, the iAsB has no legal authority to impose accounting standards on any country. however, by working with standard setters within countries, such as the FAsB within the united states, the iAsB is working to reduce diversity in financial reporting practice. Despite the push for comparability, not everyone is convinced that iFrs will improve the usefulness of accounting information. As one observer put it, “There is a real risk of a veneer of comparability that hides a lot of differences.” A number of countries—over 30 at last count—have reserved the right to adopt exceptions to iFrs when they deem them to be appropriate. Perhaps this helps explain why the seC on July 13, 2012, declined to recommend iFrs for adoption by the united states.
a global PeRsPecTiVe
Prior to 2007, foreign-based companies wishing to sell securities in the United States were required to rec-oncile their financial statements to be consistent with U.S. GAAP. however, in June 2007, the SEC adopted a rule that allows foreign companies using international accounting standards to stop reconciling their finan-cial statements to American rules. While this change made it easier for U.S. investors to purchase securities from around the world, a New York Times article referred to a “tower of Babel in Accounting.” the article raises concerns about the difficulty of comparing companies when their financial statements are based on diverse reporting standards. the situation is complicated by the fact that a number of developing countries have reserved the right to adopt exceptions to iFRS when deemed appropriate.
analyzing financial sTaTemenTsThe financial statements provide insights into the financial health and performance of a company. however, the accounting data presented in these statements are difficult to interpret in raw form. For example, knowing that nike’s net income was $2,693 million in 2014 is, by itself, not very use-ful. similarly, knowing the dollar amount of liabilities does not tell us whether or not nike relies too heavily on creditor financing.
Financial analysts use a number of tools to help interpret the information found in the financial statements. They look at trends over time and compare one company to another. They calculate ra-tios using financial statement information to summarize the data in a form that is easier to interpret. ratios also allow us to compare the performance and condition of different companies even if the companies being compared are dramatically different in size. ratios also help analysts spot trends or changes in performance over time.
Throughout the book, we introduce ratios that are commonly used by financial analysts and other users who rely on the financial statements. Our goal is to develop an understanding of how to effectively use the information in the financial statements, as well as to demonstrate how these statements are prepared. in this chapter we introduce one important measure of profitability and one measure of financial risk.
Profitability analysisProfitability reveals whether or not a company is able to bring its product or service to the market in an efficient manner, and whether the market values that product or service. Companies that are consistently unprofitable are unlikely to succeed in the long run.
A key profitability metric for stockholders and other decision makers is company return on equity. This metric compares the level of net income with the amount of equity financing used to generate that income.
analysis objectiveWe are trying to determine nike’s ability to earn a return for its stockholders.
analysis Tool return on equity
55Return on equity Net incomeAverage stockholders’ equity
lo5 Compute two key ratios that are commonly used to assess profitability and risk—return on equity and the debt-to-equity ratio.
MBCeLectures
5
21Chapter 1 introducing Financial Accounting
global Perspectives examine issues related to similarities and differences in accounting practices of the U.S. and other countries.
Each chapter includes a section on analyzing financial statements to emphasize the use of accounting information in making business decisions.
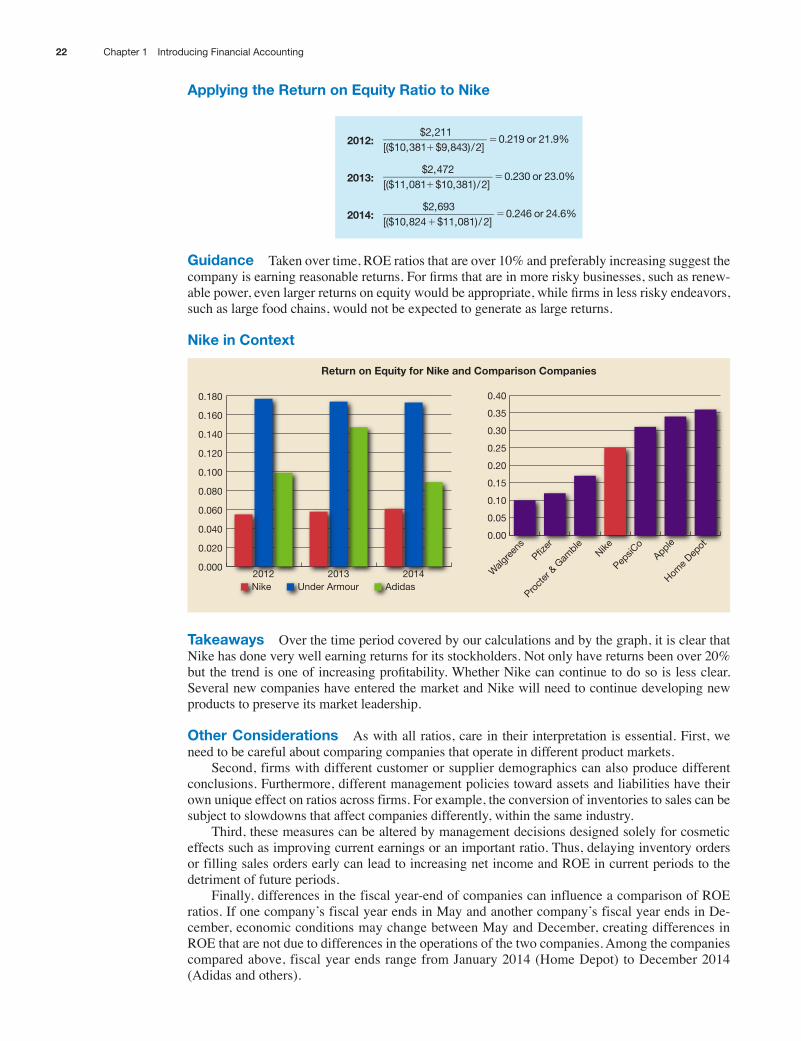
applying the Return on equity Ratio to nike
2012:$2,211
[($10,381 $9,843)/2]0.219 or 21.9%
15
2013:$2,472
[($11,081 $10,381)/2]0.230 or 23.0%
15
2014:$2,693
[($10,824 $11,081)/2]0.246 or 24.6%
15
guidance Taken over time, rOe ratios that are over 10% and preferably increasing suggest the company is earning reasonable returns. For firms that are in more risky businesses, such as renew-able power, even larger returns on equity would be appropriate, while firms in less risky endeavors, such as large food chains, would not be expected to generate as large returns.
nike in context
Return on equity for nike and comparison companies
0.000
0.020
0.040
0.060
0.080
0.100
0.120
0.140
0.160
0.180
201420132012
0.00
0.05
0.10
0.15
0.20
0.25
0.30
0.35
0.40
Walg
reen
s
Proct
er &
Gam
bleNike
Apple
Home D
epot
PepsiC
oPfiz
er
Under Armour AdidasNike
Takeaways Over the time period covered by our calculations and by the graph, it is clear that nike has done very well earning returns for its stockholders. not only have returns been over 20% but the trend is one of increasing profitability. Whether Nike can continue to do so is less clear. several new companies have entered the market and nike will need to continue developing new products to preserve its market leadership.
other considerations As with all ratios, care in their interpretation is essential. First, we need to be careful about comparing companies that operate in different product markets.
second, firms with different customer or supplier demographics can also produce different conclusions. Furthermore, different management policies toward assets and liabilities have their own unique effect on ratios across firms. For example, the conversion of inventories to sales can be subject to slowdowns that affect companies differently, within the same industry.
Third, these measures can be altered by management decisions designed solely for cosmetic effects such as improving current earnings or an important ratio. Thus, delaying inventory orders or filling sales orders early can lead to increasing net income and rOe in current periods to the detriment of future periods.
Finally, differences in the fiscal year-end of companies can influence a comparison of rOe ratios. if one company’s fiscal year ends in May and another company’s fiscal year ends in De-cember, economic conditions may change between May and December, creating differences in rOe that are not due to differences in the operations of the two companies. Among the companies compared above, fiscal year ends range from January 2014 (home Depot) to December 2014 (Adidas and others).
22 Chapter 1 introducing Financial Accounting
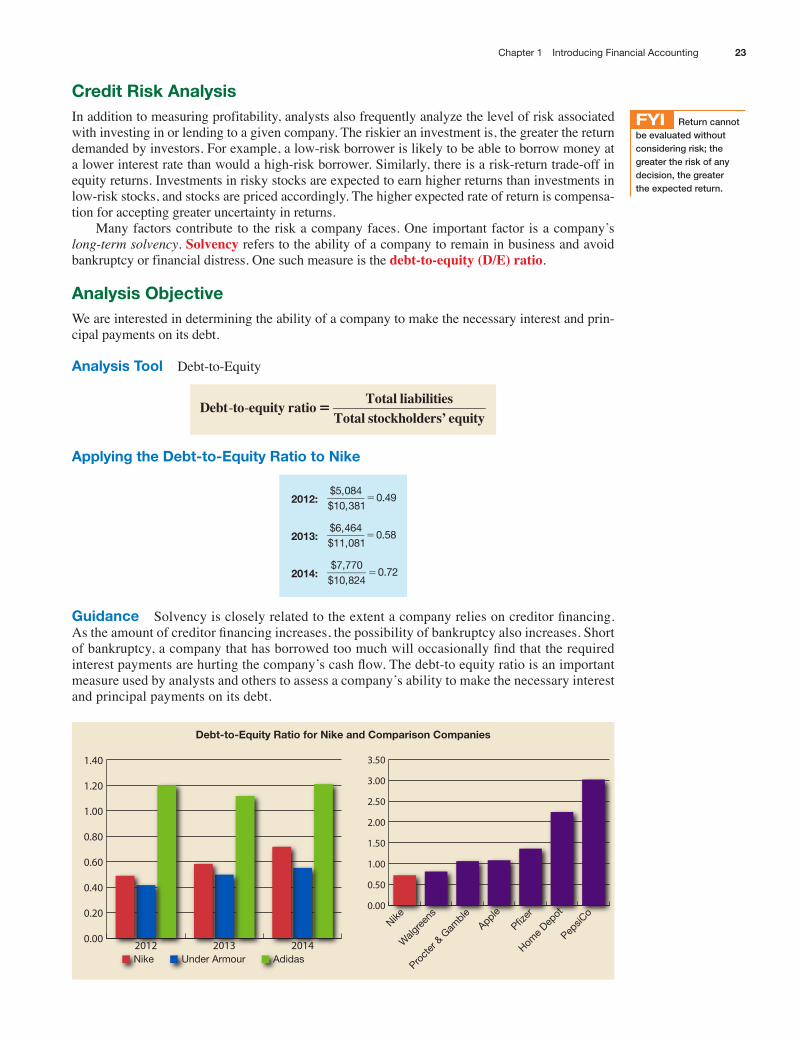
credit Risk analysisin addition to measuring profitability, analysts also frequently analyze the level of risk associated with investing in or lending to a given company. The riskier an investment is, the greater the return demanded by investors. For example, a low-risk borrower is likely to be able to borrow money at a lower interest rate than would a high-risk borrower. similarly, there is a risk-return trade-off in equity returns. investments in risky stocks are expected to earn higher returns than investments in low-risk stocks, and stocks are priced accordingly. The higher expected rate of return is compensa-tion for accepting greater uncertainty in returns.
Many factors contribute to the risk a company faces. One important factor is a company’s long-term solvency. Solvency refers to the ability of a company to remain in business and avoid bankruptcy or financial distress. One such measure is the debt-to-equity (D/E) ratio.
analysis objectiveWe are interested in determining the ability of a company to make the necessary interest and prin-cipal payments on its debt.
analysis Tool Debt-to-equity
55Debt to equity ratio Total liabilitiesTotal stockholders’ equity
- -
applying the Debt-to-equity Ratio to nike
2012:$5,084$10,381
0.495
2013:$6,464$11,081
0.585
2014:$7,770
$10,8240.725
guidance Solvency is closely related to the extent a company relies on creditor financing. As the amount of creditor financing increases, the possibility of bankruptcy also increases. Short of bankruptcy, a company that has borrowed too much will occasionally find that the required interest payments are hurting the company’s cash flow. The debt-to equity ratio is an important measure used by analysts and others to assess a company’s ability to make the necessary interest and principal payments on its debt.
Debt-to-equity Ratio for nike and comparison companies
0.00
0.20
0.40
0.60
0.80
1.00
1.20
1.40
201420132012
0.00
0.50
1.00
1.50
2.00
2.50
3.00
3.50
Nike
Walg
reen
s
Proct
er &
Gam
bleApple
Pfizer
Home D
epot
PepsiC
o
Under Armour AdidasNike
FYI Return cannot be evaluated without considering risk; the greater the risk of any decision, the greater the expected return.
23Chapter 1 introducing Financial Accounting

A debt-to equity ratio of one indicates that the company is using equal parts of debt and equity financing. nike’s borrowing has consistently been less than half its assets, resulting in a ratio sub-stantially below one.
The appropriate D/e ratio level depends on the nature of the business and will differ appreci-ably as can be seen in the chart below. Typically, firms with large long-term commitments often reflected in fixed assets will find it appropriate to raise more capital through borrowing. The amount of debt relative to equity will also mirror the risk tolerance of the firm’s management. if manage-ment believes it can earn a return above the debt interest cost, borrowing will increase the expected return to the owners.
Takeaways nike’s D/e ratio has increased slightly over the three years presented. nike’s liabilities have been steadily increasing. Yet, stockholders’ equity has not increased at the same pace, and in fact it declined in 2014. nevertheless, nike’s D/e ratio remains low, which is rea-sonable given nearly all its production is carried out overseas.
other considerations Comparisons with other companies in similar lines of business, such as under Armour and Adidas, are always appropriate. new competitors, such as Quiksilver, could also prove insightful to examine in regards to strategic decisions. in Chapter 9, we will explore the accounting for liabilities in more depth. Balance sheets do not always recognize all obligations of a firm, and a careful reader will examine the footnotes to get a more complete pic-ture of financial health in such comparisons. Nike might also consider increasing its debt level if profitable opportunities exist. The company has been, and remains, very successful, but new entrants are emerging indicating there is additional business to be had.
The graph shows that nike had the lowest debt-to-equity ratio among this group of firms, fol-lowed closely by Walgreens. in contrast, PepsiCo had a debt-to-equity ratio of approximately 3.0. PepsiCo financed 75% of its assets with debt.
There are other measures of profitability and risk that will be introduced in later chapters. Collectively, these ratios, when placed in the context of the company’s business activities, help to provide a clear picture of the drivers of a company’s financial performance and the factors affecting its financial condition. understanding these performance drivers and their impact on the financial health of a company is key to effectively using the information presented in the financial statements.
oRganizaTion of The bookin the pages that follow Chapter 1, we will explore the financial accounting model and how it re-flects an organization’s activities and events. Chapters 2 and 3 are focused on building the balance sheet and the income statement from transactions and a set of required adjustments. This process requires a structure for “bookkeeping” and also an understanding of the basic rules of the accounting language. When do we recognize revenue? When do we recognize an asset? We will look at these questions in a relatively simple setting.
in Chapter 4, we will construct the statement of cash flows. The balance sheet, income state-ment, and statement of cash flows are all built on the same underlying set of information, and they are each designed to give a different perspective on what’s going on in the company. Chapter 5 shows how managers and investors organize financial information using ratios and how managers and investors use those ratios to compare companies and to make forecasts of the future.
While the first five chapters build the financial statement structure and its interpretation, the latter seven chapters are more topical. Accounting is not a cut-and-dried process, and financial re-ports can be affected by a variety of management decisions. so these seven chapters explore more sophisticated settings and analyses. We will find that financial reports rely on management estimates of future events, and that sometimes management has the freedom to choose accounting methods that affect income and assets. And, when accounting practices don’t allow reporting discretion, management’s choice of transactions can make financial reports look more favorable.
Becoming an effective user of financial information requires an understanding of how the financial reports fit together and a willingness to explore the footnote material to look for useful information. As we progress through Financial Accounting together, we will show you how to become a sophisticated reader of financial reports by looking at real companies and real financial statement information.
24 Chapter 1 introducing Financial Accounting
CHAPtEr-END rEVIEW
Adidas, a major competitor of nike, markets athletic shoes and apparel under the Adidas and reebok brands. it also sells solomon ski equipment and TaylorMade golf equipment. The following information is from Adidas’ 2013 financial statements (Adidas’ financial statements are reported in Euros, the currency of the european union):
(millions) adidas
net income (loss) (2013). . . . . . . . . . . . . . . . . . . . . . . . . . . . . . . . . . . . . . . . . . . . . . . . . . . . . . € 790Stockholders’ equity (2013 year-end). . . . . . . . . . . . . . . . . . . . . . . . . . . . . . . . . . . . . . . . . . . . 5,481Stockholders’ equity (2012 year-end). . . . . . . . . . . . . . . . . . . . . . . . . . . . . . . . . . . . . . . . . . . . 5,291total liabilities (2013 year-end) . . . . . . . . . . . . . . . . . . . . . . . . . . . . . . . . . . . . . . . . . . . . . . . . . 6,118
rEquIrED
a. Calculate the 2013 return on equity (rOe) ratio for Adidas. b. Calculate the 2013 debt-to-equity ratio for Adidas. c. Compare the profitability and risk of Adidas to that of Nike.
The solution to this review problem can be found on page 40.
aPPenDix 1a: Conceptual Framework for Financial Reporting
Accountants establish GAAP to ensure that the financial statements published by a company reflect its eco-nomic condition and performance. To meet this objective, the FAsB sets accounting standards that reduce management discretion for reporting much of the information in the financial statements. To provide a struc-ture for considering future standards, as well as to guide accountants in areas where standards do not cur-rently exist, the FAsB has developed a conceptual framework. This conceptual framework includes, among other things, a statement of the objectives of financial reporting along with a discussion of the qualitative characteristics of accounting information that are important to users. We discuss these objectives and char-acteristics in this appendix, along with some of the important assumptions underlying the preparation of fi-nancial statements.
objectives of financial ReportingA fundamental goal of financial accounting is to provide information that promotes the efficient allocation and use of economic resources. To this end, the FASB established several objectives of financial reporting which are summarized here.
• Financial accounting should provide information that is useful to investors, creditors, and other decision makers who possess a reasonable knowledge of business activities and accounting.
• Financial accounting should provide information to help investors and creditors assess the amount, timing, and uncertainty of cash flows. This includes the information presented in the cash flow statement as well as other information that might help investors and creditors assess future dividend and debt payments.
• Financial accounting should provide information about economic resources and financial claims on those resources. This includes the information in the balance sheet and any supporting information that might help the user assess the value of the company’s assets and future obligations.
• Financial accounting should provide information about a company’s financial performance, including net income and its components (i.e., revenues and expenses).
• Financial accounting should provide information that allows decision makers to monitor company man-agement to evaluate their effective, efficient, and ethical stewardship of company resources.
Qualitative characteristics of accounting informationQualitative characteristics of useful accounting information were developed to help managers, accountants, auditors, and standard setters make reasonable choices among accounting alternatives. These qualitative characteristics are depicted in Exhibit 1A.1 and discussed below.
MBC
Guid
edExamples
lo6 Explain the conceptual framework for financial reporting.
MBCeLectures
6
FYI The FASB and the IASB are currently working to create a common conceptual framework that will guide firms reporting under International Financial Reporting Standards (IFRS).
25Chapter 1 introducing Financial Accounting

exhibiT 1a.1 Qualitative characteristics of accounting information
Verifiability
Neutrality
Materiality
Benefits > Costs
Understandability
Decision Usefulness
Relevance
Timeliness Representationalfaithfulness
Predictive value
Feedback value
ConsistencyComparability
Reliability
Exhibit 1A.1 neither distinguishes between primary and secondary qualities nor does it assign priorities among the qualities. It is an explanatory device and must be applied with consideration of the specific ap-plication intended. each of the qualities is essential in some degree, but that degree will differ depending on the circumstances. We now expand briefly on each of the qualities delineated in the exhibit.
benefits > costs reported accounting information must be cost-effective. This characteristic implies that if the benefit to the economy does not exceed the cost, the information does not meet the test of useful-ness. The operational difficulty with this information quality is that while the reporting cost can usually be ascertained, the benefit to information users is often difficult to quantify. Nevertheless, the need to weigh costs and benefits is seen as an overriding constraint on the financial reporting process.
materiality Materiality refers to whether or not a particular amount is large enough to affect a decision. some items are not reported based on this constraint because they are considered not material in that the magnitude of the omission would not influence the judgment of a reasonable decision maker. In practice, materiality is typically judged by the relative size of an item related to a major reported variable such as total assets, sales revenues, or net income. however, some items are required to meet a lower threshold of materiality. The more critical an item is to understanding the condition and performance of the company, the finer the screen that should be used to determine whether or not it is material.
Understandability and Decision Usefulness Accounting information should be presented so that a knowledgeable reader can understand how it relates to the decision problem at hand. Because different users will require different information, suppliers (standard setters) must tread a fine line between reporting (requiring) too much or too little information.
bUsiness insighT
What is material? The Wall Street Journal recently reported that the SEC initiated an informal inquiry into Pixar Animation Studios concerning its disclosure of “heavier than expected returns of its The Incredibles dVd that forced the Emeryville, California-based studio to miss its second quarter earnings forecast.” this inquiry follows an informal SEC investigation of DreamWorks Animation, the filmmaker that twice reduced earnings forecasts after substantial returns of its Shrek 2 dVd. the issue in these two cases is whether companies are under obligation to inform market participants of material events affect-ing earnings. the Journal points out that “in the wave of recent corporate scandals, some companies have been more conservative in assessing what constitutes a material event.”
26 Chapter 1 introducing Financial Accounting
Relevance Accounting information must have the ability to make a difference in a decision. such informa-tion may be useful in making predictions about future performance of the company or in providing feedback to evaluate past events. in either case, the timeliness of the disclosure is paramount to its relevance.
• Timeliness: The information must be available to decision makers before it loses its capacity to in-fluence decisions. That is, information that is reported after a decision is made is not relevant to that decision.
• Predictive value: refers to the ability of the information to increase the accuracy of a forecast.
• Feedback value: Refers to the quality of information that enables users to confirm or correct prior expectations.
ReseaRch insighT
Research has documented a decline in the value relevance of accounting information, particularly earn-ings, over the past few decades. the decline has been attributed by some to conservatism in reporting. however, recent research has not been able to establish an association between this decrease in value relevance and conservatism despite using several alternative measures of conservative accounting. one explanation offered for the research finding is that conservatism favors more objective measures while avoiding additional estimation, thereby increasing reliability. if true, conservative accounting measure-ment could lead to greater relevance. the issue remains unresolved at this time and conservatism in reporting continues.
Reliability Accounting information should be accurate and free of misstatement or bias. it must be rea-sonably neutral, verifiable, and possess representational faithfulness.
• Representational faithfulness: Accounting information should reflect the underlying economic events it purports to measure.
• Verifiability: This characteristic implies that consensus among measures assures that the information is free of error. An independent auditor should be able to examine the economic events and transactions underlying the financial statements and reach conclusions that are similar to those of management con-cerning how these events are measured and reported.
• Neutrality: information must be free of any bias intended to attain a predetermined result or to induce a particular mode of behavior.
comparability Accounting information should enable users to identify similarities and differences be-tween sets of economic phenomena. For instance, the financial statements of different companies should be presented in a way that allows users to make comparisons across companies concerning their activities, financial condition, and performance. Although management has the flexibility to choose how events are measured and reported, this discretion should not be used to obscure the underlying economic substance of the event. One of the consequences of comparability is that firms in the same business (industry) should use the same, or similar, reporting techniques.
consistency The information supplied to decision makers should exhibit conformity from one report-ing period to the next with unchanging policies and procedures. Companies can choose to change accounting methods, and sometimes they are required to do so by standard setters. however, such changes make it dif-ficult to evaluate financial performance over time. Accounting changes should be rare and supported as the better means of reporting the organization’s financial condition and performance. Whenever possible, using the same accounting methods from one period to the next increases the quality of accounting information.
Underlying assumptionsFour assumptions underlie the preparation of financial statements. Knowing these assumptions is helpful in understanding how the statements are prepared and in interpreting the information reported therein. These assumptions include:
separate economic entity For accounting purposes, the activities of a company are considered inde-pendent, distinct, and separate from the activities of its stockholders and from other companies.
going concern Companies are assumed to have continuity in that they can be expected to continue in operation over time. This assumption is essential for valuing assets (future benefits) and liabilities (future obligations).
27Chapter 1 introducing Financial Accounting
Research insights introduce relevant research findings on the topics presented.

accounting Period While continuity is assumed, company operations must be reported periodically, normally each fiscal year. Interim reporting periods, such as quarterly or monthly reports, allow companies to supplement the annual financial statements with more timely information.
measuring Unit The unit of measure is the monetary unit of the country in which the firm’s accounting reports are issued. The dollar is the monetary unit in the united states.
yoU make The call
you are the bank loan officer Hertz, the rental car firm, has a fleet of relatively new automobiles that it rents to customers for usually short periods. Suppose that hertz applied to your bank for a loan and offered their fleet of cars as collateral. Would you, as the loan officer, be satisfied with the value shown on hertz’s balance sheet as a measure of the fleet’s value? if not, what value would you prefer and how might you estimate that value? [Answers on page 30.]
SUMMArY
Identify the users of accounting information and discuss the costs and benefits of disclosure. (p. 4)
• There are many diverse decision makers who use financial information.
• The benefits of disclosure of credible financial information must exceed the costs of providing the information.
Describe a company’s business activities and explain how these activities are represented by the accounting equation. (p. 7)
• To effectively manage a company or infer whether it is well managed, we must understand its activities as well as the competitive and regulatory environment in which it operates.
• All corporations plan business activities, finance and invest in them, and then engage in operations.
• Financing is obtained partly from stockholders and partly from creditors, including suppliers and lenders.
• investing activities involve the acquisition and disposition of the company’s productive resources called assets.
• Operating activities include the production of goods or services that create operating revenues (sales) and expenses (costs). Operating profit (income) arises when operating revenues exceed operating expenses.
Introduce the four key financial statements including the balance sheet, income statement, statement of stockholders’ equity, and statement of cash flows. (p. 11)
• The four basic financial statements used to periodically report the company’s progress are the balance sheet, the income statement, the statement of stockholders’ equity, and the statement of cash flows. These statements articulate with one another.
• The balance sheet reports the company’s financial position at a point in time. it lists the company’s as-set, liability, and equity items, and it typically aggregates similar items.
• The income statement reports the firm’s operating activities to determine income earned, and thereby the firm’s performance over a period of time.
• The stockholders’ equity statement reports the changes in the key equity accounts over a period of time.
• The statement of cash flows reports the cash flows into and out of the firm from its operating, investing, and financing sources over a period of time.
Describe the institutions that regulate financial accounting and their role in establishing generally accepted accounting principles. (p. 17)
• Generally Accepted Accounting Principles (GAAP) are established standards and accepted practices designed to guide the preparation of the financial statements.
• While the Securities and Exchange Commission (SEC) has ultimate authority over financial reporting by companies in the united states, it has ceded the task of setting accounting standards to the account-ing profession.
lo1
lo2
lo3
lo4
28 Chapter 1 introducing Financial Accounting
summary offers key bullet point takeaways for each Learning Objective.
• The Financial Accounting Standards Board (FASB) has the primary responsibility for setting financial accounting standards in the united states.
• The sarbanes-Oxley Act established the Public Company Accounting Oversight Board (PCAOB) to approve auditing standards and monitor the quality of financial statements and audits.
• international Financial reporting standards (iFrs) are set by the international Accounting standards Board (iAsB).
• IFRS are an attempt to achieve a greater degree of commonality in financial reporting across different countries.
Compute two key ratios that are commonly used to assess profitability and risk—return on equity and the debt-to-equity ratio. (p. 21)
• Return on equity (ROE)—a measure of profitability that assesses the performance of the firm relative to the investment made by stockholders (equity financing)
• Return on equity (ROE) is an important profitability metric for stockholders.
ROE Net incomeAverage stockholders’ equity
5
• Debt-to-equity ratio (D/E)—a measure of long-term solvency that relates the amount of creditor fi-nancing to the amount of equity financing
• The debt-to-equity ratio is an important measure of long-term solvency, a determinant of overall com-pany risk.
D/E Total liabilitiesTotal stockholders’ equity
5
Appendix 1A: Explain the conceptual framework for financial reporting. (p. 25)
• The conceptual framework includes, among other things, a statement of the objectives of financial reporting along with a discussion of the qualitative characteristics of accounting information that are important to users.
GUIDANCE ANSWErS . . . YoU MAkE THE CALL
you are a Product manager there are at least two considerations that must be balanced—namely, the dis-closure requirements and your company’s need to protect its competitive advantages. You must comply with all minimum required disclosures. the extent to which you offer additional disclosures depends on the sensitivity of the information; that is, how beneficial it is to your existing and potential competitors. Another consideration is how the information disclosed will impact your existing and potential investors. disclosures such as this can be beneficial in that they convey the positive investments that are available to your company. Still, there are many stakeholders impacted by your decision and each must be given due consideration.
you are a financial analyst this question has received a lot of discussion from both sides under the title “Eco-nomic Consequences.” on one side are those who maintain that accounting rules should not only reflect a rule’s economic consequences but should be designed to facilitate the attainment of a specific economic goal. one ex-ample is the case where the oil industry lobbied for an accounting rule that they and others believed would increase the incentive to explore and develop new oil deposits.
those on the other side of the argument believe that accounting should try to provide data that is objective, reli-able, and free from bias without considering the economic consequences of the decisions to be made. they believe that accounting rule makers have neither the insight nor the public mandate to attempt forecasts of the economic ef-fects of financial reporting. decisions that will affect the allocation of resources or that affect society’s social structure should be made only by our elected representatives. While there are substantive points on both sides, we believe that it is the job of accounting rule makers to work toward the objective of financial reporting that reflects economic reality, subject to practical measurement limitations.
you are a member of the board of Directors in order to perform a thorough audit, a company’s auditors must gain an intimate knowledge of its operations, its internal controls, and its accounting system. Because of this familiarity, the accounting firm is in a position to provide insights and recommendations that another consulting firm might not be able to provide. however, the independence of the auditor is critical to the credibility of the audit and there is some concern that the desire to retain a profitable consulting engagement might lead the auditors to tailor
lo5
lo6
29Chapter 1 introducing Financial Accounting
their audit opinions to “satisfy the customer.” Contrary to this concern, however, research finds that there is no evidence that auditors provide more optimistic audit reports for the companies they consult for. Rather, it appears that litigation and/or reputation concerns are reasonably effective in keeping auditors honest. nevertheless, recent legislation in the United States now prohibits auditors from performing consulting services for their audit clients.
you are the bank loan officer the value shown on hertz’s books will be the purchase price, though perhaps reduced for the time the fleet has been in use. however, the bank would want to know the current market value of the fleet, not its book value, and the bank would then adjust this market value. the current market value of a single car can be found in used-car market quotes. if the bank ultimately becomes the owner of the fleet, it will need to sell the cars, probably a few at a time through wholesalers. therefore, the adjusted market value and the book value are likely to differ for several reasons, including:
1. hertz would have been able to buy the fleet at a reduced value due to buying in large volume regularly (market value lower than used-car quotes).
2. hertz is likely to have kept the cars in better condition than would the average buyer (market value higher than used-car quotes).
3. the bank would reduce the value by some percentage due to the costs associated with disposing of the fleet (including the wholesaler’s discount) and the length of the bank loan (reduction to the value as otherwise determined).
kEY rATIoS
Return on equity (ROE) Net incomeAverage stockholders’ equity
5 5Debt-to-equity (D/E) Total liabilitiesTotal stockholders’ equity
kEY TErMS
Accounting (p. 4)Accounting equation (p. 10)American Institute of Certified Public
Accountants (AiCPA) (p. 18)Assets (p. 8)Audited (p. 20)Balance sheet (p. 11, 12)Board of directors (p. 6)Conceptual framework (p. 25)Corporation (p. 5)Cost of goods sold (p. 12)Creditors (p. 5)Debt-to-equity (D/e) ratio (p. 23)Disclosure (p. 6)economic consequences (p. 18)expense (p. 10)Feedback value (p. 27)Financial accounting (p. 4)Financial Accounting standards Board
(FAsB) (p. 18)
Financing activities (p. 9)Generally accepted accounting principles
(GAAP) (p. 17)income (p. 10)income statement (p. 11, 12)internal controls (p. 18)international Accounting standards Board
(iAsB) (p. 20)international Financial reporting
standards (iFrs) (p. 20)investing activities (p. 8)liabilities (p. 9)Managerial accounting (p. 4)neutrality (p. 27)Operating activities (p. 10)Partnership (p. 5)Planning activities (p. 8)Predictive value (p. 27)Profitability (p. 21)
Public Company Accounting Oversight Board (PCAOB) (p. 19)
representational faithfulness (p. 27)retained earnings (p. 13)revenue (p. 10)risk (p. 21)sarbanes-Oxley Act (p. 18)securities and exchange Commission
(seC) (p. 18)shares of stock (p. 5)sole proprietorship (p. 5)solvency (p. 23)Statement of cash flows (p. 11, 14)statement of stockholders equity
(p. 11, 13)stockholders (p. 5)strategy (p. 8)suppliers (p. 6)Timeliness (p. 27)Verifiability (p. 27)
30 Chapter 1 introducing Financial Accounting
key Terms are listed for each chapter with references to page numbers within the chapter.
Assignments with the MBCHomework
logo in the margin are available in . See the Preface of the book for details.
MULTIPLE CHoICE
1. Which of the following is a potential cost of the public disclosure of accounting information? a. loss of competitive advantage caused by revealing information to competitors. b. Potential increased regulation and taxes due to reporting excessive profits in politically sensitive
industries. c. raising and then failing to meet the expectations of investors. d. All of the above are potential costs of disclosure.
2. Banks that lend money to corporations are considered a. creditors. b. stockholders. c. both a and b above. d. neither a nor b above.
3. Which of the following financial statements reports the financial condition of a company at a point in time? a. the balance sheet b. the income statement c. the statement of cash flows d. the statement of stockholders’ equity
4. Which of the following is not one of the four basic financial reports? a. the balance sheet b. the income statement c. the statement of stockholders’ equity d. the notes to the financial statements
5. Which of the following expressions is a correct statement of the accounting equation? a. equity 1 Assets 5 liability b. Assets (liabilities 1 equity) 5 0 c. liabilities equity 5 Assets d. liabilities 1 Assets 5 equity
Superscript A denotes assignments based on Appendix 1A.
QUESTIoNS
Q1-1. What are the three major business activities of a company that are motivated and shaped by plan-ning activities? explain each activity.
Q1-2. The accounting equation (Assets 5 liabilities 1 equity) is a fundamental business concept. explain what this equation reveals about a company’s sources and uses of funds and the claims on company resources.
Q1-3. Companies prepare four primary financial statements. What are those financial statements and what information is typically conveyed in each?
Q1-4. Does a balance sheet report on a period of time or at a point in time? Also, explain the information conveyed in that report. Does an income statement report on a period of time or at a point in time? Also, explain the information conveyed in that report.
Q1-5. Warren Buffett, CeO of Berkshire hathaway, and known as the “sage of Omaha” for his invest-ment success, has stated that his firm is not interested in investing in a company whose business model he does not understand through reading its financial statements. Would you agree? Name several information items (3 or 4) reported in financial statements that corporate finance officers would find particularly relevant in considering whether to invest in a firm.
Q1-6. Does a statement of cash flows report on a period of time or at a point in time? Also, explain the information and activities conveyed in that report.
Q1-7. Explain what is meant by the articulation of financial statements.
MBCHomework M
ultiple Choice A
nswers
1. d 2. a 3. a 4. d 5. b
MBCHomework
MBCHomework
MBCHomework
MBCHomework
31Chapter 1 introducing Financial Accounting
homework icons indicate which assignments are available in mybusinesscourse (MBC). This feature is only available when the instructor incorporates MBC in the course.
multiple choice questions with answers are provided for each chapter.
Q1-8. The trade-off between risk and return is a fundamental business concept. Briefly describe both risk and return and their trade-off. Provide some examples that demonstrate investments of varying risk and the approximate returns that you might expect to earn on those investments.
Q1-9. Why might a company voluntarily disclose more information than is required by GAAP? Q1-10. Financial statements are used by several interested stakeholders. Develop a listing of three or more
potential external users of financial statements and their applications. Q1-11. What ethical issues might managers face in dealing with confidential information? Q1-12. Return on equity (ROE) is an important summary measure of financial performance. How is it
computed? Describe what this metric reveals about company performance. Q1-13. Business decision makers external to the company increasingly demand more financial informa-
tion on business activities of companies. Discuss the reasons why companies have traditionally opposed the efforts of regulatory agencies like the seC to require more disclosure.
Q1-14. What are generally accepted accounting principles and what organization presently establishes them? Q1-15. What are international Financial reporting standards (iFrs)? Why are iFrs needed? What potential
issues can you see with requiring all public companies to prepare financial statements using IFRS? Q1-16. What is the primary function of the auditor? To what does the auditor attest in its opinion? Q1-17.A What are the objectives of financial accounting? Which of the financial statements satisfies each of
these objectives? Q1-18.A What are the four qualitative characteristics of accounting information? explain how each charac-
teristic improves the quality of accounting disclosures.
MINI ExErCISES
M1-19. Financing and Investing Relations, and Financing SourcesTotal assets of WhiteWave Foods equals $2,283.2 million and its equity is $961.4 million. What is the amount of its liabilities? Does WhiteWave Foods receive more financing from its owners or nonowners, and what percentage of financing is provided by its owners?
M1-20. Financing and Investing Relations, and Financing SourcesTotal assets of The Coca-Cola Company equals $90,055 million and its liabilities equal $56,615 million. What is the amount of its equity? Does Coke receive more financing from its owners or nonowners, and what percentage of financing is provided by its owners?
M1-21. Applying the Accounting Equation and Computing Financing ProportionsUse the accounting equation to compute the missing financial amounts (a), (b), and (c). Which of these companies is more owner-financed? Which of these companies is more nonowner-financed?
($ millions) assets 5 liabilities 1 equity
Hewlett-Packard . . . . . . . . . . . . . . . $ 105,676 $ 78,020 $ (a)General Mills . . . . . . . . . . . . . . . . . . 23,145.7 (b) 7,005.4Harley-Davidson . . . . . . . . . . . . . . . (c) 6,395.5 3,009.5
M1-22. Identifying Key Numbers from Financial StatementsAccess the most recent 10-K for Apple Inc., at the SEC’s EDGAR database for financial reports (www.sec.gov). What are Apple’s dollar amounts for assets, liabilities, and equity at september 27, 2014? Confirm that the accounting equation holds in this case. What percent of Apple’s assets is financed from creditor financing sources?
M1-23. Verifying Articulation of Financial StatementsAccess the 2014 10-K for Nike at the SEC’s EDGAR database of financial reports (www.sec.gov). using its consolidated statement of stockholders’ equity, prepare a table similar to Exhibit 1.9 showing the articulation of its retained (reinvested) earnings for the year ended May 31, 2013. Was Nike more or less profitable in 2014 compared to 2013?
M1-24. Identifying Financial Statement Line Items and Accountsseveral line items and account titles are listed below. For each, indicate in which of the following financial statement(s) you would likely find the item or account: income statement (IS), balance sheet (BS), statement of stockholders’ equity (SE), or statement of cash flows (SCF).
lo2
MBCHomework
WhiteWave foods, inc.NYSE :: WWAV
lo2
MBCHomework
coca-cola company NYSE :: KO
lo2
MBCHomework
hewlett-PackardNYSE :: HPQ
general millsNYSE :: GIS
harley-DavidsonNYSE :: HOG
lo3
MBCHomework
apple inc. NASDAQ :: AAPL
lo3
MBCHomework
nikeNYSE :: NKE
lo3
MBCHomework
32 Chapter 1 introducing Financial Accounting
a. Cash asset d. Contributed capital g. Cash inflow for stock issuedb. expenses e. Cash outflow for land h. Cash outflow for dividendsc. noncash assets f. retained earnings i. net income
M1-25. Ethical Issues and Accounting ChoicesAssume that you are a technology services provider and you must decide whether to record rev-enue from the installation of computer software for one of your clients. Your contract calls for acceptance of the software by the client within six months of installation before payment is due. Although you have not yet received formal acceptance, you are confident that it is forthcoming. Failure to record these revenues will cause your company to miss Wall street’s earnings estimates. What stakeholders will be affected by your decision and how might they be affected?
M1-26. Internal Controls and Their ImportanceThe sarbanes-Oxley legislation requires companies to report on the effectiveness of their internal controls. What are internal controls and their purpose? Why do you think Congress felt it to be such an important area to monitor and report?
ExErCISES
E1-27. Applying the Accounting Equation and Assessing Financing ContributionsDetermine the missing amount from each of the separate situations (a), (b), and (c) below. Which of these companies is more owner-financed? Which of these companies is more creditor-financed?
($ millions) assets 5 liabilities 1 equity
a. Motorola Solutions, Inc.. . . . . . . . . . . . . . . . . . $ 11,851 $ ? $3,689b. kraft Foods Group, Inc. . . . . . . . . . . . . . . . . . . ? 17,961 5,187c. Merck & Co., Inc. . . . . . . . . . . . . . . . . . . . . . . . 105,645 53,319 ?
E1-28. Financial Information Users and UsesFinancial statements have a wide audience of interested stakeholders. Identify two or more finan-cial statement users that are external to the company. Specify two questions for each user identified that could be addressed or aided by use of financial statements.
E1-29. Applying the Accounting Equation and Financial Statement ArticulationAnswer the following questions. (Hint: Apply the accounting equation.)
a. Intel Corporation had assets equal to $92,358 million and liabilities equal to $34,102 million for a recent year-end. What was the total equity for intel’s business at year-end?
b. At the beginning of a recent year, JetBlue Airways Corporation’s assets were $7,070 million and its equity was $1,888 million. During the year, assets increased $280 million and liabili-ties increased $34 million. What was its equity at the end of the year?
c. At the beginning of a recent year, The Walt Disney Company’s liabilities equaled $32,940 million. During the year, assets increased by $6,343 million, and year-end assets equaled $81,241 million. liabilities increased $151 million during the year. What were its beginning and ending amounts for equity?
E1-30. Financial Statement Relations to Compute DividendsColgate-Palmolive Company reports the following balances in its retained earnings.
($ millions) 2013 2012
Retained earnings . . . . . . . . . . . . . . . . . . . . . . . . . . . . . . . . . . . . . . $17,952 $16,953
During 2013, Colgate-Palmolive reported net income of $2,410 million.
a. Assume that the only changes affecting retained earnings were net income and dividends. What amount of dividends did Colgate-Palmolive pay to its shareholders in 2013?
b. This dividend amount constituted what percent of its net income?
lo1
lo4
lo2
MBCHomework
motorola solutionsNYSE :: MSI
kraft foods NASDAQ :: KRFT
merck & co.NYSE :: MRK
lo1
lo2, 3
MBCHomework
intelNASDAQ :: INTC
Jetblue airwaysNASDAQ :: JBLU
Walt Disney company NYSE :: DIS
lo3
MBCHomework
colgate-Palmolive NYSE :: CL
33Chapter 1 introducing Financial Accounting
Ticker symbols are provided for companies so one can easily obtain additional information.
los link assignments to the Learning Objectives of each chapter.
E1-31. Calculating Gross Profit and Preparing an Income Statementin 2013, Colgate-Palmolive Company reported sales revenue of $17,420 million and cost of goods sold of $7,219 million. Its net income was $2,410 million. Calculate gross profit and prepare an income statement using the format illustrated in Exhibit 1.8.
E1-32. Applying the Accounting Equation and Calculating Return on Equity and Debt-to-Equity RatioAt the end of 2013, Colgate-Palmolive Company reported stockholders’ equity of $2,536 mil-lion and total assets of $13,876 million. its balance in stockholders’ equity at the end of 2012 was $2,390 million. net income in 2013 was $2,410 million.
a. Calculate Colgate-Palmolive’s return on equity ratio for 2013. b. Calculate its debt-to-equity ratio as of December 31, 2013. (Hint: Apply the accounting equa-
tion to determine total liabilities.)
E1-33. Applying the Accounting Equation and Computing Return on Equity and Debt-to-Equity RatioAt the end of 2013, Daimler AG, reported stockholders’ equity of €43,363 million and total assets of €168,518 million. Its stockholders’ equity at the end of 2012 was €39,330 million. Net income in 2013 was €8,720 million.
a. Calculate Daimler’s return on equity ratio for 2013. b. Calculate Daimler’s debt-to-equity ratio as of December 31, 2013.
E1-34. Accounting in SocietyFinancial accounting plays an important role in modern society and business.
a. What role does financial accounting play in the allocation of society’s financial resources? b. What are three aspects of the accounting environment that can create ethical pressure on
management?
E1-35.A Basic Assumptions, Principles, and Terminology in the Conceptual FrameworkMatch each item in the left column with the correct description in the right column.
_____ 1. relevance_____ 2. Verifiability_____ 3. Going concern_____ 4. Materiality_____ 5. Measuring unit_____ 6. representational
faithfulness_____ 7. Accounting period_____ 8. Consistency_____ 9. reliability_____ 10. economic entity
a. refers to whether or not a particular amount is large enough to affect a decision.
b. The activities of a business are considered to be independent and distinct from those of its owners or from other companies.
c. Whenever possible, information in concurrent periods should be presented without changes to policies and procedures
d. Accounting information should be accurate and free of misstatement or bias.
e. Information is useful if it has the ability to influence decisions.
f. Consensus among measures assures that the information is free of error.
g. Accounting information should reflect the underlying economic events that it purports to measure.
h. The financial reports are presented in one consistent monetary unit, such as u.s. dollars.
i. A business is expected to have continuity in that it is expected to continue to operate indefinitely.
j. The life of a business can be divided into discrete accounting periods such as a year or quarter.
ProBLEMS
P1-36. Applying the Accounting Equation and Calculating RatiosThe following table contains financial statement information for The Procter & Gamble Company ($ millions):
lo3
MBCHomework
colgate-Palmolive NYSE :: CL
lo2, 5
MBCHomework
colgate-Palmolive NYSE :: CL
lo2, 5
MBCHomework
Daimler agOTC :: DDAIF
lo1, 4
lo6
MBCHomework
lo2, 5
MBCHomework
Procter & gambleNYSE :: PG
34 Chapter 1 introducing Financial Accounting
year assets liabilities equity net income
2011 . . . . . . . . . . . $138,354 $70,353 $ ? $11,9272012 . . . . . . . . . . . ? 68,209 64,035 10,9042013 . . . . . . . . . . . 139,263 ? 68,709 11,402
R e Q U i R e D
a. Compute the missing amounts for assets, liabilities, and equity for each year. b. Compute return on equity for 2012 and 2013. The median rOe for Fortune 500 companies is
about 15%. how does P&G compare with this median? c. Compute the debt-to-equity ratio for 2012 and 2013. The median debt-to-equity ratio for the
Fortune 500 companies is 1.8. how does P&G compare to this median?
P1-37. Formulating Financial Statements from Raw DataFollowing is selected financial information from General Mills, Inc., for its fiscal year ended May 25, 2014 ($ millions):
Cash and cash equivalents . . . . . . . . . . . . . . . . . . . . . . . . . . . . . . . . . . . . . . . . . . . . . . $ 867.3net cash from operations. . . . . . . . . . . . . . . . . . . . . . . . . . . . . . . . . . . . . . . . . . . . . . . . 2,541.0Sales. . . . . . . . . . . . . . . . . . . . . . . . . . . . . . . . . . . . . . . . . . . . . . . . . . . . . . . . . . . . . . . . 17,909.6Stockholders’ equity . . . . . . . . . . . . . . . . . . . . . . . . . . . . . . . . . . . . . . . . . . . . . . . . . . . 7,005.4Cost of goods sold. . . . . . . . . . . . . . . . . . . . . . . . . . . . . . . . . . . . . . . . . . . . . . . . . . . . . 11,539.8net cash from financing . . . . . . . . . . . . . . . . . . . . . . . . . . . . . . . . . . . . . . . . . . . . . . . . . (1,824.1)total liabilities . . . . . . . . . . . . . . . . . . . . . . . . . . . . . . . . . . . . . . . . . . . . . . . . . . . . . . . . . 16,140.3other expenses, including income taxes . . . . . . . . . . . . . . . . . . . . . . . . . . . . . . . . . . . . 4,508.5noncash assets . . . . . . . . . . . . . . . . . . . . . . . . . . . . . . . . . . . . . . . . . . . . . . . . . . . . . . . 22,278.4net cash from investing . . . . . . . . . . . . . . . . . . . . . . . . . . . . . . . . . . . . . . . . . . . . . . . . . (561.8)net income . . . . . . . . . . . . . . . . . . . . . . . . . . . . . . . . . . . . . . . . . . . . . . . . . . . . . . . . . . . 1,861.3Effect of exchange rate changes on cash . . . . . . . . . . . . . . . . . . . . . . . . . . . . . . . . . . . (29.2)Cash, beginning year . . . . . . . . . . . . . . . . . . . . . . . . . . . . . . . . . . . . . . . . . . . . . . . . . . . 741.4
R e Q U i R e D
a. Prepare an income statement, balance sheet, and statement of cash flows for General Mills, Inc. b. What portion of the financing is contributed by owners?
P1-38. Formulating Financial Statements from Raw DataFollowing is selected financial information from Abercrombie & Fitch for its fiscal year ended February 1, 2014 ($ millions):
Cash asset . . . . . . . . . . . . . . . . . . . . . . . . . . . . . . . . . . . . . . . . . . . . . . . . . . . . . . . . . . . . $ 600.1Cash flows from operations . . . . . . . . . . . . . . . . . . . . . . . . . . . . . . . . . . . . . . . . . . . . . . . 175.5Sales. . . . . . . . . . . . . . . . . . . . . . . . . . . . . . . . . . . . . . . . . . . . . . . . . . . . . . . . . . . . . . . . . 4,116.9Stockholders’ equity . . . . . . . . . . . . . . . . . . . . . . . . . . . . . . . . . . . . . . . . . . . . . . . . . . . . 1,729.5Cost of goods sold. . . . . . . . . . . . . . . . . . . . . . . . . . . . . . . . . . . . . . . . . . . . . . . . . . . . . . 1,541.5Cash flows from financing . . . . . . . . . . . . . . . . . . . . . . . . . . . . . . . . . . . . . . . . . . . . . . . . (40.8)total liabilities . . . . . . . . . . . . . . . . . . . . . . . . . . . . . . . . . . . . . . . . . . . . . . . . . . . . . . . . . . 1,121.5other expenses, including income taxes . . . . . . . . . . . . . . . . . . . . . . . . . . . . . . . . . . . . . 2,520.8noncash assets . . . . . . . . . . . . . . . . . . . . . . . . . . . . . . . . . . . . . . . . . . . . . . . . . . . . . . . . 2,250.9Cash flows from investing . . . . . . . . . . . . . . . . . . . . . . . . . . . . . . . . . . . . . . . . . . . . . . . . (173.9)net income . . . . . . . . . . . . . . . . . . . . . . . . . . . . . . . . . . . . . . . . . . . . . . . . . . . . . . . . . . . . 54.6Effect of exchange rate changes on cash . . . . . . . . . . . . . . . . . . . . . . . . . . . . . . . . . . . . (4.2)Cash, beginning year . . . . . . . . . . . . . . . . . . . . . . . . . . . . . . . . . . . . . . . . . . . . . . . . . . . . 643.5
R e Q U i R e D
a. Prepare an income statement, balance sheet, and statement of cash flows for Abercrombie & Fitch.
b. Determine the owner and creditor financing levels.
P1-39. Preparing Comparative Financial Statements from Raw DataFollowing is selected financial information for Tilly’s, Inc.
lo2, 3
general millsNYSE :: GIS
MBCHomework
lo2, 3
abercrombie & fitchNYSE :: ANF
MBCHomework
lo3Tilly’s, inc.NYSE :: TLYS
35Chapter 1 introducing Financial Accounting
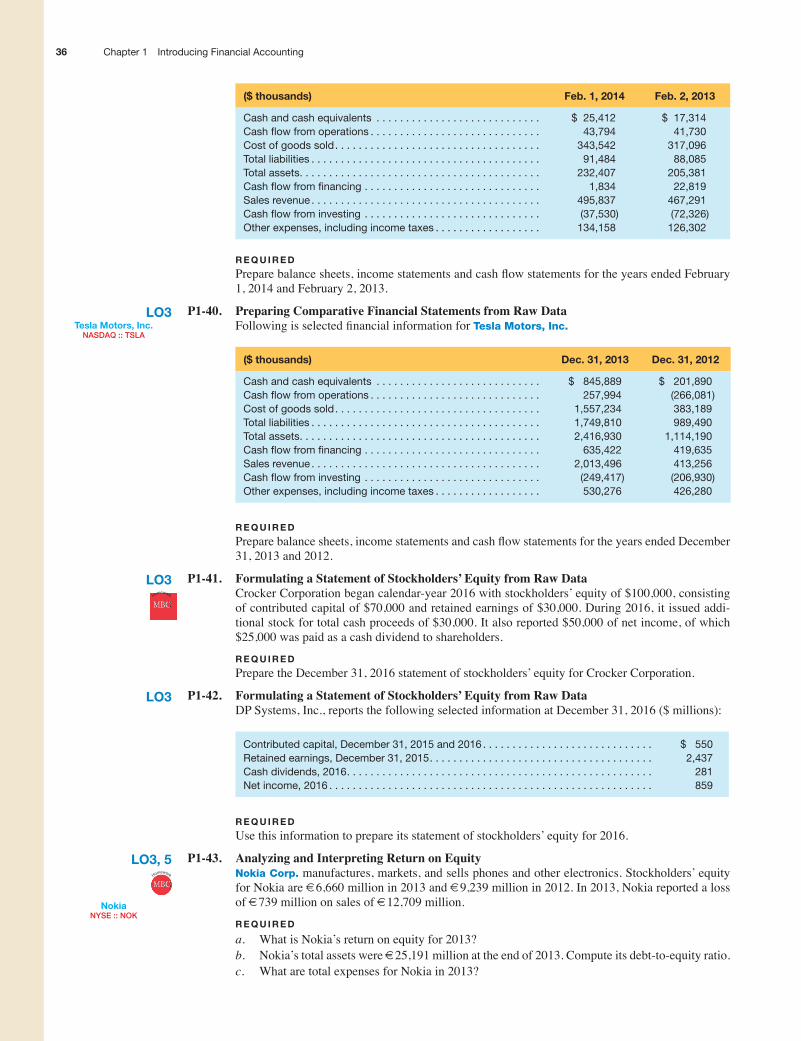
($ thousands) feb. 1, 2014 feb. 2, 2013
Cash and cash equivalents . . . . . . . . . . . . . . . . . . . . . . . . . . . . $ 25,412 $ 17,314Cash flow from operations . . . . . . . . . . . . . . . . . . . . . . . . . . . . . 43,794 41,730Cost of goods sold. . . . . . . . . . . . . . . . . . . . . . . . . . . . . . . . . . . 343,542 317,096total liabilities . . . . . . . . . . . . . . . . . . . . . . . . . . . . . . . . . . . . . . . 91,484 88,085total assets. . . . . . . . . . . . . . . . . . . . . . . . . . . . . . . . . . . . . . . . . 232,407 205,381Cash flow from financing . . . . . . . . . . . . . . . . . . . . . . . . . . . . . . 1,834 22,819Sales revenue . . . . . . . . . . . . . . . . . . . . . . . . . . . . . . . . . . . . . . . 495,837 467,291Cash flow from investing . . . . . . . . . . . . . . . . . . . . . . . . . . . . . . (37,530) (72,326)other expenses, including income taxes . . . . . . . . . . . . . . . . . . 134,158 126,302
R e Q U i R e D
Prepare balance sheets, income statements and cash flow statements for the years ended February 1, 2014 and February 2, 2013.
P1-40. Preparing Comparative Financial Statements from Raw DataFollowing is selected financial information for Tesla Motors, Inc.
($ thousands) Dec. 31, 2013 Dec. 31, 2012
Cash and cash equivalents . . . . . . . . . . . . . . . . . . . . . . . . . . . . $ 845,889 $ 201,890Cash flow from operations . . . . . . . . . . . . . . . . . . . . . . . . . . . . . 257,994 (266,081)Cost of goods sold. . . . . . . . . . . . . . . . . . . . . . . . . . . . . . . . . . . 1,557,234 383,189total liabilities . . . . . . . . . . . . . . . . . . . . . . . . . . . . . . . . . . . . . . . 1,749,810 989,490total assets. . . . . . . . . . . . . . . . . . . . . . . . . . . . . . . . . . . . . . . . . 2,416,930 1,114,190Cash flow from financing . . . . . . . . . . . . . . . . . . . . . . . . . . . . . . 635,422 419,635Sales revenue . . . . . . . . . . . . . . . . . . . . . . . . . . . . . . . . . . . . . . . 2,013,496 413,256Cash flow from investing . . . . . . . . . . . . . . . . . . . . . . . . . . . . . . (249,417) (206,930)other expenses, including income taxes . . . . . . . . . . . . . . . . . . 530,276 426,280
R e Q U i R e D
Prepare balance sheets, income statements and cash flow statements for the years ended December 31, 2013 and 2012.
P1-41. Formulating a Statement of Stockholders’ Equity from Raw DataCrocker Corporation began calendar-year 2016 with stockholders’ equity of $100,000, consisting of contributed capital of $70,000 and retained earnings of $30,000. During 2016, it issued addi-tional stock for total cash proceeds of $30,000. it also reported $50,000 of net income, of which $25,000 was paid as a cash dividend to shareholders.
R e Q U i R e D
Prepare the December 31, 2016 statement of stockholders’ equity for Crocker Corporation.
P1-42. Formulating a Statement of Stockholders’ Equity from Raw DataDP systems, inc., reports the following selected information at December 31, 2016 ($ millions):
Contributed capital, december 31, 2015 and 2016 . . . . . . . . . . . . . . . . . . . . . . . . . . . . . $ 550Retained earnings, december 31, 2015. . . . . . . . . . . . . . . . . . . . . . . . . . . . . . . . . . . . . . 2,437Cash dividends, 2016. . . . . . . . . . . . . . . . . . . . . . . . . . . . . . . . . . . . . . . . . . . . . . . . . . . . 281net income, 2016 . . . . . . . . . . . . . . . . . . . . . . . . . . . . . . . . . . . . . . . . . . . . . . . . . . . . . . . 859
R e Q U i R e D
use this information to prepare its statement of stockholders’ equity for 2016.
P1-43. Analyzing and Interpreting Return on EquityNokia Corp. manufactures, markets, and sells phones and other electronics. stockholders’ equity for Nokia are €6,660 million in 2013 and €9,239 million in 2012. In 2013, Nokia reported a loss of €739 million on sales of €12,709 million.
R e Q U i R e D
a. What is nokia’s return on equity for 2013? b. Nokia’s total assets were €25,191 million at the end of 2013. Compute its debt-to-equity ratio. c. What are total expenses for nokia in 2013?
lo3Tesla motors, inc.
NASDAQ :: TSLA
lo3
MBCHomework
lo3
lo3, 5
MBCHomework
nokiaNYSE :: NOK
36 Chapter 1 introducing Financial Accounting
P1-44. Presenting an Income Statement and Computing Key RatiosBest Buy Co., Inc., reported the following amounts in its February 1, 2014, and February 2, 2013, financial statements.
($ millions) 2014 2013
Sales revenue . . . . . . . . . . . . . . . . . . . . . . . . . . . . . . . . . . . . . . . . . . $42,410 $39,827Cost of sales. . . . . . . . . . . . . . . . . . . . . . . . . . . . . . . . . . . . . . . . . . . 32,720 30,528net income (loss) . . . . . . . . . . . . . . . . . . . . . . . . . . . . . . . . . . . . . . . 523 (420)total assets. . . . . . . . . . . . . . . . . . . . . . . . . . . . . . . . . . . . . . . . . . . . 14,013 16,787Stockholders’ equity . . . . . . . . . . . . . . . . . . . . . . . . . . . . . . . . . . . . 3,989 3,715
R e Q U i R e D
a. Prepare an income statement for Best Buy for the year ended February 1, 2014, using the format illustrated in Exhibit 1.8.
b. Calculate Best Buy’s return on equity for the year ended February 1, 2014. c. Compute Best Buy’s debt-to-equity ratio as of February 1, 2014.
P1-45. Preparing Income Statements and Computing Key RatiosFacebook, Inc. reported the following amounts in its 2012 and 2013 financial statements.
($ millions) Dec. 31, 2013 Dec. 31, 2012
total assets. . . . . . . . . . . . . . . . . . . . . . . . . . . . . . . . . . . . . . . . . $17,895 $15,103total liabilities . . . . . . . . . . . . . . . . . . . . . . . . . . . . . . . . . . . . . . . 2,425 3,348Retained earnings . . . . . . . . . . . . . . . . . . . . . . . . . . . . . . . . . . . 3,159 1,659Revenue . . . . . . . . . . . . . . . . . . . . . . . . . . . . . . . . . . . . . . . . . . . 7,872 5,089operating expenses . . . . . . . . . . . . . . . . . . . . . . . . . . . . . . . . . . 5,068 4,551other expenses, including income taxes . . . . . . . . . . . . . . . . . . 1,304 485
R e Q U i R e D
a. Prepare income statements for Facebook for 2013 and 2012. use the format illustrated in Exhibit 1.8.
b. Compute Facebook’s return on equity ratio for 2013 and 2012. Facebook’s stockholders’ eq-uity at the end of 2011 was $4,899 million.
c. Compute Facebook’s debt-to-equity ratio for 2013 and 2012. d. What amount of dividends did Facebook pay to its shareholders in 2013?
CASES AND ProJECTS
C1-46. Preparing Comparative Income Statements and Computing Key RatiosStarbucks Corporation reported the following data in its 2013 and 2012 10-K reports.
($ millions) sep. 29, 2013 sep. 30, 2012
total assets. . . . . . . . . . . . . . . . . . . . . . . . . . . . . . . . . . . . . . . . . . $11,516.7 $ 8,219.2total liabilities . . . . . . . . . . . . . . . . . . . . . . . . . . . . . . . . . . . . . . . . 7,034.4 3,104.7Sales revenue . . . . . . . . . . . . . . . . . . . . . . . . . . . . . . . . . . . . . . . . 14,892.2 13,299.5Cost of goods sold. . . . . . . . . . . . . . . . . . . . . . . . . . . . . . . . . . . . 6,382.3 5,813.3other expenses, including income taxes . . . . . . . . . . . . . . . . . . . 8,501.1 6,101.5
R e Q U i R e D
a. Prepare income statements for starbucks for the years ended september 29, 2013 and september 30, 2012. use the format illustrated in Exhibit 1.8.
b. Compute starbucks’ return on equity ratio for 2013 and 2012. starbucks stockholders’ equity at October 2, 2011 was $4,387.3 million.
c. Compute starbucks’ debt-to-equity ratio for 2013 and 2012. d. starbucks’ net income and return on equity were considerably lower in 2013 than in 2012. in
2013, starbucks reported a litigation charge of $2,784.1 million, which is included above in
lo3, 5
MBCHomework
best buyNYSE :: BBY
lo3, 5facebook, inc.
NASDAQ :: FB
lo3, 5starbucks corporation
NASDAQ :: SBUX
37Chapter 1 introducing Financial Accounting
other expenses. What effect did this one-time charge have on the company’s return on equity ratio? (Hint: Compute the ratio excluding the litigation charge from other expenses and com-pare to the ratio computed in b.)
e. Starbucks disclosed information about the pending litigation in the footnotes to its 2012 finan-cial statements (before the case was settled). Discuss the costs and benefits of disclosing this information in its 2012 annual report.
C1-47. Computing and Interpreting Key Ratios and Formulating an Income StatementData from the financial statements of The Gap, Inc., and Nordstrom, Inc., are presented below.
($ millions) The gap nordstrom
Stockholders’ equity, 2013. . . . . . . . . . . . . . . . . . . . . . . . . . . . . . . . . . $ 3,062 $ 2,080Stockholders’ equity, 2012. . . . . . . . . . . . . . . . . . . . . . . . . . . . . . . . . . 2,894 1,913total assets, 2013. . . . . . . . . . . . . . . . . . . . . . . . . . . . . . . . . . . . . . . . . 7,849 8,574total assets, 2012. . . . . . . . . . . . . . . . . . . . . . . . . . . . . . . . . . . . . . . . . 7,470 8,089Revenue, 2013 . . . . . . . . . . . . . . . . . . . . . . . . . . . . . . . . . . . . . . . . . . . 16,148 12,540Cost of goods sold, 2013. . . . . . . . . . . . . . . . . . . . . . . . . . . . . . . . . . . 9,855 7,737net income, 2013 . . . . . . . . . . . . . . . . . . . . . . . . . . . . . . . . . . . . . . . . . 1,280 734
R e Q U i R e D
a. Compute the return on equity ratio for The Gap and nordstrom for 2013. Which company earned the higher return for its shareholders?
b. Compute the debt-to-equity ratio for each company as of 2013. Which company relies more on creditor financing?
c. Prepare a 2013 income statement for each company using the format in Exhibit 1.8. For each firm, compute gross profit as a percentage of sales revenue.
d. Based on your answers to questions a, b, and c, compare these two retail companies. What might be the cause of any differences in the ratios that you computed?
C1-48. Computing and Interpreting Key RatiosData from the financial statements of JetBlue Airways and Southwest Airlines are presented below.
($ millions)Jetblue airways
southwest airlines
total liabilities, 2013 . . . . . . . . . . . . . . . . . . . . . . . . . . . . . . . . . . . . . . . $5,216 $12,009total liabilities, 2012 . . . . . . . . . . . . . . . . . . . . . . . . . . . . . . . . . . . . . . . 5,182 11,604total assets, 2013. . . . . . . . . . . . . . . . . . . . . . . . . . . . . . . . . . . . . . . . . 7,350 19,345total assets, 2012. . . . . . . . . . . . . . . . . . . . . . . . . . . . . . . . . . . . . . . . . 7,070 18,596Revenue, 2013 . . . . . . . . . . . . . . . . . . . . . . . . . . . . . . . . . . . . . . . . . . . 5,441 17,699net income, 2013 . . . . . . . . . . . . . . . . . . . . . . . . . . . . . . . . . . . . . . . . . 168 754
R e Q U i R e D
a. Compute the return on equity ratio for JetBlue and southwest for 2013. Which company earned the higher return for its shareholders?
b. Compute the debt-to-equity ratio for each company as of December 31, 2013. Which company relies more on creditor financing?
c. For each firm, compute net income as a percentage of revenue in 2013. d. Based on your answers to questions a, b, and c, compare these two competitors. What might
be the cause of any differences in the ratios that you computed?
C1-49. Interpreting Financial Statement InformationPaula Seale is negotiating the purchase of an extermination firm called Total Pest Control. Seale has been employed by a national pest control service and knows the technical side of the business. However, she knows little about accounting data and financial statements. The sole owner of the firm, Meg Krey, has provided Seale with income statements for the past three years, which show an average net income of $72,000 per year. The latest balance sheet shows total assets of $285,000 and liabilities of $45,000. seale brings the following matters to your attention and requests advice.
lo2, 3, 5The gap
NYSE :: GPS
nordstrom NYSE :: JWN
lo5
MBCHomework
Jetblue airwaysNASDAQ :: JBLU
southwest airlines NYSE :: LUV
lo1, 3, 5
38 Chapter 1 introducing Financial Accounting
1. Krey is asking $300,000 for the firm. She has told Seale that because the firm has been earning 30% on its investment, the price should be higher than the net assets on the balance sheet (net assets equals total assets minus total liabilities).
2. seale has noticed no salary for Krey on the income statements, even though she worked half-time in the business. Krey explained that because she had other income, the firm only paid $18,000 in cash dividends to Krey (the sole shareholder). If she purchases the firm, Seale will hire a full-time manager for the firm at an annual salary of $36,000.
3. Krey’s tax returns for the past 3 years report a lower net income for the firm than the amounts shown in the financial statements. Seale is skeptical about the accounting principles used in preparing the financial statements.
R e Q U i R e D
a. How did Krey arrive at the 30% return figure in point 1? If Seale accepts Krey’s average an-nual net income figure of $72,000, what would Seale’s percentage return be, assuming that the net income remained at the same level and that the firm was purchased for $300,000?
b. Should the dividend to Krey affect the net income reported in the financial statements? What will seale’s percentage return be if she takes into consideration the $36,000 salary she plans to pay a full-time manager?
c. Could there be legitimate reasons for the difference between net income shown in the financial statements and net income reported on the tax returns, as mentioned in point 3? how might Seale obtain additional assurance about the propriety of the financial statements?
C1-50. Management, Auditing, and Ethical BehaviorJackie hardy, CPA, has a brother, Ted, in the retail clothing business. Ted ran the business as its sole owner for 10 years. During this 10-year period, Jackie helped Ted with various accounting mat-ters. For example, Jackie designed the accounting system for the company, prepared Ted’s personal income tax returns (which included financial data about the clothing business), and recommended various cost control procedures. Ted paid Jackie for all these services. A year ago, Ted markedly expanded the business; Ted is president of the corporation and also chairs the corporation’s board of directors. The board of directors has overall responsibility for corporate affairs. When the corporation was formed, Ted asked Jackie to serve on its board of directors. Jackie accepted. in addition, Jackie now prepares the corporation’s income tax returns and continues to advise her brother on accounting matters.
Recently, the corporation applied for a large bank loan. The bank wants audited financial state-ments for the corporation before it will decide on the loan request. Ted asked Jackie to perform the audit. Jackie replied that she cannot do the audit because the code of ethics for CPAs requires that she be independent when providing audit services.
R e Q U i R e D
a. Why is it important that a CPA be independent when providing audit services? b. Which of Jackie’s activities or relationships impair her independence?
SoLUTIoNS To rEVIEW ProBLEMS
mid-chapter Review
s o l U T i o n
a.
aDiDasbalance sheet (€ millions)
December 31, 2013
Cash . . . . . . . . . . . . . . . . € 1,587 total liabilities . . . . . . . . . . . . . . . . . . . . . . . . . . . € 6,118noncash assets . . . . . . . 10,012 Stockholders’ equity . . . . . . . . . . . . . . . . . . . . . 5,481
total assets. . . . . . . . . . . €11,599 total liabilities and stockholders’ equity. . . . . . . €11,599
lo1, 4
39Chapter 1 introducing Financial Accounting
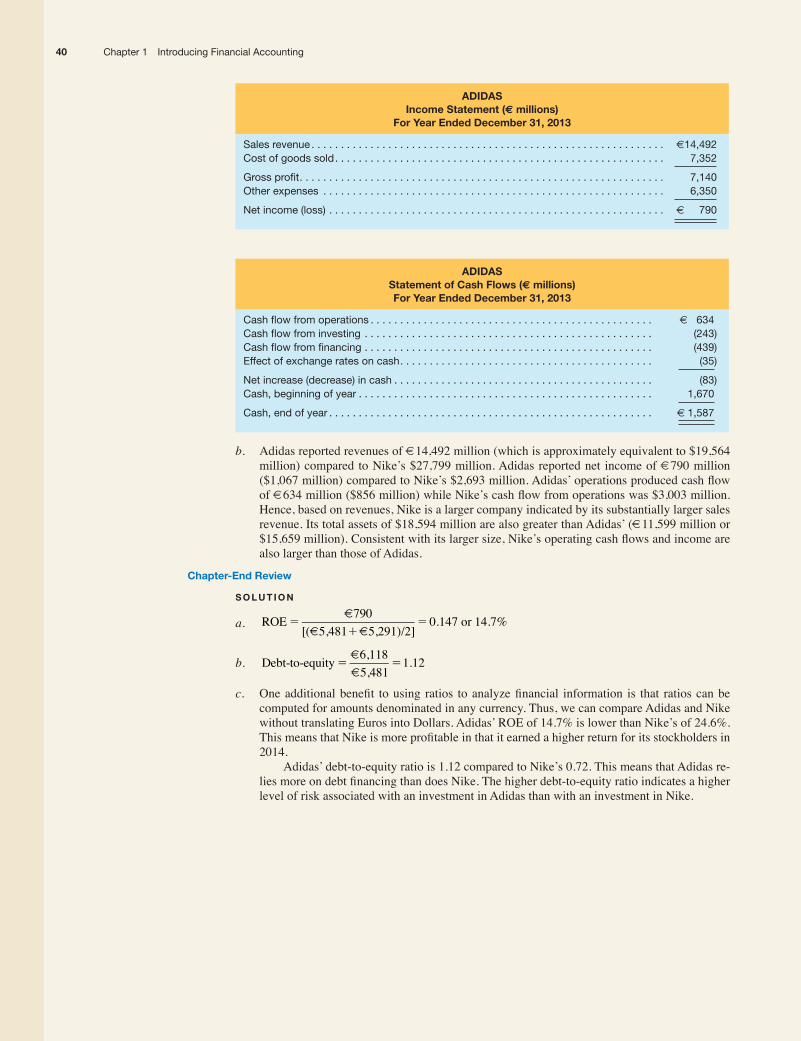
aDiDasincome statement (€ millions)
for year ended December 31, 2013
Sales revenue . . . . . . . . . . . . . . . . . . . . . . . . . . . . . . . . . . . . . . . . . . . . . . . . . . . . . . . . . . . . €14,492Cost of goods sold. . . . . . . . . . . . . . . . . . . . . . . . . . . . . . . . . . . . . . . . . . . . . . . . . . . . . . . . 7,352
Gross profit. . . . . . . . . . . . . . . . . . . . . . . . . . . . . . . . . . . . . . . . . . . . . . . . . . . . . . . . . . . . . . 7,140other expenses . . . . . . . . . . . . . . . . . . . . . . . . . . . . . . . . . . . . . . . . . . . . . . . . . . . . . . . . . . 6,350
net income (loss) . . . . . . . . . . . . . . . . . . . . . . . . . . . . . . . . . . . . . . . . . . . . . . . . . . . . . . . . . € 790
aDiDasstatement of cash flows (€ millions)for year ended December 31, 2013
Cash flow from operations . . . . . . . . . . . . . . . . . . . . . . . . . . . . . . . . . . . . . . . . . . . . . . . . € 634Cash flow from investing . . . . . . . . . . . . . . . . . . . . . . . . . . . . . . . . . . . . . . . . . . . . . . . . . (243)Cash flow from financing . . . . . . . . . . . . . . . . . . . . . . . . . . . . . . . . . . . . . . . . . . . . . . . . . (439)Effect of exchange rates on cash. . . . . . . . . . . . . . . . . . . . . . . . . . . . . . . . . . . . . . . . . . . (35)
net increase (decrease) in cash . . . . . . . . . . . . . . . . . . . . . . . . . . . . . . . . . . . . . . . . . . . . (83)Cash, beginning of year . . . . . . . . . . . . . . . . . . . . . . . . . . . . . . . . . . . . . . . . . . . . . . . . . . 1,670
Cash, end of year . . . . . . . . . . . . . . . . . . . . . . . . . . . . . . . . . . . . . . . . . . . . . . . . . . . . . . . € 1,587
b. Adidas reported revenues of €14,492 million (which is approximately equivalent to $19,564 million) compared to Nike’s $27,799 million. Adidas reported net income of €790 million ($1,067 million) compared to Nike’s $2,693 million. Adidas’ operations produced cash flow of €634 million ($856 million) while Nike’s cash flow from operations was $3,003 million. hence, based on revenues, nike is a larger company indicated by its substantially larger sales revenue. Its total assets of $18,594 million are also greater than Adidas’ (€11,599 million or $15,659 million). Consistent with its larger size, Nike’s operating cash flows and income are also larger than those of Adidas.
chapter-end Review
s o l U T i o n
a. ROE €790[(€5,481 €5,291)/2]
0.147 or 14.7%51
5
b. Debt-to-equity €6,118€5,481
1.125 5
c. One additional benefit to using ratios to analyze financial information is that ratios can be computed for amounts denominated in any currency. Thus, we can compare Adidas and nike without translating euros into Dollars. Adidas’ rOe of 14.7% is lower than nike’s of 24.6%. This means that Nike is more profitable in that it earned a higher return for its stockholders in 2014.
Adidas’ debt-to-equity ratio is 1.12 compared to nike’s 0.72. This means that Adidas re-lies more on debt financing than does Nike. The higher debt-to-equity ratio indicates a higher level of risk associated with an investment in Adidas than with an investment in nike.
40 Chapter 1 introducing Financial Accounting