Introducción a VTune™ Analizador de rendimiento Intel Software College.
70
Introducción a VTune™ Analizador de rendimiento Intel Software College
-
Upload
victoria-bustamante-espinoza -
Category
Documents
-
view
233 -
download
0
Transcript of Introducción a VTune™ Analizador de rendimiento Intel Software College.
Introducción a VTune™ Analizador de
rendimientoIntel Software College
2
Copyright © 2006, Intel Corporation. All rights reserved.
Basics of VTune™ Performance Analyzer
Intel and the Intel logo are trademarks or registered trademarks of Intel Corporation or its subsidiaries in the United States or other countries. *Other brands and names are the property of their respective owners.
Objetivo
Al término de este módulo será capaz de:
• Entender el propósito y modelos soportados por el analizador de rendimiento Vtune™
• Identificar “hotspots” explorando a través de las muestras tomadas.
• Entender como funciona el muestreo
• Usar “callgraph profiling” para encontrar “hotspots”

3
Copyright © 2006, Intel Corporation. All rights reserved.
Basics of VTune™ Performance Analyzer
Intel and the Intel logo are trademarks or registered trademarks of Intel Corporation or its subsidiaries in the United States or other countries. *Other brands and names are the property of their respective owners.
Agenda
¿Qué es el analizador de rendimiento VTune™?
Conceptos de afinación del rendimiento
Usando el colector de muestras
Como funciona el muestreo
Muestreando a través del tiempo
Gráfico de llamadas

4
Copyright © 2006, Intel Corporation. All rights reserved.
Basics of VTune™ Performance Analyzer
Intel and the Intel logo are trademarks or registered trademarks of Intel Corporation or its subsidiaries in the United States or other countries. *Other brands and names are the property of their respective owners.
Analizador de rendimiento VTune™
Ayuda a identificar y caracterizar problemas de rendimiento por medio de:
• Recolectar datos sobre el rendimiento del sistema que está ejecutando la aplicación.
• Organizar y desplegar los datos en una variedad de vistas interactivas, desde todo el sistema hasta el código fuente o la perspectiva de instrucción del procesador.
• Identificar problemas de rendimiento potenciales y sugerir mejoras.
5
Copyright © 2006, Intel Corporation. All rights reserved.
Basics of VTune™ Performance Analyzer
Intel and the Intel logo are trademarks or registered trademarks of Intel Corporation or its subsidiaries in the United States or other countries. *Other brands and names are the property of their respective owners.
Ambientes soportados
Recolección de datos locales y remotos
Perfilar aplicaciones que están ejecutándose en el sistema que tienen el analizador instalado, o
Ejecutar experimentos en otros sistemas qué están ejecutando agentes remotos del analizador VTune
6
Copyright © 2006, Intel Corporation. All rights reserved.
Basics of VTune™ Performance Analyzer
Intel and the Intel logo are trademarks or registered trademarks of Intel Corporation or its subsidiaries in the United States or other countries. *Other brands and names are the property of their respective owners.
Análisis de rendimiento local
Procesadores Intel® IA-32• Sistema Operativo Microsoft Windows*
• Linux
Procesadores de la familia Itanium®
• Sistema Operativo Microsoft Windows
• Linux
7
Copyright © 2006, Intel Corporation. All rights reserved.
Basics of VTune™ Performance Analyzer
Intel and the Intel logo are trademarks or registered trademarks of Intel Corporation or its subsidiaries in the United States or other countries. *Other brands and names are the property of their respective owners.
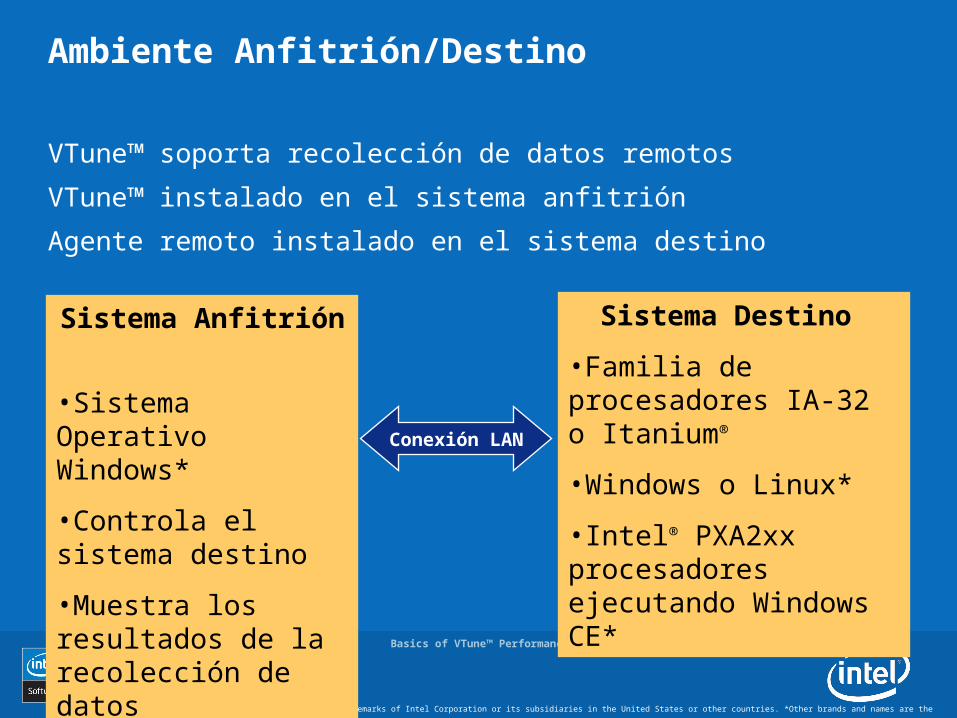
Ambiente Anfitrión/Destino
VTune™ soporta recolección de datos remotos
VTune™ instalado en el sistema anfitrión
Agente remoto instalado en el sistema destino
Sistema Anfitrión
•Sistema Operativo Windows*
•Controla el sistema destino
•Muestra los resultados de la recolección de datos
Sistema Destino
•Familia de procesadores IA-32 o Itanium®
•Windows o Linux*
•Intel® PXA2xx procesadores ejecutando Windows CE*
Conexión LAN
8
Copyright © 2006, Intel Corporation. All rights reserved.
Basics of VTune™ Performance Analyzer
Intel and the Intel logo are trademarks or registered trademarks of Intel Corporation or its subsidiaries in the United States or other countries. *Other brands and names are the property of their respective owners.
Características
Muestreo
Gráfico de llamadas a funciones (call graph)

9
Copyright © 2006, Intel Corporation. All rights reserved.
Basics of VTune™ Performance Analyzer
Intel and the Intel logo are trademarks or registered trademarks of Intel Corporation or its subsidiaries in the United States or other countries. *Other brands and names are the property of their respective owners.
El muestreo obtiene datos del rendimiento de todo El muestreo obtiene datos del rendimiento de todo el sistemael sistema
El muestreo obtiene datos del rendimiento de todo El muestreo obtiene datos del rendimiento de todo el sistemael sistema
Características del analizador VTune™ y modelos de su utilización

10
Copyright © 2006, Intel Corporation. All rights reserved.
Basics of VTune™ Performance Analyzer
Intel and the Intel logo are trademarks or registered trademarks of Intel Corporation or its subsidiaries in the United States or other countries. *Other brands and names are the property of their respective owners.
El muestreo sobre el tiempo muestra como los El muestreo sobre el tiempo muestra como los datos del muestreo cambian a través del tiempodatos del muestreo cambian a través del tiempo
El muestreo sobre el tiempo muestra como los El muestreo sobre el tiempo muestra como los datos del muestreo cambian a través del tiempodatos del muestreo cambian a través del tiempo
Características del analizador VTune™ y modelos de su utilización
11
Copyright © 2006, Intel Corporation. All rights reserved.
Basics of VTune™ Performance Analyzer
Intel and the Intel logo are trademarks or registered trademarks of Intel Corporation or its subsidiaries in the United States or other countries. *Other brands and names are the property of their respective owners.
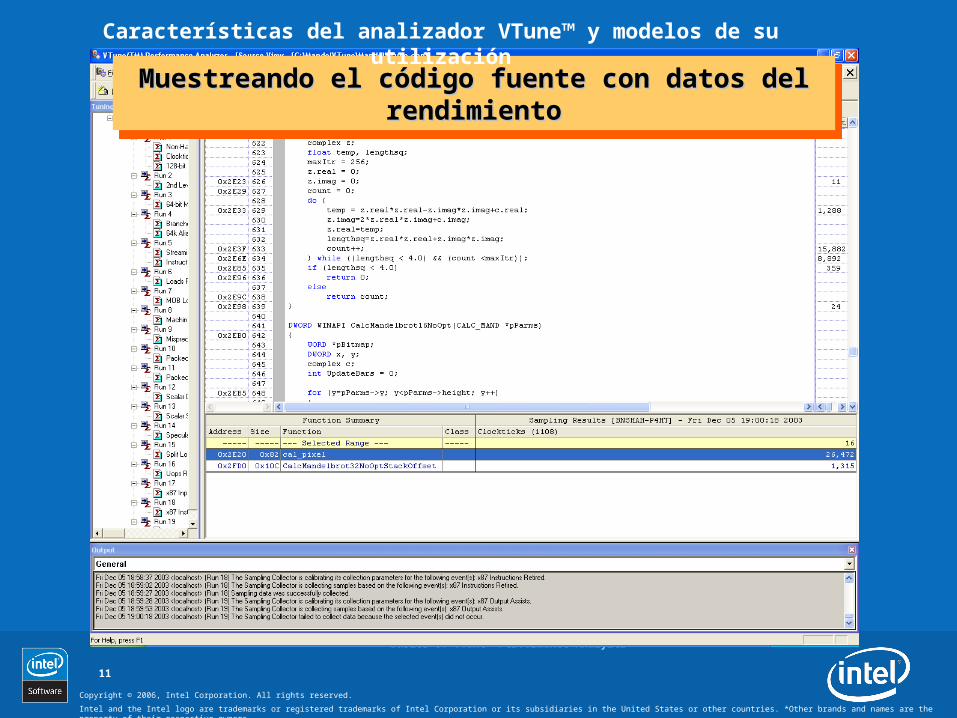
Muestreando el código fuente con datos del Muestreando el código fuente con datos del rendimientorendimiento
Muestreando el código fuente con datos del Muestreando el código fuente con datos del rendimientorendimiento
Características del analizador VTune™ y modelos de su utilización
12
Copyright © 2006, Intel Corporation. All rights reserved.
Basics of VTune™ Performance Analyzer
Intel and the Intel logo are trademarks or registered trademarks of Intel Corporation or its subsidiaries in the United States or other countries. *Other brands and names are the property of their respective owners.
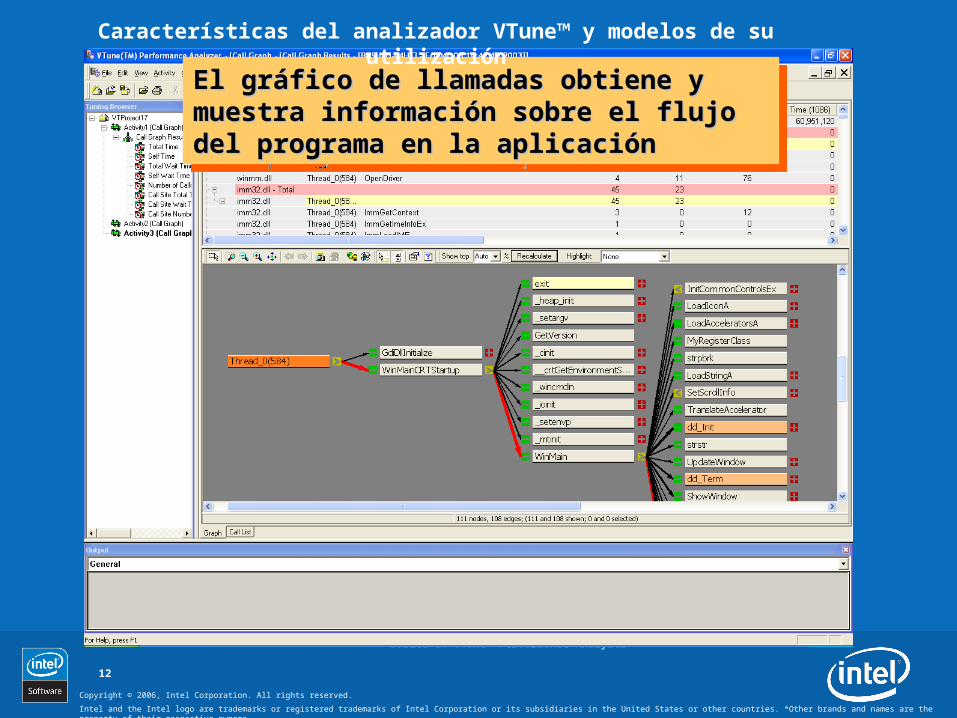
El gráfico de llamadas obtiene y muestra El gráfico de llamadas obtiene y muestra información sobre el flujo del programa en la información sobre el flujo del programa en la aplicaciónaplicación
El gráfico de llamadas obtiene y muestra El gráfico de llamadas obtiene y muestra información sobre el flujo del programa en la información sobre el flujo del programa en la aplicaciónaplicación
Características del analizador VTune™ y modelos de su utilización

13
Copyright © 2006, Intel Corporation. All rights reserved.
Basics of VTune™ Performance Analyzer
Intel and the Intel logo are trademarks or registered trademarks of Intel Corporation or its subsidiaries in the United States or other countries. *Other brands and names are the property of their respective owners.
¿Qué es un Hotspot?
Es donde en una aplicación donde hay una cantidad significativa de trabajo
• Donde = dirección en memoria => Proceso SO => Hilo SO => archivo ejecutable o módulo => función de usuario (requiere símbolos) => línea de código fuente (requiere símbolos con números de línea) o instrucción del procesador (ensamblador)
• Significativa = actividad que ocurre frecuentemente, probablemente no tiene mucho impacto en el rendimiento del sistema
• Actividad = tiempo gastado en otros eventos internos del procesador• Ejemplos de otros eventos: fallos de caché, fallos en la predicción de
saltos, instrucciones de punto flotante retiradas, etc.
14
Copyright © 2006, Intel Corporation. All rights reserved.
Basics of VTune™ Performance Analyzer
Intel and the Intel logo are trademarks or registered trademarks of Intel Corporation or its subsidiaries in the United States or other countries. *Other brands and names are the property of their respective owners.
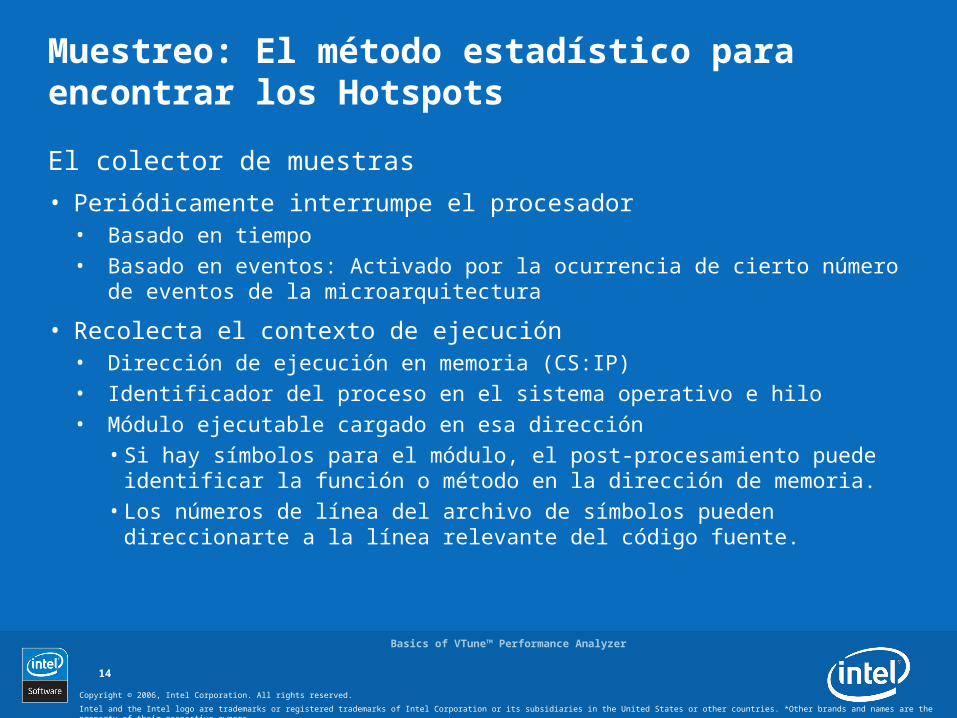
Muestreo: El método estadístico para encontrar los Hotspots
El colector de muestras
• Periódicamente interrumpe el procesador• Basado en tiempo• Basado en eventos: Activado por la ocurrencia de cierto número de
eventos de la microarquitectura
• Recolecta el contexto de ejecución• Dirección de ejecución en memoria (CS:IP)• Identificador del proceso en el sistema operativo e hilo• Módulo ejecutable cargado en esa dirección
• Si hay símbolos para el módulo, el post-procesamiento puede identificar la función o método en la dirección de memoria.
• Los números de línea del archivo de símbolos pueden direccionarte a la línea relevante del código fuente.

15
Copyright © 2006, Intel Corporation. All rights reserved.
Basics of VTune™ Performance Analyzer
Intel and the Intel logo are trademarks or registered trademarks of Intel Corporation or its subsidiaries in the United States or other countries. *Other brands and names are the property of their respective owners.
Recolector de muestras
Periódicamente interrumpe el procesador para obtener el contexto de ejecución
• Muestreo basado en tiempo (TBS) se activa por:• Servicios del timer del sistema operativo• Cada n ciclos de reloj del procesador
• Muestreo basado en eventos (EBS) se activa por eventos del procesador• Estos eventos son específicos del procesador, como fallos en la caché L2,
fallos en la predicción de saltos, instrucciones de punto flotante retiradas, etc.
16
Copyright © 2006, Intel Corporation. All rights reserved.
Basics of VTune™ Performance Analyzer
Intel and the Intel logo are trademarks or registered trademarks of Intel Corporation or its subsidiaries in the United States or other countries. *Other brands and names are the property of their respective owners.
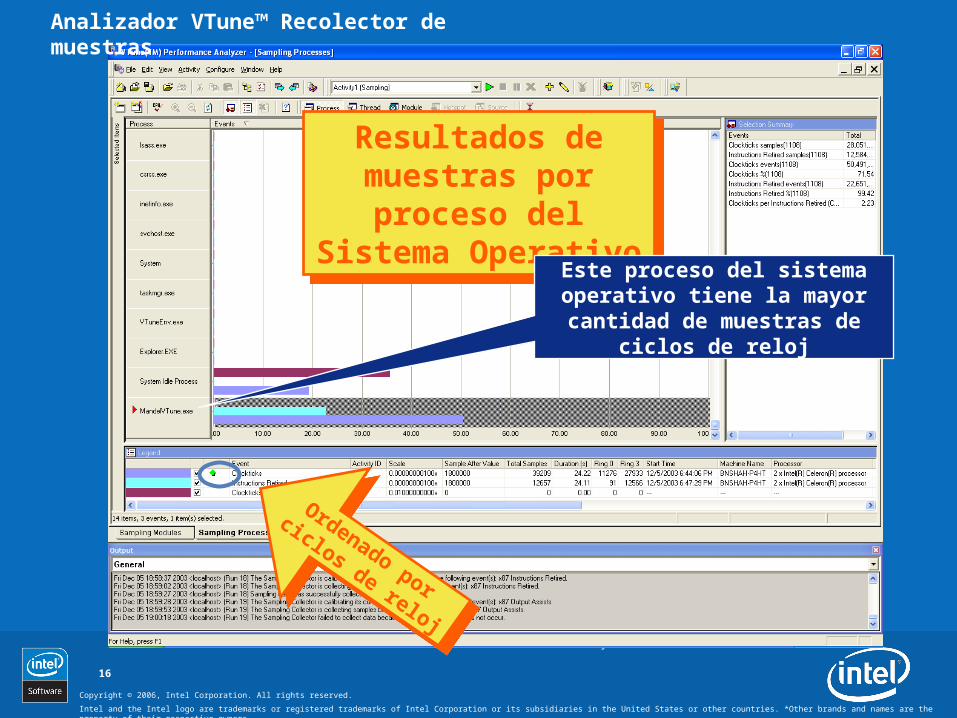
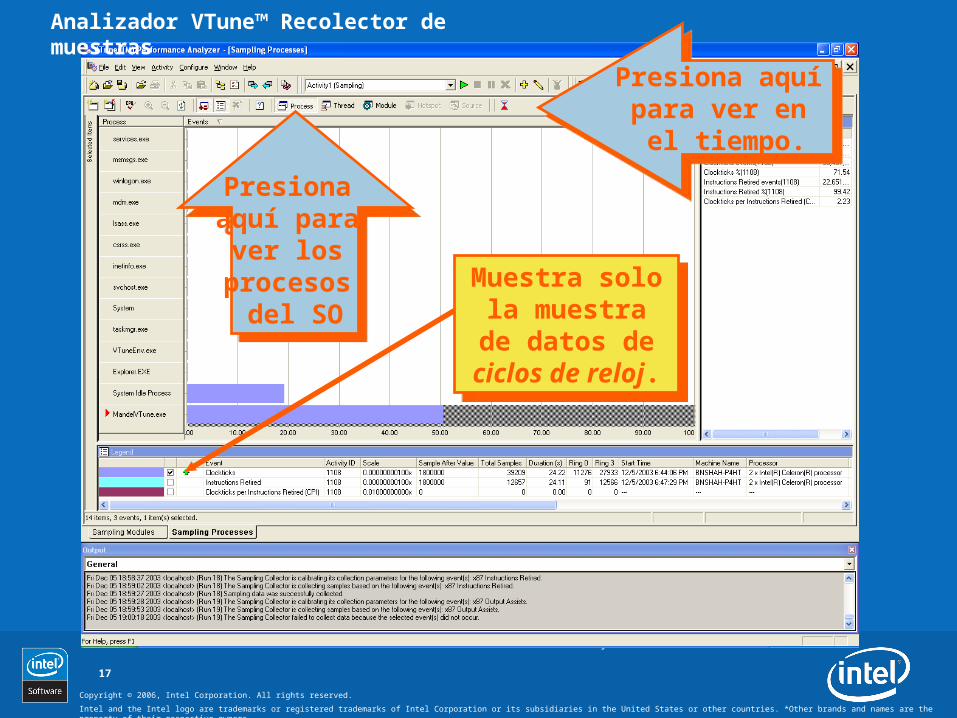
Resultados de muestras por
proceso del Sistema Operativo
Resultados de muestras por
proceso del Sistema Operativo
Este proceso del sistema operativo tiene la mayor cantidad
de muestras de ciclos de reloj
Ordenado por
ciclos de reloj
Ordenado por
ciclos de reloj
Analizador VTune™ Recolector de muestras
17
Copyright © 2006, Intel Corporation. All rights reserved.
Basics of VTune™ Performance Analyzer
Intel and the Intel logo are trademarks or registered trademarks of Intel Corporation or its subsidiaries in the United States or other countries. *Other brands and names are the property of their respective owners.
Presiona aquí para
ver los procesos
del SO
Presiona aquí para
ver los procesos
del SOMuestra solo la
muestra de datos de ciclos
de reloj.
Muestra solo la muestra de
datos de ciclos de reloj.
Analizador VTune™ Recolector de muestras
Presiona aquí para ver en el tiempo.
Presiona aquí para ver en el tiempo.
18
Copyright © 2006, Intel Corporation. All rights reserved.
Basics of VTune™ Performance Analyzer
Intel and the Intel logo are trademarks or registered trademarks of Intel Corporation or its subsidiaries in the United States or other countries. *Other brands and names are the property of their respective owners.
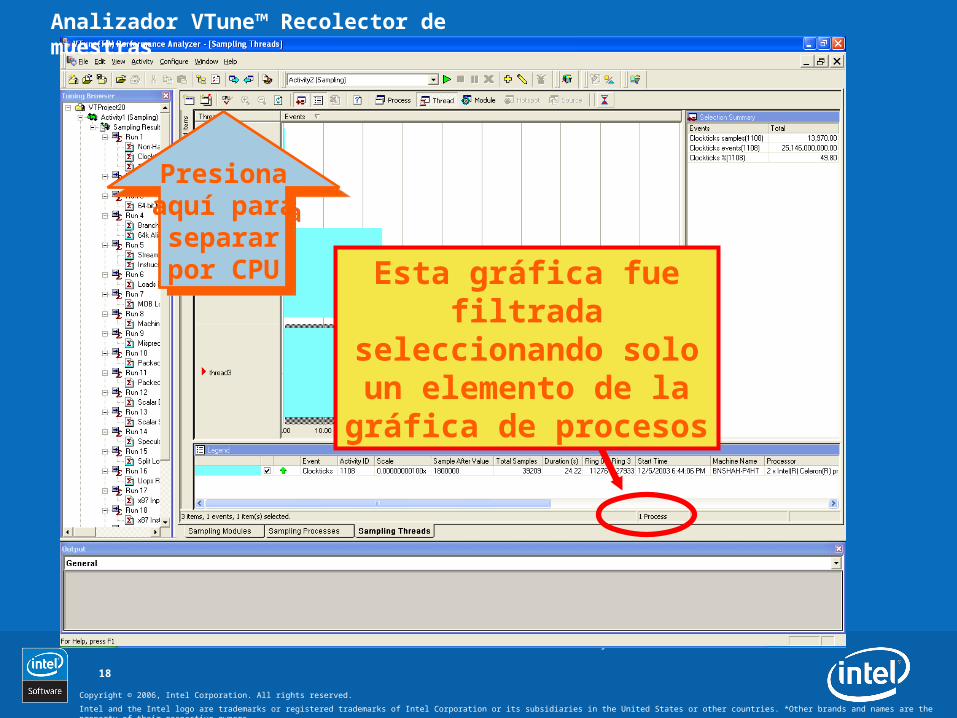
Esta gráfica fue filtrada seleccionando solo un elemento de la gráfica
de procesos
Analizador VTune™ Recolector de muestras
Presionaaquí parasepararpor CPU
Presionaaquí parasepararpor CPU
19
Copyright © 2006, Intel Corporation. All rights reserved.
Basics of VTune™ Performance Analyzer
Intel and the Intel logo are trademarks or registered trademarks of Intel Corporation or its subsidiaries in the United States or other countries. *Other brands and names are the property of their respective owners.
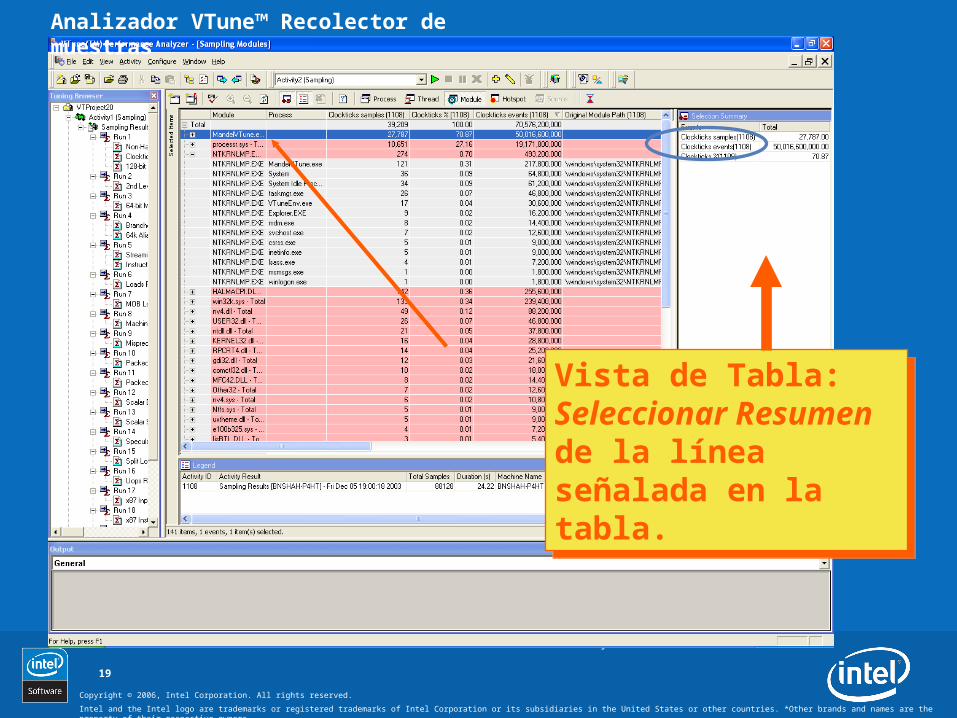
Vista de Tabla: Seleccionar Resumen de la línea señalada en la tabla.
Vista de Tabla: Seleccionar Resumen de la línea señalada en la tabla.
Analizador VTune™ Recolector de muestras

20
Copyright © 2006, Intel Corporation. All rights reserved.
Basics of VTune™ Performance Analyzer
Intel and the Intel logo are trademarks or registered trademarks of Intel Corporation or its subsidiaries in the United States or other countries. *Other brands and names are the property of their respective owners.
Vista del Hotspot de un módulo para todos los
procesos e hilos del SO agrupados por función (o
método).
Vista del Hotspot de un módulo para todos los
procesos e hilos del SO agrupados por función (o
método).
Analizador VTune™ Recolector de muestras
21
Copyright © 2006, Intel Corporation. All rights reserved.
Basics of VTune™ Performance Analyzer
Intel and the Intel logo are trademarks or registered trademarks of Intel Corporation or its subsidiaries in the United States or other countries. *Other brands and names are the property of their respective owners.
Analizador VTune™ Recolector de muestras

22
Copyright © 2006, Intel Corporation. All rights reserved.
Basics of VTune™ Performance Analyzer
Intel and the Intel logo are trademarks or registered trademarks of Intel Corporation or its subsidiaries in the United States or other countries. *Other brands and names are the property of their respective owners.
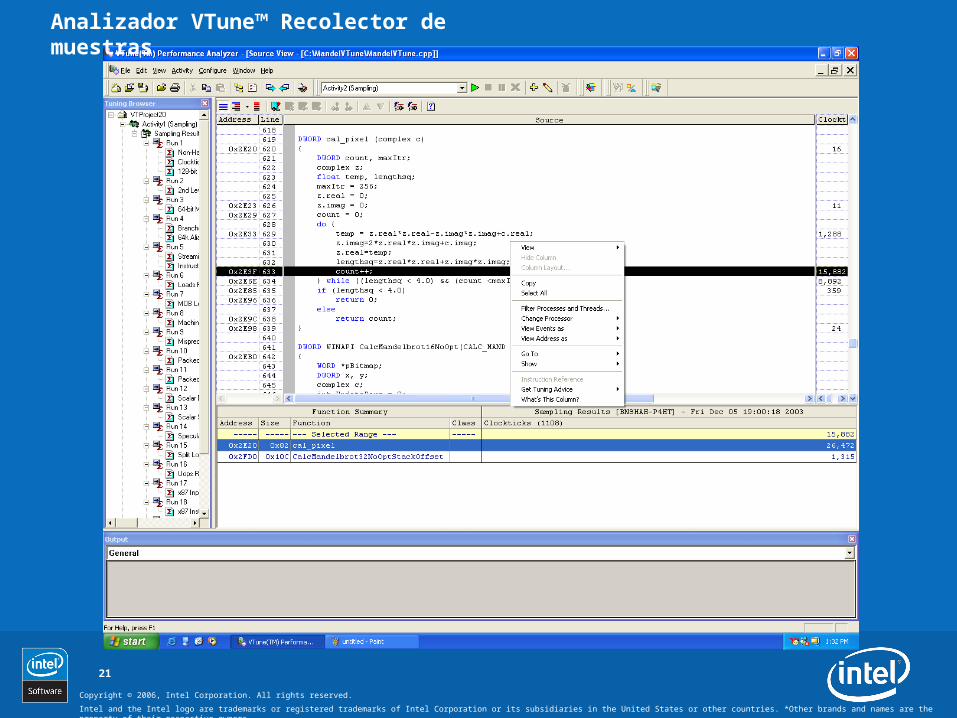
Totales por Linea FuenteTotales por Linea Fuente
Actividad en Localidades de Instrucciones
Analizador VTune™ Recolector de muestras
Presiona aquí para
Ver códigodesensamblado
Presiona aquí para
Ver códigodesensamblado

23
Copyright © 2006, Intel Corporation. All rights reserved.
Basics of VTune™ Performance Analyzer
Intel and the Intel logo are trademarks or registered trademarks of Intel Corporation or its subsidiaries in the United States or other countries. *Other brands and names are the property of their respective owners.
Totals for Source LineTotals for Source Line
Activity at Instruction Locations
Analizador VTune™ Recolector de muestras
Intervalos de tiempo en rojo tienen más muestras
Intervalos de tiempo en rojo tienen más muestras
AcercarAlejar
Seleccionar EventoSeleccionar Evento

24
Copyright © 2006, Intel Corporation. All rights reserved.
Basics of VTune™ Performance Analyzer
Intel and the Intel logo are trademarks or registered trademarks of Intel Corporation or its subsidiaries in the United States or other countries. *Other brands and names are the property of their respective owners.
Actividad 1: Encontrar el Hotspot
Aprender como identificar hotspots con el analizador VTune™.

25
Copyright © 2006, Intel Corporation. All rights reserved.
Basics of VTune™ Performance Analyzer
Intel and the Intel logo are trademarks or registered trademarks of Intel Corporation or its subsidiaries in the United States or other countries. *Other brands and names are the property of their respective owners.
Tres Beneficios Claves del Muestreo
No es necesario modificar código.
• Pero compila/encadena con símbolos y números de línea.
• Haz ejecutables finales (release) con optimizaciones.
El muestreo es muy amplio en cuanto a sistemas.
• No solo NUESTRA aplicación.
• Puede verse actividad en el código del sistema operativo incluyendo drivers.
La sobrecarga por muestrear es muy baja.
• La validez es mayor cuando la perturbación es baja.
• La sobrecarga puede reducirse aún más quitando el progreso la interfaz de usuario.
¿De qué otra forma puede reducirse la sobrecarga del muestreo?
¿De qué otra forma puede reducirse la sobrecarga del muestreo?
26
Copyright © 2006, Intel Corporation. All rights reserved.
Basics of VTune™ Performance Analyzer
Intel and the Intel logo are trademarks or registered trademarks of Intel Corporation or its subsidiaries in the United States or other countries. *Other brands and names are the property of their respective owners.
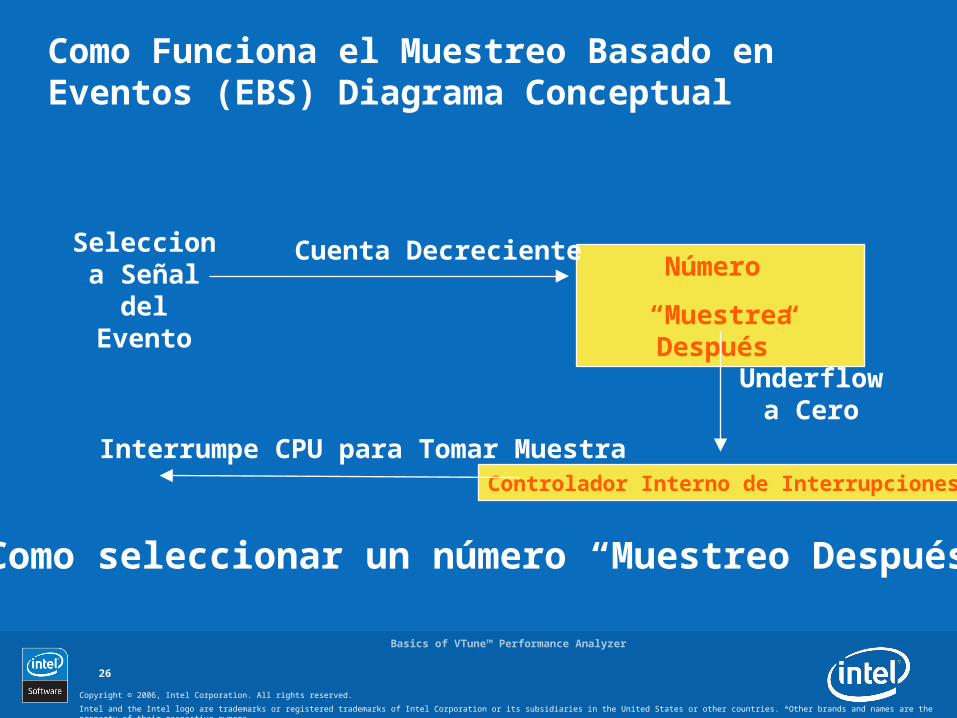
Como Funciona el Muestreo Basado en Eventos (EBS) Diagrama Conceptual
Selecciona Señal del Evento
Número
“Muestrea Después”
Cuenta Decreciente
Underflowa Cero
Controlador Interno de Interrupciones§
Interrumpe CPU para Tomar Muestra
Como seleccionar un número “Muestreo Después”
27
Copyright © 2006, Intel Corporation. All rights reserved.
Basics of VTune™ Performance Analyzer
Intel and the Intel logo are trademarks or registered trademarks of Intel Corporation or its subsidiaries in the United States or other countries. *Other brands and names are the property of their respective owners.
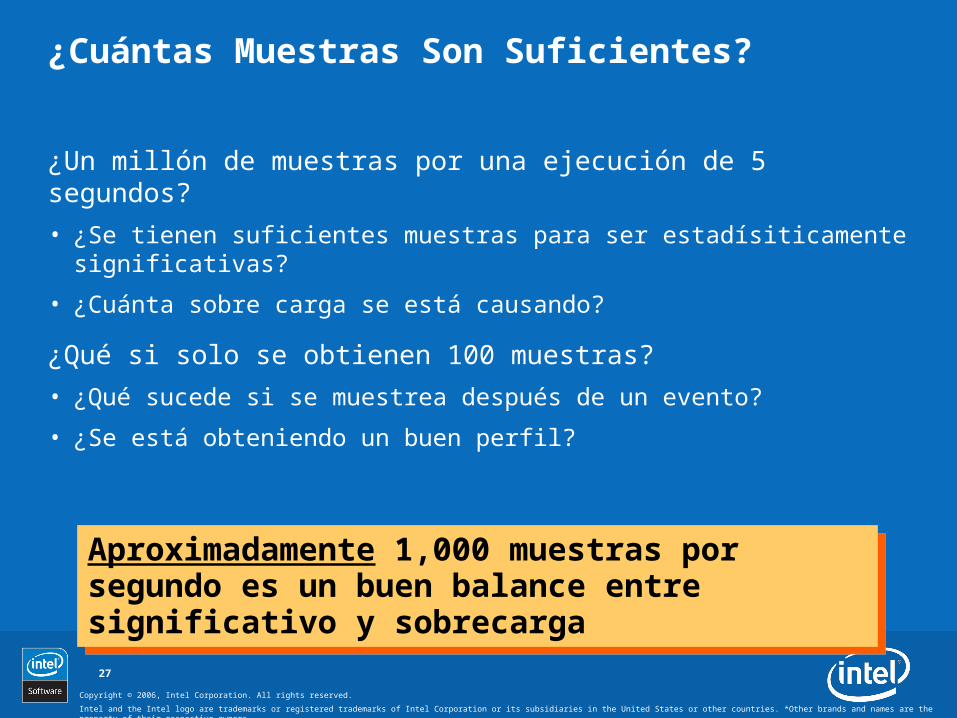
¿Cuántas Muestras Son Suficientes?
¿Un millón de muestras por una ejecución de 5 segundos?
• ¿Se tienen suficientes muestras para ser estadísiticamente significativas?
• ¿Cuánta sobre carga se está causando?
¿Qué si solo se obtienen 100 muestras?
• ¿Qué sucede si se muestrea después de un evento?
• ¿Se está obteniendo un buen perfil?
Aproximadamente 1,000 muestras por segundo es un buen balance entre significativo y sobrecargaAproximadamente 1,000 muestras por segundo es un buen balance entre significativo y sobrecarga

28
Copyright © 2006, Intel Corporation. All rights reserved.
Basics of VTune™ Performance Analyzer
Intel and the Intel logo are trademarks or registered trademarks of Intel Corporation or its subsidiaries in the United States or other countries. *Other brands and names are the property of their respective owners.
Objetivo: 1,000 Muestras Por Segundo
¿Cuál es la muestra después de valor por ciclo de reloj?
• Depende de la velocidad del reloj de CPU
• RESPUESTA: La velocidad de reloj del CPU en KHz• Si la velocidad de reloj del CPU = 1,400,000,000 Hz• Muestrear después de 1,400,000 ciclos
¿Qué es la muestra después de un valor de fallos de caché L2?
• Depende en que tan frecuente hay un fallo en la caché L2• ¿Definición circular? ¿No es lo que se está tratando de determinar?
• Haz una estimación inteligente• ¿Más o menos frecuente que los ciclos de reloj?• ¿10 veces? ¿100 veces? ¿1000 veces?
29
Copyright © 2006, Intel Corporation. All rights reserved.
Basics of VTune™ Performance Analyzer
Intel and the Intel logo are trademarks or registered trademarks of Intel Corporation or its subsidiaries in the United States or other countries. *Other brands and names are the property of their respective owners.
Calibración
Establecer el muestreo después de un valor para obtener un número de muestras razonable.• ~1000 muestras por segundo por CPU lógico
Requieres que la carga de trabajo sea ejecutada dos veces
Calibración Manual:• Quita la marca de Calibrate Sample After
• Encontrada en el diálogo Advanced Activity Configuration
• Inicia con el valor por default o una estimación
• Ejecuta una prueba
• Modifica la muestra después del valor y vuelve a probar
• Trata de obtener aproximadamente 1000 muestras por segundo por CPU lógico

30
Copyright © 2006, Intel Corporation. All rights reserved.
Basics of VTune™ Performance Analyzer
Intel and the Intel logo are trademarks or registered trademarks of Intel Corporation or its subsidiaries in the United States or other countries. *Other brands and names are the property of their respective owners.
Muestreo a Través del Tiempo
Muestra como distribuciones de las muestras cambian a través del tiempo por proceso, hilo, o módulo
Acercamiento en regiones de tiempo
Útil para:
• Identificar características de rendimiento variables en el tiempo
• Entender el comportamiento de los hilos
31
Copyright © 2006, Intel Corporation. All rights reserved.
Basics of VTune™ Performance Analyzer
Intel and the Intel logo are trademarks or registered trademarks of Intel Corporation or its subsidiaries in the United States or other countries. *Other brands and names are the property of their respective owners.
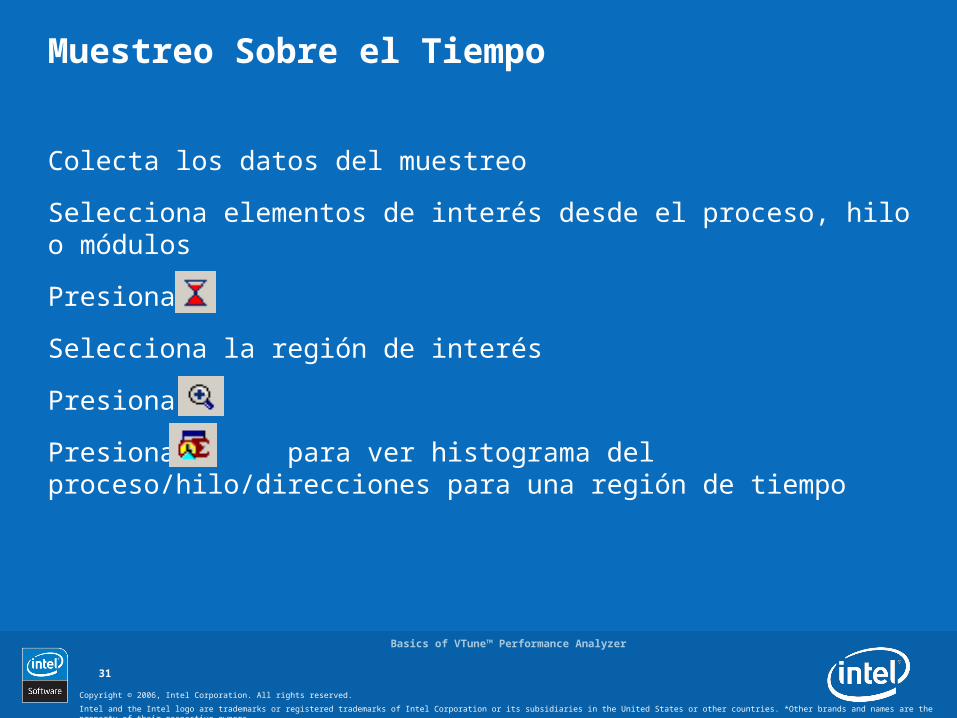
Muestreo Sobre el Tiempo
Colecta los datos del muestreo
Selecciona elementos de interés desde el proceso, hilo o módulos
Presiona
Selecciona la región de interés
Presiona
Presiona para ver histograma del proceso/hilo/direcciones para una región de tiempo
32
Copyright © 2006, Intel Corporation. All rights reserved.
Basics of VTune™ Performance Analyzer
Intel and the Intel logo are trademarks or registered trademarks of Intel Corporation or its subsidiaries in the United States or other countries. *Other brands and names are the property of their respective owners.
Actividad 2: Muestreo en el Tiempo
Aprender como usar la vista de Muestreo Sobre el Tiempo

33
Copyright © 2006, Intel Corporation. All rights reserved.
Basics of VTune™ Performance Analyzer
Intel and the Intel logo are trademarks or registered trademarks of Intel Corporation or its subsidiaries in the United States or other countries. *Other brands and names are the property of their respective owners.
Perfil de Gráfico de Llamadas
Rastrea la entrada de la función y puntos de salida del código durante la ejecución
Usa instrumentación binaria
Usas esos datos para determinar el flujo del programa, funciones críticas y secuencias de llamadas a subrutinas
No cualquier sistema: Solo perfila códigos en la ruta de llamadas de la aplicación en Ring 3
34
Copyright © 2006, Intel Corporation. All rights reserved.
Basics of VTune™ Performance Analyzer
Intel and the Intel logo are trademarks or registered trademarks of Intel Corporation or its subsidiaries in the United States or other countries. *Other brands and names are the property of their respective owners.
¿Qué se puede perfilar?
Aplicaciones Win32
Stand-alone Win32* DLLs
Stand-alone COM+ DLLs
Aplicaciones Java
Aplicaciones .NET*
Aplicaciones ASP.NET
Aplicaciones Linux32*

35
Copyright © 2006, Intel Corporation. All rights reserved.
Basics of VTune™ Performance Analyzer
Intel and the Intel logo are trademarks or registered trademarks of Intel Corporation or its subsidiaries in the United States or other countries. *Other brands and names are the property of their respective owners.
Vista del Gráfico de Llamadas
Las líneas rojas muestran la ruta crítica. La ruta crítica es la ruta de llamadas que más tiempo consume. Basada en el parámetro “self time”.
Las líneas rojas muestran la ruta crítica. La ruta crítica es la ruta de llamadas que más tiempo consume. Basada en el parámetro “self time”.
Los nodos en naranja indican funciones con el mayor “self time”.
Los nodos en naranja indican funciones con el mayor “self time”.
Filtrado por “self time”Filtrado por “self time”

36
Copyright © 2006, Intel Corporation. All rights reserved.
Basics of VTune™ Performance Analyzer
Intel and the Intel logo are trademarks or registered trademarks of Intel Corporation or its subsidiaries in the United States or other countries. *Other brands and names are the property of their respective owners.
Ventana del Gáfico de Llamadas
Usa la ventana de navegación del gráfico para ver el gráfico de llamadas completo.
Usa la ventana de navegación del gráfico para ver el gráfico de llamadas completo.
37
Copyright © 2006, Intel Corporation. All rights reserved.
Basics of VTune™ Performance Analyzer
Intel and the Intel logo are trademarks or registered trademarks of Intel Corporation or its subsidiaries in the United States or other countries. *Other brands and names are the property of their respective owners.
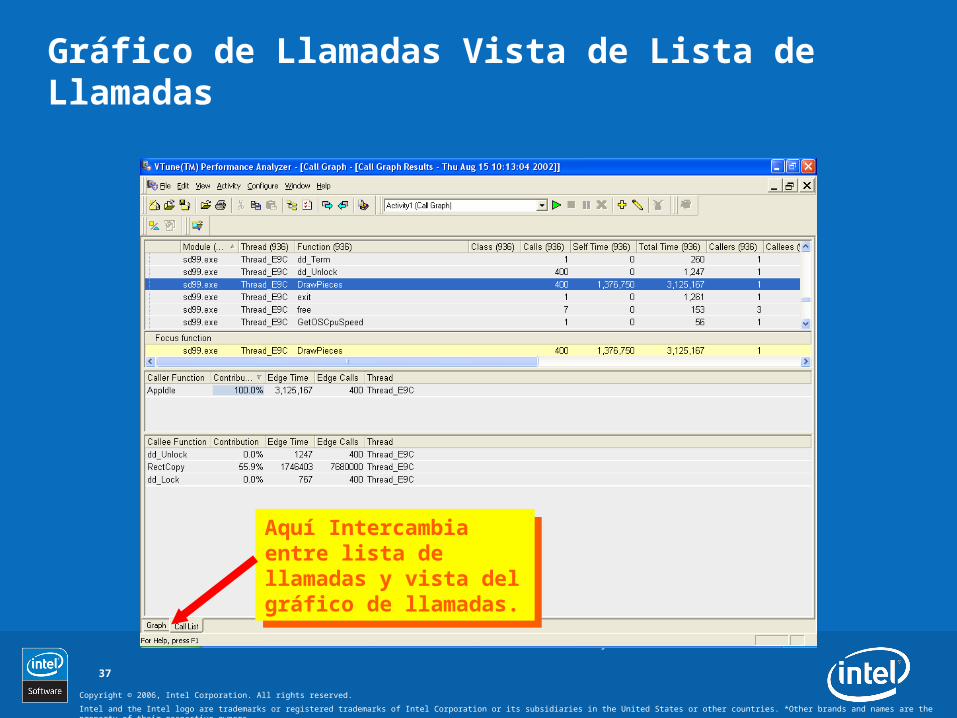
Aquí Intercambia entre lista de llamadas y vista del gráfico de llamadas.
Aquí Intercambia entre lista de llamadas y vista del gráfico de llamadas.
Gráfico de Llamadas Vista de Lista de Llamadas

38
Copyright © 2006, Intel Corporation. All rights reserved.
Basics of VTune™ Performance Analyzer
Intel and the Intel logo are trademarks or registered trademarks of Intel Corporation or its subsidiaries in the United States or other countries. *Other brands and names are the property of their respective owners.
Métricas del Gráfico de Llamadas (Call Graph)
Métrica de Rendimiento
Descripción
Self Time Tiempo total en una función, excluyendo el tiempo gastado en sus hijos (incluye tiempo de espera)
Total Time Tiempo medido desde que inicia una función hasta que sale de la función
Total Wait Time Tiempo gastado en una función y su hijo cuando el hilo se bloquea
Wait Time Tiempo gastado en una función cuando el hilo se bloquea (excluye el tiempo bloqueado en su hijo)
Calls Número de veces que se llama la función
39
Copyright © 2006, Intel Corporation. All rights reserved.
Basics of VTune™ Performance Analyzer
Intel and the Intel logo are trademarks or registered trademarks of Intel Corporation or its subsidiaries in the United States or other countries. *Other brands and names are the property of their respective owners.
Actividad 3: Gráfico de Llamadas
Encuentra el hotspot en el programa gzip usando el gráfico de llamadas.
40
Copyright © 2006, Intel Corporation. All rights reserved.
Basics of VTune™ Performance Analyzer
Intel and the Intel logo are trademarks or registered trademarks of Intel Corporation or its subsidiaries in the United States or other countries. *Other brands and names are the property of their respective owners.
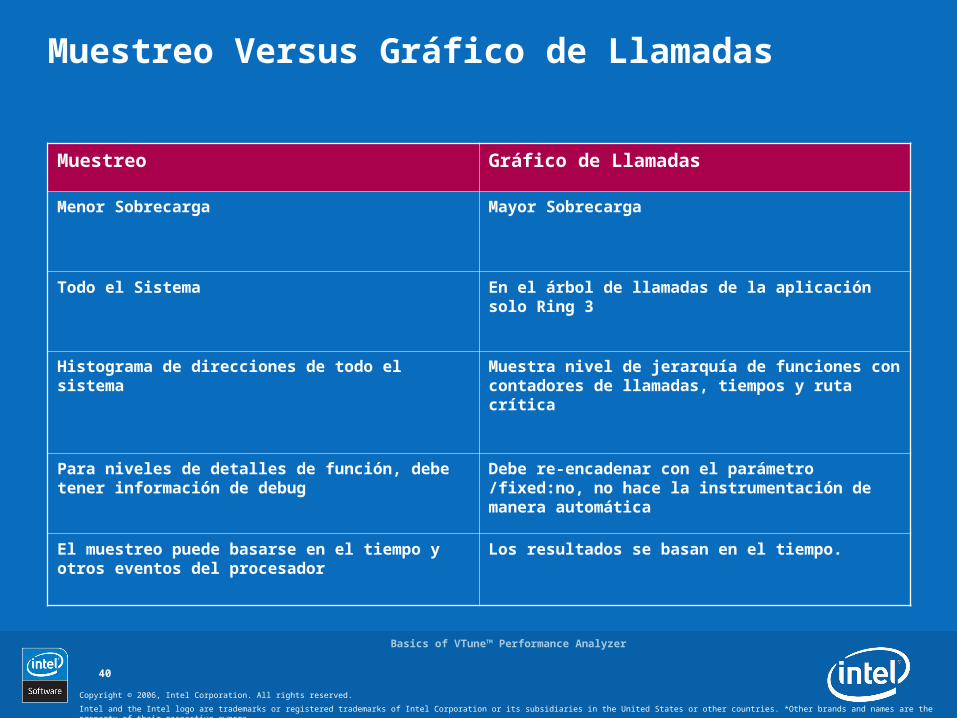
Muestreo Versus Gráfico de Llamadas
Muestreo Gráfico de Llamadas
Menor Sobrecarga Mayor Sobrecarga
Todo el Sistema En el árbol de llamadas de la aplicación solo Ring 3
Histograma de direcciones de todo el sistema
Muestra nivel de jerarquía de funciones con contadores de llamadas, tiempos y ruta crítica
Para niveles de detalles de función, debe tener información de debug
Debe re-encadenar con el parámetro /fixed:no, no hace la instrumentación de manera automática
El muestreo puede basarse en el tiempo y otros eventos del procesador
Los resultados se basan en el tiempo.
41
Copyright © 2006, Intel Corporation. All rights reserved.
Basics of VTune™ Performance Analyzer
Intel and the Intel logo are trademarks or registered trademarks of Intel Corporation or its subsidiaries in the United States or other countries. *Other brands and names are the property of their respective owners.
Aplicaciones Java* y .NET*
Proveen datos de rendimiento para código administrado y código no administrado
Da una idea de cómo llamadas de código administrado se traducen en llamadas Win32 *
Usa API de perfiles de código administrado e instrumentación binaria
42
Copyright © 2006, Intel Corporation. All rights reserved.
Basics of VTune™ Performance Analyzer
Intel and the Intel logo are trademarks or registered trademarks of Intel Corporation or its subsidiaries in the United States or other countries. *Other brands and names are the property of their respective owners.
Lo Básico del Analizador de Rendimiento VTune™ Lo Qué se ha Cubierto
Se pueden usar los diferentes perfiladores en el analizador Vtune para entender diferentes aspectos del rendimiento de una aplicación.

43
Copyright © 2006, Intel Corporation. All rights reserved.
Basics of VTune™ Performance Analyzer
Intel and the Intel logo are trademarks or registered trademarks of Intel Corporation or its subsidiaries in the United States or other countries. *Other brands and names are the property of their respective owners.

Diapositivas Adicionales

45
Copyright © 2006, Intel Corporation. All rights reserved.
Basics of VTune™ Performance Analyzer
Intel and the Intel logo are trademarks or registered trademarks of Intel Corporation or its subsidiaries in the United States or other countries. *Other brands and names are the property of their respective owners.
Counter Monitor Tracks Operating System Counter Monitor Tracks Operating System Counters Over TimeCounters Over Time
Counter Monitor Tracks Operating System Counter Monitor Tracks Operating System Counters Over TimeCounters Over Time
VTune™ Analyzer Features and Usage Models

46
Copyright © 2006, Intel Corporation. All rights reserved.
Basics of VTune™ Performance Analyzer
Intel and the Intel logo are trademarks or registered trademarks of Intel Corporation or its subsidiaries in the United States or other countries. *Other brands and names are the property of their respective owners.
The Tuning Assistant Provides Tuning Advice The Tuning Assistant Provides Tuning Advice Based on Performance DataBased on Performance Data
The Tuning Assistant Provides Tuning Advice The Tuning Assistant Provides Tuning Advice Based on Performance DataBased on Performance Data
VTune™ Analyzer Features and Usage Models
47
Copyright © 2006, Intel Corporation. All rights reserved.
Basics of VTune™ Performance Analyzer
Intel and the Intel logo are trademarks or registered trademarks of Intel Corporation or its subsidiaries in the United States or other countries. *Other brands and names are the property of their respective owners.
Intel® Tuning Assistant
Identifies bottlenecks in:
• Pentium® 4, Pentium M®, Itanium® 2, and Pentium® III processors.
Uses EBS and Counter Monitor data.
Shows scaling differences between different runs.
Code Coach is still available but is not enabled by default.

48
Copyright © 2006, Intel Corporation. All rights reserved.
Basics of VTune™ Performance Analyzer
Intel and the Intel logo are trademarks or registered trademarks of Intel Corporation or its subsidiaries in the United States or other countries. *Other brands and names are the property of their respective owners.
Intel® Tuning Assistant
49
Copyright © 2006, Intel Corporation. All rights reserved.
Basics of VTune™ Performance Analyzer
Intel and the Intel logo are trademarks or registered trademarks of Intel Corporation or its subsidiaries in the United States or other countries. *Other brands and names are the property of their respective owners.
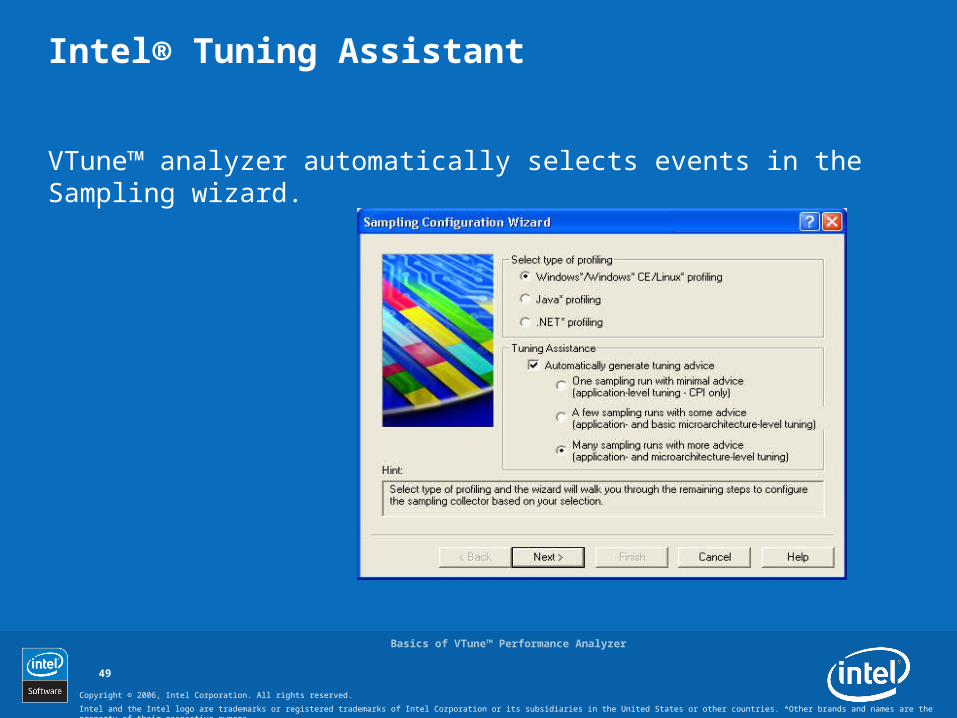
Intel® Tuning Assistant
VTune™ analyzer automatically selects events in the Sampling wizard.
50
Copyright © 2006, Intel Corporation. All rights reserved.
Basics of VTune™ Performance Analyzer
Intel and the Intel logo are trademarks or registered trademarks of Intel Corporation or its subsidiaries in the United States or other countries. *Other brands and names are the property of their respective owners.
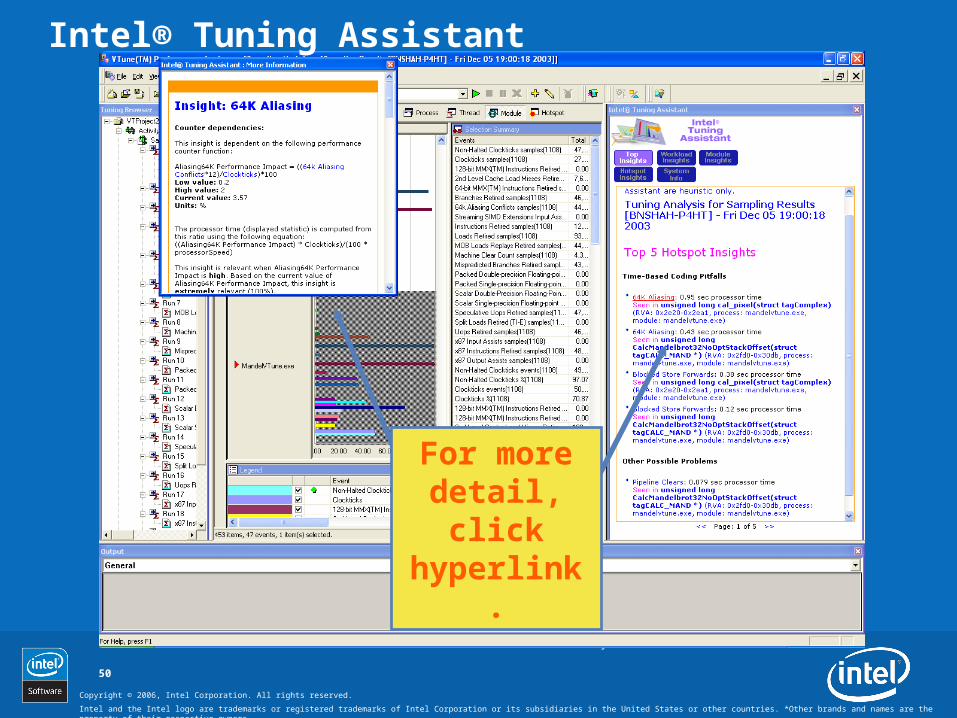
For more detail, click hyperlink.
Intel® Tuning Assistant

51
Copyright © 2006, Intel Corporation. All rights reserved.
Basics of VTune™ Performance Analyzer
Intel and the Intel logo are trademarks or registered trademarks of Intel Corporation or its subsidiaries in the United States or other countries. *Other brands and names are the property of their respective owners.
Lab Activity 3: Getting Tuning Advice
Learn how to get processor-specific tuning advice

52
Copyright © 2006, Intel Corporation. All rights reserved.
Basics of VTune™ Performance Analyzer
Intel and the Intel logo are trademarks or registered trademarks of Intel Corporation or its subsidiaries in the United States or other countries. *Other brands and names are the property of their respective owners.
Windows* Command Line Interface
Collect sampling data from the command line.
Useful for integrating performance data collection into your automated regression testing.
View the data in the VTune™ Performance Analyzer or export as ASCII text.
Invoke by typing “vtl” at the command line.

53
Copyright © 2006, Intel Corporation. All rights reserved.
Basics of VTune™ Performance Analyzer
Intel and the Intel logo are trademarks or registered trademarks of Intel Corporation or its subsidiaries in the United States or other countries. *Other brands and names are the property of their respective owners.
Windows* Command Line Interface
Creates hidden project structure
To create an activity: vtl create [activity name] + options
To run an activity: vtl run [activity name]
To view activities type: vtl show
To view results of a particular activity type: vtl view [activityname::result] [options]
To delete the entire project: vtl delete –all
To delete a specific activity: vtl delete <activity name>
54
Copyright © 2006, Intel Corporation. All rights reserved.
Basics of VTune™ Performance Analyzer
Intel and the Intel logo are trademarks or registered trademarks of Intel Corporation or its subsidiaries in the United States or other countries. *Other brands and names are the property of their respective owners.
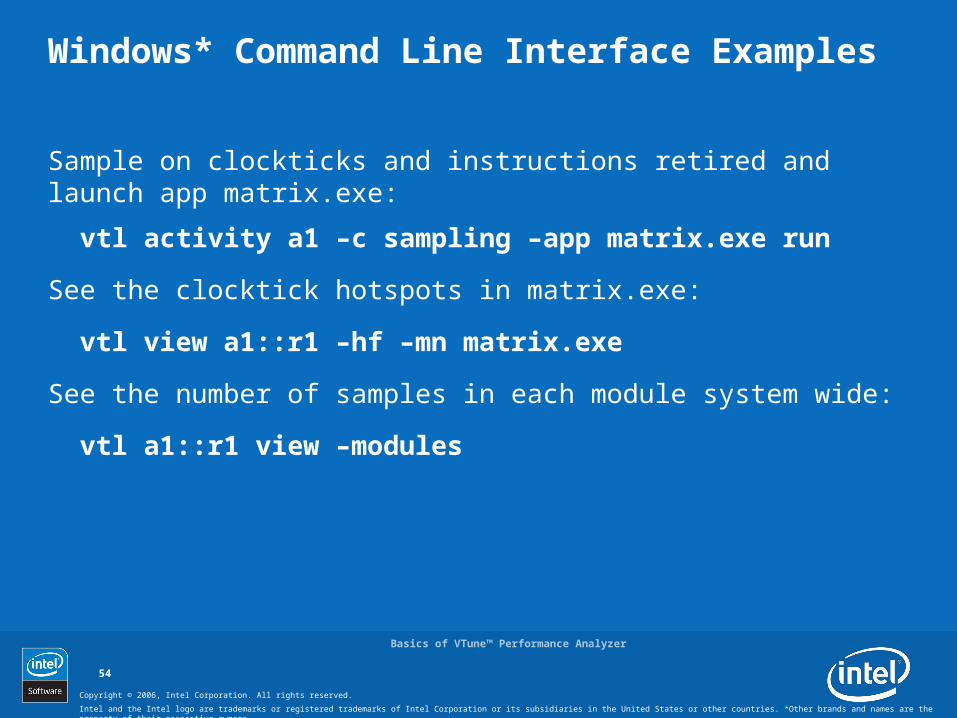
Windows* Command Line Interface Examples
Sample on clockticks and instructions retired and launch app matrix.exe:
vtl activity a1 –c sampling –app matrix.exe run
See the clocktick hotspots in matrix.exe:
vtl view a1::r1 –hf –mn matrix.exe
See the number of samples in each module system wide:
vtl a1::r1 view –modules
55
Copyright © 2006, Intel Corporation. All rights reserved.
Basics of VTune™ Performance Analyzer
Intel and the Intel logo are trademarks or registered trademarks of Intel Corporation or its subsidiaries in the United States or other countries. *Other brands and names are the property of their respective owners.
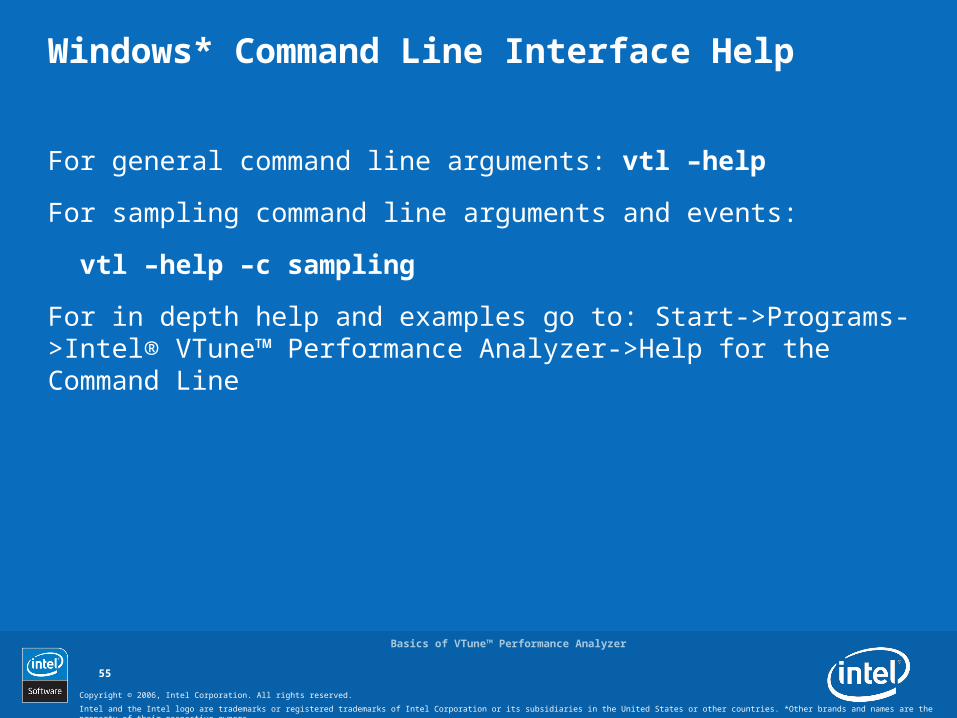
Windows* Command Line Interface Help
For general command line arguments: vtl –help
For sampling command line arguments and events:
vtl –help –c sampling
For in depth help and examples go to: Start->Programs->Intel® VTune™ Performance Analyzer->Help for the Command Line
56
Copyright © 2006, Intel Corporation. All rights reserved.
Basics of VTune™ Performance Analyzer
Intel and the Intel logo are trademarks or registered trademarks of Intel Corporation or its subsidiaries in the United States or other countries. *Other brands and names are the property of their respective owners.
Lab Activity 4:Using the Windows* Command Line Interface
Learn how to collect sampling data from the command line
57
Copyright © 2006, Intel Corporation. All rights reserved.
Basics of VTune™ Performance Analyzer
Intel and the Intel logo are trademarks or registered trademarks of Intel Corporation or its subsidiaries in the United States or other countries. *Other brands and names are the property of their respective owners.
Call Graph Advanced Configuration
Set instrumentation levels.
• Helps control overhead
Select which functions are instrumented.
• Helps control overhead
58
Copyright © 2006, Intel Corporation. All rights reserved.
Basics of VTune™ Performance Analyzer
Intel and the Intel logo are trademarks or registered trademarks of Intel Corporation or its subsidiaries in the United States or other countries. *Other brands and names are the property of their respective owners.
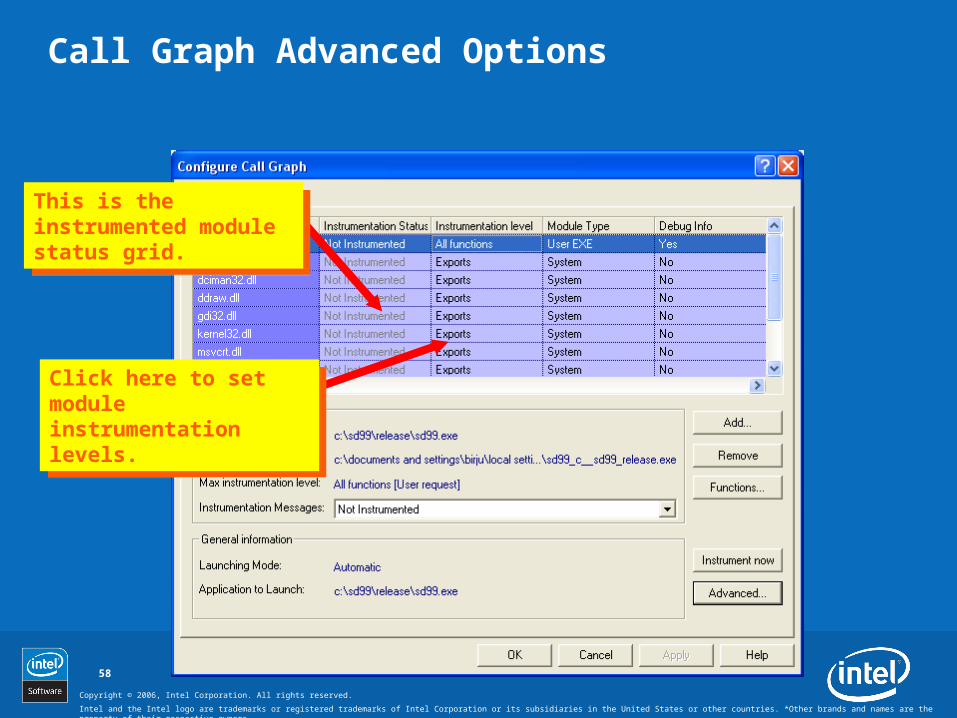
Call Graph Advanced Options
This is the instrumented module status grid.
This is the instrumented module status grid.
Click here to set module instrumentation levels.
Click here to set module instrumentation levels.

59
Copyright © 2006, Intel Corporation. All rights reserved.
Basics of VTune™ Performance Analyzer
Intel and the Intel logo are trademarks or registered trademarks of Intel Corporation or its subsidiaries in the United States or other countries. *Other brands and names are the property of their respective owners.
Instrumentation Levels
Instrumentation Level Description Debug Info Required?
All Functions Every function in the module is instrumented.
Yes
Custom You can specify which functions are instrumented
Yes
Export Every function in the module’s export table is instrumented.
No
Minimal The module is instrumented but no data is collected for it.
No

60
Copyright © 2006, Intel Corporation. All rights reserved.
Basics of VTune™ Performance Analyzer
Intel and the Intel logo are trademarks or registered trademarks of Intel Corporation or its subsidiaries in the United States or other countries. *Other brands and names are the property of their respective owners.
More Advanced Call Graph Options
Cache directory locationCache directory location
This is useful for long runs and very large applications. If you do not set this, the machine might run low on memory.
This is useful for long runs and very large applications. If you do not set this, the machine might run low on memory.
Allow call graph to instrument COM interfaces.
Allow call graph to instrument COM interfaces.

61
Copyright © 2006, Intel Corporation. All rights reserved.
Basics of VTune™ Performance Analyzer
Intel and the Intel logo are trademarks or registered trademarks of Intel Corporation or its subsidiaries in the United States or other countries. *Other brands and names are the property of their respective owners.
Function Selection
Click here to enable or disable instrumentation for a particular function.
Click here to enable or disable instrumentation for a particular function.

62
Copyright © 2006, Intel Corporation. All rights reserved.
Basics of VTune™ Performance Analyzer
Intel and the Intel logo are trademarks or registered trademarks of Intel Corporation or its subsidiaries in the United States or other countries. *Other brands and names are the property of their respective owners.
Use Sampling and Call Graph Together
Use sampling to find which functions have hotspots.
Use call graph to find out who is calling these functions.
63
Copyright © 2006, Intel Corporation. All rights reserved.
Basics of VTune™ Performance Analyzer
Intel and the Intel logo are trademarks or registered trademarks of Intel Corporation or its subsidiaries in the United States or other countries. *Other brands and names are the property of their respective owners.
Lab Activity 6:Using Sampling and Call Graph Together
Optimize an application (linpack) using sampling and call graph

64
Copyright © 2006, Intel Corporation. All rights reserved.
Basics of VTune™ Performance Analyzer
Intel and the Intel logo are trademarks or registered trademarks of Intel Corporation or its subsidiaries in the United States or other countries. *Other brands and names are the property of their respective owners.
Sampling and Call Graph Have Different Hotspots?
Self time includes blocked time.
Event-based sampling (EBS) and time-based sampling (TBS) do not include blocked time in functions (this usually appears in processor.sys).
Hotspots should be the same for self time – wait time (this is non-blocked self time).
65
Copyright © 2006, Intel Corporation. All rights reserved.
Basics of VTune™ Performance Analyzer
Intel and the Intel logo are trademarks or registered trademarks of Intel Corporation or its subsidiaries in the United States or other countries. *Other brands and names are the property of their respective owners.
What Counter Monitor Does
Collects hardware and software performance counter data
• Windows* Perfmon* counters
• Performance DLL SDK
Correlate counter data with sampling data

67
Copyright © 2006, Intel Corporation. All rights reserved.
Basics of VTune™ Performance Analyzer
Intel and the Intel logo are trademarks or registered trademarks of Intel Corporation or its subsidiaries in the United States or other countries. *Other brands and names are the property of their respective owners.
Performance DLL SDK
SDK for creating custom performance counters that can be used by counter monitor
Example: performance counter that measures the transactions per second for a server application

68
Copyright © 2006, Intel Corporation. All rights reserved.
Basics of VTune™ Performance Analyzer
Intel and the Intel logo are trademarks or registered trademarks of Intel Corporation or its subsidiaries in the United States or other countries. *Other brands and names are the property of their respective owners.
Monitor Window
Click to highlight different counter data in the graph.
Click to highlight different counter data in the graph.
69
Copyright © 2006, Intel Corporation. All rights reserved.
Basics of VTune™ Performance Analyzer
Intel and the Intel logo are trademarks or registered trademarks of Intel Corporation or its subsidiaries in the United States or other countries. *Other brands and names are the property of their respective owners.
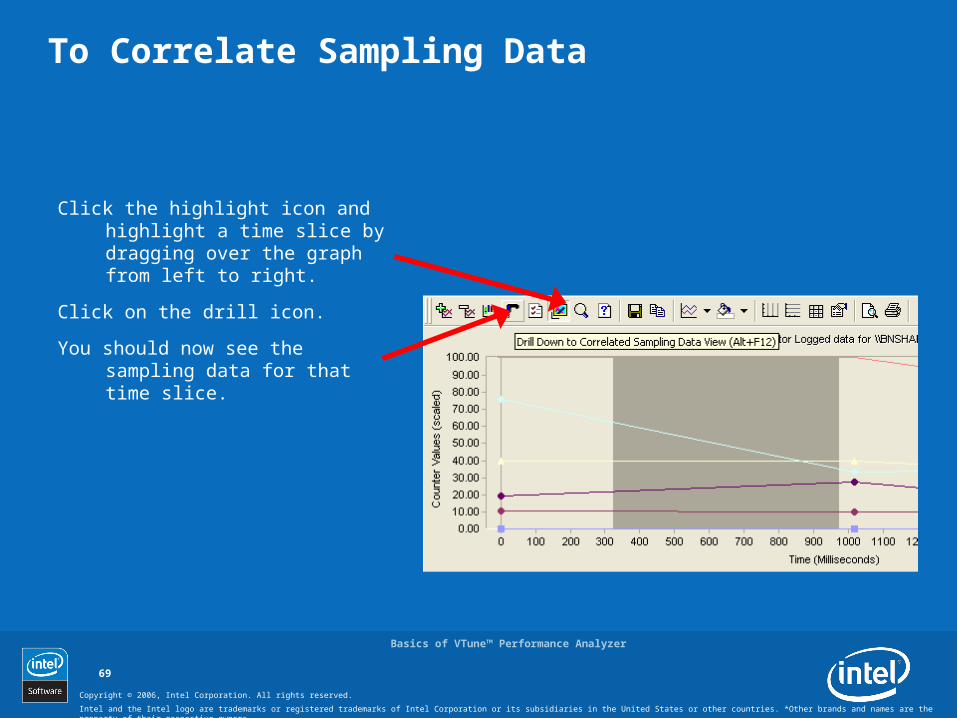
To Correlate Sampling Data
Click the highlight icon and highlight a time slice by dragging over the graph from left to right.
Click on the drill icon.
You should now see the sampling data for that time slice.
70
Copyright © 2006, Intel Corporation. All rights reserved.
Basics of VTune™ Performance Analyzer
Intel and the Intel logo are trademarks or registered trademarks of Intel Corporation or its subsidiaries in the United States or other countries. *Other brands and names are the property of their respective owners.
Lab Activity 7: Counter Monitor
Use counter monitor to analyze gzip

71
Copyright © 2006, Intel Corporation. All rights reserved.
Basics of VTune™ Performance Analyzer
Intel and the Intel logo are trademarks or registered trademarks of Intel Corporation or its subsidiaries in the United States or other countries. *Other brands and names are the property of their respective owners.
Trigger API
Allows you to create your own mechanism to programmatically trigger performance counter data collection
Example: collect counter monitor data every time a frame is rendered