Intro to Slope-Intercept Form
7
5.6 Intro Slope-Intercept Form Pattern #1 1. Take a look at this pattern on your own. Think about what is changing from figure to figure. Can you predict what figure 0 and figure 4 will look like? Discuss your observations and predictions with your group members and once everyone agrees, draw in figure 0 and figure 4. 2. How is the pattern growing? After discussing with your teammates, shade in the tiles that are new in each figure using a colored pencil. 3. If we use x to represent the figure number, can you write an equation that will give the total number of tiles in any figure? Pattern #2 1. As for the previous pattern, discuss this pattern with your group – how is it changing? What will future figures look like? Once everyone agrees, draw Figure 0 and Figure 4.
Transcript of Intro to Slope-Intercept Form

5.6 Intro Slope-Intercept Form
Pattern #1
1. Take a look at this pattern on your own. Think about what is changing from figure to figure. Can you predict what figure 0 and figure 4 will look like? Discuss your observations and predictions with your group members and once everyone agrees, draw in figure 0 and figure 4.
2. How is the pattern growing? After discussing with your teammates, shade in the tiles that are new in each figure using a colored pencil.
3. If we use x to represent the figure number, can you write an equation that will give the total number of tiles in any figure?
Pattern #2
1. As for the previous pattern, discuss this pattern with your group – how is it changing? What will future figures look like? Once everyone agrees, draw Figure 0 and Figure 4.
2. How is the pattern growing? After discussing with your group members, shade in the tiles that are new in each figure using a different color than for pattern #1.
3. If we use x to represent the figure number and y to represent the total number of tiles, can you write an equation that will relate x and y?

5.6 Intro continued
Pattern #3
1. Again, discuss with your group and once everyone agrees, draw Figure 0 and Figure 4.
2. Discuss with the group and shade in the tiles that are new in each figure using a color not used for the other two patterns.
3. Write an equation for this pattern where x is the figure number and y is the number of tiles in that figure.
Use the table below to organize your data. For each pattern, give the equation and the number of tiles in figures 0 through 4.
Figure #
Pattern 1y = ___________
Pattern 2y = ___________
Pattern 3y = ___________
0
1
2
3
4
Now, use your table to make a graph of the patterns (on the next page) using a different color for each line. Don’t forget to make a scale and label the axes.

5.6 Intro continued

5.6 Intro continued
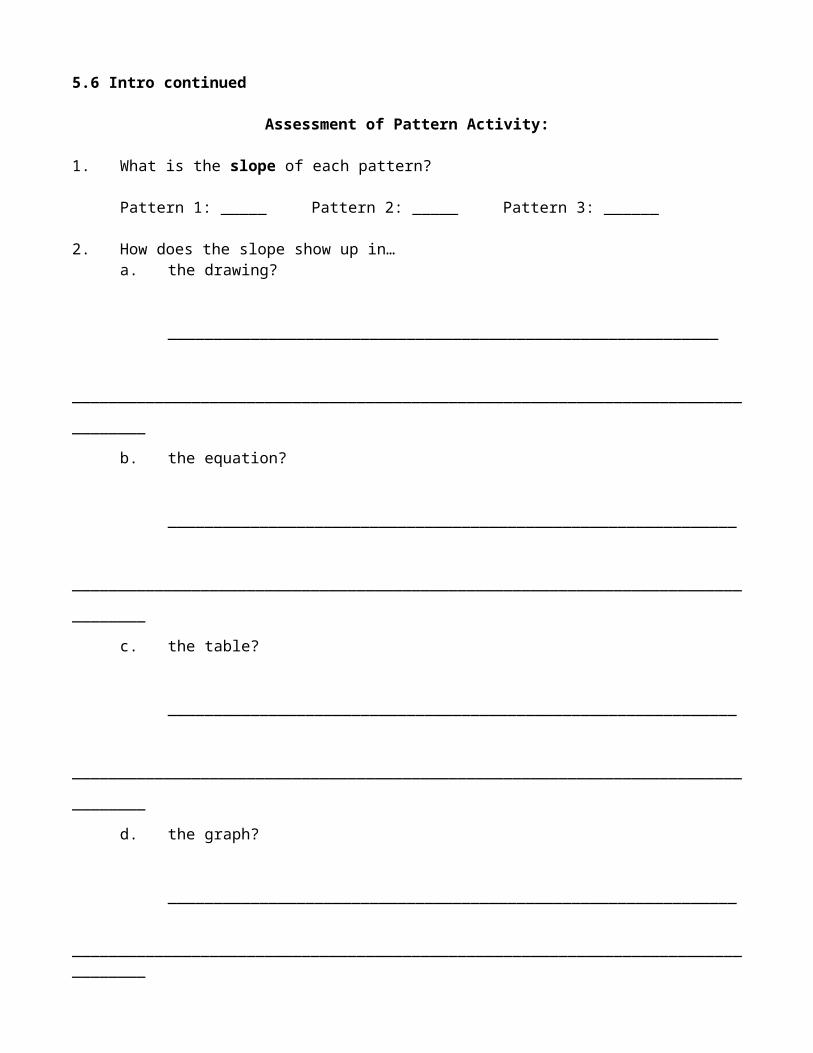
Assessment of Pattern Activity:
1. What is the slope of each pattern?
Pattern 1: _____ Pattern 2: _____ Pattern 3: ______
2. How does the slope show up in…a. the drawing?
____________________________________________________________
_________________________________________________________________________________
b. the equation?
______________________________________________________________
_________________________________________________________________________________
c. the table? ______________________________________________________________
_________________________________________________________________________________
d. the graph? ______________________________________________________________
_________________________________________________________________________________
3. What is the y-intercept of each pattern?
Pattern 1: _____ Pattern 2: _____ Pattern 3: ______
4. How does the y-intercept show up in…a. the drawing?
______________________________________________________________
_________________________________________________________________________________
b. the equation?
______________________________________________________________
_________________________________________________________________________________
c. the table? ______________________________________________________________
_________________________________________________________________________________
d. the graph? ______________________________________________________________
_________________________________________________________________________________5) All of the equations that you have written in this activity are in slope-intercept form
(y = mx + b). Why do you think that this form of an equation has this name? What does the m stand for? What does the b stand for?
6) Each of the following equations represents another linear pattern. For each one, state the starting number (aka y-intercept) and the “grow-by” number (aka slope).
a) y = 5x – 6 b) y = -2x c) 3y – 2x = 12 (careful!!)