
Intrinsic excitation-inhibition imbalance affects medial ...
31
*For correspondence: [email protected] † These authors contributed equally to this work ‡ These authors also contributed equally to this work Competing interest: See page 24 Funding: See page 24 Received: 02 February 2020 Accepted: 29 June 2020 Published: 04 August 2020 Reviewing editor: Michael Breakspear, QIMR Berghofer Medical Research Institute, Australia Copyright Trakoshis et al. This article is distributed under the terms of the Creative Commons Attribution License, which permits unrestricted use and redistribution provided that the original author and source are credited. Intrinsic excitation-inhibition imbalance affects medial prefrontal cortex differently in autistic men versus women Stavros Trakoshis 1,2† , Pablo Martı´nez-Can ˜ ada 3,4† , Federico Rocchi 5 , Carola Canella 5 , Wonsang You 6 , Bhismadev Chakrabarti 7,8 , Amber NV Ruigrok 7 , Edward T Bullmore 9,10 , John Suckling 10 , Marija Markicevic 11,12 , Valerio Zerbi 11,12 , MRC AIMS Consortium, Simon Baron-Cohen 7,9 , Alessandro Gozzi 5‡ , Meng-Chuan Lai 7,13,14,15,16‡ , Stefano Panzeri 3‡ , Michael V Lombardo 1,7‡ * 1 Laboratory for Autism and Neurodevelopmental Disorders, Center for Neuroscience and Cognitive Systems @UniTn, Istituto Italiano di Tecnologia, Rovereto, Italy; 2 Department of Psychology, University of Cyprus, Nicosia, Cyprus; 3 Neural Computation Laboratory, Center for Neuroscience and Cognitive Systems @UniTn, Istituto Italiano di Tecnologia, Rovereto, Italy; 4 Optical Approaches to Brain Function Laboratory, Department of Neuroscience and Brain Technologies, Istituto Italiano di Tecnologia, Genova, Italy; 5 Functional Neuroimaging Laboratory, Center for Neuroscience and Cognitive Systems @UniTn, Istituto Italiano di Tecnologia, Rovereto, Italy; 6 Artificial Intelligence and Image Processing Laboratory, Department of Information and Communications Engineering, Sun Moon University, Asan, Republic of Korea; 7 Autism Research Centre, Department of Psychiatry, University of Cambridge, Cambridge, United Kingdom; 8 Centre for Integrative Neuroscience and Neurodynamics, School of Psychology and Clinical Language Sciences, University of Reading, Reading, United Kingdom; 9 Cambridgeshire and Peterborough National Health Service Foundation Trust, Cambridge, United Kingdom; 10 Brain Mapping Unit, Department of Psychiatry, University of Cambridge, Cambridge, United Kingdom; 11 Neural Control of Movement Lab, D-HEST, ETH Zurich, Zurich, Switzerland; 12 Neuroscience Center Zurich, University and ETH Zurich, Zurich, Switzerland; 13 The Margaret and Wallace McCain Centre for Child, Youth & Family Mental Health, Azrieli Adult Neurodevelopmental Centre, and Campbell Family Mental Health Research Institute, Centre for Addiction and Mental Health, Toronto, Canada; 14 Department of Psychiatry and Autism Research Unit, The Hospital for Sick Children, Toronto, Canada; 15 Department of Psychiatry, Faculty of Medicine, University of Toronto, Toronto, Canada; 16 Department of Psychiatry, National Taiwan University Hospital and College of Medicine, Taipei, Taiwan Abstract Excitation-inhibition (E:I) imbalance is theorized as an important pathophysiological mechanism in autism. Autism affects males more frequently than females and sex-related mechanisms (e.g., X-linked genes, androgen hormones) can influence E:I balance. This suggests that E:I imbalance may affect autism differently in males versus females. With a combination of in- silico modeling and in-vivo chemogenetic manipulations in mice, we first show that a time-series metric estimated from fMRI BOLD signal, the Hurst exponent (H), can be an index for underlying change in the synaptic E:I ratio. In autism we find that H is reduced, indicating increased excitation, in the medial prefrontal cortex (MPFC) of autistic males but not females. Increasingly intact MPFC Trakoshis et al. eLife 2020;9:e55684. DOI: https://doi.org/10.7554/eLife.55684 1 of 31 RESEARCH ARTICLE
Transcript of Intrinsic excitation-inhibition imbalance affects medial ...

*For correspondence:
†These authors contributed
equally to this work‡These authors also contributed
equally to this work
Competing interest: See
page 24
Funding: See page 24
Received: 02 February 2020
Accepted: 29 June 2020
Published: 04 August 2020
Reviewing editor: Michael
Breakspear, QIMR Berghofer
Medical Research Institute,
Australia
Copyright Trakoshis et al. This
article is distributed under the
terms of the Creative Commons
Attribution License, which
permits unrestricted use and
redistribution provided that the
original author and source are
credited.
Intrinsic excitation-inhibition imbalanceaffects medial prefrontal cortexdifferently in autistic men versus womenStavros Trakoshis1,2†, Pablo Martınez-Canada3,4†, Federico Rocchi5,Carola Canella5, Wonsang You6, Bhismadev Chakrabarti7,8, Amber NV Ruigrok7,Edward T Bullmore9,10, John Suckling10, Marija Markicevic11,12, Valerio Zerbi11,12,MRC AIMS Consortium, Simon Baron-Cohen7,9, Alessandro Gozzi5‡,Meng-Chuan Lai7,13,14,15,16‡, Stefano Panzeri3‡, Michael V Lombardo1,7‡*
1Laboratory for Autism and Neurodevelopmental Disorders, Center forNeuroscience and Cognitive Systems @UniTn, Istituto Italiano di Tecnologia,Rovereto, Italy; 2Department of Psychology, University of Cyprus, Nicosia, Cyprus;3Neural Computation Laboratory, Center for Neuroscience and Cognitive Systems@UniTn, Istituto Italiano di Tecnologia, Rovereto, Italy; 4Optical Approaches toBrain Function Laboratory, Department of Neuroscience and Brain Technologies,Istituto Italiano di Tecnologia, Genova, Italy; 5Functional Neuroimaging Laboratory,Center for Neuroscience and Cognitive Systems @UniTn, Istituto Italiano diTecnologia, Rovereto, Italy; 6Artificial Intelligence and Image Processing Laboratory,Department of Information and Communications Engineering, Sun Moon University,Asan, Republic of Korea; 7Autism Research Centre, Department of Psychiatry,University of Cambridge, Cambridge, United Kingdom; 8Centre for IntegrativeNeuroscience and Neurodynamics, School of Psychology and Clinical LanguageSciences, University of Reading, Reading, United Kingdom; 9Cambridgeshire andPeterborough National Health Service Foundation Trust, Cambridge, UnitedKingdom; 10Brain Mapping Unit, Department of Psychiatry, University ofCambridge, Cambridge, United Kingdom; 11Neural Control of Movement Lab,D-HEST, ETH Zurich, Zurich, Switzerland; 12Neuroscience Center Zurich, Universityand ETH Zurich, Zurich, Switzerland; 13The Margaret and Wallace McCain Centre forChild, Youth & Family Mental Health, Azrieli Adult Neurodevelopmental Centre,and Campbell Family Mental Health Research Institute, Centre for Addiction andMental Health, Toronto, Canada; 14Department of Psychiatry and Autism ResearchUnit, The Hospital for Sick Children, Toronto, Canada; 15Department of Psychiatry,Faculty of Medicine, University of Toronto, Toronto, Canada; 16Department ofPsychiatry, National Taiwan University Hospital and College of Medicine, Taipei,Taiwan
Abstract Excitation-inhibition (E:I) imbalance is theorized as an important pathophysiological
mechanism in autism. Autism affects males more frequently than females and sex-related
mechanisms (e.g., X-linked genes, androgen hormones) can influence E:I balance. This suggests
that E:I imbalance may affect autism differently in males versus females. With a combination of in-
silico modeling and in-vivo chemogenetic manipulations in mice, we first show that a time-series
metric estimated from fMRI BOLD signal, the Hurst exponent (H), can be an index for underlying
change in the synaptic E:I ratio. In autism we find that H is reduced, indicating increased excitation,
in the medial prefrontal cortex (MPFC) of autistic males but not females. Increasingly intact MPFC
Trakoshis et al. eLife 2020;9:e55684. DOI: https://doi.org/10.7554/eLife.55684 1 of 31
RESEARCH ARTICLE
H is also associated with heightened ability to behaviorally camouflage social-communicative
difficulties, but only in autistic females. This work suggests that H in BOLD can index synaptic E:I
ratio and that E:I imbalance affects autistic males and females differently.
IntroductionExcitation-inhibition (E:I) balance in the brain has been hypothesized to be atypical in many neuro-
psychiatric conditions (Rubenstein and Merzenich, 2003; Sohal and Rubenstein, 2019), including
autism. Rubenstein and Merzenich originally suggested that some types of autism may be explained
by an E:I imbalance that may lead to hyper-excitability in cortical circuitry and potentially enhanced
levels of neuronal noise (Rubenstein and Merzenich, 2003). However, coming to a better under-
standing of how E:I balance is affected across a heterogeneous mixture of autistic individuals has
proven to be challenging because of the limited availability of robust E:I biomarkers that are non-
invasive and applicable in humans and which can be measured on a large scale. A majority of the lit-
erature about E:I balance in autism extends from investigations of prominent single gene mutations
associated with autism and the animal model research around these genes (Sohal and Rubenstein,
2019; Nelson and Valakh, 2015). This leaves a significant gap in evaluating the E:I theory on a
larger majority of the autistic population. While no one theory can fully explain all individuals with an
autism diagnosis (Happe et al., 2006; Lombardo et al., 2019a), the E:I imbalance theory may have
utility for understanding subtypes of autistic individuals (Lombardo et al., 2015; Lombardo et al.,
2018a; Lombardo et al., 2019b).
Sex/gender may be an important stratifier of relevance for highlighting E:I imbalance subtypes
(Lai et al., 2015; Lai et al., 2017a). Many highly penetrant autism-associated genes are located on
the sex chromosomes (e.g., FMR1, MECP2, NLGN3, GABRA3, ARX, SYN1) and are known to lead to
pathophysiology implicating E:I dysregulation (Rubenstein and Merzenich, 2003; Lee et al., 2017;
Bozzi et al., 2018). Other genes playing important roles in the balance between excitation and inhi-
bition in the brain (e.g., MEF2C, GRIK2, GRIA1, SCN3A, SCN9A, NPTX2) are highly sensitive to
androgens in human neuronal stem cells and are highly expressed in ‘social brain’ circuitry such as
the default mode network, and in particular, the medial prefrontal cortex (MPFC) (Lombardo et al.,
2018b). Optogenetic stimulation to enhance excitation in mouse MPFC also results in changes in
social behavior (Yizhar et al., 2011; Selimbeyoglu et al., 2017). These results hint that sex-relevant
biological mechanisms affect E:I balance and that key social brain regions such as MPFC may be of
particular importance for explaining how E:I imbalance affects social behavior. Sex/gender heteroge-
neity also leads to differing clinical presentations and compensatory mechanisms in autism that may
depend on E:I balance in MPFC. It is known that many cognitively able adult autistic women engage
in camouflaging behaviors that tend to compensate or mask their social-communicative difficulties
moreso than autistic men (Lai et al., 2017b; Hull et al., 2020; Schuck et al., 2019). Prior work has
shown that whereas autistic males show reduced ventral MPFC (vMPFC) self-representation
response, autistic females show intact vMPFC self-representation. Furthermore, the degree to which
vMPFC shows intact self-representation response in autistic females is associated with enhanced
ability to camouflage (Lai et al., 2019). If E:I imbalance asymmetrically affects vMPFC function in
males versus females, this could help explain differential camouflaging in adult autistic females.
To better understand sex-specific E:I imbalance in autism we need better neuroimaging bio-
markers that index underlying synaptic E:I mechanisms and which can be deployed on a large-scale
for in-vivo investigation in deeply phenotyped cohorts. Here we pursue the idea that spectral prop-
erties of neural time-series data (e.g., local field potentials (LFP) or blood oxygen level dependent
(BOLD) signal) could be used to isolate such biomarkers. It has been long known that LFP and rest-
ing state fMRI (rsfMRI) data exhibits rich spectral properties, with power decreasing as function of
frequency (Bullmore et al., 2001; Maxim et al., 2005; He, 2011; Bedard et al., 2006; He, 2014).
Models of neural networks have reported that the E:I ratio has profound effects on the spectral
shape of electrophysiological activity (Brunel and Wang, 2003; Mazzoni et al., 2008;
Lombardi et al., 2017). Recent work with simplified models has proposed that the exponent of the
1/f spectral power law, an index closely related to the Hurst exponent (H), reflects the extent of E:I
imbalance (Gao et al., 2017). This suggests that neurophysiologically heightened E:I ratio generates
flatter 1/f slope in LFP data and this could drive H (as measured in BOLD) to be decreased. In past
Trakoshis et al. eLife 2020;9:e55684. DOI: https://doi.org/10.7554/eLife.55684 2 of 31
Research article Neuroscience Medicine

work we have shown that H is atypically decreased in rsfMRI data of adult autistic males, particularly
for social brain areas like MPFC (Lai et al., 2010). H is statistically relevant for the concept of ‘neural
noise’ since lower levels of H can be interpreted as closer to what would be expected of a
completely noisy random signal (e.g., white noise produces an H = 0.5). Related to H and long-mem-
ory characteristics of the rsfMRI time-series, prior work has also shown case-control differences in
the intrinsic neural timescale in autism (e.g., magnitude of temporal autocorrelation)
(Watanabe et al., 2019). However, these prior studies examine primarily male-dominated samples
and thus cannot shed insight into sex-related heterogeneity in autism.
In this work we aim to better understand how E:I imbalance may differentially affect autistic males
and females. To achieve this aim, we first took a bottom-up approach by using in-silico (i.e. computa-
tional) models of local neuronal microcircuitry to make predictions about how H and 1/f slope in LFP
and rsfMRI BOLD data may behave when there are underlying changes in E:I balance. Importantly,
our approach takes a major step forward from prior work (Gao et al., 2017) by utilizing a model that
includes interactions within and between excitatory and inhibitory neuronal populations. Next, our
in-silico predictions are then tested in-vivo with a combination of rsfMRI and experimental
eLife digest Autism is a condition that is usually diagnosed early in life that affects how a
person communicates and socializes, and is often characterized by repetitive behaviors. One key
theory of autism is that it reflects an imbalance in levels of excitation and inhibition in the brain.
Excitatory signals are those that make other brain cells more likely to become active; inhibitory
signals have the opposite effect. In non-autistic individuals, inhibitory activity outweighs excitatory
activity. In people with autism, by contrast, an increase in excitatory activity is believed to produce
an imbalance in excitation and inhibition.
Most of the evidence to support this excitation-inhibition imbalance theory has come from
studies of rare mutations that cause autism. Many of these mutations occur on the sex chromosomes
or are influenced by androgen hormones (hormones that usually play a role on typically male traits).
However, most people with autism do not possess these particular mutations. It was thus unclear
whether the theory could apply to everyone with autism or, for example, whether it may better
apply to specific groups of individuals based on their sex or gender. This is especially important
given that about four times as many men and boys compared to women and girls are diagnosed
with autism.
Trakoshis, Martınez-Canada et al. have now found a way to ask whether any imbalance in
excitation and inhibition in the brain occurs differently in men and women. Using computer
modeling, they identified a signal in brain scans that corresponds to an imbalance of excitation and
inhibition. After showing that the technique works to identify real increases in excitation in the brain
scans of mice, Trakoshis, Martınez-Canada et al. looked for this signal, or biomarker, in brain scans
of people with and without autism. All the people in the study identified with the gender that
matched the sex they were assigned at birth. The results revealed differences between the men and
women with autism. Men with autism showed an imbalance in excitation and inhibition in specific
‘social brain’ regions including the medial prefrontal cortex, but women with autism did not.
Notably, many of these brain regions are strongly affected by androgen hormones.
Previous studies have found that women with autism are sometimes better at hiding or
‘camouflaging’ their difficulties when socializing or communicating than men with autism. Trakoshis,
Martınez-Canada et al. showed that the better a woman was at camouflaging her autism, the more
her brain activity in this region resembled that of non-autistic women.
Excitation-inhibition imbalance may thus affect specific brain regions involved in socializing and
communication more in men who have autism than in women with the condition. Balanced
excitation and inhibition in these brain areas may enable some women with autism to camouflage
their difficulties socializing or communicating. Being able to detect imbalances in activity using
standard brain imaging could be useful for clinical trials. Future studies could use this biomarker to
monitor responses to drug treatments that aim to adjust the balance between excitation and
inhibition.
Trakoshis et al. eLife 2020;9:e55684. DOI: https://doi.org/10.7554/eLife.55684 3 of 31
Research article Neuroscience Medicine
manipulations in mice that either increase neurophysiological excitation or that silence the local
activity in the network. Chemogenetic (i.e. designer receptors exclusively activated by designer
drugs; DREADD) or optogenetic manipulations are optimally suited to these purposes, owing to the
possibility of enabling remote control of neuronal excitability with cell-type and regional specificity
(Yizhar et al., 2011; Ferenczi et al., 2016). Manipulations of neuronal activity like these in animals
are key for two reasons. First, they allow for experimental in-vivo confirmation of in-silico predictions.
Second, such work is a key translational link across species (i.e. rodents to humans), given the com-
mon use of neuroimaging readouts from rsfMRI (Balsters et al., 2020). At the genomic level we
then examine what cell types could possibly underlie sex-related heterogeneity in E:I imbalance.
Finally, we then turn to the human rsfMRI data to show how E:I imbalance may differ amongst autis-
tic males and females and how such mechanisms may explain individual differences in camouflaging
behavior.
Results
Analysis of E:I balance in simulated LFPs from a recurrent networkmodelIn a bottom-up fashion, we first worked to identify potential biomarkers of E:I imbalance from neural
time-series data such as local field potentials (LFPs). Motivating our in-silico modeling of E:I effects
on LFP and BOLD data, we note prior work by Gao and colleagues (Gao et al., 2017). This prior
work simulated LFP time-series from non-interacting excitatory and inhibitory neuronal populations
(Figure 1—figure supplement 1A) and showed that spectral properties such as the 1/f slope flatten
with increasing E:I ratio (Figure 1—figure supplement 1B). Given the relationship between 1/f slope
and H (Stadnitski, 2012), we show within this modeling approach that as E:I ratio increases, H
decreases (Figure 1—figure supplement 1C). However, a limitation of this prior work is that it does
not include interactions between excitatory and inhibitory populations nor does it allow for recurrent
connections within such populations.
To address these limitations, we developed a more biologically plausible recurrent network
model of interacting excitatory and inhibitory integrate-and-fire neuronal populations that receive
external inputs (both a sensory driven thalamic input and a sensory unrelated intracortical input)
(Figure 1A; see Materials and methods for more details). From this model, we computed the net-
work’s LFP as the sum of absolute values of all synaptic currents. The absolute value is taken because
AMPA synapses are usually apical and GABA synapse are peri-somatic and thus their dipoles sum
with the same sign along dendrites (Mazzoni et al., 2008; Mazzoni et al., 2010; Deco et al., 2004).
We computed LFP summing presynaptic currents from both external inputs and recurrent interac-
tions, as real LFPs capture both sources of synaptic activity (Logothetis, 2008). We have extensively
validated this method of computing LFPs from integrate-and-fire networks in previous work on both
real cortical data and simulations with networks of realistically-shaped 3D neurons and have shown
that it works better than when using alternatives such as the sum of simulated membrane potentials,
the signed sum of synaptic currents or a time integration of the spike rate (Mazzoni et al., 2008;
Mazzoni et al., 2015). In this in-silico network, we manipulated the E:I ratio by independently vary-
ing the strengths of the inhibitory (gI ) and excitatory (gE) synaptic conductances. We called g the rel-
ative ratio between inhibitory and excitatory conductances (g ¼ gI=gE). We report simulation results
for two levels of strength of thalamic input (�0 = 1.5 spikes/second and �0 = 2 spikes/second), and
we verified that our results hold qualitatively for a wider range of input levels (1.5 to 4 spikes/
second).
Figures 1B-C show examples of LFP time-series and power spectral densities (PSDs) for two val-
ues of g, one within an excitation-dominated regime (g = 5.6) and the other within an inhibition-dom-
inated regime (g = 14.8). The spectral profiles (Figure 1C) display two different regions of
frequencies with different spectral properties: a region of steeper negative 1/f slopes at higher fre-
quencies (> 30 Hz) and a region of shallower (small negative and sometimes positive) slopes at low
frequencies (< 30 Hz). Thus, we calculated slopes for the low- and high-frequency regions with piece-
wise regressions of log power predicted by log frequency. Slopes from the low-frequency
(Figure 1D) and high-frequency region (Figure 1E) increase when g is reduced (i.e. E:I ratio aug-
mented). This means that lower values of g correspond to faster spectra with relatively more power
Trakoshis et al. eLife 2020;9:e55684. DOI: https://doi.org/10.7554/eLife.55684 4 of 31
Research article Neuroscience Medicine

at higher frequencies. Changes in slopes are more prominent in the excitation-dominated region
where g is smaller (that is, E:I ratio is shifted in favor of E) than the reference value (g = 11.3), which
has been shown to be a plausible reference value that reproduces cortical power spectra well
(Mazzoni et al., 2008; Mazzoni et al., 2010; Mazzoni et al., 2015; Mazzoni et al., 2011;
Barbieri et al., 2014; Cavallari et al., 2014). An increase in g beyond this reference value (shifting
the E:I balance towards stronger inhibition) had a weaker effect on slopes. Similar results were
obtained when quantifying 1/f slope using the FOOOF algorithm (Haller, 2018; Figure 1—figure
supplement 2), indicating that slopes are not biased by the particular piecewise linear fit procedure.
Figure 1. Predictions from a recurrent network model of how the low- and high-frequency slopes of the LFP power spectrum and H change with the
variation in relative ratio of inhibitory and excitatory synaptic conductances. Panel A shows a sketch of the point-neuron network that includes recurrent
connections between two types of populations: excitatory cells (E) and inhibitory cells (I). Each population receives two types of external inputs:
intracortical activity and thalamic stimulation. Panels B and C show examples of normalized LFP times-series and their corresponding PSDs generated
for two different ratios between inhibitory and excitatory conductances (g ¼ gI=gE ). The low- and high-frequency slopes of the piecewise regression
lines that fit the log-log plot of the LFP PSDs are computed over two different frequency ranges (1-30 Hz for the low-frequency slope and 30-100 Hz for
the high-frequency slope). The relationship between low-frequency slopes (panel D), high-frequency slopes (panel E) and H values (panel F) are plotted
as a function of g for two different firing rates of thalamic input (1.5 and 2 spikes/second). The reference value of g (which has shown in previous studies
to reproduce cortical data well) is represented by a dashed black line. In panel G and H, we show H values in 3 different groups of g (high, medium and
low g), with the same number of samples in each group.
The online version of this article includes the following figure supplement(s) for figure 1:
Figure supplement 1. In silico predictions from a non-recurrent model of how 1/f slope and H change with E:I ratio (g).
Figure supplement 2. 1/f slope estimation with the FOOOF algorithm.
Trakoshis et al. eLife 2020;9:e55684. DOI: https://doi.org/10.7554/eLife.55684 5 of 31
Research article Neuroscience Medicine

Next, we computed H from the same simulated LFPs. As expected, H decreases with decreasing g
(i.e. increasing E:I ratio), but only when g is below the baseline reference value (Figure 1F). These
results clearly indicate that, in a biologically plausible computational model of local cortical microcir-
cuitry including recurrent connections between excitatory and inhibitory neuronal populations,
changes in synaptic E:I ratio are reflected by and thus could be inferred from the overall LFP readout
of 1/f slope or H.
Simulated BOLD signal tracks with changes in E:I ratio and correlatesselectively with LFP power bandsGiven that E:I ratio in LFP data is related to 1/f slope and H, we next asked whether simulated fMRI
BOLD signal from the recurrent model would also show similar relationships. To answer this ques-
tion, we first had to simulate BOLD data from the LFP data generated from the recurrent model.
Our approach to simulating BOLD (see Materials and methods and Figure 2—figure supplement 1
for how BOLD was simulated from LFP), captures several key characteristics about the empirical rela-
tionship between LFP and BOLD. Studies with simultaneous LFP and BOLD measured in animals
have shown that although BOLD signal correlates with both LFPs and spikes, it correlates more
strongly with the LFP than with spikes (Logothetis et al., 2001; Magri et al., 2012; Rauch et al.,
2008; Viswanathan and Freeman, 2007; Lauritzen and Gold, 2003). Further studies with simulta-
neous LFP and BOLD measured in non-human primates (Logothetis et al., 2001; Magri et al.,
2012; Scholvinck et al., 2010) have considered the relationship between frequency-resolved LFPs
and BOLD and indicate that LFP power shows time-lagged correlations with the time course of
BOLD signal and that different frequency bands vary in how they correlate with measured BOLD sig-
nal. In particular, gamma band frequencies tend to show the strongest correlation between LFP
power and BOLD signal. Frequency dependency of the EEG-BOLD relationship, with prominent pre-
dictive power of the gamma band, is also reported in humans (Scheeringa et al., 2011). Remarkably,
these empirical observations are recapitulated with simulated LFP and BOLD data from the recurrent
model. Figure 2A shows time-lagged correlations between time-dependent LFP power and BOLD.
Figure 2B shows that all considered LFP frequency bands (e.g., alpha, beta, gamma) correlate with
BOLD, but with the gamma band showing the strongest correlations. Thus, our method for simulat-
ing BOLD from recurrent model LFP data retains key empirical relationships observed between real
LFP power and BOLD. Simulating BOLD with a simple hemodynamic response function (HRF) convo-
lution of the LFP would have not respected the patterns of correlations between LFP power and
BOLD observed in empirical data (i.e. the relative increase in correlation between the gamma band
and BOLD with respect to other bands; Figure 2—figure supplement 2).
With simulated BOLD from the recurrent model, we next computed H on these data to under-
stand if E:I ratio in the recurrent model is associated with changes in H in BOLD. Strikingly, H in
BOLD shows the same dependency on g as observed in LFP data (Figure 2C-D) - H in BOLD
decreases as E:I ratio is shifted toward higher excitation by lowering the value of g with respect to
the reference value. Although H in LFP and BOLD showed similar associations with respect to
changes in g, it is notable that the range of H in BOLD is shifted towards smaller values (Figure 2C-
D) than H in LFP (Figure 1G-H). We also verified that the dependency of H in BOLD on g was largely
independent of the details of how BOLD is simulated from LFP. While the results shown in Figure 2
are computed with an HRF that reproduces the correlation function measured between the BOLD
signal and the gamma band of LFP (Magri et al., 2012), it is notable that these results remained sim-
ilar when using the canonical HRF instead (Figure 2—figure supplement 2). Removing the high pass
filter from simulation of BOLD response did alter the relative values of correlation between LFP
power and BOLD across frequency bands, making the BOLD response more in disagreement with
experimental data, but did not change the relationship of decreasing H with decreasing g (Figure 2—
figure supplement 2), suggesting that our conclusions are robust to the details of the model of the
LFP to BOLD relationship. In sum, the inferences from the recurrent network model suggest that H
in LFP and BOLD data can be utilized as a marker to track changes in underlying synaptic E:I
mechanisms.
Trakoshis et al. eLife 2020;9:e55684. DOI: https://doi.org/10.7554/eLife.55684 6 of 31
Research article Neuroscience Medicine

Modeling the effects of chemogenetic manipulations within therecurrent network modelWe next investigated manipulations of parameters within the recurrent model that approximate the
effects of empirical chemogenetic DREADD manipulations in neurons. These simulations are useful
to both gain a better understanding of the empirical BOLD measures under DREADD manipulations
presented in the next section, and to better characterize the specificity of the origin of changes in 1/
f slopes and H with the E:I ratio. Given that as shown above, in our models changes of H in BOLD
mirror those in LFPs, here we present changes in model LFP spectra when simulating these DREADD
manipulations.
We first studied the specific effect of solely increasing excitation within the recurrent network.
This can be achieved experimentally by using the drug clozapine-N-oxide (CNO) on the DREADD
receptor hM3Dq to increase the excitability of excitatory cells only (Alexander et al., 2009). We
Figure 2. Relationship between E:I ratio from the recurrent model and H measured in simulated BOLD response. Panel A shows time-lagged Pearson
correlations between LFP power across a range of different frequencies and the BOLD signal. Panel B shows the correlation between LFP power and
the BOLD signal in selected frequency bands. The following four LFP bands are considered: alpha (8–12 Hz), beta (15–30 Hz), gamma (40–100 Hz) and
the total LFP power (0–100 Hz). The relationship between E:I ratio (g) and H in simulated BOLD is shown in panels C and D with two different firing
rates of thalamic input (1.5 and 2 spikes/second).
The online version of this article includes the following figure supplement(s) for figure 2:
Figure supplement 1. Simulating BOLD signal from LFP data generated by the recurrent model.
Figure supplement 2. Simulated BOLD with and without high-pass filter and changes to the HRF.
Trakoshis et al. eLife 2020;9:e55684. DOI: https://doi.org/10.7554/eLife.55684 7 of 31
Research article Neuroscience Medicine
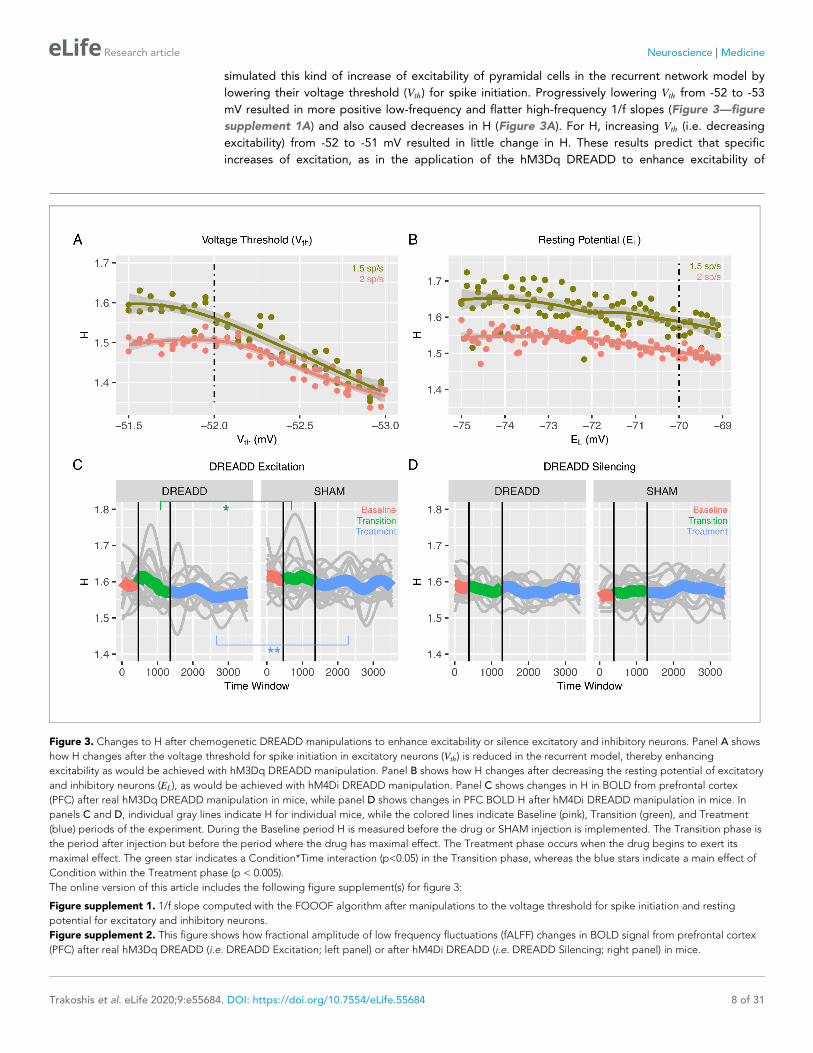
simulated this kind of increase of excitability of pyramidal cells in the recurrent network model by
lowering their voltage threshold (Vth) for spike initiation. Progressively lowering Vth from -52 to -53
mV resulted in more positive low-frequency and flatter high-frequency 1/f slopes (Figure 3—figure
supplement 1A) and also caused decreases in H (Figure 3A). For H, increasing Vth (i.e. decreasing
excitability) from -52 to -51 mV resulted in little change in H. These results predict that specific
increases of excitation, as in the application of the hM3Dq DREADD to enhance excitability of
Figure 3. Changes to H after chemogenetic DREADD manipulations to enhance excitability or silence excitatory and inhibitory neurons. Panel A shows
how H changes after the voltage threshold for spike initiation in excitatory neurons (Vth) is reduced in the recurrent model, thereby enhancing
excitability as would be achieved with hM3Dq DREADD manipulation. Panel B shows how H changes after decreasing the resting potential of excitatory
and inhibitory neurons (EL), as would be achieved with hM4Di DREADD manipulation. Panel C shows changes in H in BOLD from prefrontal cortex
(PFC) after real hM3Dq DREADD manipulation in mice, while panel D shows changes in PFC BOLD H after hM4Di DREADD manipulation in mice. In
panels C and D, individual gray lines indicate H for individual mice, while the colored lines indicate Baseline (pink), Transition (green), and Treatment
(blue) periods of the experiment. During the Baseline period H is measured before the drug or SHAM injection is implemented. The Transition phase is
the period after injection but before the period where the drug has maximal effect. The Treatment phase occurs when the drug begins to exert its
maximal effect. The green star indicates a Condition*Time interaction (p<0.05) in the Transition phase, whereas the blue stars indicate a main effect of
Condition within the Treatment phase (p < 0.005).
The online version of this article includes the following figure supplement(s) for figure 3:
Figure supplement 1. 1/f slope computed with the FOOOF algorithm after manipulations to the voltage threshold for spike initiation and resting
potential for excitatory and inhibitory neurons.
Figure supplement 2. This figure shows how fractional amplitude of low frequency fluctuations (fALFF) changes in BOLD signal from prefrontal cortex
(PFC) after real hM3Dq DREADD (i.e. DREADD Excitation; left panel) or after hM4Di DREADD (i.e. DREADD Silencing; right panel) in mice.
Trakoshis et al. eLife 2020;9:e55684. DOI: https://doi.org/10.7554/eLife.55684 8 of 31
Research article Neuroscience Medicine
pyramidal neurons, should reduce steepness of the high-frequency slopes and lead to a decrease in
H. These results also confirm our above findings that in recurrent networks in which excitatory and
inhibitory neurons interact, increases in excitability are easier to detect from changes in 1/f slope or
H than decreases in excitation.
To study whether the changes in 1/f slopes and H are specific to modulations in excitability of
only excitatory neurons, we modeled the combined effect of silencing both excitatory and inhibitory
neuronal populations. This silencing of both excitatory and inhibitory neurons can be obtained
experimentally by application of the hM4Di DREADD (see next Section). In the recurrent network
model, we simulated this silencing of both excitatory and inhibitory cells by decreasing the resting
potential, EL, in both excitatory and inhibitory neurons. Decreasing EL from the baseline value of -70
to -75 mV produced varied effects in 1/f slopes (Figure 3—figure supplement 1B) and resulted in a
slight increase of H (Figure 3B). Note that a moderate increase in H with higher input (Figure 3B)
was also found when comparing two very different levels of input. Given that a possible non-local
action of hM4Di might lead to less excitatory input to the considered area coming from the silencing
of nearby regions, this suggests that our conclusion should still hold even in the presence of some
non-local DREADD effects. In general, the effects of simulating hM4Di DREADD were far less promi-
nent than those reported above when simulating enhanced excitation specifically (Figure 3A and
Figure 3—figure supplement 1A). These results predict overall a very small effect of the hM4Di
DREADD on H and 1/f slopes. These results also imply that decreases in H are more likely to result
from specific increases in excitation rather than from non-specific decreases of excitability across
both excitatory and inhibitory neuronal populations.
Changes in H in BOLD after chemogenetic manipulation to enhanceexcitability of excitatory neurons in miceAll of the results thus far report results from our in-silico model of recurrent neuronal networks and
their readouts as simulated LFP or BOLD data. The in-silico modeling of BOLD data suggests that if
E:I ratio is increased via enhanced excitability of excitatory neurons, then H should decrease. To
empirically test this prediction in-vivo, we measured rsfMRI BOLD signal in prefrontal cortex (PFC) of
mice under conditions where a chemogenetic manipulation (hM3Dq DREADD) (Alexander et al.,
2009) is used to enhance excitability of pyramidal neurons. Here we used a sliding window analysis
to assess dynamic changes in H over the course of 3 different phases of the experiment – 1) a ‘Base-
line’ phase where the CNO drug or a SHAM injection had not yet occurred, 2) a ‘Transition’ phase
directly following CNO or SHAM injection, and 3) a ‘Treatment’ phase, whereby CNO has its maxi-
mal effect. We find that H is modulated over time by the DREADD manipulation (condition*time*-
treatment phase interaction F = 349.03, p<0.0001). During the Baseline phase of rsfMRI scanning
before the DREADD-actuator CNO was injected, H under DREADD or a SHAM control conditions
are not affected (condition main effect F = 0.82, p=0.37; condition*time interaction F = 0.36,
p=0.54). However, during the Transition phase of the experiment where the CNO begins to have its
effects, we find a condition*time interaction (F = 4.94, p=0.0262), whereby H drops over time at a
steeper rate during the DREADD condition compared to the SHAM condition (green line in
Figure 3C). Finally, during the Treatment phase of the experiment, where the drug exerts its maxi-
mal effect, there is a significant main effect of condition (F = 12.92, p=0.0011) and no condition*time
interaction (F = 0.66, p=0.4182) (blue line in Figure 3C) (Table 1). This effect is explained by H being
reduced in the DREADD vs SHAM condition. These in-vivo results are directly in line with the in-silico
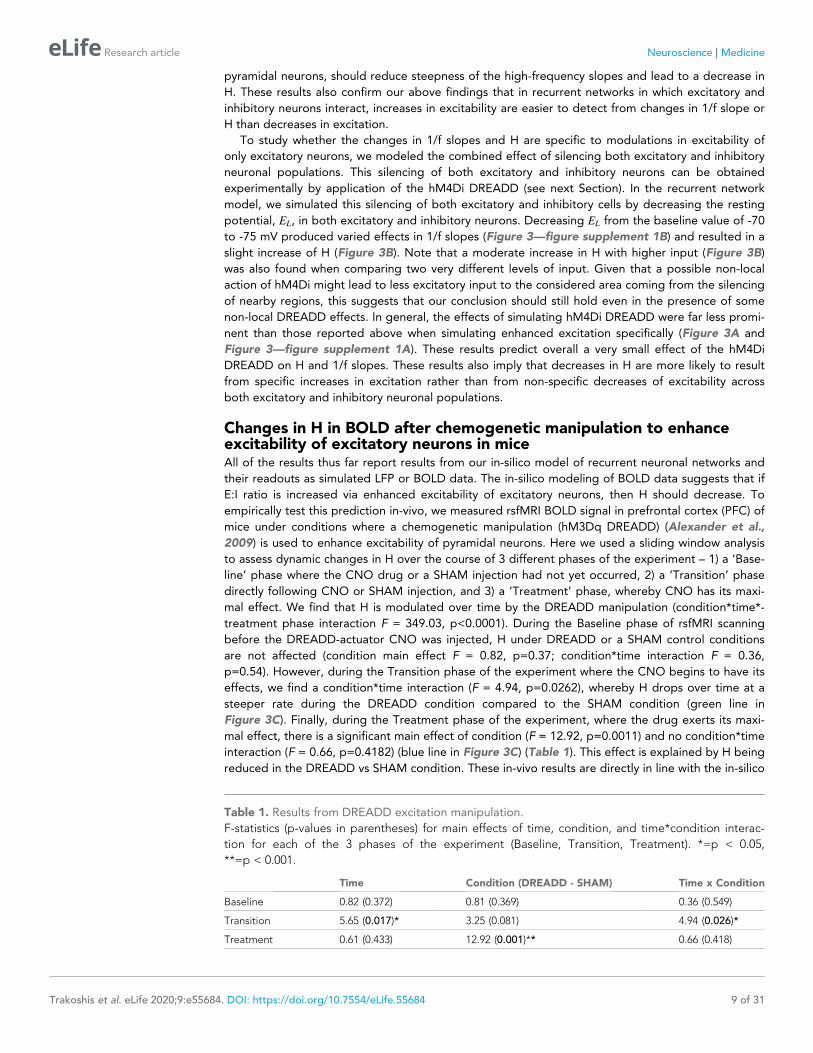
Table 1. Results from DREADD excitation manipulation.
F-statistics (p-values in parentheses) for main effects of time, condition, and time*condition interac-
tion for each of the 3 phases of the experiment (Baseline, Transition, Treatment). *=p < 0.05,
**=p < 0.001.
Time Condition (DREADD - SHAM) Time x Condition
Baseline 0.82 (0.372) 0.81 (0.369) 0.36 (0.549)
Transition 5.65 (0.017)* 3.25 (0.081) 4.94 (0.026)*
Treatment 0.61 (0.433) 12.92 (0.001)** 0.66 (0.418)
Trakoshis et al. eLife 2020;9:e55684. DOI: https://doi.org/10.7554/eLife.55684 9 of 31
Research article Neuroscience Medicine
prediction that enhancing E:I ratio via enhancing the excitability of excitatory neurons results in a
decrease in H (i.e. Figure 1F–H, Figure 2C–D, and Figure 3A).
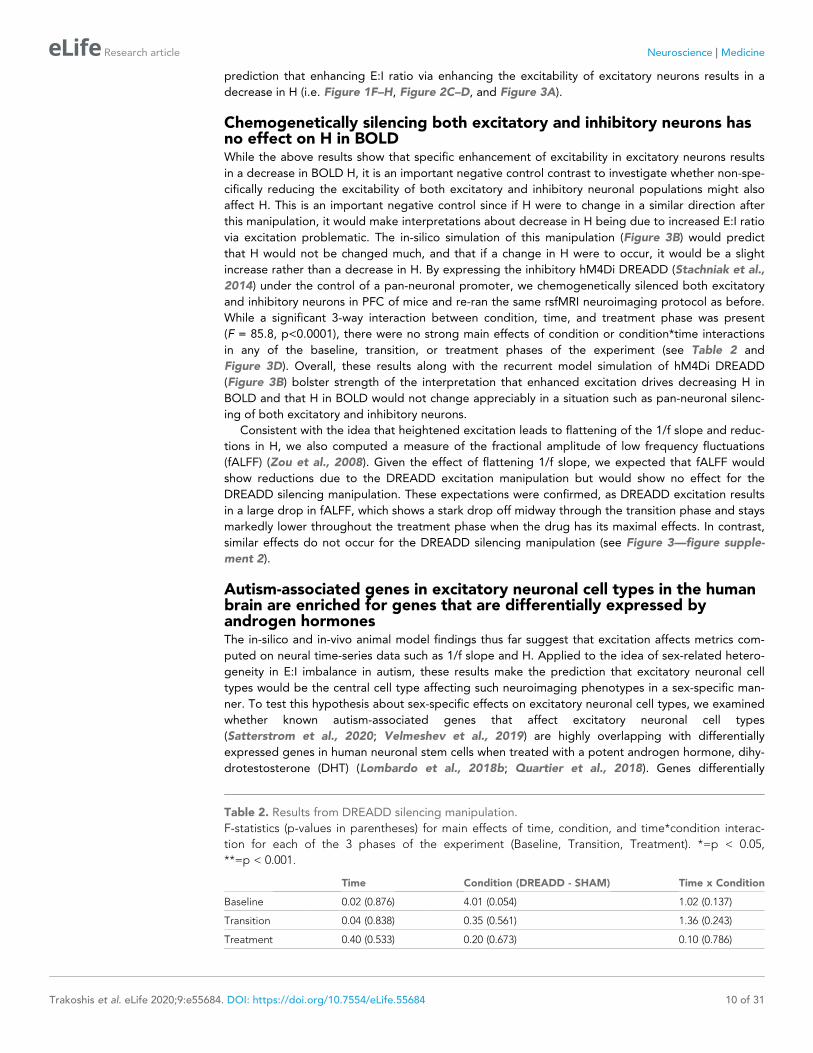
Chemogenetically silencing both excitatory and inhibitory neurons hasno effect on H in BOLDWhile the above results show that specific enhancement of excitability in excitatory neurons results
in a decrease in BOLD H, it is an important negative control contrast to investigate whether non-spe-
cifically reducing the excitability of both excitatory and inhibitory neuronal populations might also
affect H. This is an important negative control since if H were to change in a similar direction after
this manipulation, it would make interpretations about decrease in H being due to increased E:I ratio
via excitation problematic. The in-silico simulation of this manipulation (Figure 3B) would predict
that H would not be changed much, and that if a change in H were to occur, it would be a slight
increase rather than a decrease in H. By expressing the inhibitory hM4Di DREADD (Stachniak et al.,
2014) under the control of a pan-neuronal promoter, we chemogenetically silenced both excitatory
and inhibitory neurons in PFC of mice and re-ran the same rsfMRI neuroimaging protocol as before.
While a significant 3-way interaction between condition, time, and treatment phase was present
(F = 85.8, p<0.0001), there were no strong main effects of condition or condition*time interactions
in any of the baseline, transition, or treatment phases of the experiment (see Table 2 and
Figure 3D). Overall, these results along with the recurrent model simulation of hM4Di DREADD
(Figure 3B) bolster strength of the interpretation that enhanced excitation drives decreasing H in
BOLD and that H in BOLD would not change appreciably in a situation such as pan-neuronal silenc-
ing of both excitatory and inhibitory neurons.
Consistent with the idea that heightened excitation leads to flattening of the 1/f slope and reduc-
tions in H, we also computed a measure of the fractional amplitude of low frequency fluctuations
(fALFF) (Zou et al., 2008). Given the effect of flattening 1/f slope, we expected that fALFF would
show reductions due to the DREADD excitation manipulation but would show no effect for the
DREADD silencing manipulation. These expectations were confirmed, as DREADD excitation results
in a large drop in fALFF, which shows a stark drop off midway through the transition phase and stays
markedly lower throughout the treatment phase when the drug has its maximal effects. In contrast,
similar effects do not occur for the DREADD silencing manipulation (see Figure 3—figure supple-
ment 2).
Autism-associated genes in excitatory neuronal cell types in the humanbrain are enriched for genes that are differentially expressed byandrogen hormonesThe in-silico and in-vivo animal model findings thus far suggest that excitation affects metrics com-
puted on neural time-series data such as 1/f slope and H. Applied to the idea of sex-related hetero-
geneity in E:I imbalance in autism, these results make the prediction that excitatory neuronal cell
types would be the central cell type affecting such neuroimaging phenotypes in a sex-specific man-
ner. To test this hypothesis about sex-specific effects on excitatory neuronal cell types, we examined
whether known autism-associated genes that affect excitatory neuronal cell types
(Satterstrom et al., 2020; Velmeshev et al., 2019) are highly overlapping with differentially
expressed genes in human neuronal stem cells when treated with a potent androgen hormone, dihy-
drotestosterone (DHT) (Lombardo et al., 2018b; Quartier et al., 2018). Genes differentially
Table 2. Results from DREADD silencing manipulation.
F-statistics (p-values in parentheses) for main effects of time, condition, and time*condition interac-
tion for each of the 3 phases of the experiment (Baseline, Transition, Treatment). *=p < 0.05,
**=p < 0.001.
Time Condition (DREADD - SHAM) Time x Condition
Baseline 0.02 (0.876) 4.01 (0.054) 1.02 (0.137)
Transition 0.04 (0.838) 0.35 (0.561) 1.36 (0.243)
Treatment 0.40 (0.533) 0.20 (0.673) 0.10 (0.786)
Trakoshis et al. eLife 2020;9:e55684. DOI: https://doi.org/10.7554/eLife.55684 10 of 31
Research article Neuroscience Medicine

expressed by DHT are highly prominent within the gene set of autism-associated genes that affect
excitatory neurons (OR = 1.67, p=0.03), with most of the overlapping genes being those whereby
DHT upregulates expression (Figure 4A). By contrast, genes associated with autism that affect inhib-
itory neuronal cell types or other non-neuronal cells (e.g., microglia, astrocytes, oligodendrocytes)
are not enriched for DHT differentially expressed genes (inhibitory neurons: OR = 1.51, p=0.12;
microglia: OR = 0.78, p=0.78; astrocytes or oligodendrocytes: OR = 1.11, p=0.49). This result sug-
gests that autism-associated genes specifically affecting excitatory neuronal cell types are also sus-
ceptible to the male-specific influence of androgen hormones in human neuronal stem cells.
We next additionally examined how such DHT-sensitive and autism-associated excitatory neuron
genes spatially express in the adult human brain. This analysis would help shed insight on which
brain areas might be more affected by such sex-specific effects in autism. A one-sample t-test of
gene maps from the Allen Institute Human Brain Atlas (Hawrylycz et al., 2012) shows that this sub-
set of DHT-sensitive and autism-associated excitatory neuron genes are highly expressed in MPFC,
PCC, insula, and intraparietal sulcus, amongst other areas (Figure 4B–C).
H is on-average reduced in adult autistic men but not womenWe next move to application of this work to human rsfMRI data in autistic men and women. If E:I
ratio is affected by sex-related mechanisms (Lombardo et al., 2018b), we predict that H would be
differentially affected in autistic males versus females and manifest as a sex-by-diagnosis interaction
Figure 4. Autism-associated genes within excitatory neuronal cell types are enriched for genes differentially expressed by androgen hormones. Panel A
shows a Venn diagram depicting the enrichment between autism-associated genes affecting excitatory neurons (Autism E-Genes) and DHT-sensitive
genes. Panel A also includes a heatmap of these genes whereby the color indicates z-normalized expression values. The column dendrogram clearly
shows that all samples with DHT treatment are clustered separately from the control (DMSO) samples. Each row depicts the expression of a different
gene. Panel B shows a t-statistic map from a whole-brain one-sample t-test on these DHT-sensitive and autism-associated genes in excitatory neurons.
Results are thresholded at FDR q < 0.01. Panel C shows spatial gene expression profiles on a representative surface rendering of the medial wall of the
cortex for specific genes shown in panel B. Each map shows expression as z-scores with the color scaling set to a range of �2 < z < 2.
Trakoshis et al. eLife 2020;9:e55684. DOI: https://doi.org/10.7554/eLife.55684 11 of 31
Research article Neuroscience Medicine

in a 2 � 2 factorial design (Sex: Male vs Female; Diagnosis: Autism vs Typically-Developing (TD)).
More specifically, the directionality of our predictions from the in-silico and in-vivo results in Fig-
ures 1–3 are that if H reflects E:I ratio, there should be decreased H (due to enhanced E) specifically
in autistic males but not autistic females. Mass-univariate analysis uncovered one region in ventrome-
dial prefrontal cortex (vMPFC), region p32, with a sex-by-diagnosis interaction passing FDR q < 0.05
(F(5,104) = 15.13, p=0.0001, partial h2 = 0.12) (Figure 5A). In line with directionality of our predic-
tions, this interaction effect is driven by a large TD >Autism effect in males (Cohen’s d = 1.30) and a
small Autism >TD effect in females (Cohen’s d = �0.27) (Figure 5B). A similar sex-by-diagnosis inter-
action appeared when using another metric such as the intrinsic neural timescale (Watanabe et al.,
2019; Figure 5—figure supplement 1) and when H was first calculated at each voxel and then
Figure 5. Autism rsfMRI sex-by-diagnosis interaction results. Panel A shows unthresholded and thresholded with FDR q < 0.05 mass-univariate results
for the sex-by-diagnosis interaction contrast. Panel B shows H estimates from vMPFC (area p32) across males and females with and without autism.
Panel C shows partial least squares (PLS) results unthresholded and thresholded to show the top 20% of brain regions ranked by bootstrap ratio (BSR).
Panel D shows the percentage of voxels within each HCP-MMP parcellation region that overlap with the DHT-sensitive AND autism-associated genes
affecting excitatory neurons (Autism E-Genes) map shown in Figure 4B. Panel E shows correlation between vMPFC H and behavioral camouflaging
score in autistic males (orange) and females (blue).
The online version of this article includes the following figure supplement(s) for figure 5:
Figure supplement 1. Human rsfMRI data univariate main effects, PLS overlap with resting state networks, and effects on intrinsic neural timescale.
Figure supplement 2. This figure shows results from region p32 when H is computed first from all voxels and then averaged for a mean H estimate
across all voxels from the p32 region.
Trakoshis et al. eLife 2020;9:e55684. DOI: https://doi.org/10.7554/eLife.55684 12 of 31
Research article Neuroscience Medicine

averaged across voxels (Figure 5—figure supplement 2). While the main effects of diagnosis and
sex are not the primary contrast for this study, we report that no significant regions survived FDR
q < 0.05 for the main effects of diagnosis. However, 61% of brain regions showed an on-average
male >female sex difference (Figure 5—figure supplement 1), which is in keeping with results from
other work on sex differences in H (Dhamala et al., 2020).
In contrast to mass-univariate analysis, we also used partial least squares (PLS) analysis as a multi-
variate alternative to uncover distributed neural systems that express the sex-by-diagnosis interac-
tion. PLS analysis identified one neural system expressing the same sex-by-diagnosis interaction
(d = 2.04, p=0.036) and included default mode network (DMN) areas such as MPFC and posterior
cingulate cortex/precuneus (PCC) (Figure 5—figure supplement 1), and other non-DMN areas such
as insula, lateral prefrontal cortex, somatosensory and motor cortices, intraparietal sulcus, amongst
others (Figure 5C). Many of these regions detected by the PLS analysis were subthreshold of FDR
q < 0.05 in the mass-univariate analysis, but do show heightened effect sizes in keeping with this
sex-by-diagnosis interaction pattern (e.g., white and light blue areas in the unthresholded map
shown in Figure 5A). Detection of these regions in a mass-univariate analysis may require a larger
sample size to enhance statistical power. Given that many of these PLS-identified regions of a sex-
by-diagnosis interaction appear similar to those that appear in the gene expression map in
Figure 4B of DHT-sensitive and autism-associated excitatory genes, we assessed how much each
HCP-MMP parcellated regions overlap with the map in Figure 4B. PLS-identified regions in vMPFC
(e.g., areas p32 and 10r) overlap by about 73–75%. Areas within the insula (e.g., Pol1, Pol2, MI) over-
lap by around 59–69%. Parietal areas in PCC (e.g., v23ab, d23ab) and intraparietal sulcus (LIPd) over-
lap by around 73–85% (Figure 5D).
Correlation between vMPFC H and camouflaging in autistic women butnot menIn prior task-fMRI work we found a similar sex-by-diagnosis interaction in vMPFC self-representation
response and a female-specific brain-behavioral correlation with camouflaging ability (Lai et al.,
2019). Given that adult autistic females engage more in camouflaging on-average (Lai et al., 2017b;
Hull et al., 2020; Schuck et al., 2019), we next asked whether vMPFC H would be related to
camouflaging in a sex-specific manner. In autistic females, increased camouflaging was strongly asso-
ciated with increased H in vMPFC (r = 0.60, p=0.001). However, no significant association was appar-
ent in autistic males (r = �0.10, p=0.63). The strength of this brain-behavioral correlation
significantly differed between autistic males and females (z = 2.58, p=0.009) (Figure 5E). This result
suggests that progressively more intact vMPFC H in autistic females, which are likely reflective of
more intact E:I balance, is associated with better ability to camouflage social-communicative difficul-
ties. Beyond this hypothesis-driven comparison of the relationship between H and camouflaging in
vMPFC, we also ran correlations with ADI-R, ADOS and AQ scores. ADOS social-communication
(SC) was negatively correlated with vMPFC H in autistic females (r = �0.51, p=0.008) indicating
higher H with lower SC severity. This relationship was not present in autistic males (r = �0.04,
p=0.83). However, the difference between these correlations was not statistically significant
(z = 1.70, p=0.08). ADI-R subdomains, ADOS RRB, and AQ correlations were not statistically
significant.
DiscussionIn this work we set out to better understand how intrinsic E:I imbalance affects the autistic brain in a
sex-specific manner. Evidence from animal models of rare genetic variants associated with autism
have typically been used as the primary evidence for the E:I imbalance theory (Rubenstein and Mer-
zenich, 2003; Sohal and Rubenstein, 2019). However, these variants affect only a small percentage
of the autism population. Thus, it is unclear how E:I imbalance might affect the majority of heteroge-
neous individuals within the total autism population. To bridge this gap we need multi-level methods
that can be applied to understand the ‘living biology’ behind actual human individuals
(Courchesne et al., 2019), such as in vivo neuroimaging data and metrics applied to such time-series
data that are linked to actual underlying neural E:I mechanisms (Markicevic et al., 2020). Bridging
this gap will help us identify mechanistic targets that explain neural and behavioral variability across
a much larger portion of individuals in the autism population.
Trakoshis et al. eLife 2020;9:e55684. DOI: https://doi.org/10.7554/eLife.55684 13 of 31
Research article Neuroscience Medicine
Based on earlier work (Gao et al., 2017), we reasoned that metrics such as 1/f slope and H in
neural time-series data would be relevant as an in vivo neuroimaging marker of E:I mechanisms. Prior
work suggested this relationship via a model that considers inhibition and excitation as separate
entities (Gao et al., 2017). However, excitation and inhibition in the brain are inseparably linked.
Results about the relationship between spectral shape and E:I balance obtained with our model of
recurrent excitation and inhibition are largely compatible with those obtained with an earlier model
of uncoupled excitation and inhibition (Gao et al., 2017). The uncoupled model predicts a linear
increase of the slope value (i.e. flatter, less negative slopes) as E:I ratio increases. This is because in
the uncoupled model changing the E:I ratio modifies only the ratio of the contribution to the LFP
spectra of excitatory (faster time constant) and inhibitory (slower time constant) synaptic currents,
leading to a linear relationship between slopes and E:I. In contrast, we found that the relationship
between E:I and the spectral slope flattens out for high values of I. This, in our view, may in part arise
from the fact that, as shown in studies of recurrent network models (Brunel and Wang, 2003),
higher recurrent inhibition leads to higher peak frequency of gamma oscillations (i.e. an increase of
power at higher frequencies) thus partly counteracting the low-pass filtering effect of inhibitory cur-
rents in the uncoupled model. We plan to investigate in future studies how these opposing effects
interact in a wider range of configurations and to use these results to gain a better understanding of
the relationship between E:I ratio and LFP spectral shape.
Furthermore, prior work (Gao et al., 2017) considered only 1/f slopes in simulated LFP data and
did not explore the effect of the transformation between LFP neural activity to BOLD. Our simula-
tions address these problems and significantly extends prior work (Gao et al., 2017) on the relation-
ship between E:I imbalance and changes in spectral properties of neural signals. We showed that
when excitation and inhibition interact in a recurrent network model, flatter 1/f slopes and decreases
in H are specific markers of increases in E:I ratio. We also showed that in simulated BOLD signal, H
and E:I ratio are associated in a manner similar to the relationships observed with LFP data. Taken
together, these results predict that changes in H in neural time-series data can be interpreted as a
shift in synaptic E:I ratio that permeates through in LFP or BOLD readouts.
Our simple model to generate BOLD from frequency-resolved LFPs reflect several features of the
empirical LFP-BOLD relationship - namely the presence of a particularly strong gamma-BOLD rela-
tionship and the fact that a better prediction of the BOLD is obtained from the frequency-resolved
LFP than from the wideband LFP. However, a limitation of our simple model is that, in its present
form, it cannot capture the negative relationship between the power of some low-frequency LFP
bands and the BOLD amplitude that has been reported in some studies (Scholvinck et al., 2010;
Scheeringa et al., 2011; Mukamel et al., 2005; Niessing et al., 2005). Modelling the low frequency
LFP to BOLD relationship in greater detail would require significant extensions of our neural model,
as lower frequency oscillations are thought to arise from more complex cortico-cortical and thalamo-
cortical loops than those that can be captured by our simple model of a local recurrent circuit with
only two classes of neurons and no spatial structure (Scheeringa and Fries, 2019; Zucca et al.,
2019). An important topic for further modelling work will be to understand how biomarkers of more
complex neural feedback loops can be extracted from LFP or BOLD spectral signatures.
The power of our in-silico modeling approach is that it provides explicit predictions of what to
expect in real BOLD data when synaptic E:I imbalance occurs. Remarkably, these in silico predictions
are confirmed in vivo with rsfMRI BOLD data in halothane-sedated mice after experimental chemo-
genetic manipulations that specifically enhance neural excitation. Intriguingly, and consistent with in-
silico predictions, manipulations that silence both excitatory and inhibitory neuronal populations do
not have a strong effect on H in BOLD. These results are in line with optogenetic studies showing
that specifically enhancing excitation in MPFC seems to have the biggest effects on social behavior
in mice (Yizhar et al., 2011). The present work clearly shows that enhancement of excitation results
in measurable changes in BOLD readouts as decreases in H. This insight allows us to leverage H as
an in-vivo rsfMRI biomarker that has strong relevance back to synaptic E:I imbalance. Future exten-
sions of our research might involve refined modelling and the use of chemogenetic manipulations in
awake conditions, hence minimizing the possible confounding contribution of anesthesia on baseline
E:I balance.
With regards to how sex-related heterogeneity in E:I imbalance might manifest in autism, we uti-
lized genomics data and found that autism-associated genes that affect excitatory neuronal cell
types are enriched for genes that are differentially expressed by DHT in human neuronal stem cells.
Trakoshis et al. eLife 2020;9:e55684. DOI: https://doi.org/10.7554/eLife.55684 14 of 31
Research article Neuroscience Medicine
This inference extends prior work implicating excitatory neuron cell types in autism-relevant biology
(Satterstrom et al., 2020; Velmeshev et al., 2019; Willsey et al., 2013; Parikshak et al., 2013) by
linking genomic mechanisms in these cell types to the male-specific influence of androgen hor-
mones. Importantly, other cell types such as inhibitory neurons do not express autism-associated
genes that are also influenced by DHT. Additionally, the DHT-sensitive and autism-associated excit-
atory genes tend to spatially express in the human adult brain in regions such as MPFC, PCC, insula,
and intraparietal sulcus, which have been shown to be affected in autism across a range of task-
related and rsfMRI studies (Lai et al., 2019; Di Martino et al., 2009; Di Martino et al., 2014;
Uddin and Menon, 2009; Padmanabhan et al., 2017; Lombardo et al., 2010), and which overlap
with areas discovered by the PLS analysis to express a sex-by-diagnosis interaction (Figure 5D).
Moving to human rsfMRI data on adult individuals with autism, we utilized H as a neuroimaging
biomarker of E:I imbalance. Specifically, we examined whether H differs between adult males and
females with and without autism. Mass-univariate analysis highlighted one region in vMPFC which
showed a sex-by-diagnosis interaction - that is, H was specifically reduced in adult autistic males, but
not in autistic females. Reduced H in autistic males is compatible with the inference of elevated E:I
ratio potentially driven by enhanced excitation. The observed effect in vMPFC may also be consis-
tent with a ‘gender-incoherence’ pattern (i.e. towards reversal of typical sex differences in autism)
(Bejerot et al., 2012). However, sex-specific normative ranges would need to be better established
before interpreting effects in autism as being reversals of normative sex differences. More work with
much larger general population-based datasets is needed to establish whether there are robust nor-
mative sex differences in H and to describe the normative ranges of H may take for each brain
region, sex, and across age. Such work would also help with normative modeling (Bethlehem and
Seidlitz, 2018) approaches that would enable identification of which autistic individuals highly devi-
ate from sex-specific norms.
Multivariate PLS analysis extended the mass-univariate results by showing that a distributed neu-
ral system structurally and functionally connected to vMPFC, such as default mode network (DMN)
areas like PCC (Buckner and DiNicola, 2019; Yeo et al., 2011), as well as intraparietal sulcus and
insular cortex (Uddin and Menon, 2009), also expressed a similar but more subtle sex-by-diagnosis
interaction. Interestingly, these regions highlighted by the PLS analysis are remarkably similar to the
map of brain regions where autism-associated excitatory and DHT-sensitive genes highly express
(Figure 4B–C, Figure 5D). Therefore, important social brain circuitry such as the DMN, and other
integrative hubs of the salience network (e.g., insula) that connect DMN to other important large-
scale networks (Uddin and Menon, 2009) may be asymmetrically affected by heightened E:I ratio in
autistic males more than autistic females.
These human rsfMRI results are not only compatible with the in silico predictions and the in vivo
mouse rsfMRI data presented here, but are also compatible with several prior lines of work. Our
prior work highlighted that DMN functional connectivity in typically developing adolescent males,
but not females, is affected by heightened levels of fetal testosterone and this network was heavily
comprised of MPFC and PCC (Lombardo et al., 2018b). In the same work, we showed that a corti-
cal midline DMN subsystem comprising MPFC and PCC highly expresses several genes relevant for
excitatory postsynaptic potentials (e.g., MEF2C, GRIK2, GRIA1, SCN3A, SCN9A, NPTX2). The cur-
rent findings linking autism-associated genes in excitatory neuron cell types (Figure 4) allow for
more precise inferences about the importance of excitatory cell types over and above other inhibi-
tory cell types. This is important given that evidence regarding inhibitory neuronal cell types and
their role in E:I imbalance in autism is more mixed (Horder et al., 2018; Coghlan et al., 2012).
Importantly, the expression of these genes in human neuronal stem cells is elevated after exposure
to the potent androgen DHT (Lombardo et al., 2018b). Thus, one potential explanation for the
male-specific reduction of H in vMPFC could have to do with early developmental and androgen-
sensitive upregulation of genes that play central roles in excitatory neuron cell types, and thus ulti-
mately affecting downstream E:I imbalance. Such effects may be less critical in human females and
may serve an important basis for sex-differential human brain development (Kaczkurkin et al.,
2019). These effects may also help explain why qualitative sex differences emerge in autism
(Lai et al., 2017a; Bedford et al., 2020). rsfMRI H in autistic adults was also relevant in a sex-specific
manner to a clinical behavioral phenomenon known as ‘camouflaging’. Camouflaging relates to a set
of compensatory or masking strategies/mechanisms that allow individuals to cope with their social-
communicative difficulties in everyday social situations (Lai et al., 2017b; Hull et al., 2020;
Trakoshis et al. eLife 2020;9:e55684. DOI: https://doi.org/10.7554/eLife.55684 15 of 31
Research article Neuroscience Medicine
Livingston et al., 2019). It is known that cognitively able adult autistic females tend to engage in
more camouflaging behavior than males (Lai et al., 2017b; Hull et al., 2020; Schuck et al., 2019)
and the extent to which individual females engage in camouflaging is linked to vMPFC function
(Lai et al., 2019). One of the most important known functions of vMPFC has to do with self-repre-
sentation (Lombardo et al., 2010) and simulating others based on information about the self
(Mitchell et al., 2006). In prior task-related fMRI work we found a similar sex-by-diagnosis interac-
tion effect whereby males are more impaired in vMPFC self-representation response than their
female autistic counterparts. Furthermore, increased magnitude of vMPFC self-representation neural
response correlates with increased camouflaging ability, but only in adult autistic females (Lai et al.,
2019). Strikingly, here we find a similar sex-by-diagnosis interaction effect in vMPFC H as well as a
female-specific correlation with camouflaging - as vMPFC H increases, indicative of a more normative
or intact level of E:I balance, camouflaging also increases. This converging set of results suggests
that intrinsic mechanisms such as E:I balance may be atypical only in cognitively able autistic males
at vMPFC. More intact E:I balance in the vMPFC of autistic females may enable better vMPFC-
related function (e.g., self-representation) and thus potentially better enable these individuals to
camouflage social-communicative difficulties and cope in social situations. Future work changing E:I
balance in vMPFC may provide a useful avenue for ameliorating daily life social-communication
adaptation and coping difficulties in autistic males and enable them to optimally engage in compen-
satory processes such as camouflaging to the similar extent as autistic females. It may also be fruitful
to examine how intact E:I balance in vMPFC of females may be an expression of protective factors
that are hypothesized to buffer risk for autism in females (Robinson et al., 2013; Werling, 2016).
This work may also be of broader relevance for investigating sex-specific E:I imbalance that
affects other early-onset neurodevelopmental disorders with a similar male-bias as autism
(Rutter et al., 2003). For instance, conditions like ADHD affect males more frequently than females
and also show some similarities in affecting behavioral regulation and associated neural correlates
(Chantiluke et al., 2015). Furthermore, gene sets associated with excitatory and inhibitory neuro-
transmitters are linked to hyperactivity/impulsivity severity in ADHD, suggesting that E:I-relevant
mechanisms may be perturbed (Naaijen et al., 2017). It will be important for future work to test
how specific sex-specific E:I imbalance is to autism versus other related sex-biased neurodevelop-
mental disorders. Similarly, future work should investigate how H may change over development.
Prior work has shown that H and other related measures such as 1/f slope can change with normative
and pathological aging in both rsfMRI and EEG data (Maxim et al., 2005; Wink et al., 2006;
Voytek et al., 2015). Imperative to this work will be the establishment of age and sex-specific norms
for H in much larger datasets. Age and sex-specific norms will enable more work to better uncover
how these biomarkers may be affected in neurodevelopmental disorders or disorders relevant to
neurodegeneration. Such work combined with normative modeling approaches (Bethlehem and
Seidlitz, 2018) may help uncover how experiential and environmental effects further affect such
metrics.
In conclusion, we show that spectral properties of neural time-series data, such as H and 1/f
slope, can be utilized in neuroimaging readouts like LFP and BOLD as a biomarker for underlying E:
I-relevant mechanisms. In silico predictions from simulated LFP and BOLD data were confirmed
in vivo with rsfMRI BOLD data where excitation was enhanced through chemogenetic manipulation.
Finally, in application to humans, we show that H in rsfMRI data is reduced in vMPFC and other
DMN areas of adult autistic males, but not females. Reduced H is indicative of enhanced excitation
and thus points to sex-specific dysregulation of E:I balance in social brain networks of autistic males.
This male-specific dysregulation of E:I balance may be linked to sex-differential early developmental
events such as androgen-upregulation of gene expression for genes that play important roles in
excitatory neurons (Lombardo et al., 2018b). The intact levels of H in females may help facilitate
elevated levels of compensation known as camouflaging to cope with daily social-communicative dif-
ficulties. This important female-specific brain-behavioral correlation may also be key for future inter-
ventions targeting E:I mechanisms and MPFC-related brain networks to enable better coping with
daily social-communicative difficulties. More generally, this work extends the relevance of the E:I
imbalance theory of autism beyond evidence from autism-associated rare genetic variants and spec-
ify a larger portion of the autism population whereby these E:I mechanisms may be of critical
importance.
Trakoshis et al. eLife 2020;9:e55684. DOI: https://doi.org/10.7554/eLife.55684 16 of 31
Research article Neuroscience Medicine
Materials and methods
Human participantsAll procedures contributing to this work comply with the ethical standards of the relevant national
and institutional committees on human experimentation and with the Helsinki Declaration of 1975,
as revised in 2008. All human participants’ informed consent was obtained in accord with procedures
approved by the Suffolk Local Research Ethics Committee. Adult native English speakers (n = 136,
age range = 18–49 years) with normal/corrected-to-normal vision participated: n = 33 typically
developing (TD) males, n = 34 autistic males, n = 34 TD females and n = 34 autistic females (Table 3).
They all reported cis-gender identity based on a single item inquiring their birth-assigned sex and
another on their identified gender. Groups were not statistically different on age or full-scale IQ
(FIQ) on the Wechsler Abbreviated Scales of Intelligence (WASI) (Table 3). Exclusion criteria for all
participants included a history of or current psychotic disorders, substance-use disorders, severe
head injury, genetic disorders associated with autism (e.g. fragile X syndrome and tuberous sclero-
sis), intellectual disability (i.e. Full-scale IQ (FIQ) < 70), or other medical conditions significantly
affecting brain function (e.g. epilepsy).
The inclusion criterion for both male and female autistic participants was a formal clinical diagno-
sis of International Statistical Classification of Diseases and Related Health Problems 10th Revision
(ICD-10) childhood autism or Asperger’s syndrome, or Diagnostic and Statistical Manual of Mental
Disorders (4th ed., text rev.; DSM-IV-TR) autistic disorder or Asperger’s disorder, as assessed by a
psychiatrist or clinical psychologist in the National Health Service, UK. Since all participants were
adults, we further considered available information of developmental history to include only those
with clinically evident childhood autistic symptoms, for example, from information collected using
the Autism Diagnostic Interview–Revised (ADI-R) (Lord et al., 1994) where possible, or from the par-
ticipants’ clinical diagnosis letters shared with the research team to determine eligibility. We used
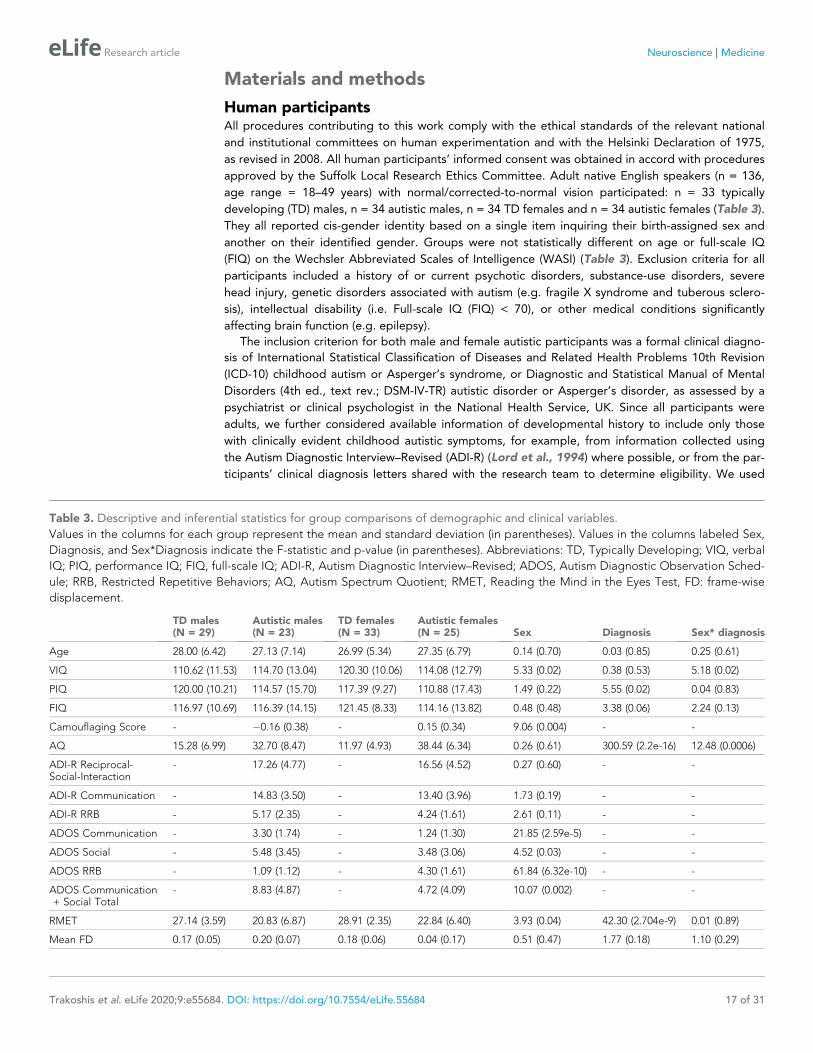
Table 3. Descriptive and inferential statistics for group comparisons of demographic and clinical variables.
Values in the columns for each group represent the mean and standard deviation (in parentheses). Values in the columns labeled Sex,
Diagnosis, and Sex*Diagnosis indicate the F-statistic and p-value (in parentheses). Abbreviations: TD, Typically Developing; VIQ, verbal
IQ; PIQ, performance IQ; FIQ, full-scale IQ; ADI-R, Autism Diagnostic Interview–Revised; ADOS, Autism Diagnostic Observation Sched-
ule; RRB, Restricted Repetitive Behaviors; AQ, Autism Spectrum Quotient; RMET, Reading the Mind in the Eyes Test, FD: frame-wise
displacement.
TD males(N = 29)
Autistic males(N = 23)
TD females(N = 33)
Autistic females(N = 25) Sex Diagnosis Sex* diagnosis
Age 28.00 (6.42) 27.13 (7.14) 26.99 (5.34) 27.35 (6.79) 0.14 (0.70) 0.03 (0.85) 0.25 (0.61)
VIQ 110.62 (11.53) 114.70 (13.04) 120.30 (10.06) 114.08 (12.79) 5.33 (0.02) 0.38 (0.53) 5.18 (0.02)
PIQ 120.00 (10.21) 114.57 (15.70) 117.39 (9.27) 110.88 (17.43) 1.49 (0.22) 5.55 (0.02) 0.04 (0.83)
FIQ 116.97 (10.69) 116.39 (14.15) 121.45 (8.33) 114.16 (13.82) 0.48 (0.48) 3.38 (0.06) 2.24 (0.13)
Camouflaging Score - �0.16 (0.38) - 0.15 (0.34) 9.06 (0.004) - -
AQ 15.28 (6.99) 32.70 (8.47) 11.97 (4.93) 38.44 (6.34) 0.26 (0.61) 300.59 (2.2e-16) 12.48 (0.0006)
ADI-R Reciprocal-Social-Interaction
- 17.26 (4.77) - 16.56 (4.52) 0.27 (0.60) - -
ADI-R Communication - 14.83 (3.50) - 13.40 (3.96) 1.73 (0.19) - -
ADI-R RRB - 5.17 (2.35) - 4.24 (1.61) 2.61 (0.11) - -
ADOS Communication - 3.30 (1.74) - 1.24 (1.30) 21.85 (2.59e-5) - -
ADOS Social - 5.48 (3.45) - 3.48 (3.06) 4.52 (0.03) - -
ADOS RRB - 1.09 (1.12) - 4.30 (1.61) 61.84 (6.32e-10) - -
ADOS Communication+ Social Total
- 8.83 (4.87) - 4.72 (4.09) 10.07 (0.002) - -
RMET 27.14 (3.59) 20.83 (6.87) 28.91 (2.35) 22.84 (6.40) 3.93 (0.04) 42.30 (2.704e-9) 0.01 (0.89)
Mean FD 0.17 (0.05) 0.20 (0.07) 0.18 (0.06) 0.04 (0.17) 0.51 (0.47) 1.77 (0.18) 1.10 (0.29)
Trakoshis et al. eLife 2020;9:e55684. DOI: https://doi.org/10.7554/eLife.55684 17 of 31
Research article Neuroscience Medicine

this clinically based criterion for inclusion for the purpose of sampling autistic individuals currently
diagnosed by specialists in mental health services in the daily practice and to align with best clinical
practice as recommended by the UK National Institute for Health and Clinical Excellence (NICE)
guideline (Pilling et al., 2012). For assessing levels of autism characteristics, we administered the
Autism Spectrum Quotient (AQ) (Baron-Cohen et al., 2001a), module 4 of the Autism Diagnostic
Observation Schedule (ADOS) (Lord et al., 2000), and ADI-R (Lord et al., 1994) where possible,
before the fMRI session. Autistic male and female groups were not significantly different on any
ADI-R subdomain scores or Reading the Mind in the Eyes Test (RMET) (Baron-Cohen et al., 2001b)
performance (Table 3).
We further used criteria for inclusion based on characteristics about data quality (see next para-
graphs for data preprocessing). In particular, we excluded participants where the number of volumes
was not acquired due to scanner hardware issues (n = 1), the preprocessing pipeline could not ade-
quately preprocess the data (e.g., bad registrations; n = 5). Participants were also excluded if their
head motion exceed a mean framewise displacement (meanFD) (Power et al., 2012) of >0.4 mm
(n = 8). For the remaining subjects we further visually inspected plots of framewise displacement
(FD) and DVARS (Power et al., 2012) traces to determine whether the wavelet despiking step suffi-
ciently attenuated artefact-related variability that would leave DVARS spikes. Here we made a quali-
tative and consensus judgement amongst authors (S.T. and M.V.L) to exclude individuals (n = 9)
whereby there were numerous FD spikes above 0.5 mm or numerous DVARS spikes leftover after
wavelet despiking was applied. Other exclusions included any VIQ or PIQ <70 (n = 1) and co-morbid
agenesis of the corpus callosum (n = 1). The final sample sizes included in all further analyses was
n = 29 TD males, n = 23 autistic males, n = 33 TD females, and n = 25 autistic females. The final
groups used in all analyses did not statistically differ on age (diagnosis main effect: F(3,106) = 0.03,
p=0.85; sex main effect: F(3,106) = 0.14, p=0.70; sex-by-diagnosis interaction: F(3,106) = 0.25,
p=0.61) or FIQ (diagnosis main effect: F(3,106) = 3.38, p=0.07; sex main effect: F(3,106) = 0.48,
p=0.48; sex-by-diagnosis interaction: F(3,106) = 2.24, p=0.13) (see Table 3).
Human fMRI data acquisitionImaging was performed on a 3T GE Signa Scanner at the Cambridge Magnetic Resonance Imaging
and Spectroscopy Unit. Participants were asked to lie quietly in the scanner awake with eyes closed
for 13 min and 39 s during sequential acquisition of 625 whole-brain T2*-weighted echo planar
image volumes with the following parameters: relaxation time = 1302 ms; echo time = 30 ms; flip
angle = 70˚; matrix size = 64�64; field of view = 24 cm; 22 anterior commissure-posterior commis-
sure aligned slices per image volume; 4 mm axial slice thickness; 1 mm slice gap. The first five time-
points were discarded to allow for T2-stabilization. During analysis of the Hurst exponent (H) for
BOLD time-series, due to the discrete wavelet transform using volumes in power of 2, only the first
512 volumes (29) were utilized. A high-resolution spoiled gradient anatomical image was acquired
for each participant for registration purposes.
Human fMRI data analysisPreprocessing of the resting state data was split into two components; core preprocessing and
denoising. Core preprocessing was implemented with AFNI (Cox, 1996) (http://afni.nimh.nih.gov/)
using the tool speedypp.py (http://bit.ly/23u2vZp) (Kundu et al., 2012). This core preprocessing
pipeline included the following steps: (i) slice acquisition correction using heptic (7th order) Lagrange
polynomial interpolation; (ii) rigid-body head movement correction to the first frame of data, using
quintic (5th order) polynomial interpolation to estimate the realignment parameters (3 displacements
and three rotations); (iii) obliquity transform to the structural image; (iv) affine co-registration to the
skull-stripped structural image using a gray matter mask; (v) nonlinear warping to MNI space
(MNI152 template) with AFNI 3dQwarp; (vi) spatial smoothing (6 mm FWHM); and (vii) a within-run
intensity normalization to a whole-brain median of 1000. Core preprocessing was followed by
denoising steps to further remove motion-related and other artifacts. Denoising steps included: (viii)
wavelet time series despiking (‘wavelet denoising’); (ix) confound signal regression including the six
motion parameters estimated in (ii), their first order temporal derivatives, and ventricular cerebrospi-
nal fluid (CSF) signal (referred to as 13-parameter regression). The wavelet denoising method has
been shown to mitigate substantial spatial and temporal heterogeneity in motion-related artifact
Trakoshis et al. eLife 2020;9:e55684. DOI: https://doi.org/10.7554/eLife.55684 18 of 31
Research article Neuroscience Medicine

that manifests linearly or non-linearly and can do so without the need for data scrubbing
(Patel et al., 2014). Data scrubbing (i.e. volume censoring) cannot be used in our time-series-based
analyses here as such a procedure breaks up the temporal structure of the time-series in such a way
that invalidates estimation of the Hurst exponent (H) that examine long-memory characteristics.
Wavelet denoising is implemented with the Brain Wavelet toolbox (http://www.brainwavelet.org).
The 13-parameter regression of motion and CSF signals was achieved using AFNI 3dBandpass with
the –ort argument. To further characterize motion and its impact on the data, we computed FD and
DVARS (Power et al., 2012). Between-group comparisons showed that all groups were similar with
respect to head motion as measured by meanFD with no diagnosis (F(3,106) = 1.77, p=0.18) or sex
(F(3,106) = 0.51, p=0.47) main effects or sex-by-diagnosis interaction (F(3,106) = 1.10, p=0.29). All
groups showed average meanFD of less than 0.2 mm (see Table 3).
Mean time-series for each of the 180 parcels within the Human Connectome Project Multimodal
Parcellation (HCP-MMP) (Glasser et al., 2016) were extracted from the final preprocessed data, to
estimate H. The estimation of H utilizes a discrete wavelet transform and a model of the time-series
as fractionally integrated processes (FIP) and is estimated using maximum likelihood estimation. This
method utilizing the FIP model for estimating H differs from our prior work (Lai et al., 2010), which
used a model of fractional Gaussian noise (fGn). fGn is one type of process subsumed under the FIP
model. However, the fGn model has the limitation of assuming that the BOLD time-series is station-
ary and also limits the upper bound of H at 1. In practice, we have seen that the upper bound of
H = 1 from the fGn model results in ceiling effects for many brain regions and subjects. Thus, to
remove the assumption of stationarity and upper bound of H = 1, the FIP model offers more flexibil-
ity and potentially added sensitivity due to better estimation of between-subject variability when
estimates are near or exceed H = 1. When H > 1 the time-series is considered non-stationary and
has long memory characteristics (e.g., is fractal). H is computed using the nonfractal MATLAB tool-
box written by one of the co-authors (WY) (https://github.com/wonsang/nonfractal). The specific
function utilized is bfn_mfin_ml.m function with the ‘filter’ argument set to ‘haar’ and the ‘ub’ and
‘lb’ arguments set to [1.5,10] and [�0.5,0], respectively.
After H was estimated for each of the 180 HCP-MMP parcels, we used a general linear model to
test for sex-by-diagnosis interactions as well as main effects of Sex and Diagnosis in H. These models
also incorporated meanFD and FIQ as covariates of no interest. Multiple comparison correction was
achieved using an FDR q < 0.05 threshold. Visualization of effect sizes for figures was achieved using
the ggseg library in R (https://github.com/LCBC-UiO/ggseg).
In addition to mass-univariate analysis, we also utilized multivariate partial least squares (PLS)
analysis (Krishnan et al., 2011) to highlight distributed neural systems that capture the effect of a
sex-by-diagnosis interaction. This analysis was implemented with code from the plsgui MATLAB tool-
box (http://www.rotman-baycrest.on.ca/pls/). A matrix with participants along the rows and all 180
HCP-MMP parcels along with columns was input as the primary neuroimaging matrix for PLS. We
also inserted a vector describing the sex-by-diagnosis contrast as the matrix to relate to the neuro-
imaging matrix. This vector describing the sex-by-diagnosis interaction was computed by matrix mul-
tiplication of the contrast vector of [1, -1, -1, 1] to a design matrix that was set up with columns
defining TD males, autism males, TD females, and autism females, respectively. The PLS analysis was
run with 10,000 permutations to compute p-values for each latent-variable (LV) pair and 10,000
bootstrap resamples in order to compute bootstrap ratios (BSR) to identify brain regions of impor-
tance for each LV pair. To isolate specific brain regions of importance for a statistically significant LV,
we selected the top 20th percentile of brain regions ranked by BSR.
Relationships between H and camouflaging were conducted within autistic males and females
separately. Pearson’s correlations were used to estimate the strength of the relationship and groups
were compared on the strength of the relationship using Fisher’s r-to-z transform as implemented
with the paired.r function in the psych library in R.
Behavioral index of camouflagingCamouflaging (consciously or unconsciously compensating for and/or masking difficulties in social–
interpersonal situations) was operationalized as prior work (Lai et al., 2017b; Lai et al., 2019): the
discrepancy between extrinsic behavioral presentation in social–interpersonal contexts and the per-
son’s intrinsic status. We used both the AQ score and RMET correct score as reflecting intrinsic sta-
tus (i.e. self-rated dispositional traits and performance-based socio-cognitive/mentalizing capability),
Trakoshis et al. eLife 2020;9:e55684. DOI: https://doi.org/10.7554/eLife.55684 19 of 31
Research article Neuroscience Medicine

and the ADOS Social-Communication total score as reflecting extrinsic behavioral presentation. The
three scores were first standardized (SADOS, SAQ and SRMET) within our sample of autistic men and
women by mean-centering (to the whole autism sample in this study) and scaling (i.e. divided by the
maximum possible score of each) to generate uniformly scaled measures that can be arithmetically
manipulated. The first estimate of camouflaging was quantified as the difference between self-rated
autistic traits and extrinsic behaviors (CF1 = SAQ � SADOS), and the second estimate between men-
talizing ability and extrinsic behaviors (CF2 = �SRMET � SADOS). Then, using principal component
analysis, the first principal component score of CF1 and CF2 (accounting for 86% of the total vari-
ance) was taken as a single, parsimonious measure of camouflaging for all subsequent analyses. This
method was utilized in order to be consistent with prior work which computed the camouflaging
metric in an identical fashion (Lai et al., 2017b; Lai et al., 2019). This measure should be interpreted
by relative values (i.e. higher scores indicate more camouflaging) rather than absolute values. This
operationalization only allows for estimating camouflaging in autistic individuals in our cohort, as it
partly derives from the ADOS score which was not available in TD participants. This approach
remains informative, as qualitative studies suggest that camouflaging in autism can be different from
similar phenomenon (e.g. impression management) in TD individuals (Bargiela et al., 2016;
Hull et al., 2017).
In vivo chemogenetic manipulation of excitation in mouse prefrontalcortexAll in vivo studies in mice were conducted in accordance with the Italian law (DL 116, 1992 Ministero
della Sanita, Roma) and the recommendations in the Guide for the Care and Use of Laboratory Ani-
mals of the National Institutes of Health. Animal research protocols were also reviewed and con-
sented to by the animal care committee of the Istituto Italiano di Tecnologia. The Italian Ministry of
Health specifically approved the protocol of this study, authorization no. 852/17 to A.G. All surgical
procedures were performed under anesthesia.
Six to eight week-old adult male C57Bl6/J mice (Jackson Laboratories; Bar Harbor, ME, USA)
were anesthetized with isoflurane (isoflurane 4%) and head-fixed in a mouse stereotaxic apparatus
(isoflurane 2%, Stoelting). Viral injections were performed with a Hamilton syringe mounted on
Nanoliter Syringe Pump with controller (KD Scientific), at a speed of 0.05 ml/min, followed by a 5–10
min waiting period, to avoid backflow of viral solution and unspecific labeling. Viral suspensions
were injected bilaterally in PFC using the following coordinates, expressed in millimeter from
bregma: 1.7 from anterior to posterior, 0.3 lateral, �1.7 deep. The inhibitory DREADD hM4Di was
transduced using an AAV8-hSyn-hM4D(Gi)-mCherry construct. Control animals were injected with a
control AAV8-hSyn-GFP virus (www.addgene.com). These viral suspensions were injected using a 0.3
mL injection volume in n = 15 hM4Di DREADD and n = 19 SHAM mice, respectively. The excitatory
DREADD hM3Dq was transduced using an AAV8-CamkII-hM3D(Gq)-mCherry construct. Control ani-
mals for this experiment were injected with a control AAV8-CamkII-GFP construct. This set of injec-
tion were carried out using a 1 mL injection volume in n = 17 hM3Dq DREADD and n = 19 SHAM
mice, respectively. We waited at least 3 weeks to allow for maximal viral expression.
Mouse rsfMRI data acquisitionThe animal preparation protocol for mouse rsfMRI scanning was previously described in detail
(Bertero et al., 2018). Briefly, mice were anesthetized with isoflurane (5% induction), intubated and
artificially ventilated (2% maintenance). Then isoflurane was discontinued and substituted with halo-
thane (0.75%), a sedative that preserves cerebral blood flow auto-regulation and neurovascular cou-
pling (Gozzi et al., 2007). Functional data acquisition commenced 30 min after isoflurane cessation.
CNO (2 mg/kg for hM4Di and 0.5 mg/kg for hM3Dq) was administered i.v. after 15 min from the
beginning of the acquisition both in virally transduced animals and in sham mice.
Mouse rsfMRI data analysisRaw mouse rsfMRI data was preprocessed as described in previous work (Gutierrez-Barragan et al.,
2019; Liska et al., 2015). Briefly, the initial 120 volumes of the time-series were removed to allow
for T1 and gradient equilibration effects. Data were then despiked, motion corrected and spatially
registered to a common reference template. Motion traces of head realignment parameters (three
Trakoshis et al. eLife 2020;9:e55684. DOI: https://doi.org/10.7554/eLife.55684 20 of 31
Research article Neuroscience Medicine
translations + three rotations) and mean ventricular signal (corresponding to the averaged BOLD sig-
nal within a reference ventricular mask) were used as nuisance covariates and regressed out from
each time course. All rsfMRI time-series also underwent band-pass filtering to a frequency window of
0.01–0.1 Hz and spatial smoothing with a full width at half maximum of 0.6 mm.
The experimental design of the study allowed for computation of H during time-windows in the
rsfMRI scan before drug injection (i.e. ‘Baseline’), a transition phase where the drug begins having its
effect (i.e. ‘Transition’), and a treatment phase when the drug is thought to have its optimal effect
(i.e. ‘Treatment’). Analysis of condition, treatment phase, time, and all interactions between such fac-
tors was achieved using a sliding window analysis. Each window was 512 volumes in length and the
sliding step was 1 vol. H is computed at each window and results in an H time-series. The H time-
series is used as the dependent variable in a linear mixed effect model (i.e. using the lme function
within the nlme library in R) with fixed effects of condition, time, treatment phase, and all 2-way and
3-way interactions between such factors as well as a factor accounting for scan day. Random effects
in the model included time within mouse as well as treatment phase within mouse, all modeled with
random intercepts and slopes. This omnibus model was utilized to examine a 3-way interaction
between condition, time, and treatment phase. If this interaction was present, we then split the data
by the 3 levels of the treatment phase (e.g., Baseline, Transition, and Treatment), in order to exam-
ine the main effect of condition or the condition*time interaction. Plots of the data indicate each
mouse (grey lines in Figure 3) as well as group trajectories for each phase, with all trajectories esti-
mated with a generalized additive model smoother applied to individual mice and group
trajectories.
In silico recurrent network modeling of LFP and BOLD dataThe recurrent network model we use represents a standard cortical circuit incorporating integrate-
and-fire excitatory and inhibitory spiking neurons that interact through recurrent connections and
receive external inputs (both a sensory driven thalamic input and a sensory unrelated intracortical
input, see Figure 1A). The network structure and parameters of the recurrent network model are
the same ones used in Cavallari et al., 2014 with conductance-based synapses (for full details see
Cavallari et al., 2014). The network is composed of 5000 neurons, of which 4000 are excitatory (i.e.
they form AMPA-like excitatory synapses with other neurons) and 1000 inhibitory (forming GABA-
like synapses). Neurons are randomly connected with a connection probability between each pair of
neurons of 0.2. Both populations receive two different types of external Poisson inputs: a constant-
rate thalamic input and an intracortical input generated by an Ornstein-Uhlenbeck (OU) process with
zero mean. A description of the baseline reference parameters used in simulations is given in
Table 4. The LFP is computed as the sum of absolute values of AMPA and GABA postsynaptic cur-
rents on excitatory cells (Mazzoni et al., 2008; Mazzoni et al., 2015). This simple estimation of LFPs
was shown to capture more than 90% of variance of both experimental data recorded from cortical
field potentials and of simulated data from a complex three-dimensional model of the dipoles gener-
ated by cortical neurons (Mazzoni et al., 2008; Mazzoni et al., 2015; Barbieri et al., 2014). We
changed the E:I ratio by independently varying the strengths of the inhibitory (gI ) and excitatory (gE)
synaptic conductances. We called g the relative ratio between inhibitory and excitatory conductan-
ces (g ¼ gI=gE). We present results of simulations for two levels of strength of thalamic input (�0 =
1.5 spikes/second and �0 = 2 spikes/second), and we verified that our results hold qualitatively for a
wider range of input levels (1.5 to 4 spikes/second).
For the simulations used to compute H and 1/f slope of LFPs, we simulated a 10 s stretch of net-
work activity from which we extracted a 10 s LFP time series used to compute H and 1/f slopes for
each individual value of g (Figure 1B). To estimate power spectral density (PSD) we computed the
Fast Fourier Transform with the Welch’s method, dividing the data into ten overlapping segments
with 50% overlap. 1/f slopes were computed with least-squares regressions predicting log power
with log frequency. A piece-wise regression was applied to fit two line segments to the PSD – one
segment to a low frequency region from 1 to 30 Hz and a second segment to a high-frequency
region from 30 to 100 Hz.
As a basis for our model translating BOLD from LFP data, we note that prior studies with simulta-
neous electrophysiological and fMRI recordings in non-human primates have established that BOLD
signal amplitude is more closely correlated with LFP than with any other type of neuronal events,
such as spikes (Logothetis et al., 2001; Magri et al., 2012). Similarly, simultaneous
Trakoshis et al. eLife 2020;9:e55684. DOI: https://doi.org/10.7554/eLife.55684 21 of 31
Research article Neuroscience Medicine
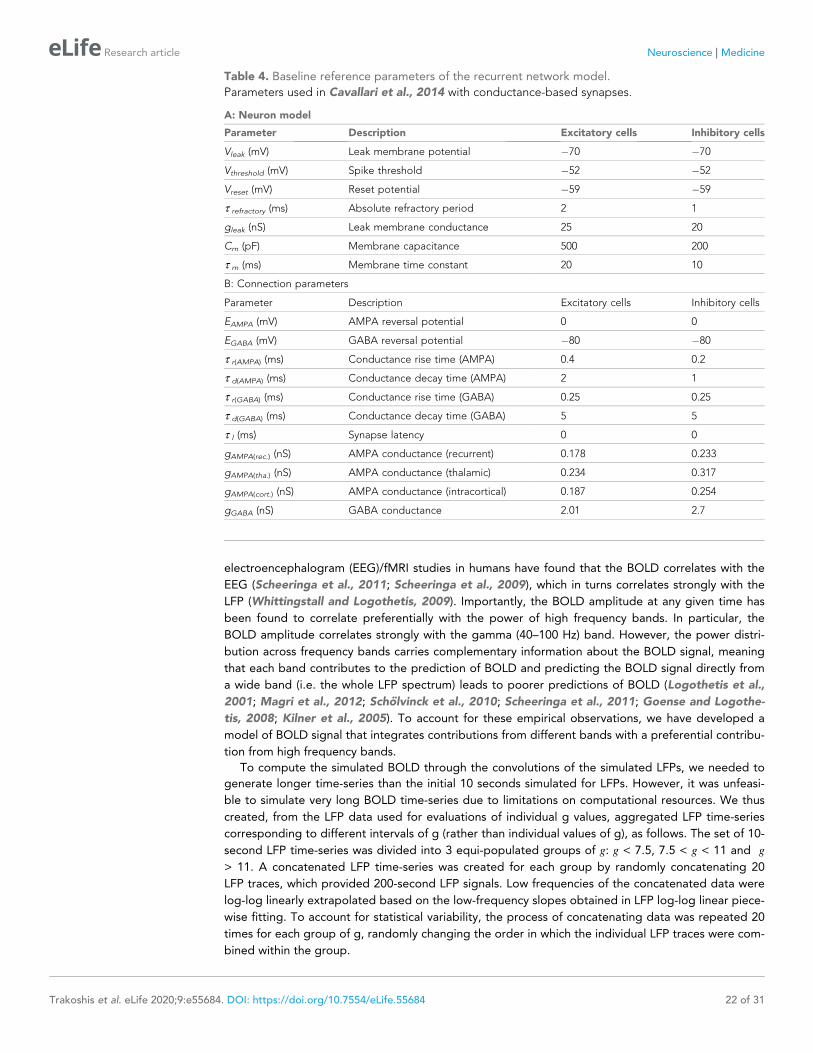
electroencephalogram (EEG)/fMRI studies in humans have found that the BOLD correlates with the
EEG (Scheeringa et al., 2011; Scheeringa et al., 2009), which in turns correlates strongly with the
LFP (Whittingstall and Logothetis, 2009). Importantly, the BOLD amplitude at any given time has
been found to correlate preferentially with the power of high frequency bands. In particular, the
BOLD amplitude correlates strongly with the gamma (40–100 Hz) band. However, the power distri-
bution across frequency bands carries complementary information about the BOLD signal, meaning
that each band contributes to the prediction of BOLD and predicting the BOLD signal directly from
a wide band (i.e. the whole LFP spectrum) leads to poorer predictions of BOLD (Logothetis et al.,
2001; Magri et al., 2012; Scholvinck et al., 2010; Scheeringa et al., 2011; Goense and Logothe-
tis, 2008; Kilner et al., 2005). To account for these empirical observations, we have developed a
model of BOLD signal that integrates contributions from different bands with a preferential contribu-
tion from high frequency bands.
To compute the simulated BOLD through the convolutions of the simulated LFPs, we needed to
generate longer time-series than the initial 10 seconds simulated for LFPs. However, it was unfeasi-
ble to simulate very long BOLD time-series due to limitations on computational resources. We thus
created, from the LFP data used for evaluations of individual g values, aggregated LFP time-series
corresponding to different intervals of g (rather than individual values of g), as follows. The set of 10-
second LFP time-series was divided into 3 equi-populated groups of g: g < 7.5, 7.5 < g < 11 and g
> 11. A concatenated LFP time-series was created for each group by randomly concatenating 20
LFP traces, which provided 200-second LFP signals. Low frequencies of the concatenated data were
log-log linearly extrapolated based on the low-frequency slopes obtained in LFP log-log linear piece-
wise fitting. To account for statistical variability, the process of concatenating data was repeated 20
times for each group of g, randomly changing the order in which the individual LFP traces were com-
bined within the group.
Table 4. Baseline reference parameters of the recurrent network model.
Parameters used in Cavallari et al., 2014 with conductance-based synapses.
A: Neuron model
Parameter Description Excitatory cells Inhibitory cells
Vleak (mV) Leak membrane potential �70 �70
Vthreshold (mV) Spike threshold �52 �52
Vreset (mV) Reset potential �59 �59
t refractory (ms) Absolute refractory period 2 1
gleak (nS) Leak membrane conductance 25 20
Cm (pF) Membrane capacitance 500 200
t m (ms) Membrane time constant 20 10
B: Connection parameters
Parameter Description Excitatory cells Inhibitory cells
EAMPA (mV) AMPA reversal potential 0 0
EGABA (mV) GABA reversal potential �80 �80
t r(AMPA) (ms) Conductance rise time (AMPA) 0.4 0.2
t d(AMPA) (ms) Conductance decay time (AMPA) 2 1
t r(GABA) (ms) Conductance rise time (GABA) 0.25 0.25
t d(GABA) (ms) Conductance decay time (GABA) 5 5
t l (ms) Synapse latency 0 0
gAMPA(rec.) (nS) AMPA conductance (recurrent) 0.178 0.233
gAMPA(tha.) (nS) AMPA conductance (thalamic) 0.234 0.317
gAMPA(cort.) (nS) AMPA conductance (intracortical) 0.187 0.254
gGABA (nS) GABA conductance 2.01 2.7
Trakoshis et al. eLife 2020;9:e55684. DOI: https://doi.org/10.7554/eLife.55684 22 of 31
Research article Neuroscience Medicine

Once concatenated LFP time-series data was simulated, we compute the simulated BOLD time-
series as the LFP data convolved not only with a hemodynamic response function (HRF), as in stan-
dard network models (Deco et al., 2004; Wijeakumar et al., 2017; Buss et al., 2014), but also with
a high-pass filter (HPF) that gives more predictive power to higher LFP frequencies (Figure 2—fig-
ure supplement 1B). We have tested different parameters of the HPF, checking that changing the
parameters produce qualitatively similar results and a monotonic correspondence between H of sim-
ulated LFP and H of simulated BOLD, and we opted for a HPF with a cutoff frequency (the frequency
where the response is lowered by 3 dB) of 12.5 Hz and with a peak response at 20 Hz. The effect of
the HPF was to attenuate low frequencies of the BOLD power distribution, partly compensating the
low-frequency enhancement of HRFs, and to shift the peak frequency of BOLD power to 0.03 Hz, a
value much closer to the peak frequency found in our real BOLD data and in most BOLD studies
(Alcauter et al., 2015; Allen et al., 2011) with respect to the one that would have been obtained
without convolution (see Figure 2—figure supplement 1).
To simulate BOLD response from the LFP data generated from the recurrent model, within the
frequency domain we multiplied the LFP spectrum with spectra of the high-pass filter (HPF) and the
hemodynamic response function (HRF), as follows:
FFT BOLDð Þ ¼ FFT LFPð ÞFFT HPFð Þ FFT HRFð Þþ h½ �
Where FFT is the fast Fourier transform operation and h is a constant white noise term. This noise
term summarizes neurovascular relationship at frequencies not observable because they are faster
than the BOLD acquisition frequencies. We assumed that the amplitude of h was very small and we
assigned small values to this noise term. We checked that the exact value of amplitude of h, or the
spectral profile of this noise term (for example, simulating 1/f noise instead of white noise), did not
alter the monotonic relationship between the simulated H of BOLD and LFP. Finally, the simulated
BOLD time-series data was produced by applying the inverse Fourier transform of FFT BOLDð Þ and
then downsampling the resulting signal to a lower sampling rate, similar to that used in BOLD
experiments (e.g., 0.5 Hz). The HRF used for simulating BOLD was the HRF from Magri et al., 2012,
but similar results were obtained when using a canonical HRF (see Figure 2—figure supplement 2).
Analyses examining enrichment of autism-associated genes in differentcell types with genes differentially expressed by androgen hormonesTo test hypotheses regarding cell types that may be affected by androgen influence, we examined
genes linked to autism via rare de novo protein truncating variants that are enriched for expression
in specific cell types (Satterstrom et al., 2020). Of the 102 genes reported by Satterstrom et al., we
split these lists by enrichments in early excitatory neurons (C3), MGE derived cortical interneurons
(C16), microglia (C19), and astrocytes or oligodendrocyte precursor cells (C4). In addition to high
risk mutations linked to autism, we additionally used a list of genes differentially expressed (DE) in
different cell types within post-mortem prefrontal and anterior cingulate cortex tissue of autistic
patients (Velmeshev et al., 2019). These DE gene lists were split into cell types, and we examined
DE genes in any excitatory neuronal cell class (L2/3, L4/L5/6), inhibitory cell classes (IN-PV, IN-SST,
IN-VIP, IN-SV2C), microglia, astrocytes (AST-PP, AST-FB), and oligodendrocytes.
To test the question of whether cell type autism-associated gene lists were enriched for genes
known to be differentially expressed by DHT, we used a previous DE gene list from an RNA-seq
dataset of DHT administration to human neuronal stem cells (Lombardo et al., 2018b). Custom
code was utilized to compute enrichment odds ratios and hypergeometric p-values for each enrich-
ment test with different cell type autism-associated lists. The background total for these tests was
the total number of genes considered in the original DHT-administration dataset (13,284).
To test how the DHT-sensitive and autism-associated genes in excitatory neurons are expressed
across the human adult brain, we used whole-brain maps of expression for each gene in MNI space
from the Allen Institute Human Brain Atlas (Hawrylycz et al., 2012). Maps for each gene were
downloaded from the Neurosynth website (https://neurosynth.org/genes/) and then submitted to a
one-sample t-test in SPM12, with a threshold of FDR q < 0.01.
Trakoshis et al. eLife 2020;9:e55684. DOI: https://doi.org/10.7554/eLife.55684 23 of 31
Research article Neuroscience Medicine

Data and code availabilityTidy data and analysis code are available at https://github.com/IIT-LAND/ei_hurst;
Trakoshis, 2020a; copy archived at https://github.com/elifesciences-publications/ei_hurst. Source
code of the recurrent network model is available at https://github.com/pablomc88/EEG_proxy_
from_network_point_neurons; Trakoshis, 2020b; copy archived at https://github.com/elifesciences-
publications/EEG_proxy_from_network_point_neurons. Raw RNA-seq data used to identify genes
differentially expressed by DHT can be found in Gene Expression Omnibus (GSE86457). Data for the
Allen Institute Human Brain Atlas can be found here: https://human.brain-map.org. Mapping of this
data to MNI space can be found at the Neurosynth website (https://neurosynth.org/genes/).
AcknowledgementsThe Medical Research Council Autism Imaging Multicentre Study Consortium (MRC AIMS Consor-
tium) is a UK collaboration between the Institute of Psychiatry, Psychology and Neuroscience (IoPPN)
at King’s College London, the Autism Research Centre, University of Cambridge and the Autism
Research Group, University of Oxford.
Additional information
Competing interests
Edward T Bullmore: is employed half-time by the University of Cambridge and half-time at GlaxoS-
mithKline plc (GSK); he holds stock in GSK. All other authors have no conflict of interests to declare.
The other authors declare that no competing interests exist.
Funding
Funder Grant reference number Author
H2020 European ResearchCouncil
755816 Michael V Lombardo
Simons Foundation 602849 Stefano Panzeri
Medical Research Council 400061 Simon Baron-Cohen
H2020 European ResearchCouncil
802371 Alessandro Gozzi
The funders had no role in study design, data collection and interpretation, or the
decision to submit the work for publication.
Author contributions
Stavros Trakoshis, Data curation, Formal analysis, Methodology, Writing - original draft, Writing -
review and editing; Pablo Martınez-Canada, Conceptualization, Data curation, Software, Formal
analysis, Visualization, Methodology, Writing - original draft, Writing - review and editing; Federico
Rocchi, Carola Canella, Data curation, Investigation, Methodology, Writing - original draft; Wonsang
You, Software, Writing - original draft; Bhismadev Chakrabarti, Conceptualization, Investigation,
Writing - original draft; Amber NV Ruigrok, MRC AIMS Consortium, Data curation, Investigation;
Edward T Bullmore, Supervision, Writing - original draft; John Suckling, Conceptualization, Data
curation, Supervision, Writing - original draft; Marija Markicevic, Valerio Zerbi, Conceptualization,
Writing - original draft; Simon Baron-Cohen, Supervision, Funding acquisition, Writing - original
draft, Project administration; Alessandro Gozzi, Conceptualization, Resources, Data curation, Super-
vision, Funding acquisition, Investigation, Methodology, Writing - original draft, Project administra-
tion, Writing - review and editing; Meng-Chuan Lai, Supervision, Funding acquisition, Writing -
original draft, Writing - review and editing; Stefano Panzeri, Data curation, Software, Formal analysis,
Supervision, Funding acquisition, Methodology, Writing - original draft, Writing - review and editing;
Michael V Lombardo, Conceptualization, Data curation, Formal analysis, Supervision, Funding
Trakoshis et al. eLife 2020;9:e55684. DOI: https://doi.org/10.7554/eLife.55684 24 of 31
Research article Neuroscience Medicine
acquisition, Investigation, Visualization, Methodology, Writing - original draft, Project administration,
Writing - review and editing
Author ORCIDs
Valerio Zerbi http://orcid.org/0000-0001-7984-9565
Alessandro Gozzi https://orcid.org/0000-0002-5731-4137
Stefano Panzeri http://orcid.org/0000-0003-1700-8909
Michael V Lombardo https://orcid.org/0000-0001-6780-8619
Ethics
Human subjects: All procedures contributing to this work on human subjects comply with the ethical
standards of the relevant national and institutional committees on human experimentation and with
the Helsinki Declaration of 1975, as revised in 2008. All human participants’ informed consent was
obtained in accord with procedures approved by the Suffolk Local Research Ethics Committee.
Animal experimentation: All in-vivo studies in mice were conducted in accordance with the Italian
law (DL 116, 1992 Ministero della Sanita, Roma) and the recommendations in the Guide for the Care
and Use of Laboratory Animals of the National Institutes of Health. Animal research protocols were
also reviewed and consented to by the animal care committee of the Istituto Italiano di Tecnologia.
The Italian Ministry of Health specifically approved the protocol of this study, authorization no. 852/
17 to A.G.
Decision letter and Author response
Decision letter https://doi.org/10.7554/eLife.55684.sa1
Author response https://doi.org/10.7554/eLife.55684.sa2
Additional filesSupplementary files. Supplementary file 1. Parameters for E:I model: Parameters utilized in the E:I model from
Gao et al., 2017, for simulating LFP data.
. Transparent reporting form
Data availability
Tidy data and analysis code are available at https://github.com/IIT-LAND/ei_hurst (copy archived at
https://github.com/elifesciences-publications/ei_hurst). Source code of the recurrent network model
is available at https://github.com/pablomc88/EEG_proxy_from_network_point_neurons (copy
archived at https://github.com/elifesciences-publications/EEG_proxy_from_network_point_neurons).
Raw RNA-seq data used to identify genes differentially expressed by DHT can be found in Gene
Expression Omnibus (GSE86457). Data for the Allen Institute Human Brain Atlas can be found here:
https://human.brain-map.org. Mapping of this data to MNI space can be found at the Neurosynth
website (https://neurosynth.org/genes/).
The following previously published datasets were used:
Author(s) Year Dataset title Dataset URLDatabase andIdentifier
Quartier A, Jost B,Keime C, Piton A
2018 Genes and pathways regulated byandrogens as possible contributorsto the male excess observed inautism [RNA-Seq]
https://www.ncbi.nlm.nih.gov/geo/query/acc.cgi?acc=GSE86457
NCBI GeneExpression Omnibus,GSE86457
Hawrylycz MJ, LeinES, Guillozet-Bon-gaarts AL, Shen EH,Ng L, Miller JA,Lagemaat LN,Smith KA, Ebbert A,Riley ZL, Abajian C,
2012 An anatomically comprehensiveatlas of the adult human braintranscriptome
https://human.brain-map.org/static/down-load
Allen Human BrainAtlas, human.brain-map
Trakoshis et al. eLife 2020;9:e55684. DOI: https://doi.org/10.7554/eLife.55684 25 of 31
Research article Neuroscience Medicine
Beckmann CF, Ber-nard A, BertagnolliD, Boe AF, Carta-gena PM, Chakra-varty MM, ChapinM, Chong J, DalleyRA, Daly BD, DangC, Datta S, Dee N,Dolbeare TA, FaberV, Feng D, FowlerDR, Goldy J, Gre-gor BW, Haradon Z,Haynor DR, Hoh-mann JG, HorvathS, Howard RE,Jeromin A, JochimJM, Kinnunen M,Lau C, Lazarz ET,Lee C, Lemon TA,Li L, Li Y, Morris JA,Overly CC, ParkerPD, Parry SE, Re-ding M, Royall JJ,Schulkin J, SequeiraPA, SlaughterbeckCR, Smith SC, SodtAJ, Sunkin SM,Swanson BE, Vaw-ter MP, Williams D,Wohnoutka P,Zielke HR, Gesch-wind DH, Hof PR,Smith SM, Koch C,Grant SGN, JonesAR
ReferencesAlcauter S, Lin W, Smith JK, Goldman BD, Reznick JS, Gilmore JH, Gao W. 2015. Frequency of spontaneousBOLD signal shifts during infancy and correlates with cognitive performance. Developmental CognitiveNeuroscience 12:40–50. DOI: https://doi.org/10.1016/j.dcn.2014.10.004, PMID: 25459875
Alexander GM, Rogan SC, Abbas AI, Armbruster BN, Pei Y, Allen JA, Nonneman RJ, Hartmann J, Moy SS,Nicolelis MA, McNamara JO, Roth BL. 2009. Remote control of neuronal activity in transgenic mice expressingevolved G protein-coupled receptors. Neuron 63:27–39. DOI: https://doi.org/10.1016/j.neuron.2009.06.014,PMID: 19607790
Allen EA, Erhardt EB, Damaraju E, Gruner W, Segall JM, Silva RF, Havlicek M, Rachakonda S, Fries J, KalyanamR, Michael AM, Caprihan A, Turner JA, Eichele T, Adelsheim S, Bryan AD, Bustillo J, Clark VP, Feldstein EwingSW, Filbey F, et al. 2011. A baseline for the multivariate comparison of resting-state networks. Frontiers inSystems Neuroscience 5:2. DOI: https://doi.org/10.3389/fnsys.2011.00002, PMID: 21442040
Balsters JH, Zerbi V, Sallet J, Wenderoth N, Mars RB. 2020. Primate homologs of mouse cortico-striatal circuits.eLife 9:e53680. DOI: https://doi.org/10.7554/eLife.53680, PMID: 32298231
Barbieri F, Mazzoni A, Logothetis NK, Panzeri S, Brunel N. 2014. Stimulus dependence of local field potentialspectra: experiment versus theory. Journal of Neuroscience 34:14589–14605. DOI: https://doi.org/10.1523/JNEUROSCI.5365-13.2014, PMID: 25355213
Bargiela S, Steward R, Mandy W. 2016. The experiences of Late-diagnosed women with autism spectrumconditions: an investigation of the female autism phenotype. Journal of Autism and Developmental Disorders46:3281–3294. DOI: https://doi.org/10.1007/s10803-016-2872-8, PMID: 27457364
Baron-Cohen S, Wheelwright S, Skinner R, Martin J, Clubley E. 2001a. The autism-spectrum quotient (AQ):evidence from asperger syndrome/high-functioning autism, males and females, scientists and mathematicians.Journal of Autism and Developmental Disorders 31:5–17. DOI: https://doi.org/10.1023/a:1005653411471,PMID: 11439754
Baron-Cohen S, Wheelwright S, Hill J, Raste Y, Plumb I. 2001b. The "Reading the Mind in the Eyes" Test revisedversion: a study with normal adults, and adults with Asperger syndrome or high-functioning autism. Journal ofChild Psychology and Psychiatry 42:241–251. DOI: https://doi.org/10.1111/1469-7610.00715, PMID: 11280420
Bedard C, Kroger H, Destexhe A. 2006. Does the 1/f frequency scaling of brain signals reflect self-organizedcritical states? Physical Review Letters 97:118102. DOI: https://doi.org/10.1103/PhysRevLett.97.118102,PMID: 17025932
Bedford SA, Park MTM, Devenyi GA, Tullo S, Germann J, Patel R, Anagnostou E, Baron-Cohen S, Bullmore ET,Chura LR, Craig MC, Ecker C, Floris DL, Holt RJ, Lenroot R, Lerch JP, Lombardo MV, Murphy DGM, Raznahan
Trakoshis et al. eLife 2020;9:e55684. DOI: https://doi.org/10.7554/eLife.55684 26 of 31
Research article Neuroscience Medicine
A, Ruigrok ANV, et al. 2020. Large-scale analyses of the relationship between sex, age and intelligencequotient heterogeneity and cortical morphometry in autism spectrum disorder. Molecular Psychiatry 25:614–628. DOI: https://doi.org/10.1038/s41380-019-0420-6, PMID: 31028290
Bejerot S, Eriksson JM, Bonde S, Carlstrom K, Humble MB, Eriksson E. 2012. The extreme male brain revisited:gender coherence in adults with autism spectrum disorder. British Journal of Psychiatry 201:116–123.DOI: https://doi.org/10.1192/bjp.bp.111.097899
Bertero A, Liska A, Pagani M, Parolisi R, Masferrer ME, Gritti M, Pedrazzoli M, Galbusera A, Sarica A, Cerasa A,Buffelli M, Tonini R, Buffo A, Gross C, Pasqualetti M, Gozzi A. 2018. Autism-associated 16p11.2 microdeletionimpairs prefrontal functional connectivity in mouse and human. Brain 141:2055–2065. DOI: https://doi.org/10.1093/brain/awy111, PMID: 29722793
Bethlehem RA, Seidlitz J. 2018. Normative age modelling of cortical thickness in autistic males. bioRxiv.DOI: https://doi.org/10.1101/252593
Bozzi Y, Provenzano G, Casarosa S. 2018. Neurobiological bases of autism-epilepsy comorbidity: a focus onexcitation/inhibition imbalance. European Journal of Neuroscience 47:534–548. DOI: https://doi.org/10.1111/ejn.13595, PMID: 28452083
Brunel N, Wang XJ. 2003. What determines the frequency of fast network oscillations with irregular neuraldischarges? I. synaptic dynamics and excitation-inhibition balance. Journal of Neurophysiology 90:415–430.DOI: https://doi.org/10.1152/jn.01095.2002, PMID: 12611969
Buckner RL, DiNicola LM. 2019. The brain’s default network: updated anatomy, physiology and evolving insights.Nature Reviews Neuroscience 20:593–608. DOI: https://doi.org/10.1038/s41583-019-0212-7, PMID: 31492945
Bullmore E, Long C, Suckling J, Fadili J, Calvert G, Zelaya F, Carpenter TA, Brammer M. 2001. Colored noiseand computational inference in neurophysiological (fMRI) time series analysis: resampling methods in time andwavelet domains. Human Brain Mapping 12:61–78. DOI: https://doi.org/10.1002/1097-0193(200102)12:2<61::AID-HBM1004>3.0.CO;2-W, PMID: 11169871
Buss AT, Wifall T, Hazeltine E, Spencer JP. 2014. Integrating the behavioral and neural dynamics of responseselection in a dual-task paradigm: a dynamic neural field model of dux et al. (2009). Journal of CognitiveNeuroscience 26:334–351. DOI: https://doi.org/10.1162/jocn_a_00496, PMID: 24116841
Cavallari S, Panzeri S, Mazzoni A. 2014. Comparison of the dynamics of neural interactions between current-based and conductance-based integrate-and-fire recurrent networks. Frontiers in Neural Circuits 8:12.DOI: https://doi.org/10.3389/fncir.2014.00012, PMID: 24634645
Chantiluke K, Barrett N, Giampietro V, Santosh P, Brammer M, Simmons A, Murphy DG, Rubia K. 2015. Inversefluoxetine effects on inhibitory brain activation in non-comorbid boys with ADHD and with ASD.Psychopharmacology 232:2071–2082. DOI: https://doi.org/10.1007/s00213-014-3837-2, PMID: 25533997
Coghlan S, Horder J, Inkster B, Mendez MA, Murphy DG, Nutt DJ. 2012. GABA system dysfunction in autism andrelated disorders: from synapse to symptoms. Neuroscience & Biobehavioral Reviews 36:2044–2055.DOI: https://doi.org/10.1016/j.neubiorev.2012.07.005, PMID: 22841562
Courchesne E, Pramparo T, Gazestani VH, Lombardo MV, Pierce K, Lewis NE. 2019. The ASD living biology:from cell proliferation to clinical phenotype. Molecular Psychiatry 24:88–107. DOI: https://doi.org/10.1038/s41380-018-0056-y
Cox RW. 1996. AFNI: software for analysis and visualization of functional magnetic resonance neuroimages.Computers and Biomedical Research 29:162–173. DOI: https://doi.org/10.1006/cbmr.1996.0014, PMID:8812068
Deco G, Rolls ET, Horwitz B. 2004. "What" and "where" in visual working memory: a computationalneurodynamical perspective for integrating FMRI and single-neuron data. Journal of Cognitive Neuroscience16:683–701. DOI: https://doi.org/10.1162/089892904323057380, PMID: 15165356
Dhamala E, Jamison KW, Sabuncu MR, Kuceyeski A. 2020. Sex classification using long-range temporaldependence of resting-state functional MRI time series. Human Brain Mapping 6:25030. DOI: https://doi.org/10.1002/hbm.25030
Di Martino A, Ross K, Uddin LQ, Sklar AB, Castellanos FX, Milham MP. 2009. Functional brain correlates of socialand nonsocial processes in autism spectrum disorders: an activation likelihood estimation meta-analysis.Biological Psychiatry 65:63–74. DOI: https://doi.org/10.1016/j.biopsych.2008.09.022, PMID: 18996505
Di Martino A, Yan CG, Li Q, Denio E, Castellanos FX, Alaerts K, Anderson JS, Assaf M, Bookheimer SY, DaprettoM, Deen B, Delmonte S, Dinstein I, Ertl-Wagner B, Fair DA, Gallagher L, Kennedy DP, Keown CL, Keysers C,Lainhart JE, et al. 2014. The autism brain imaging data exchange: towards a large-scale evaluation of theintrinsic brain architecture in autism. Molecular Psychiatry 19:659–667. DOI: https://doi.org/10.1038/mp.2013.78, PMID: 23774715
Ferenczi EA, Zalocusky KA, Liston C, Grosenick L, Warden MR, Amatya D, Katovich K, Mehta H, Patenaude B,Ramakrishnan C, Kalanithi P, Etkin A, Knutson B, Glover GH, Deisseroth K. 2016. Prefrontal cortical regulationof brainwide circuit dynamics and reward-related behavior. Science 351:aac9698. DOI: https://doi.org/10.1126/science.aac9698, PMID: 26722001
Gao R, Peterson EJ, Voytek B. 2017. Inferring synaptic excitation/inhibition balance from field potentials.NeuroImage 158:70–78. DOI: https://doi.org/10.1016/j.neuroimage.2017.06.078, PMID: 28676297
Glasser MF, Coalson TS, Robinson EC, Hacker CD, Harwell J, Yacoub E, Ugurbil K, Andersson J, Beckmann CF,Jenkinson M, Smith SM, Van Essen DC. 2016. A multi-modal parcellation of human cerebral cortex. Nature536:171–178. DOI: https://doi.org/10.1038/nature18933, PMID: 27437579
Goense JB, Logothetis NK. 2008. Neurophysiology of the BOLD fMRI signal in awake monkeys. Current Biology18:631–640. DOI: https://doi.org/10.1016/j.cub.2008.03.054, PMID: 18439825
Trakoshis et al. eLife 2020;9:e55684. DOI: https://doi.org/10.7554/eLife.55684 27 of 31
Research article Neuroscience Medicine

Gozzi A, Ceolin L, Schwarz A, Reese T, Bertani S, Crestan V, Bifone A. 2007. A multimodality investigation ofcerebral hemodynamics and autoregulation in pharmacological MRI. Magnetic Resonance Imaging 25:826–833.DOI: https://doi.org/10.1016/j.mri.2007.03.003, PMID: 17451905
Gutierrez-Barragan D, Basson MA, Panzeri S, Gozzi A. 2019. Infraslow state fluctuations govern spontaneousfMRI network dynamics. Current Biology 29:2295–2306. DOI: https://doi.org/10.1016/j.cub.2019.06.017,PMID: 31303490
Haller M. 2018. Parameterizing neural power spectra. bioRxiv. DOI: https://doi.org/10.1101/299859Happe F, Ronald A, Plomin R. 2006. Time to give up on a single explanation for autism. Nature Neuroscience 9:1218–1220. DOI: https://doi.org/10.1038/nn1770, PMID: 17001340
Hawrylycz MJ, Lein ES, Guillozet-Bongaarts AL, Shen EH, Ng L, Miller JA, van de Lagemaat LN, Smith KA,Ebbert A, Riley ZL, Abajian C, Beckmann CF, Bernard A, Bertagnolli D, Boe AF, Cartagena PM, ChakravartyMM, Chapin M, Chong J, Dalley RA, et al. 2012. An anatomically comprehensive atlas of the adult human braintranscriptome. Nature 489:391–399. DOI: https://doi.org/10.1038/nature11405, PMID: 22996553
He BJ. 2011. Scale-Free properties of the functional magnetic resonance imaging signal during rest and task. TheJournal of Neuroscience 31:13786–13795. DOI: https://doi.org/10.1523/JNEUROSCI.2111-11.2011, PMID: 21957241
He BJ. 2014. Scale-free brain activity: past, present, and future. Trends in Cognitive Sciences 18:480–487.DOI: https://doi.org/10.1016/j.tics.2014.04.003, PMID: 24788139
Horder J, Andersson M, Mendez MA, Singh N, Tangen A, Lundberg J, Gee A, Halldin C, Veronese M, Bolte S,Farde L, Sementa T, Cash D, Higgins K, Spain D, Turkheimer F, Mick I, Selvaraj S, Nutt DJ, Lingford-Hughes A,et al. 2018. GABAA receptor availability is not altered in adults with autism spectrum disorder or in mousemodels. Science Translational Medicine 10:eaam8434. DOI: https://doi.org/10.1126/scitranslmed.aam8434,PMID: 30282698
Hull L, Petrides KV, Allison C, Smith P, Baron-Cohen S, Lai MC, Mandy W. 2017. "Putting on My Best Normal":Social Camouflaging in Adults with Autism Spectrum Conditions. Journal of Autism and DevelopmentalDisorders 47:2519–2534. DOI: https://doi.org/10.1007/s10803-017-3166-5, PMID: 28527095
Hull L, Lai MC, Baron-Cohen S, Allison C, Smith P, Petrides KV, Mandy W. 2020. Gender differences in self-reported camouflaging in autistic and non-autistic adults. Autism 24:352–363. DOI: https://doi.org/10.1177/1362361319864804, PMID: 31319684
Kaczkurkin AN, Raznahan A, Satterthwaite TD. 2019. Sex differences in the developing brain: insights frommultimodal neuroimaging. Neuropsychopharmacology 44:71–85. DOI: https://doi.org/10.1038/s41386-018-0111-z, PMID: 29930385
Kilner JM, Mattout J, Henson R, Friston KJ. 2005. Hemodynamic correlates of EEG: a heuristic. NeuroImage 28:280–286. DOI: https://doi.org/10.1016/j.neuroimage.2005.06.008, PMID: 16023377
Krishnan A, Williams LJ, McIntosh AR, Abdi H. 2011. Partial least squares (PLS) methods for neuroimaging: atutorial and review. NeuroImage 56:455–475. DOI: https://doi.org/10.1016/j.neuroimage.2010.07.034,PMID: 20656037
Kundu P, Inati SJ, Evans JW, Luh WM, Bandettini PA. 2012. Differentiating BOLD and non-BOLD signals in fMRItime series using multi-echo EPI. NeuroImage 60:1759–1770. DOI: https://doi.org/10.1016/j.neuroimage.2011.12.028, PMID: 22209809
Lai MC, Lombardo MV, Chakrabarti B, Sadek SA, Pasco G, Wheelwright SJ, Bullmore ET, Baron-Cohen S,Suckling J, MRC AIMS Consortium. 2010. A shift to randomness of brain oscillations in people with autism.Biological Psychiatry 68:1092–1099. DOI: https://doi.org/10.1016/j.biopsych.2010.06.027, PMID: 20728872
Lai MC, Lombardo MV, Auyeung B, Chakrabarti B, Baron-Cohen S. 2015. Sex/gender differences and autism:setting the scene for future research. Journal of the American Academy of Child & Adolescent Psychiatry 54:11–24. DOI: https://doi.org/10.1016/j.jaac.2014.10.003, PMID: 25524786
Lai MC, Lerch JP, Floris DL, Ruigrok AN, Pohl A, Lombardo MV, Baron-Cohen S. 2017a. Imaging sex/gender andautism in the brain: etiological implications. Journal of Neuroscience Research 95:380–397. DOI: https://doi.org/10.1002/jnr.23948, PMID: 27870420
Lai MC, Lombardo MV, Ruigrok AN, Chakrabarti B, Auyeung B, Szatmari P, Happe F, Baron-Cohen S, MRC AIMSConsortium. 2017b. Quantifying and exploring camouflaging in men and women with autism. Autism 21:690–702. DOI: https://doi.org/10.1177/1362361316671012, PMID: 27899710
Lai MC, Lombardo MV, Chakrabarti B, Ruigrok AN, Bullmore ET, Suckling J, Auyeung B, Happe F, Szatmari P,Baron-Cohen S, MRC AIMS Consortium. 2019. Neural self-representation in autistic women and associationwith ’compensatory camouflaging’. Autism 23:1210–1223. DOI: https://doi.org/10.1177/1362361318807159,PMID: 30354191
Lauritzen M, Gold L. 2003. Brain function and neurophysiological correlates of signals used in functionalneuroimaging. The Journal of Neuroscience 23:3972–3980. DOI: https://doi.org/10.1523/JNEUROSCI.23-10-03972.2003, PMID: 12764081
Lee E, Lee J, Kim E. 2017. Excitation/Inhibition imbalance in animal models of autism spectrum disorders.Biological Psychiatry 81:838–847. DOI: https://doi.org/10.1016/j.biopsych.2016.05.011, PMID: 27450033
Liska A, Galbusera A, Schwarz AJ, Gozzi A. 2015. Functional connectivity hubs of the mouse brain. NeuroImage115:281–291. DOI: https://doi.org/10.1016/j.neuroimage.2015.04.033, PMID: 25913701
Livingston LA, Shah P, Happe F. 2019. Compensatory strategies below the behavioural surface in autism: aqualitative study. The Lancet Psychiatry 6:766–777. DOI: https://doi.org/10.1016/S2215-0366(19)30224-X,PMID: 31350208
Trakoshis et al. eLife 2020;9:e55684. DOI: https://doi.org/10.7554/eLife.55684 28 of 31
Research article Neuroscience Medicine
Logothetis NK, Pauls J, Augath M, Trinath T, Oeltermann A. 2001. Neurophysiological investigation of the basisof the fMRI signal. Nature 412:150–157. DOI: https://doi.org/10.1038/35084005, PMID: 11449264
Logothetis NK. 2008. What we can do and what we cannot do with fMRI. Nature 453:869–878. DOI: https://doi.org/10.1038/nature06976, PMID: 18548064
Lombardi F, Herrmann HJ, de Arcangelis L. 2017. Balance of excitation and inhibition determines 1/f powerspectrum in neuronal networks. Chaos: An Interdisciplinary Journal of Nonlinear Science 27:047402.DOI: https://doi.org/10.1063/1.4979043
Lombardo MV, Chakrabarti B, Bullmore ET, Sadek SA, Pasco G, Wheelwright SJ, Suckling J, Baron-Cohen S,MRC AIMS Consortium. 2010. Atypical neural self-representation in autism. Brain 133:611–624. DOI: https://doi.org/10.1093/brain/awp306, PMID: 20008375
Lombardo MV, Pierce K, Eyler LT, Carter Barnes C, Ahrens-Barbeau C, Solso S, Campbell K, Courchesne E.2015. Different functional neural substrates for good and poor language outcome in autism. Neuron 86:567–577. DOI: https://doi.org/10.1016/j.neuron.2015.03.023, PMID: 25864635
Lombardo MV, Pramparo T, Gazestani V, Warrier V, Bethlehem RAI, Carter Barnes C, Lopez L, Lewis NE, Eyler L,Pierce K, Courchesne E. 2018a. Large-scale associations between the leukocyte transcriptome and BOLDresponses to speech differ in autism early language outcome subtypes. Nature Neuroscience 21:1680–1688.DOI: https://doi.org/10.1038/s41593-018-0281-3, PMID: 30482947
Lombardo MV, Auyeung B, Pramparo T, Quartier A, Courraud J, Holt RJ, Waldman J, Ruigrok ANV, Mooney N,Bethlehem RAI, Lai M-C, Kundu P, Bullmore ET, Mandel J-L, Piton A, Baron-Cohen S. 2018b. Sex-specificimpact of prenatal androgens on social brain default mode subsystems. Molecular Psychiatry 95:198.DOI: https://doi.org/10.1038/s41380-018-0198-y
Lombardo MV, Lai MC, Baron-Cohen S. 2019a. Big data approaches to decomposing heterogeneity across theautism spectrum. Molecular Psychiatry 24:1435–1450. DOI: https://doi.org/10.1038/s41380-018-0321-0,PMID: 30617272
Lombardo MV, Eyler L, Moore A, Datko M, Carter Barnes C, Cha D, Courchesne E, Pierce K. 2019b. Defaultmode-visual network hypoconnectivity in an autism subtype with pronounced social visual engagementdifficulties. eLife 8:e47427. DOI: https://doi.org/10.7554/eLife.47427, PMID: 31843053
Lord C, Rutter M, Le Couteur A. 1994. Autism diagnostic Interview-Revised: a revised version of a diagnosticinterview for caregivers of individuals with possible pervasive developmental disorders. Journal of Autism andDevelopmental Disorders 24:659–685. DOI: https://doi.org/10.1007/BF02172145, PMID: 7814313
Lord C, Risi S, Lambrecht L, Cook EH, Leventhal BL, DiLavore PC, Pickles A, Rutter M. 2000. The autismdiagnostic observation schedule-generic: a standard measure of social and communication deficits associatedwith the spectrum of autism. Journal of Autism and Developmental Disorders 30:205–223. DOI: https://doi.org/10.1023/A:1005592401947, PMID: 11055457
Magri C, Schridde U, Murayama Y, Panzeri S, Logothetis NK. 2012. The amplitude and timing of the BOLD signalreflects the relationship between local field potential power at different frequencies. Journal of Neuroscience32:1395–1407. DOI: https://doi.org/10.1523/JNEUROSCI.3985-11.2012, PMID: 22279224
Markicevic M, Fulcher BD, Lewis C, Helmchen F, Rudin M, Zerbi V, Wenderoth N. 2020. Cortical excitation:inhibition imbalance causes abnormal brain network dynamics as observed in neurodevelopmental disorders.Cerebral Cortex 7:bhaa084. DOI: https://doi.org/10.1093/cercor/bhaa084
Maxim V, Sendur L, Fadili J, Suckling J, Gould R, Howard R, Bullmore E. 2005. Fractional gaussian noise,functional MRI and Alzheimer’s disease. NeuroImage 25:141–158. DOI: https://doi.org/10.1016/j.neuroimage.2004.10.044, PMID: 15734351
Mazzoni A, Panzeri S, Logothetis NK, Brunel N. 2008. Encoding of naturalistic stimuli by local field potentialspectra in networks of excitatory and inhibitory neurons. PLOS Computational Biology 4:e1000239.DOI: https://doi.org/10.1371/journal.pcbi.1000239, PMID: 19079571
Mazzoni A, Whittingstall K, Brunel N, Logothetis NK, Panzeri S. 2010. Understanding the relationships betweenspike rate and Delta/gamma frequency bands of LFPs and EEGs using a local cortical network model.NeuroImage 52:956–972. DOI: https://doi.org/10.1016/j.neuroimage.2009.12.040, PMID: 20026218
Mazzoni A, Brunel N, Cavallari S, Logothetis NK, Panzeri S. 2011. Cortical dynamics during naturalistic sensorystimulations: experiments and models. Journal of Physiology-Paris 105:2–15. DOI: https://doi.org/10.1016/j.jphysparis.2011.07.014, PMID: 21907800
Mazzoni A, Linden H, Cuntz H, Lansner A, Panzeri S, Einevoll GT. 2015. Computing the local field potential (LFP)from Integrate-and-Fire network models. PLOS Computational Biology 11:e1004584. DOI: https://doi.org/10.1371/journal.pcbi.1004584, PMID: 26657024
Mitchell JP, Macrae CN, Banaji MR. 2006. Dissociable medial prefrontal contributions to judgments of similarand dissimilar others. Neuron 50:655–663. DOI: https://doi.org/10.1016/j.neuron.2006.03.040,PMID: 16701214
Mukamel R, Gelbard H, Arieli A, Hasson U, Fried I, Malach R. 2005. Coupling between neuronal firing, fieldpotentials, and FMRI in human auditory cortex. Science 309:951–954. DOI: https://doi.org/10.1126/science.1110913, PMID: 16081741
Naaijen J, Bralten J, Poelmans G, Glennon JC, Franke B, Buitelaar JK, IMAGE consortium. 2017. Glutamatergicand GABAergic gene sets in attention-deficit/hyperactivity disorder: association to overlapping traits in ADHDand autism. Translational Psychiatry 7:e999. DOI: https://doi.org/10.1038/tp.2016.273, PMID: 28072412
Nelson SB, Valakh V. 2015. Excitatory/Inhibitory balance and circuit homeostasis in autism spectrum disorders.Neuron 87:684–698. DOI: https://doi.org/10.1016/j.neuron.2015.07.033, PMID: 26291155
Trakoshis et al. eLife 2020;9:e55684. DOI: https://doi.org/10.7554/eLife.55684 29 of 31
Research article Neuroscience Medicine
Niessing J, Ebisch B, Schmidt KE, Niessing M, Singer W, Galuske RA. 2005. Hemodynamic signals correlatetightly with synchronized gamma oscillations. Science 309:948–951. DOI: https://doi.org/10.1126/science.1110948, PMID: 16081740
Padmanabhan A, Lynch CJ, Schaer M, Menon V. 2017. The default mode network in autism. Biological Psychiatry:Cognitive Neuroscience and Neuroimaging 2:476–486. DOI: https://doi.org/10.1016/j.bpsc.2017.04.004
Parikshak NN, Luo R, Zhang A, Won H, Lowe JK, Chandran V, Horvath S, Geschwind DH. 2013. Integrativefunctional genomic analyses implicate specific molecular pathways and circuits in autism. Cell 155:1008–1021.DOI: https://doi.org/10.1016/j.cell.2013.10.031, PMID: 24267887
Patel AX, Kundu P, Rubinov M, Jones PS, Vertes PE, Ersche KD, Suckling J, Bullmore ET. 2014. A waveletmethod for modeling and despiking motion artifacts from resting-state fMRI time series. NeuroImage 95:287–304. DOI: https://doi.org/10.1016/j.neuroimage.2014.03.012, PMID: 24657353
Pilling S, Baron-Cohen S, Megnin-Viggars O, Lee R, Taylor C, Guideline Development Group. 2012. Recognition,referral, diagnosis, and management of adults with autism: summary of NICE guidance. BMJ 344:e4082.DOI: https://doi.org/10.1136/bmj.e4082, PMID: 22740567
Power JD, Barnes KA, Snyder AZ, Schlaggar BL, Petersen SE. 2012. Spurious but systematic correlations infunctional connectivity MRI networks arise from subject motion. NeuroImage 59:2142–2154. DOI: https://doi.org/10.1016/j.neuroimage.2011.10.018, PMID: 22019881
Quartier A, Chatrousse L, Redin C, Keime C, Haumesser N, Maglott-Roth A, Brino L, Le Gras S, Benchoua A,Mandel JL, Piton A. 2018. Genes and pathways regulated by androgens in human neural cells, potentialcandidates for the male excess in autism spectrum disorder. Biological Psychiatry 84:239–252. DOI: https://doi.org/10.1016/j.biopsych.2018.01.002, PMID: 29428674
Rauch A, Rainer G, Logothetis NK. 2008. The effect of a serotonin-induced dissociation between spiking andperisynaptic activity on BOLD functional MRI. PNAS 105:6759–6764. DOI: https://doi.org/10.1073/pnas.0800312105, PMID: 18456837
Robinson EB, Lichtenstein P, Anckarsater H, Happe F, Ronald A. 2013. Examining and interpreting the femaleprotective effect against autistic behavior. PNAS 110:5258–5262. DOI: https://doi.org/10.1073/pnas.1211070110, PMID: 23431162
Rubenstein JL, Merzenich MM. 2003. Model of autism: increased ratio of excitation/inhibition in key neuralsystems. Genes, Brain and Behavior 2:255–267. DOI: https://doi.org/10.1034/j.1601-183X.2003.00037.x,PMID: 14606691
Rutter M, Caspi A, Moffitt TE. 2003. Using sex differences in psychopathology to study causal mechanisms:unifying issues and research strategies. Journal of Child Psychology and Psychiatry 44:1092–1115. DOI: https://doi.org/10.1111/1469-7610.00194, PMID: 14626453
Satterstrom FK, Kosmicki JA, Wang J, Breen MS, De Rubeis S, An JY, Peng M, Collins R, Grove J, Klei L, StevensC, Reichert J, Mulhern MS, Artomov M, Gerges S, Sheppard B, Xu X, Bhaduri A, Norman U, Brand H, et al.2020. Large-Scale exome sequencing study implicates both developmental and functional changes in theneurobiology of autism. Cell 180:568–584. DOI: https://doi.org/10.1016/j.cell.2019.12.036, PMID: 31981491
Scheeringa R, Petersson KM, Oostenveld R, Norris DG, Hagoort P, Bastiaansen MC. 2009. Trial-by-trial couplingbetween EEG and BOLD identifies networks related to alpha and theta EEG power increases during workingmemory maintenance. NeuroImage 44:1224–1238. DOI: https://doi.org/10.1016/j.neuroimage.2008.08.041,PMID: 18840533
Scheeringa R, Fries P, Petersson KM, Oostenveld R, Grothe I, Norris DG, Hagoort P, Bastiaansen MC. 2011.Neuronal dynamics underlying high- and low-frequency EEG oscillations contribute independently to thehuman BOLD signal. Neuron 69:572–583. DOI: https://doi.org/10.1016/j.neuron.2010.11.044, PMID: 21315266
Scheeringa R, Fries P. 2019. Cortical layers, rhythms and BOLD signals. NeuroImage 197:689–698. DOI: https://doi.org/10.1016/j.neuroimage.2017.11.002, PMID: 29108940
Scholvinck ML, Maier A, Ye FQ, Duyn JH, Leopold DA. 2010. Neural basis of global resting-state fMRI activity.PNAS 107:10238–10243. DOI: https://doi.org/10.1073/pnas.0913110107, PMID: 20439733
Schuck RK, Flores RE, Fung LK. 2019. Brief report: sex/Gender differences in Symptomology and camouflagingin adults with autism spectrum disorder. Journal of Autism and Developmental Disorders 49:2597–2604.DOI: https://doi.org/10.1007/s10803-019-03998-y, PMID: 30945091
Selimbeyoglu A, Kim CK, Inoue M, Lee SY, Hong ASO, Kauvar I, Ramakrishnan C, Fenno LE, Davidson TJ, WrightM, Deisseroth K. 2017. Modulation of prefrontal cortex excitation/inhibition balance rescues social behavior inCNTNAP2-deficient mice. Science Translational Medicine 9:eaah6733. DOI: https://doi.org/10.1126/scitranslmed.aah6733, PMID: 28768803
Sohal VS, Rubenstein JLR. 2019. Excitation-inhibition balance as a framework for investigating mechanisms inneuropsychiatric disorders. Molecular Psychiatry 24:1248–1257. DOI: https://doi.org/10.1038/s41380-019-0426-0, PMID: 31089192
Stachniak TJ, Ghosh A, Sternson SM. 2014. Chemogenetic synaptic silencing of neural circuits localizes ahypothalamus!midbrain pathway for feeding behavior. Neuron 82:797–808. DOI: https://doi.org/10.1016/j.neuron.2014.04.008, PMID: 24768300
Stadnitski T. 2012. Measuring fractality. Frontiers in Physiology 3:127. DOI: https://doi.org/10.3389/fphys.2012.00127, PMID: 22586408
Trakoshis S. 2020a. Code and data for EI Hurst paper. GitHub. GPL-3.0. https://github.com/elifesciences-publications/ei_hurst/
Trakoshis S. 2020b. Instructions to simulate the LIF network model. GitHub. GPL-3.0.https://github.com/elifesciences-publications/EEG_proxy_from_network_point_neurons/
Trakoshis et al. eLife 2020;9:e55684. DOI: https://doi.org/10.7554/eLife.55684 30 of 31
Research article Neuroscience Medicine

Uddin LQ, Menon V. 2009. The anterior insula in autism: under-connected and under-examined. Neuroscience &Biobehavioral Reviews 33:1198–1203. DOI: https://doi.org/10.1016/j.neubiorev.2009.06.002, PMID: 19538989
Velmeshev D, Schirmer L, Jung D, Haeussler M, Perez Y, Mayer S, Bhaduri A, Goyal N, Rowitch DH, KriegsteinAR. 2019. Single-cell genomics identifies cell type-specific molecular changes in autism. Science 364:685–689.DOI: https://doi.org/10.1126/science.aav8130, PMID: 31097668
Viswanathan A, Freeman RD. 2007. Neurometabolic coupling in cerebral cortex reflects synaptic more thanspiking activity. Nature Neuroscience 10:1308–1312. DOI: https://doi.org/10.1038/nn1977, PMID: 17828254
Voytek B, Kramer MA, Case J, Lepage KQ, Tempesta ZR, Knight RT, Gazzaley A. 2015. Age-Related changes in1/f neural electrophysiological noise. Journal of Neuroscience 35:13257–13265. DOI: https://doi.org/10.1523/JNEUROSCI.2332-14.2015, PMID: 26400953
Watanabe T, Rees G, Masuda N. 2019. Atypical intrinsic neural timescale in autism. eLife 8:e42256. DOI: https://doi.org/10.7554/eLife.42256, PMID: 30717827
Werling DM. 2016. The role of sex-differential biology in risk for autism spectrum disorder. Biology of SexDifferences 7:58. DOI: https://doi.org/10.1186/s13293-016-0112-8, PMID: 27891212
Whittingstall K, Logothetis NK. 2009. Frequency-band coupling in surface EEG reflects spiking activity inmonkey visual cortex. Neuron 64:281–289. DOI: https://doi.org/10.1016/j.neuron.2009.08.016, PMID: 19874794
Wijeakumar S, Ambrose JP, Spencer JP, Curtu R. 2017. Model-based functional neuroimaging using dynamicneural fields: an integrative cognitive neuroscience approach. Journal of Mathematical Psychology 76:212–235.DOI: https://doi.org/10.1016/j.jmp.2016.11.002, PMID: 29118459
Willsey AJ, Sanders SJ, Li M, Dong S, Tebbenkamp AT, Muhle RA, Reilly SK, Lin L, Fertuzinhos S, Miller JA,Murtha MT, Bichsel C, Niu W, Cotney J, Ercan-Sencicek AG, Gockley J, Gupta AR, Han W, He X, Hoffman EJ,et al. 2013. Coexpression networks implicate human midfetal deep cortical projection neurons in thepathogenesis of autism. Cell 155:997–1007. DOI: https://doi.org/10.1016/j.cell.2013.10.020, PMID: 24267886
Wink AM, Bernard F, Salvador R, Bullmore E, Suckling J. 2006. Age and cholinergic effects on hemodynamicsand functional coherence of human Hippocampus. Neurobiology of Aging 27:1395–1404. DOI: https://doi.org/10.1016/j.neurobiolaging.2005.08.011, PMID: 16202481
Yeo BT, Krienen FM, Sepulcre J, Sabuncu MR, Lashkari D, Hollinshead M, Roffman JL, Smoller JW, Zollei L,Polimeni JR, Fischl B, Liu H, Buckner RL. 2011. The organization of the human cerebral cortex estimated byintrinsic functional connectivity. Journal of Neurophysiology 106:1125–1165. DOI: https://doi.org/10.1152/jn.00338.2011, PMID: 21653723
Yizhar O, Fenno LE, Prigge M, Schneider F, Davidson TJ, O’Shea DJ, Sohal VS, Goshen I, Finkelstein J, Paz JT,Stehfest K, Fudim R, Ramakrishnan C, Huguenard JR, Hegemann P, Deisseroth K. 2011. Neocortical excitation/inhibition balance in information processing and social dysfunction. Nature 477:171–178. DOI: https://doi.org/10.1038/nature10360, PMID: 21796121
Zou QH, Zhu CZ, Yang Y, Zuo XN, Long XY, Cao QJ, Wang YF, Zang YF. 2008. An improved approach todetection of amplitude of low-frequency fluctuation (ALFF) for resting-state fMRI: fractional ALFF. Journal ofNeuroscience Methods 172:137–141. DOI: https://doi.org/10.1016/j.jneumeth.2008.04.012, PMID: 18501969
Zucca S, Pasquale V, Lagomarsino de Leon Roig P, Panzeri S, Fellin T. 2019. Thalamic drive of corticalParvalbumin-Positive interneurons during down states in anesthetized mice. Current Biology 29:1481–1490.DOI: https://doi.org/10.1016/j.cub.2019.04.007, PMID: 31031117
Trakoshis et al. eLife 2020;9:e55684. DOI: https://doi.org/10.7554/eLife.55684 31 of 31
Research article Neuroscience Medicine