
Intrıduction of Gear design
88
NREL is a national laboratory of the U.S. Department of Energy, Office of Energy Efficiency & Renewable Energy, operated by the Alliance for Sustainable Energy, LLC. Contract No. DE-AC36-08GO28308 Gearbox Reliability Collaborative Project Report: Findings from Phase 1 and Phase 2 Testing H. Link, W. LaCava, J. van Dam, B. McNiff, S. Sheng, R. Wallen, M. McDade, S. Lambert, S. Butterfield, and F. Oyague Technical Report NREL/TP-5000-51885 June 2011
-
Upload
oddomancan -
Category
Documents
-
view
14 -
download
0
description
Gear aspect ratio compact ratio gear train
Transcript of Intrıduction of Gear design
NREL is a national laboratory of the U.S. Department of Energy, Office of Energy Efficiency & Renewable Energy, operated by the Alliance for Sustainable Energy, LLC.
Contract No. DE-AC36-08GO28308
Gearbox Reliability Collaborative Project Report: Findings from Phase 1 and Phase 2 Testing H. Link, W. LaCava, J. van Dam, B. McNiff, S. Sheng, R. Wallen, M. McDade, S. Lambert, S. Butterfield, and F. Oyague
Technical Report NREL/TP-5000-51885 June 2011
NREL is a national laboratory of the U.S. Department of Energy, Office of Energy Efficiency & Renewable Energy, operated by the Alliance for Sustainable Energy, LLC.
National Renewable Energy Laboratory 1617 Cole Boulevard Golden, Colorado 80401 303-275-3000 • www.nrel.gov
Contract No. DE-AC36-08GO28308
Gearbox Reliability Collaborative Project Report: Findings from Phase 1 and Phase 2 Testing H. Link, W. LaCava, J. van Dam, B. McNiff, S. Sheng, R. Wallen, M. McDade, S. Lambert, S. Butterfield, and F. Oyague
Prepared under Task No. WE110301
Technical Report NREL/TP-5000-51885 June 2011

NOTICE
This report was prepared as an account of work sponsored by an agency of the United States government. Neither the United States government nor any agency thereof, nor any of their employees, makes any warranty, express or implied, or assumes any legal liability or responsibility for the accuracy, completeness, or usefulness of any information, apparatus, product, or process disclosed, or represents that its use would not infringe privately owned rights. Reference herein to any specific commercial product, process, or service by trade name, trademark, manufacturer, or otherwise does not necessarily constitute or imply its endorsement, recommendation, or favoring by the United States government or any agency thereof. The views and opinions of authors expressed herein do not necessarily state or reflect those of the United States government or any agency thereof.
Available electronically at http://www.osti.gov/bridge
Available for a processing fee to U.S. Department of Energy and its contractors, in paper, from:
U.S. Department of Energy Office of Scientific and Technical Information P.O. Box 62 Oak Ridge, TN 37831-0062 phone: 865.576.8401 fax: 865.576.5728 email: mailto:[email protected]
Available for sale to the public, in paper, from:
U.S. Department of Commerce National Technical Information Service 5285 Port Royal Road Springfield, VA 22161 phone: 800.553.6847 fax: 703.605.6900 email: [email protected] online ordering: http://www.ntis.gov/help/ordermethods.aspx
Cover Photos: (left to right) PIX 16416, PIX 17423, PIX 16560, PIX 17613, PIX 17436, PIX 17721
Printed on paper containing at least 50% wastepaper, including 10% post consumer waste.

1
Acknowledgements
The National Renewable Energy Laboratory’s contributions to this report were funded by the Wind and Water Power Program, Office of Energy Efficiency and Renewable Energy of the U.S. Department of Energy under contract No. DE-AC02-05CH11231. The authors are solely responsible for any omission or errors contained herein. NREL wishes to acknowledge and thank the Office of Energy Efficiency and Renewable Energy and its staff who have supported this work from its inception. Specifically, NREL would like to thank Mark Higgins and Michael Derby for their support and guidance.
2
Table of Contents Acronym List ............................................................................................................................... 7 Introduction ................................................................................................................................. 9 GRC Project Description .......................................................................................................... 10
Overall GRC Project ............................................................................................................... 10 Establishing a Collaborative ................................................................................................... 11 Selection and Preparation of Gearboxes ............................................................................... 13 Testing ................................................................................................................................. 14 Modeling ................................................................................................................................. 15 Failure Database .................................................................................................................... 16 Condition Monitoring .............................................................................................................. 16
GRC Gearbox Redesign ........................................................................................................... 17 Gearbox Instrumentation ......................................................................................................... 20
Planet-Bearing Load Measurement ........................................................................................ 22 Ring Gear ............................................................................................................................... 22 Additional Dynamometer Sensors .......................................................................................... 24 Additional Field Sensors......................................................................................................... 24 Data Acquisition Signal Conditioning, Digitization, and Recording ........................................ 24
Field Testing .............................................................................................................................. 24 Test Turbine ........................................................................................................................... 25 Field Test #1, Torque and Vibration ....................................................................................... 25 Phase 1, Gearbox 1 Field Test ............................................................................................... 26
Dynamometer Testing .............................................................................................................. 27 Summarized Objectives ......................................................................................................... 27 Run-In ................................................................................................................................. 27 Phase 1 Dynamometer Testing .............................................................................................. 28 Phase 2 Dynamometer Testing .............................................................................................. 28 Phase 2 Dynamometer Testing on Gearbox 1 ....................................................................... 28 Dynamometer Test Preparations ........................................................................................... 29 Drivetrain Assembly ............................................................................................................... 29 Dynamometer Control ............................................................................................................ 29 Development of Non-Torque Loading (NTL) Capability ......................................................... 30 Importance of Non-Torque Loading ....................................................................................... 31 Static NTL System.................................................................................................................. 31 Non-Torque Loading Control .................................................................................................. 34 Resolution of Unexpected Non-Torque Loading Influence ..................................................... 34 Phase 1 Gearbox 1 Dyno Testing .......................................................................................... 35 Assembly and Integration of the Test Turbine ........................................................................ 35 Installation and Checkout of GRC Data Acquisition System .................................................. 35 Static Non-Torque Loading with the Building Crane .............................................................. 36 Drivetrain Wind-up Test .......................................................................................................... 36 Gearbox 1 Run-in ................................................................................................................... 36 Phase 1 Gearbox 2 Dyno Testing .......................................................................................... 36 Data Acquisition System Installation and Checkout ............................................................... 36 Gearbox 2 Run-in ................................................................................................................... 36 Static Non-Torque Loading .................................................................................................... 36 Phase 2 Gearbox 2 Dyno Testing .......................................................................................... 36 Additional Instrumentation ...................................................................................................... 36 Enhanced Wind-up Test ......................................................................................................... 37
3
Generator Misalignment Test ................................................................................................. 37 Dynamic Non-Torque Loading System Integration and Commissioning ................................ 37 Static and Cyclic Thrust Testing ............................................................................................. 37 Repeat of Static Non-Torque Load Case with Dynamic Non-Torque System ........................ 37 Expanded Non-Torque Load Cases ....................................................................................... 37 Torque Time Series Reproduction ......................................................................................... 37 Non-Torque Load Reproduction ............................................................................................. 38 No Load Speed Oscillations ................................................................................................... 38 Carrier Barring Clearance Removal ....................................................................................... 38 Fixing the Trunnion Blocks ..................................................................................................... 38 Phase 2 Gearbox 1 Dyno Testing .......................................................................................... 38 GRC Vibration CM System ..................................................................................................... 38 No Load, Torque Only, and Torque with Non-Torque Testing ............................................... 38
Other Testing ............................................................................................................................. 38 Bearing Load Calibration ........................................................................................................ 38 Static Dynamometer Modal Test ............................................................................................ 40 Elastomeric Trunnion Characterization .................................................................................. 40
Modeling .................................................................................................................................... 41 Initial Modeling Approach and Model Creation ....................................................................... 41 GRC Modeling Team .............................................................................................................. 42 Round Robin 1: Model-to-Model Comparison ........................................................................ 42 Round Robin 2: Main Shaft Bending Comparison .................................................................. 44 Round Robin 3: Trunnion Elastomeric Modeling .................................................................... 44 Round Robin 4: Ring Gear Load Distribution ......................................................................... 46 Round Robin 5: Carrier Rim Deflection .................................................................................. 48 External Modeling Efforts ....................................................................................................... 49 Romax ................................................................................................................................. 49 SKF ................................................................................................................................. 50 Future Work............................................................................................................................ 50
Failure Database ....................................................................................................................... 50 Overall Project Development.................................................................................................. 50 Software Development ........................................................................................................... 50 Current Results ...................................................................................................................... 52 Future Work............................................................................................................................ 53 Conclusions ............................................................................................................................ 55
Condition Monitoring ................................................................................................................ 55 Testing ................................................................................................................................. 55 Workshop ............................................................................................................................... 57 Round Robin Project .............................................................................................................. 57
Findings ..................................................................................................................................... 58 Gearbox Run-in Procedure .................................................................................................... 58 Need to Tune Turbine Controllers to Prevent Torque Spikes ................................................ 59 Effect of Main Shaft Bending Moments on Gearbox .............................................................. 60 Effect of Main Shaft Thrust Loads on Gearbox ...................................................................... 61 Planet-Bearing Load Share .................................................................................................... 61 Verifying the External Measurement of Ring Gear Strain Distribution ................................... 63 Influence of Assembly Error on Gearbox Performance .......................................................... 64 Improved Instrumentation....................................................................................................... 65 Failure Database Development .............................................................................................. 65 CM Findings ........................................................................................................................... 66 Gearbox 1 Failure Analysis .................................................................................................... 66

4
Failure Findings ...................................................................................................................... 66 Importance of Model Flexibility ............................................................................................... 68 Reproduction of Field Bending and Torque in Dynamometer ................................................ 69
GRC Recommendations for Future Work ............................................................................... 71 References ................................................................................................................................. 74 Appendix A – GRC Partners .................................................................................................... 79 Appendix B – Excerpt from Failure Database Input from Gearbox #1 ................................. 80
5
List of Figures Figure 1. Gearbox design/operation life cycle ............................................................................. 11 Figure 2. The GRC gearbox has a low-speed planetary stage and two parallel stages. ............ 13 Figure 3. The GRC three-point suspension drivetrain, typical in wind industry........................... 17 Figure 4. Exploded view of the GRC gearbox ............................................................................. 18 Figure 5. GRC gearbox layout and bearing nomenclature. ........................................................ 18 Figure 6. Gauges in machined slots in planet-bearing inner rings .............................................. 22 Figure 7. Ring gear load distribution measurement setup and planet labels. ............................. 23 Figure 8. Strain gages on exterior of ring gear on GRC gearbox (NREL PIX/19221) ................. 23 Figure 9. Xcel Energy's Ponnequin wind farm in northern Colorado (NREL PIX/19258) ............ 24 Figure 10. Aerial view of the Ponnequin wind farm. The test turbines #29 and #12 are indicated (Source: Google maps) ............................................................................................................... 25 Figure 11. Highest measure torque event from first Ponnequin test campaign .......................... 26 Figure 12. GRC gearbox installation in Ponnequin (NREL PIX/19257) ...................................... 27 Figure 13. Schematic of NREL 2.5-MW dynamometer test facility and control block diagram .. 28 Figure 14. Asynchronous generator control mode ...................................................................... 30 Figure 15. NREL 2.5-MW dynamometer, original NTL configuration shown highlighted in red .. 31 Figure 16. GRC static non-torque loading arrangement (NREL PIX/19222) .............................. 32 Figure 17. Upwind view of test article and dynamic non-torque loading system components (thrust frame hidden) ................................................................................................................... 33 Figure 18. Side view of NTL system showing thrust components .............................................. 33 Figure 19. Dynamic non-torque loading control system block diagram ...................................... 34 Figure 20. To achieve the desired main shaft bending condition, flexible coupling reaction forces needed to be taken into account in testing and modeling with a tare load ................................. 35 Figure 21. Example groove locations used to measure planet-bearing loads ............................ 39 Figure 22. Bearing calibration fixture mounted in the NREL load frame (NREL PIX/19256) ...................................................................................................................... 40 Figure 23. Temperature and load characterization of rubber mount. Larger displacements are seen at low temperature because of separation of the rubber from its casing ........................... 41 Figure 24. Planetary stage multibody modeling .......................................................................... 41 Figure 25. Torque distribution in gearbox shafts. ........................................................................ 43 Figure 26. Stiffness of the ring-planet gear mesh ....................................................................... 43 Figure 27. Directional loading of a planet-sun gear contact ........................................................ 43 Figure 28. Comparison of model results of main shaft displacement at 100% rated torque relative to drivetrain at rest (A through F represent modeling partners) ..................................... 44 Figure 29. Torque arm trunnion configuration and cutaway showing rubber element ................ 45 Figure 30. Dynamometer test setup showing trunnion LVDT proximity sensor (NREL PIX/19259) ...................................................................................................................... 45 Figure 31. Trunnion radial stiffness model results ...................................................................... 46 Figure 32. Ring gear load distribution for 100% torque dynamometer testing ............................ 47 Figure 33. Ring gear load distribution test and modeling results for 0 (top), 120 (left), and 240 (right) (A and B represent the results of two modeling partners). ............................................... 48 Figure 34. Peak contact stress values for GRC gearbox bearings with varying values of pitch moment. (This Romax figure designates pitch axis as the “X-axis”). .......................................... 49 Figure 35. Example of a gearbox component tree (on left side) in database software (screenshot from GRC failure database) ........................................................................................................ 51 Figure 36. Selection of failure criteria in database software (Source: screenshot GRC failure database) .................................................................................................................................... 52 Figure 37. Examples from gear failure atlas (courtesy of GearTech) ......................................... 54 Figure 38. CM system setup in the Phase 2 dynamometer testing of Gearbox 2 ....................... 56 Figure 39. Measured damage equivalent loads per type of event .............................................. 60
6
Figure 40. Ring gear edge loading caused by non-torque loading ............................................. 61 Figure 41. Mean pin load distribution for rated torque field test for three planets pins A, B and C ....................................................................................................................................... 62 Figure 42. Planet load share versus main shaft rotation for three planets designated A, B and C ....................................................................................................................................... 62 Figure 43. Comparison external ring gear load distribution obtained through modeling and measurement on the outside of the gearbox housing ................................................................. 63 Figure 44. Effect of main shaft bending on the ring gear load centroid can be measured externally ..................................................................................................................................... 64 Figure 45. HS pinion scuffing most likely caused by lubricant starvation (Courtesy GEARTECH) .............................................................................................................. 67 Figure 46. Time series of field torque data reproduced in dynamometer dynamic testing.......... 69 Figure 47. FFT of field torque data reproduced in dynamometer dynamic testing...................... 69 Figure 48. Time series of field shaft bending reproduced in dynamic dynamometer testing ...... 70 Figure 49. Frequency content of field shaft bending reproduced in dynamic dynamometer testing ....................................................................................................................................... 70
List of Tables Table 1. GRC Testing ................................................................................................................. 14Table 2. Bearing Types ............................................................................................................... 19Table 3. Major modifications to the GRC gearboxes .................................................................. 19Table 4. Selection of Measurement Information ......................................................................... 21Table 5. Summary of Failure Database Incidents ....................................................................... 53Table 6. CM System Implementation at Different Stages of the GRC Tests .............................. 56Table 7. Suggested Future GRC Activities from 2011 General GRC Meeting ........................... 71
7
Acronym List Acronym Definition AE acoustic emission AGMA American Gear Manufacturers Association ANSI American National Standards Institute AWEA American Wind Energy Association CAD computer-aided design CBM condition-based maintenance CM condition monitoring COE cost of energy CRB cylindrical roller bearing DAS data acquisition system DGBB deep groove ball bearings DNV Det Norske Veritas DOE Department Of Energy DOF degree of freedom EP extreme pressure FAST Fatigue, Aerodynamics, Structures and Turbulence FAST_AD FAST aerodynamics fcCRB full complement cylindrical roller bearing FEA finite element analysis FFT fast fourier transform FORJ fiber optic rotary joint FY fiscal year GRC Gearbox Reliability Collaborative HS high speed HSS high-speed shaft INP input shaft IR inner raceway ISO International Organization for Standardization ISS intermediate-speed shaft LS low speed LSS low-speed shaft LVDT linear variable differential transformer MBS multi-body simulation NDA Nondisclosure Agreement NREL National Renewable Energy Laboratory NTL non-torque loading O&M operation and maintenance PEI Powertrain Engineers Inc. PL planet PLC Planet Load Carrier PLC programmable logic controller ProE Pro/Engineer

8
R&O rust and oxidation RPM revolutions per minute SRB spherical roller bearing TARRC Tun Abdul Razak Research Center TDC top dead center TRB tapered roller bearing
9
Introduction
Since its inception, the wind energy industry has experienced high gearbox failure rates (McNiff, B., 1990). Early wind turbine gearbox designs were fraught with problems: fundamental design errors, under-estimation of the operating loads, and poor integration into the system. The industry has learned from these problems over the past two decades, and wind turbine manufacturers, gear designers, bearing manufacturers, consultants, and lubrication engineers have been working together to improve load prediction, design, fabrication, and operation. This collaboration resulted in an internationally recognized wind turbine gearbox design standard (International Organization for Standardization 2005). Despite reasonable adherence to these accepted design practices, many wind turbine gearboxes do not achieve their design life goals of 20 years—most systems still require significant repair or overhaul well before the intended life is reached (Windpower Monthly 2005; Rasmussen, 2004; Tavner, 2006).
Because gearboxes are a relatively expensive component of the wind turbine system, the higher-than-expected failure rates are adding significantly to the cost of wind energy. In addition, the future uncertainty of gearbox life expectancy is contributing to wind turbine price escalation (Windpower Monthly 2005). Turbine manufacturers add contingencies to the sales price to cover the warranty risk that arises from the possibility of premature gearbox failures. In addition, owners and operators build contingency funds into the project financing and income expectations for problems that may show up after the warranty expires. To help bring the cost of wind energy back to a decreasing trajectory, the wind industry needs to demonstrate a significant increase in long-term gearbox reliability.
In response to design deficiencies, manufacturers continue to modify and redesign existing turbines. But it is difficult to validate the effectiveness of the modifications in a timely manner to ensure that multiple units with unsatisfactory “solutions” are not deployed. Presently, gear manufacturers introduce modifications to new models, replacing a deficient component with a re-engineered one that is intended to deliver improved reliability. To test these new designs, the re-engineered gearboxes are installed and a field evaluation process begins. This approach may eventually lead to the level of reliability that is needed, but the process is not efficient. It may take many years to develop the confidence required in a solution and to reduce uncertainty to a level where it will affect turbine costs. By that time, the industry may have moved to larger turbines or different drivetrain arrangements. Moreover, the industry may never understand the fundamental failure mechanisms of the original problem, making it easier for design unknowns to be inadvertently propagated into the next generation of machines.
It is useful to think of this product development cycle as consisting of a number of discrete steps that include activities beyond those normally considered part of the design process. These steps include initial design, computer modeling, component and system testing, model validation, manufacturing, operations and maintenance, and product improvement as shown in Figure 1. The Gearbox Reliability Collaborative (GRC) project was established to identify shortcomings and recommend improvements in this process—thereby contributing to an improvement in gearbox reliability. In contrast to most of the efforts by private entities in the wind energy industry, the GRC project shares its work with industry and research partners to expand its pool of expertise and facilitate immediate improvements in the gearbox life cycle. Ultimately, all findings will be made available to all members of the wind energy industry and to the public at large.
10
This is the first formal report to encompass the entire GRC program. It provides a description of the major objectives of the project, the activities that have been conducted to date, and, most significantly, a listing of findings that will help to improve wind turbine gearbox reliability. Finally, this report will recommend directions for future research in this area.
GRC Project Description
Overall GRC Project The roots of the GRC project reach back to 2004 when NREL hosted a Drive Train Workshop, at which experts discussed the need for improved reliability in drive trains, and, in particular, gearboxes. From this base, NREL submitted a proposal to DOE in 2005 for a Drive Train Supporting Research and Testing project. In Fiscal Year 2006, the DOE began funding the subtask, entitled Integrated Drivetrain Loads and Reliability, with the objective of “…developing integrated gearbox analytical tools that will bridge the gap between gearing/bearing designers and wind turbine designers.” The scope for what was to become the Gearbox Reliability Collaborative grew in subsequent years.
The GRC project has five major goals:
• Establish a collaborative of wind turbine manufacturers, gearbox designers, bearing experts, universities, consultants, national laboratories, and others to jointly investigate issues related to wind turbine gearbox reliability and to share results and findings.
• Design and conduct field and dynamometer tests using two redesigned and heavily instrumented wind turbine gearboxes to build an understanding of how selected loads and events translate into bearing and gear response.
• Evaluate and validate current wind turbine, gearbox, gear, and bearing analytical tools/models and develop new tools/models as required (in this report, this activity is referred to as “modeling” to distinguish from data “analysis” activities).
• Establish a database of gearbox failures.
• Investigate condition monitoring methods to improve reliability.
As previously mentioned, some aspects of the wind turbine, gearbox, and bearing design process are preventing gearboxes from reaching the expected design life. This deficiency could be the result of many factors, including the possibility that:
• One or more critical design-load cases were not accounted for in the design load spectrum.
• Current analytical tools used to model deflections, motions, and loadings of various gearbox parts or substructures are not accurate.
• Transfer of loads from the shaft (both primary torque loads and non-torque loads) and gearbox mounting to internal gearbox components is not predicted accurately.
• Gearbox components are not specified to deliver a single system-wide level of reliability
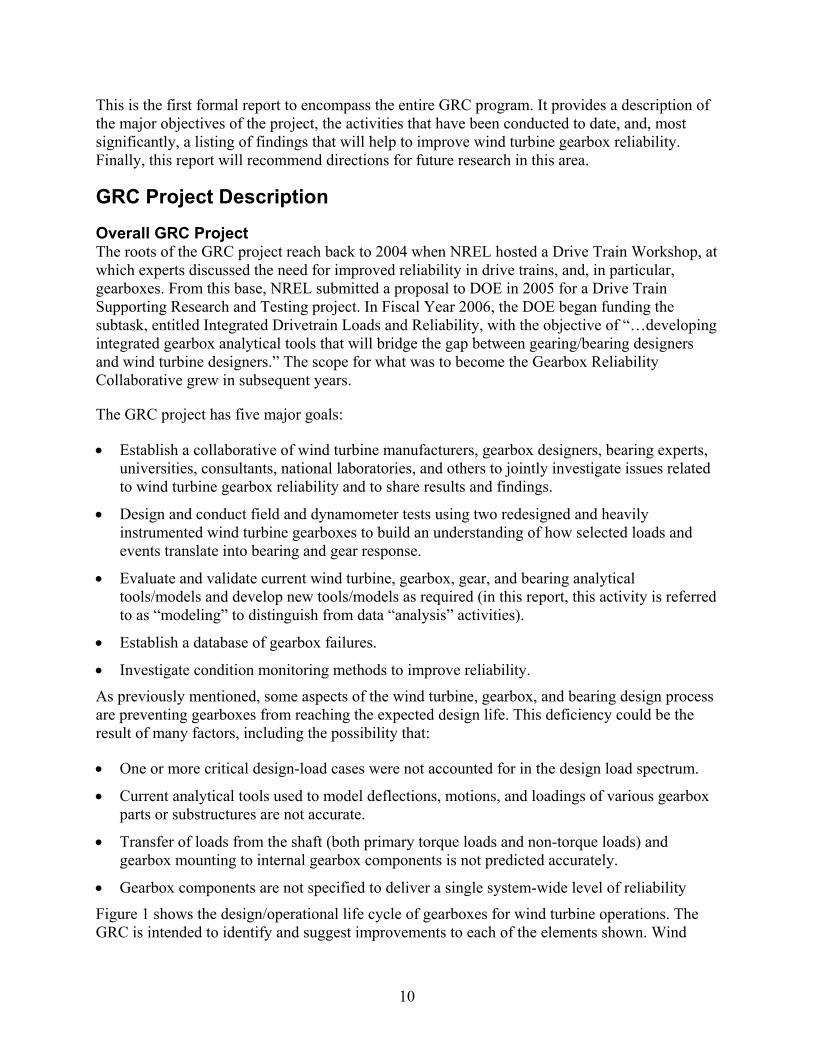
Figure 1 shows the design/operational life cycle of gearboxes for wind turbine operations. The GRC is intended to identify and suggest improvements to each of the elements shown. Wind
11
turbine and gearbox modeling addresses the design and manufacturing elements. Dynamometer and field testing address the element, validation testing. During field testing, we identified issues related to the element, operation and maintenance, and this element is also addressed by the condition-monitoring efforts. The field test also serves as a validation of design tools and design loads, and may indicate load cases that may have been missed in the design. The dynamometer test provides testing under controlled conditions, and can thus be used to validate design tools, validate design assumptions, and indicate whether changes in control actions are needed. It can also be used to quickly determine relative behavior of gearboxes assembled with different tolerances or configuration changes. The failure database identifies problems that occur in all of the life-cycle elements. As a unified project, the GRC provides an environment for cross pollination of these separate activities to help identify the gaps that can affect gearbox reliability.
Figure 1. Gearbox design/operation life cycle
Establishing a Collaborative Many of the gearbox problems described above may be the direct result of institutional barriers that hinder communication and feedback during the design, operation, and maintenance of turbines. In isolation, it is very difficult for single entities in the supply chain to find proper solutions. Hence, a collaborative is needed to bring together the various groups involved in the process and to share information needed to address the problems. This is one of the more challenging parts of this project, as information sharing introduces perceived risk to the protection of intellectual property. A goal of this project is to establish this cooperative framework while protecting the intellectual property rights of all parties. These concerns are addressed through legal agreements with NREL and are further mitigated since the project focuses on a common drivetrain configuration. NREL staff and expert consultants hired by NREL operate the collaborative to guarantee privacy of commercially sensitive information.
In addition, a goal of the collaborative is to engage key representatives within the supply chain, including turbine owners, operators, gearbox manufacturers, bearing manufacturers, lubrication companies, and wind turbine manufacturers. Each party holds information and experience that is needed to guide the project, supply the components, and interpret results of the activities. The collaborative partners benefit by having input throughout the project and will have access to data within the agreements established by the cooperative. Partners are not permitted to share data directly with others or publish any analysis or results independently without permission from NREL. Results will be released by the GRC as agreed upon by its members.
12
GRC membership has evolved during the life of the project. Earliest contributors included:
• XCEL Energy: Marty Block and Kenneth Bolin
• Caithness Energy: Tim Curley and Dean Landon
• Consultants: Brian McNiff (McNiff Light Industry), Steve Gilkes (Garrad Hassan), Rainer Eckert (Northwest Laboratories)
• Moventas: Jukka-Pekka Vesala and Mikko Jarvinen
• Gearbox experts: Edwin Hahlbeck, Robert Errichello, Raymond Drago, and Donald McVittie
• Bearing experts: Larry Mumper and Daniel Dorcaster (SKF) and Ted Harris (Harris Consulting)
• National labs: Roger Hill (Sandia National Laboratories [Sandia]), Sandy Butterfield, Walt Musial, Hal Link, Jim Johnson (NREL)
Since that time, membership has grown to 45 organizations. Appendix A lists all members who wish to be acknowledged in this report. In addition, other members have chosen to participate in the project but have requested to do so anonymously.
The project has maintained frequent communication with members and the industry. Annual general meetings and workshops organized through the GRC project are listed below. Publications resulting from GRC research activities are listed in the references section.
At general meetings, participants present results and findings that are of interest to the entire group during the first day and a half. On the second day, break-out sessions are held for testing, condition monitoring, and failure database groups. On the third day an independent session is held to discuss modeling activities. One of the activities is for participants to suggest future work in the GRC project.
General Meetings
• Jan 2007 Gearbox Reliability Collaboration Kickoff Meeting
• Jan 2009 First GRC General Meeting
• Feb 2010 Second GRC General Meeting
• Feb 2011 Third GRC General Meeting
Workshops
• Drive Train Workshop—September 2004
• Gearbox Reliability Workshop—July 2006
• Gear Design Course - Raymond Drago—October 2006
• Bearing Workshop – Ted Harris—December 2007
• IEA Gearbox Experts Meeting—September 2008

13
• Micropitting Workshop—April 2009
• European Dynamometer Operator Meetings—December 2009
Selection and Preparation of Gearboxes GRC participants selected a gearbox that was representative of the common gearbox in service in 2006. This gearbox fits in a 3-point suspension drive train configuration with supports at the main bearing and gearbox mounting trunnions (Figure 2). A 750-kW rating was desirable because it is large enough to represent common wind turbines currently in use and yet small enough that it would be reasonably inexpensive to procure, modify, and test in the NREL 2.5-MW dynamometer. The preparation included modifications intended to:
• Eliminate any design shortcomings identified during the project to be associated with the original design and manufacture
• Update to current design practices
• Accommodate instrumentation.
Two gearboxes from the same manufacturer were removed from the field after about 40,000 hours of operation with sufficient damage to require a rebuild. These were carefully disassembled and inspected for damage by Don McVittie of Gear Engineers, Inc. and Robert
Errichello of GEARTECH. Results from these inspections influenced the selection of redesign features.
Powertrain Engineers Inc. (PEI) with input and review by Gear Engineers Inc. and GEARTECH designed the gearbox modifications. The following major changes were made to the original design:
1. Floating sun
2. Cylindrical roller planet bearings
3. Tapered roller bearings in parallel stages
4. Microgeometry
5. Jet-lubrication
6. Kidney filtration loop and desiccant breather
PEI developed a complete set of drawings and remanufacturing details along with a solid model in Pro/Engineer (ProE) format. They provided this information to NREL for use by the testing and modeling teams.
A significant part of gearbox preparation was design and installation of a large number of sensors. The design of the gearbox instrumentation system is described in the Gearbox Instrumentation section.
Figure 2. The GRC gearbox has a low-speed planetary stage and two parallel stages.
14
Two gearboxes were remanufactured and assembled by The Gearworks, Inc. NREL, McNiff Light Industry, and staff from Det Norske Veritas (DNV) Renewables installed instrumentation during the gearbox assembly at The Gearworks.
More detailed information about the gearbox configuration and modifications is described in the section called GRC Gearbox Redesign.
Testing At the core of the GRC program is an extensive dynamometer and field-testing program that is designed to serve three purposes related to gearbox reliability.
First, testing helps to verify drive train design assumptions. This includes predictions of loads and responses of the wind turbine system as a whole, the gearboxes, and all key subcomponents (e.g., gears, bearings, and structures). Models can be validated and refined by comparing measured to predicted responses. Field tests are appropriate to validate system models, and dynamometer tests are appropriate to validate gearbox, drivetrain, and control models. Once the models are validated, the design team can configure a wind turbine to be able to withstand the full spectrum of environmental conditions likely to occur during 20 years of operation. Many of these conditions—extreme wind speeds, for example—must be modeled because they are not likely to occur during a field test of 3 to 6 months.
Second, GRC testing is conducted to identify conditions in both field and dynamometer testing where unusual or unexpected gearbox behavior occurs.
A third objective of the GRC testing effort is to identify those aspects of dynamometer testing that do not accurately reproduce important gearbox responses observed in the field and to develop improved testing methods to reduce or eliminate these shortcomings. Two areas of improvement in dynamometer testing have so far been identified: the addition of non-torque shaft loads to the torque-only loads historically provided, and the enhancement of dynamic load application capabilities.
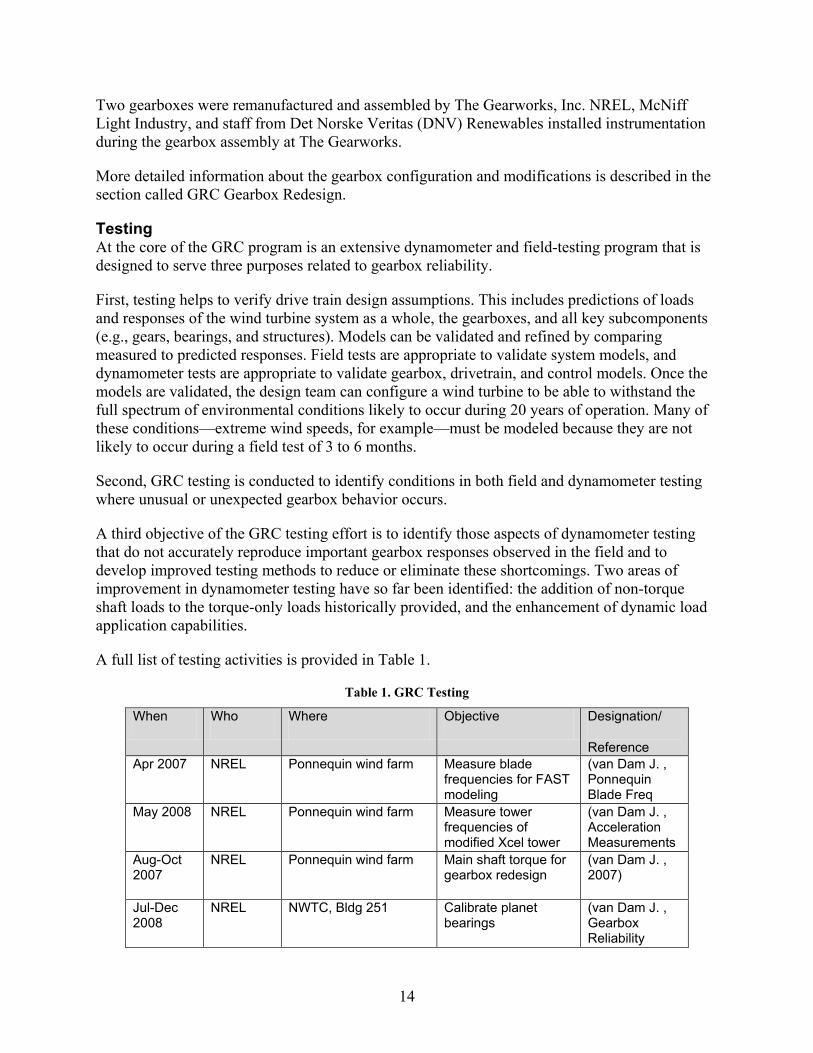
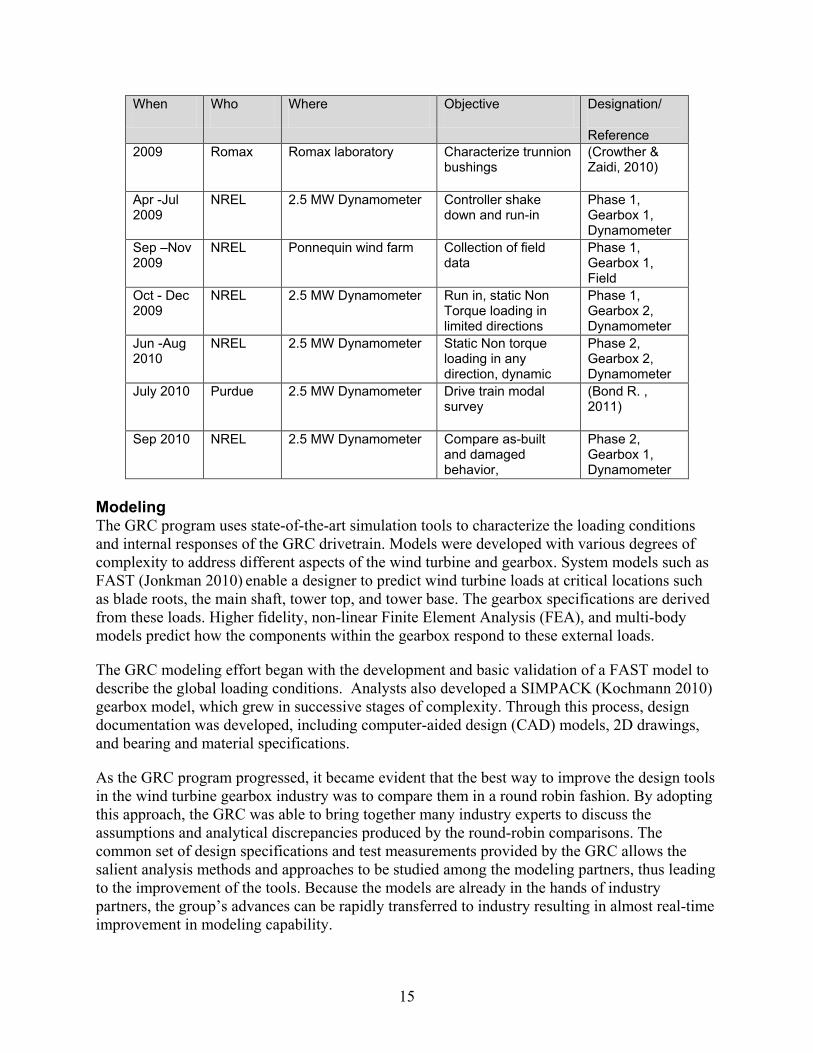
A full list of testing activities is provided in Table 1.
Table 1. GRC Testing
When Who Where Objective Designation/
Reference Apr 2007 NREL Ponnequin wind farm Measure blade
frequencies for FAST modeling
(van Dam J. , Ponnequin Blade Freq
May 2008 NREL Ponnequin wind farm Measure tower frequencies of modified Xcel tower
(van Dam J. , Acceleration Measurements
Aug-Oct 2007
NREL Ponnequin wind farm Main shaft torque for gearbox redesign
(van Dam J. , 2007)
Jul-Dec 2008
NREL NWTC, Bldg 251 Calibrate planet bearings
(van Dam J. , Gearbox Reliability
15
When Who Where Objective Designation/
Reference 2009 Romax Romax laboratory Characterize trunnion
bushings (Crowther & Zaidi, 2010)
Apr -Jul 2009
NREL 2.5 MW Dynamometer Controller shake down and run-in
Phase 1, Gearbox 1, Dynamometer
Sep –Nov 2009
NREL Ponnequin wind farm Collection of field data
Phase 1, Gearbox 1, Field
Oct - Dec 2009
NREL 2.5 MW Dynamometer Run in, static Non Torque loading in limited directions
Phase 1, Gearbox 2, Dynamometer
Jun -Aug 2010
NREL 2.5 MW Dynamometer Static Non torque loading in any direction, dynamic
Phase 2, Gearbox 2, Dynamometer
July 2010 Purdue 2.5 MW Dynamometer Drive train modal survey
(Bond R. , 2011)
Sep 2010 NREL 2.5 MW Dynamometer Compare as-built and damaged behavior,
Phase 2, Gearbox 1, Dynamometer
Modeling The GRC program uses state-of-the-art simulation tools to characterize the loading conditions and internal responses of the GRC drivetrain. Models were developed with various degrees of complexity to address different aspects of the wind turbine and gearbox. System models such as FAST (Jonkman 2010) enable a designer to predict wind turbine loads at critical locations such as blade roots, the main shaft, tower top, and tower base. The gearbox specifications are derived from these loads. Higher fidelity, non-linear Finite Element Analysis (FEA), and multi-body models predict how the components within the gearbox respond to these external loads.
The GRC modeling effort began with the development and basic validation of a FAST model to describe the global loading conditions. Analysts also developed a SIMPACK (Kochmann 2010) gearbox model, which grew in successive stages of complexity. Through this process, design documentation was developed, including computer-aided design (CAD) models, 2D drawings, and bearing and material specifications.
As the GRC program progressed, it became evident that the best way to improve the design tools in the wind turbine gearbox industry was to compare them in a round robin fashion. By adopting this approach, the GRC was able to bring together many industry experts to discuss the assumptions and analytical discrepancies produced by the round-robin comparisons. The common set of design specifications and test measurements provided by the GRC allows the salient analysis methods and approaches to be studied among the modeling partners, thus leading to the improvement of the tools. Because the models are already in the hands of industry partners, the group’s advances can be rapidly transferred to industry resulting in almost real-time improvement in modeling capability.
16
Since the inception of the modeling effort, five round-robin phases have been introduced. The first and most extensive was a baseline, code-to-code comparison of many gearbox parameters using simple load cases. The last four focused on a specific gearbox measurement and included a test data package release and subsequent model correlation effort. In summary, the five round-robin phases conducted include:
• Baseline model-to-model comparison
• Main shaft bending comparison
• Elastomeric trunnion response comparison
• Ring gear load distribution comparison
• Carrier deflection and deformation comparison.
The Modeling section describes the initial model creation and each round-robin effort in more detail.
Failure Database To provide real context for the GRC efforts, it is important to connect the testing and simulations to actual failures and suspected root causes of these observed failures. Due to the paucity of public domain failure statistics, the GRC developed and began to populate a database of gearbox damage and failures along with industry partners. GRC developed methodologies to categorize bearing and gear failures, and developed a software package to allow onsite or in-shop technicians to document and categorize gearbox failures. Wind farm operators and gearbox rebuilders have undergone training to use the software, and a collaborative effort is underway to improve and expand upon the software to make it as useful to GRC partners as possible.
Communications with all members have been maintained through monthly conference calls and break-out sessions during GRC general meetings. The project has attracted membership from approximately 17% of the total U.S. wind industry (on an installed capacity basis) since its inception in 2010, and a number of new memberships are currently being processed.
Establishing and populating the database will allow researchers to analyze bearing failure mechanisms, evaluate failure statistics, propose root causes that can be verified or tested, and propose methods and steps in the design process for avoiding the failures. A detailed description of the database effort is provided in the section called Failure Database.
Condition Monitoring When the GRC was started in 2007, and even now, wind plant owner/operators are primarily practicing reactive or time interval-based maintenance. A paradigm shift to condition-based maintenance (CBM), enabled by various condition monitoring (CM) techniques, can help wind plant owner/operators to reduce their operations and maintenance (O&M) cost, which is an important piece in the overall energy cost for wind power. The rationale for the GRC to conduct CM research is that it can capture the condition of individual turbines and supplement the main deliverable (i.e., improved gearbox design practices) from the GRC. Also, CM can help the industry achieve reduced turbine downtime and Cost of Energy (COE) by enabling better O&M practices, which is also in line with the GRC objectives. On the other hand, the GRC
17
dynamometer and field tests provide a great opportunity to investigate the strengths and limitations of different CM techniques and recommend CM practices to the industry.
Primarily, the CM system was implemented by working with several commercial equipment suppliers. It took an integrated approach because no single technique can provide the comprehensive and reliable solutions needed by the industry. Four CM techniques were initially applied: acoustic emission (AE) (specifically, stress wave); vibration; offline (or kidney loop) real-time lubricant CM; and offline oil sample analysis. As the GRC tests progressed, inline (or main loop) real-time lubricant CM and electric signature-based techniques were added. Data was collected from these CM instruments from different GRC tests. Findings obtained through the CM research have been reported at various conferences, workshops, journals (as presentations), papers, and NREL technical reports. As of May 2011, about 10 presentations, papers, or reports have been published.
Future work has been planned including data analysis, investigation of new sensing or monitoring techniques, and cost effective analysis. Findings will continue to be reported.
GRC Gearbox Redesign
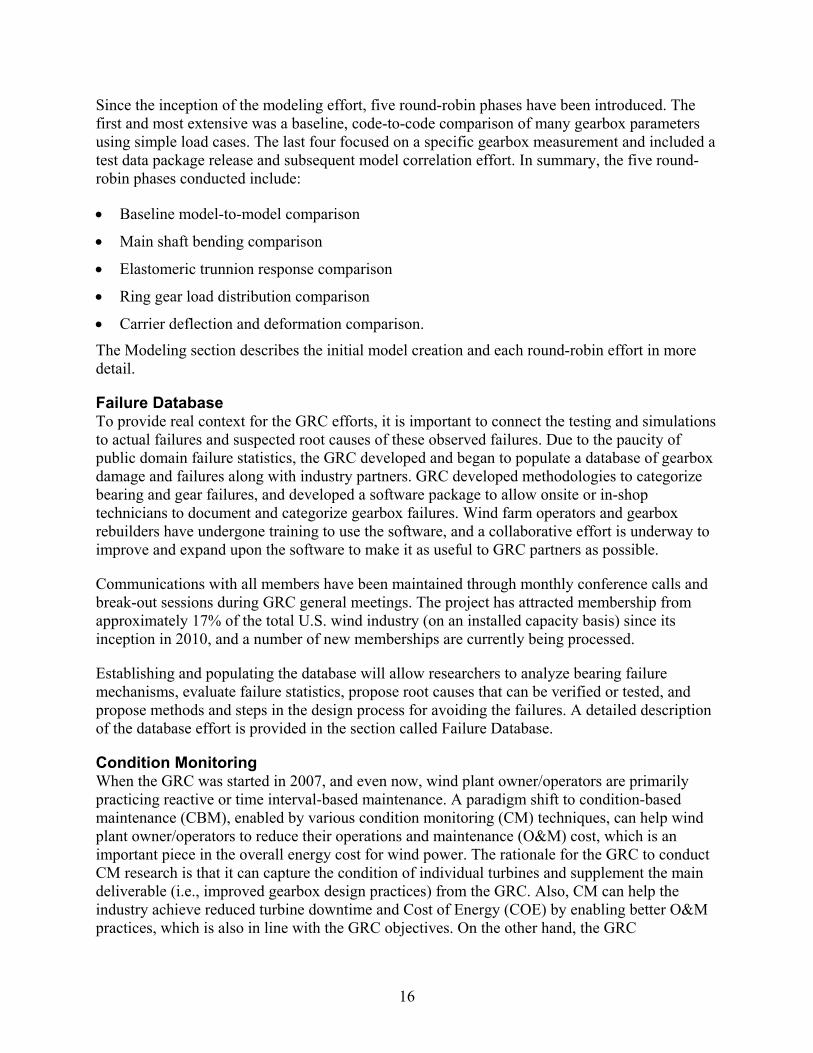
The selected gearbox is from a 3-point suspension drivetrain, which is a typical configuration for MW class turbines. The main shaft is supported by the main bearing, and two elastomeric trunnions at the torque arms, as shown in Figure 3.
Figure 3. The GRC three-point suspension drivetrain, typical in wind industry
The gearbox uses three stages to obtain an overall gear ratio of 1:81.491. It is composed of one low-speed planetary stage and two parallel shaft stages. The planetary stage accommodates three planet gears. The annulus gear of this stage also serves as part of the gearbox housing. The sun gear is set in a floating configuration; this improves the load distribution among the planets. To accommodate the floating sun arrangement, the low-speed shaft is hollow and has an internal
Hub Main
Bearing Main Shaft Gearbox Brake
Bed Plate/ Mainframe
Trunnion
Generator
Generator Shaft
18
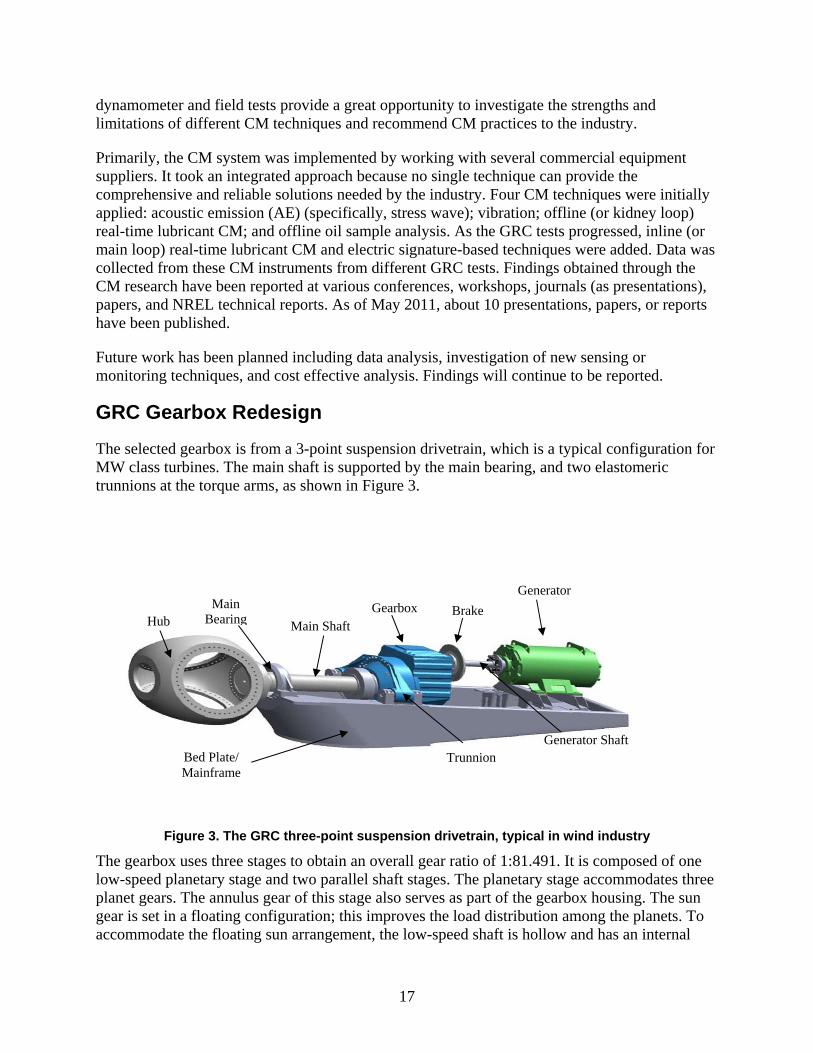
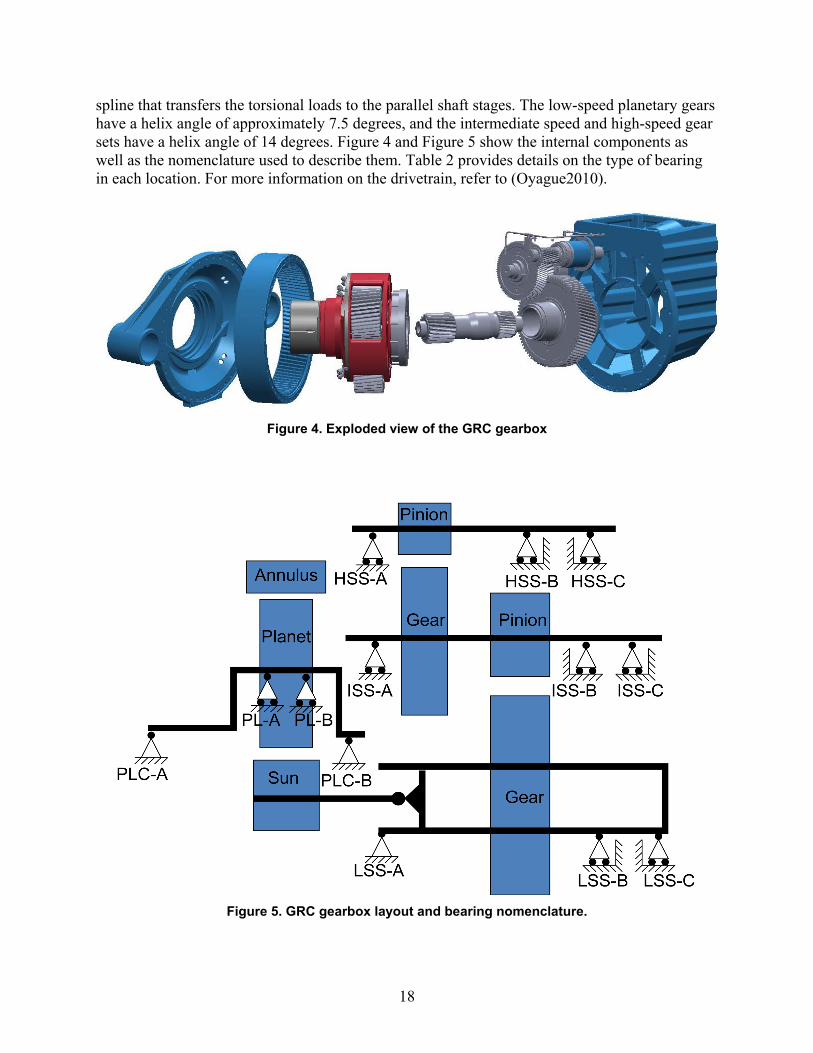
spline that transfers the torsional loads to the parallel shaft stages. The low-speed planetary gears have a helix angle of approximately 7.5 degrees, and the intermediate speed and high-speed gear sets have a helix angle of 14 degrees. Figure 4 and Figure 5 show the internal components as well as the nomenclature used to describe them. Table 2 provides details on the type of bearing in each location. For more information on the drivetrain, refer to (Oyague2010).
Figure 4. Exploded view of the GRC gearbox
Figure 5. GRC gearbox layout and bearing nomenclature.
19
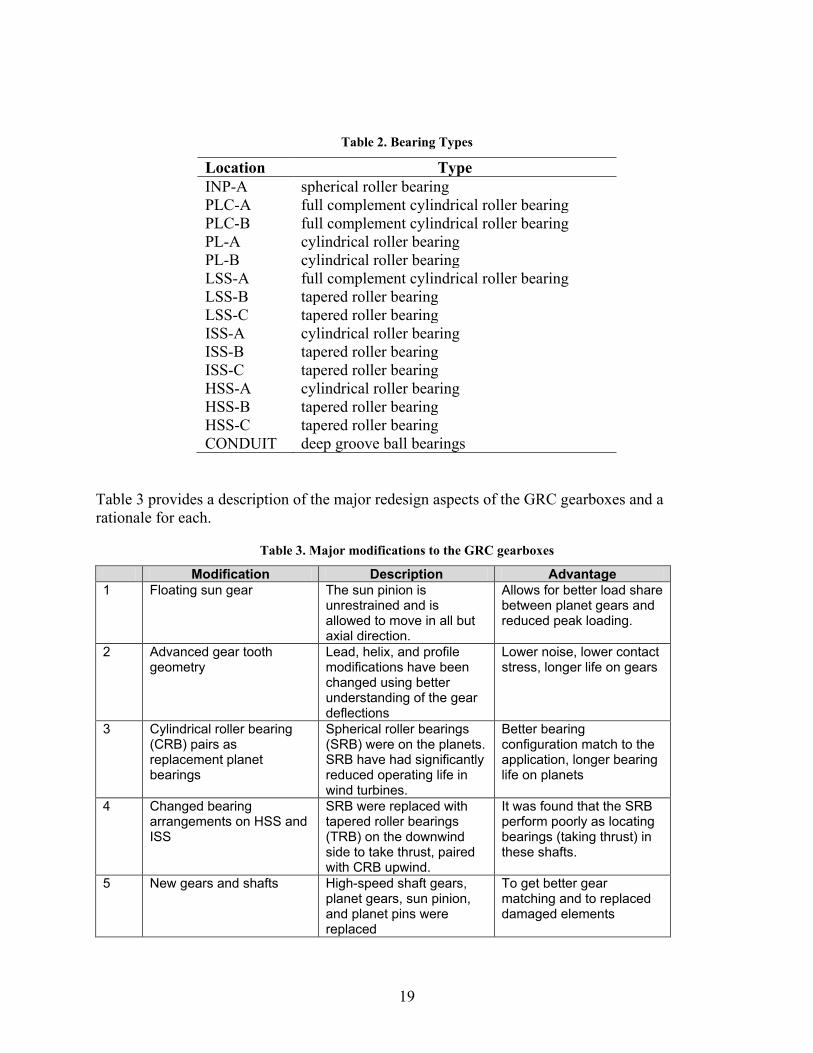
Table 2. Bearing Types
Location Type INP-A spherical roller bearing PLC-A full complement cylindrical roller bearing PLC-B full complement cylindrical roller bearing PL-A cylindrical roller bearing PL-B cylindrical roller bearing LSS-A full complement cylindrical roller bearing LSS-B tapered roller bearing LSS-C tapered roller bearing ISS-A cylindrical roller bearing ISS-B tapered roller bearing ISS-C tapered roller bearing HSS-A cylindrical roller bearing HSS-B tapered roller bearing HSS-C tapered roller bearing CONDUIT deep groove ball bearings
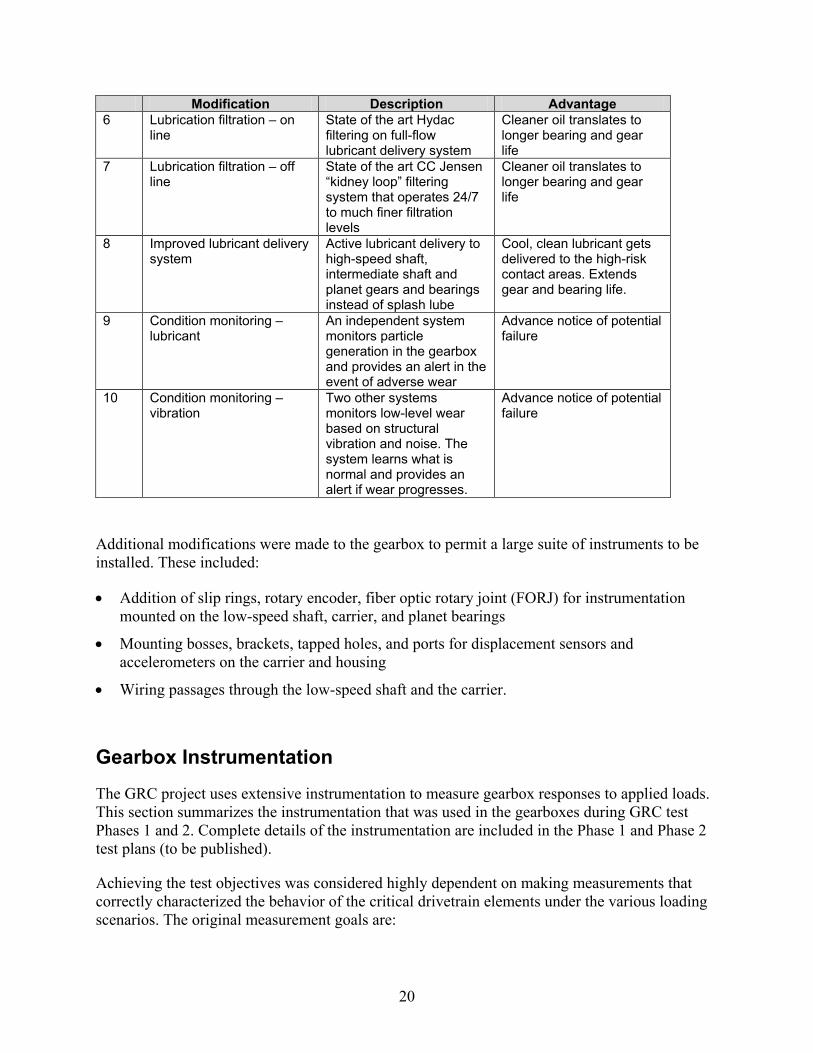
Table 3 provides a description of the major redesign aspects of the GRC gearboxes and a rationale for each.
Table 3. Major modifications to the GRC gearboxes
Modification Description Advantage 1 Floating sun gear The sun pinion is
unrestrained and is allowed to move in all but axial direction.
Allows for better load share between planet gears and reduced peak loading.
2 Advanced gear tooth geometry
Lead, helix, and profile modifications have been changed using better understanding of the gear deflections
Lower noise, lower contact stress, longer life on gears
3 Cylindrical roller bearing (CRB) pairs as replacement planet bearings
Spherical roller bearings (SRB) were on the planets. SRB have had significantly reduced operating life in wind turbines.
Better bearing configuration match to the application, longer bearing life on planets
4 Changed bearing arrangements on HSS and ISS
SRB were replaced with tapered roller bearings (TRB) on the downwind side to take thrust, paired with CRB upwind.
It was found that the SRB perform poorly as locating bearings (taking thrust) in these shafts.
5 New gears and shafts High-speed shaft gears, planet gears, sun pinion, and planet pins were replaced
To get better gear matching and to replaced damaged elements
20
Modification Description Advantage 6 Lubrication filtration – on
line State of the art Hydac filtering on full-flow lubricant delivery system
Cleaner oil translates to longer bearing and gear life
7 Lubrication filtration – off line
State of the art CC Jensen “kidney loop” filtering system that operates 24/7 to much finer filtration levels
Cleaner oil translates to longer bearing and gear life
8 Improved lubricant delivery system
Active lubricant delivery to high-speed shaft, intermediate shaft and planet gears and bearings instead of splash lube
Cool, clean lubricant gets delivered to the high-risk contact areas. Extends gear and bearing life.
9 Condition monitoring – lubricant
An independent system monitors particle generation in the gearbox and provides an alert in the event of adverse wear
Advance notice of potential failure
10 Condition monitoring – vibration
Two other systems monitors low-level wear based on structural vibration and noise. The system learns what is normal and provides an alert if wear progresses.
Advance notice of potential failure
Additional modifications were made to the gearbox to permit a large suite of instruments to be installed. These included:
• Addition of slip rings, rotary encoder, fiber optic rotary joint (FORJ) for instrumentation mounted on the low-speed shaft, carrier, and planet bearings
• Mounting bosses, brackets, tapped holes, and ports for displacement sensors and accelerometers on the carrier and housing
• Wiring passages through the low-speed shaft and the carrier.
Gearbox Instrumentation
The GRC project uses extensive instrumentation to measure gearbox responses to applied loads. This section summarizes the instrumentation that was used in the gearboxes during GRC test Phases 1 and 2. Complete details of the instrumentation are included in the Phase 1 and Phase 2 test plans (to be published).
Achieving the test objectives was considered highly dependent on making measurements that correctly characterized the behavior of the critical drivetrain elements under the various loading scenarios. The original measurement goals are:
21
• Relative displacement of planet carrier rim to gear housing
• LSS axial motion relative to gear housing
• Planet load share and annulus gear face width load distribution
• Main shaft azimuth angle to sync to bearing and gear strain gauges
• Planet bearing radial load distribution
• HSS axial displacement relative to gear housing
• HSS locating bearing axial load distribution
• Planet gear motion relative to carrier
• Sun pinion radial and axial motion
• Relative motion of gearbox to base frame
• Relative motion of LSS relative to base frame
• Relative motion of HSS relative to generator
• Planet bearing slip
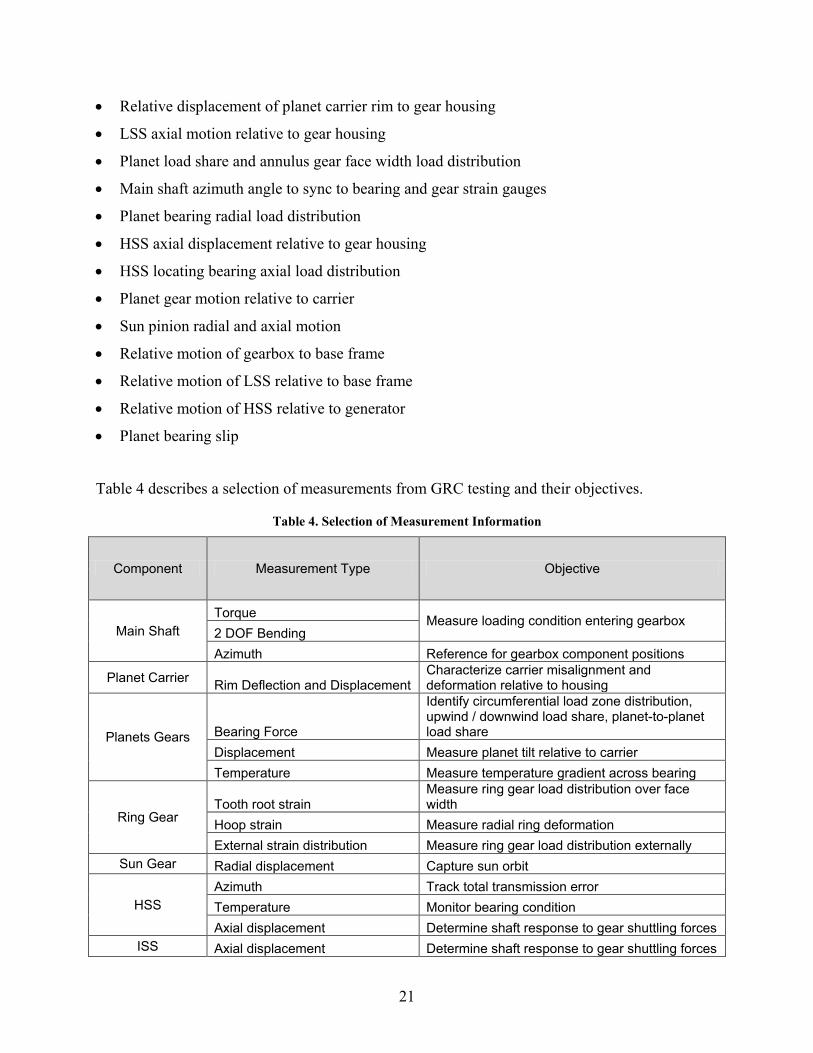
Table 4 describes a selection of measurements from GRC testing and their objectives.
Table 4. Selection of Measurement Information
Component Measurement Type Objective
Main Shaft Torque Measure loading condition entering gearbox 2 DOF Bending Azimuth Reference for gearbox component positions
Planet Carrier Rim Deflection and Displacement Characterize carrier misalignment and deformation relative to housing
Planets Gears Bearing Force
Identify circumferential load zone distribution, upwind / downwind load share, planet-to-planet load share
Displacement Measure planet tilt relative to carrier Temperature Measure temperature gradient across bearing
Ring Gear Tooth root strain
Measure ring gear load distribution over face width
Hoop strain Measure radial ring deformation External strain distribution Measure ring gear load distribution externally
Sun Gear Radial displacement Capture sun orbit
HSS Azimuth Track total transmission error Temperature Monitor bearing condition Axial displacement Determine shaft response to gear shuttling forces
ISS Axial displacement Determine shaft response to gear shuttling forces
22
Component Measurement Type Objective
Temperature Monitor bearing condition
Gearbox Housing
Displacement Characterize housing and trunnion response
Acceleration Measure response frequencies and resonances of component
Sump temperature Monitor oil behavior
Generator Displacement Capture dynamic misalignment of the generator / gearbox shafts
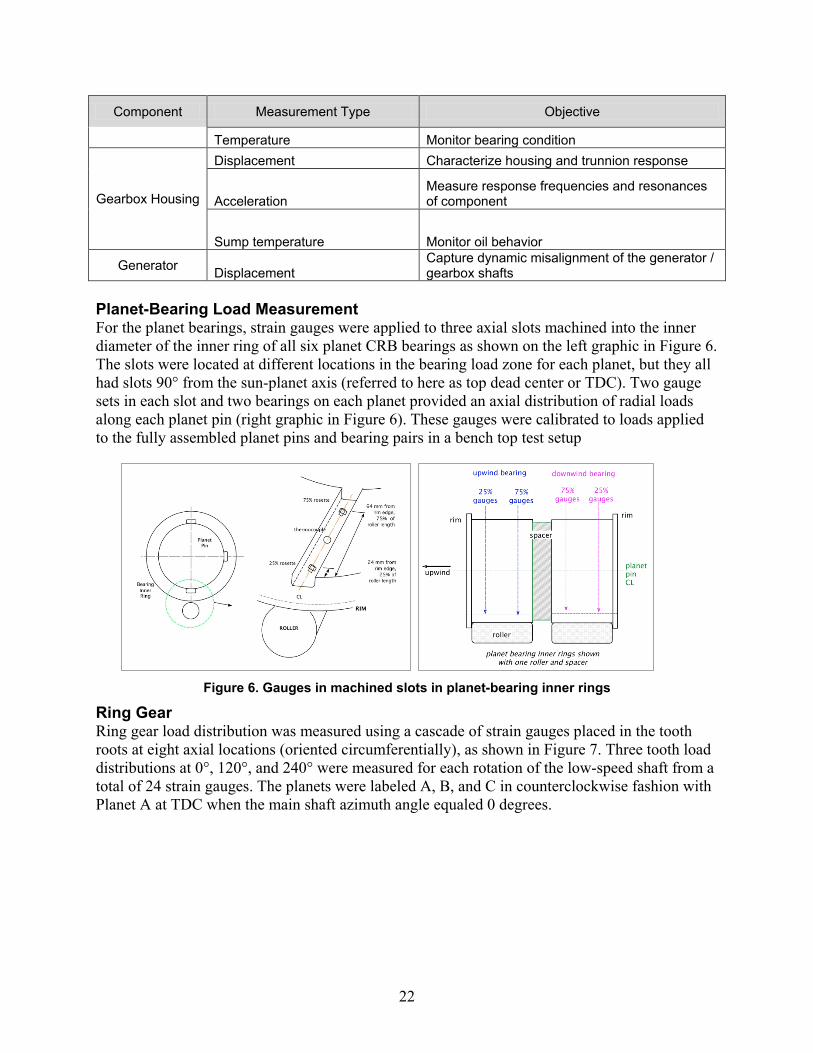
Planet-Bearing Load Measurement For the planet bearings, strain gauges were applied to three axial slots machined into the inner diameter of the inner ring of all six planet CRB bearings as shown on the left graphic in Figure 6. The slots were located at different locations in the bearing load zone for each planet, but they all had slots 90° from the sun-planet axis (referred to here as top dead center or TDC). Two gauge sets in each slot and two bearings on each planet provided an axial distribution of radial loads along each planet pin (right graphic in Figure 6). These gauges were calibrated to loads applied to the fully assembled planet pins and bearing pairs in a bench top test setup
Figure 6. Gauges in machined slots in planet-bearing inner rings
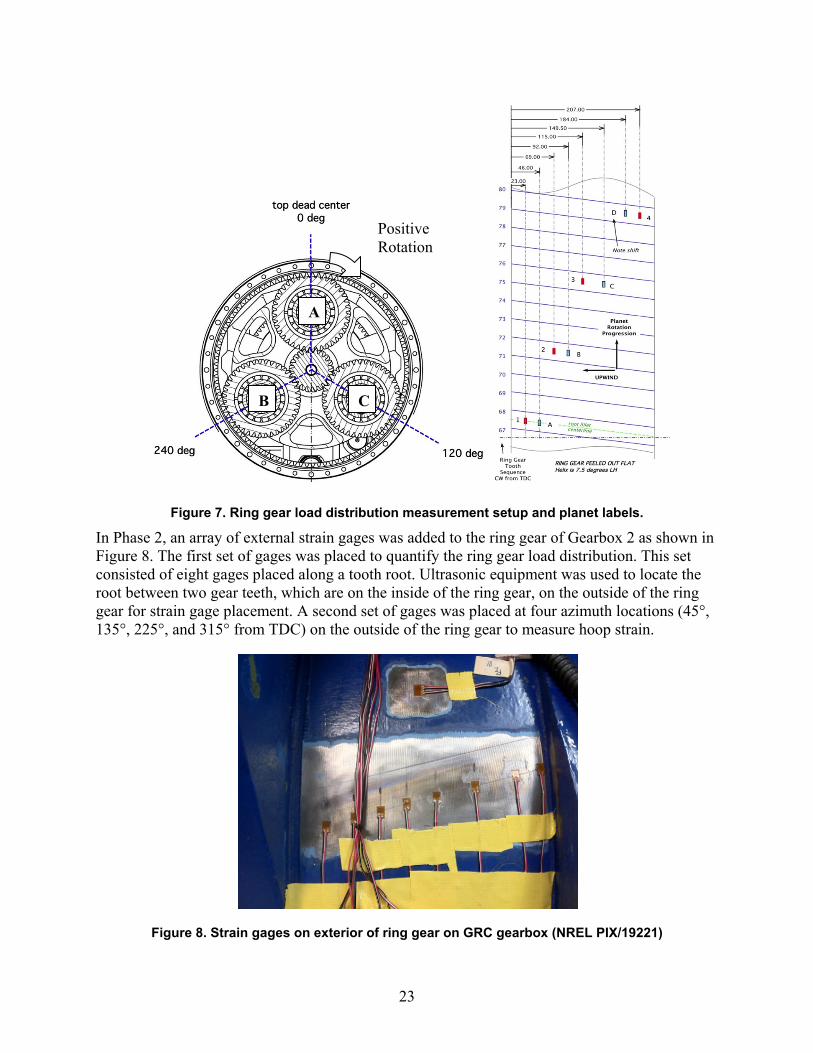
Ring Gear Ring gear load distribution was measured using a cascade of strain gauges placed in the tooth roots at eight axial locations (oriented circumferentially), as shown in Figure 7. Three tooth load distributions at 0°, 120°, and 240° were measured for each rotation of the low-speed shaft from a total of 24 strain gauges. The planets were labeled A, B, and C in counterclockwise fashion with Planet A at TDC when the main shaft azimuth angle equaled 0 degrees.
23
Figure 7. Ring gear load distribution measurement setup and planet labels.
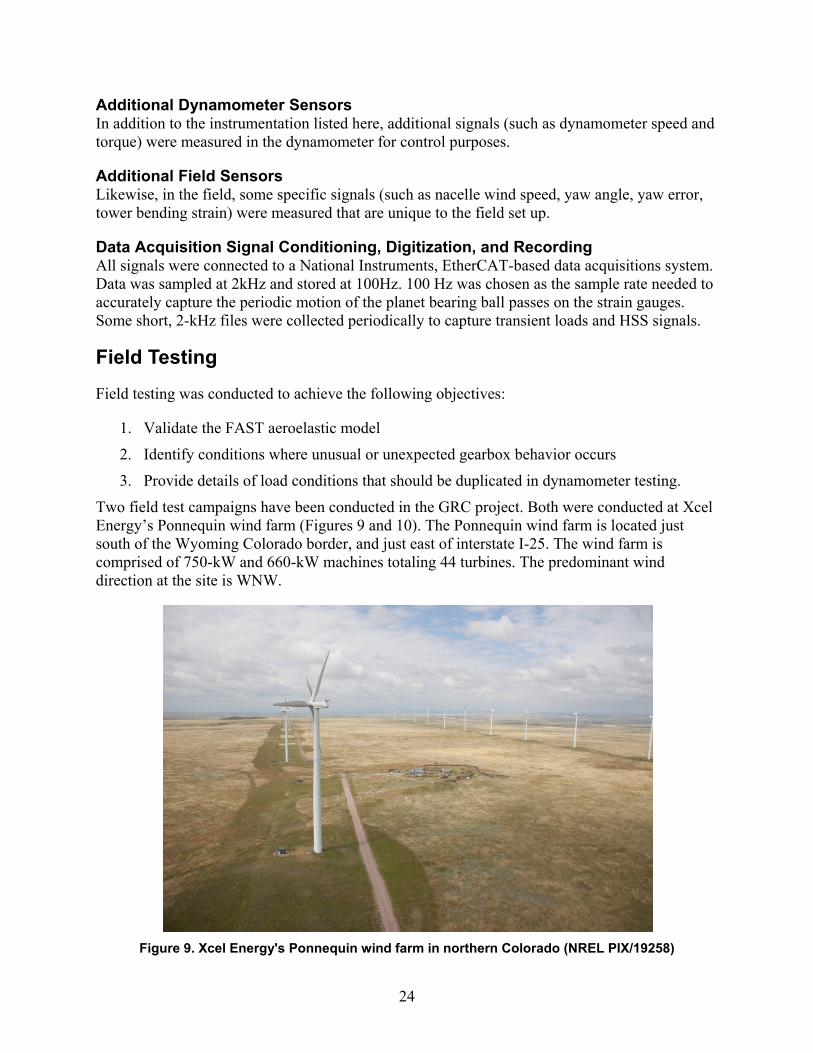
In Phase 2, an array of external strain gages was added to the ring gear of Gearbox 2 as shown in Figure 8. The first set of gages was placed to quantify the ring gear load distribution. This set consisted of eight gages placed along a tooth root. Ultrasonic equipment was used to locate the root between two gear teeth, which are on the inside of the ring gear, on the outside of the ring gear for strain gage placement. A second set of gages was placed at four azimuth locations (45°, 135°, 225°, and 315° from TDC) on the outside of the ring gear to measure hoop strain.
Figure 8. Strain gages on exterior of ring gear on GRC gearbox (NREL PIX/19221)
PositiveRotation
A
B C
24
Additional Dynamometer Sensors In addition to the instrumentation listed here, additional signals (such as dynamometer speed and torque) were measured in the dynamometer for control purposes.
Additional Field Sensors Likewise, in the field, some specific signals (such as nacelle wind speed, yaw angle, yaw error, tower bending strain) were measured that are unique to the field set up.
Data Acquisition Signal Conditioning, Digitization, and Recording All signals were connected to a National Instruments, EtherCAT-based data acquisitions system. Data was sampled at 2kHz and stored at 100Hz. 100 Hz was chosen as the sample rate needed to accurately capture the periodic motion of the planet bearing ball passes on the strain gauges. Some short, 2-kHz files were collected periodically to capture transient loads and HSS signals.
Field Testing
Field testing was conducted to achieve the following objectives:
1. Validate the FAST aeroelastic model
2. Identify conditions where unusual or unexpected gearbox behavior occurs
3. Provide details of load conditions that should be duplicated in dynamometer testing.
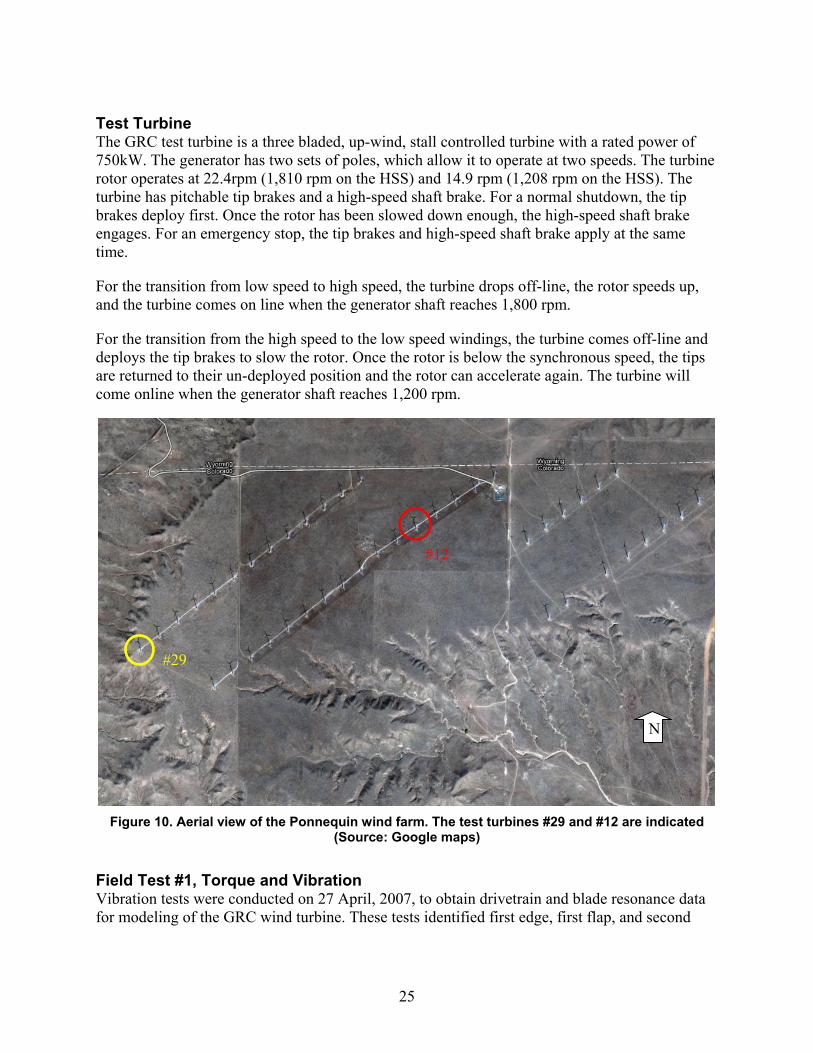
Two field test campaigns have been conducted in the GRC project. Both were conducted at Xcel Energy’s Ponnequin wind farm (Figures 9 and 10). The Ponnequin wind farm is located just south of the Wyoming Colorado border, and just east of interstate I-25. The wind farm is comprised of 750-kW and 660-kW machines totaling 44 turbines. The predominant wind direction at the site is WNW.
Figure 9. Xcel Energy's Ponnequin wind farm in northern Colorado (NREL PIX/19258)
25
Test Turbine The GRC test turbine is a three bladed, up-wind, stall controlled turbine with a rated power of 750kW. The generator has two sets of poles, which allow it to operate at two speeds. The turbine rotor operates at 22.4rpm (1,810 rpm on the HSS) and 14.9 rpm (1,208 rpm on the HSS). The turbine has pitchable tip brakes and a high-speed shaft brake. For a normal shutdown, the tip brakes deploy first. Once the rotor has been slowed down enough, the high-speed shaft brake engages. For an emergency stop, the tip brakes and high-speed shaft brake apply at the same time.
For the transition from low speed to high speed, the turbine drops off-line, the rotor speeds up, and the turbine comes on line when the generator shaft reaches 1,800 rpm.
For the transition from the high speed to the low speed windings, the turbine comes off-line and deploys the tip brakes to slow the rotor. Once the rotor is below the synchronous speed, the tips are returned to their un-deployed position and the rotor can accelerate again. The turbine will come online when the generator shaft reaches 1,200 rpm.
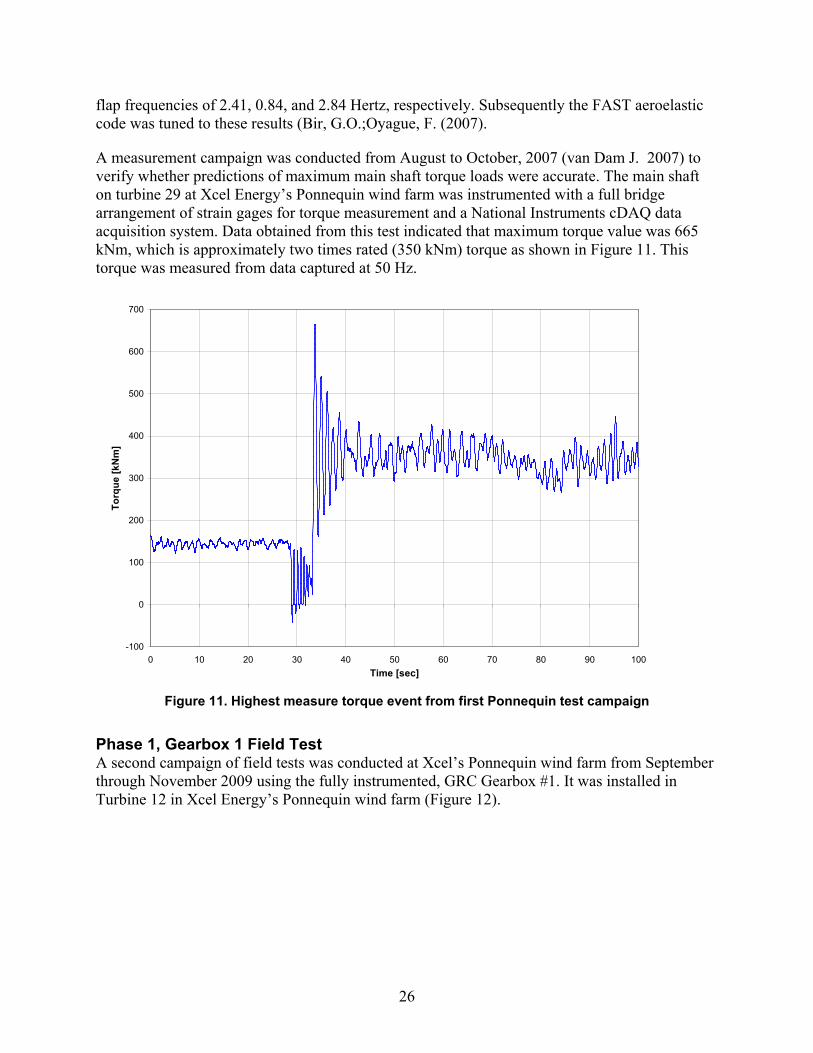
Figure 10. Aerial view of the Ponnequin wind farm. The test turbines #29 and #12 are indicated
(Source: Google maps)
Field Test #1, Torque and Vibration Vibration tests were conducted on 27 April, 2007, to obtain drivetrain and blade resonance data for modeling of the GRC wind turbine. These tests identified first edge, first flap, and second
N
#29
#12
26
flap frequencies of 2.41, 0.84, and 2.84 Hertz, respectively. Subsequently the FAST aeroelastic code was tuned to these results (Bir, G.O.;Oyague, F. (2007).
A measurement campaign was conducted from August to October, 2007 (van Dam J. 2007) to verify whether predictions of maximum main shaft torque loads were accurate. The main shaft on turbine 29 at Xcel Energy’s Ponnequin wind farm was instrumented with a full bridge arrangement of strain gages for torque measurement and a National Instruments cDAQ data acquisition system. Data obtained from this test indicated that maximum torque value was 665 kNm, which is approximately two times rated (350 kNm) torque as shown in Figure 11. This torque was measured from data captured at 50 Hz.
Figure 11. Highest measure torque event from first Ponnequin test campaign
Phase 1, Gearbox 1 Field Test A second campaign of field tests was conducted at Xcel’s Ponnequin wind farm from September through November 2009 using the fully instrumented, GRC Gearbox #1. It was installed in Turbine 12 in Xcel Energy’s Ponnequin wind farm (Figure 12).
-100
0
100
200
300
400
500
600
700
0 10 20 30 40 50 60 70 80 90 100Time [sec]
Torq
ue [k
Nm
]

27
The gearbox was installed in the turbine on July 16, 2009. The turbine was put in unattended operation on September 14th, and the testing was stopped on October 5th 2009. During that period, more than 300 hours of data were recorded.
During testing operations, the wind turbine faulted several times due to high-speed bearing temperatures exceeding 90º C. There were also two incidents of significant oil loss. An inspection on October 6, 2009, revealed that the high-speed stage gear teeth showed signs of significant overheating. It was determined that testing should be suspended to avoid the potential for catastrophic gearbox failure. Subsequently the gearbox was removed from the turbine and shipped back to NREL. After conducting a limited set of condition monitoring tests in the NREL dynamometer, the gearbox was sent to The Gearworks for disassembly and inspection.
Dynamometer Testing
As noted above, dynamometer testing was conducted to achieve the following objectives:
1. Validate analytical models
2. Identify conditions where unusual or unexpected gearbox behavior occurs
3. Develop improved dynamometer testing methods to accurately reproduce in-field responses.
In addition, the dynamometer afforded the opportunity to perform other important tasks:
1. Gearbox run-in
2. Verification of instrumentation for the field gearbox.
Summarized Objectives Run-In Both gearboxes were run-in in the NREL 2.5-MW dynamometer (Figure 13). The run-in is performed before any other operation to carefully condition the surfaces of the gear teeth. Run-in
Figure 12. GRC gearbox installation in Ponnequin (NREL PIX/19257)
28
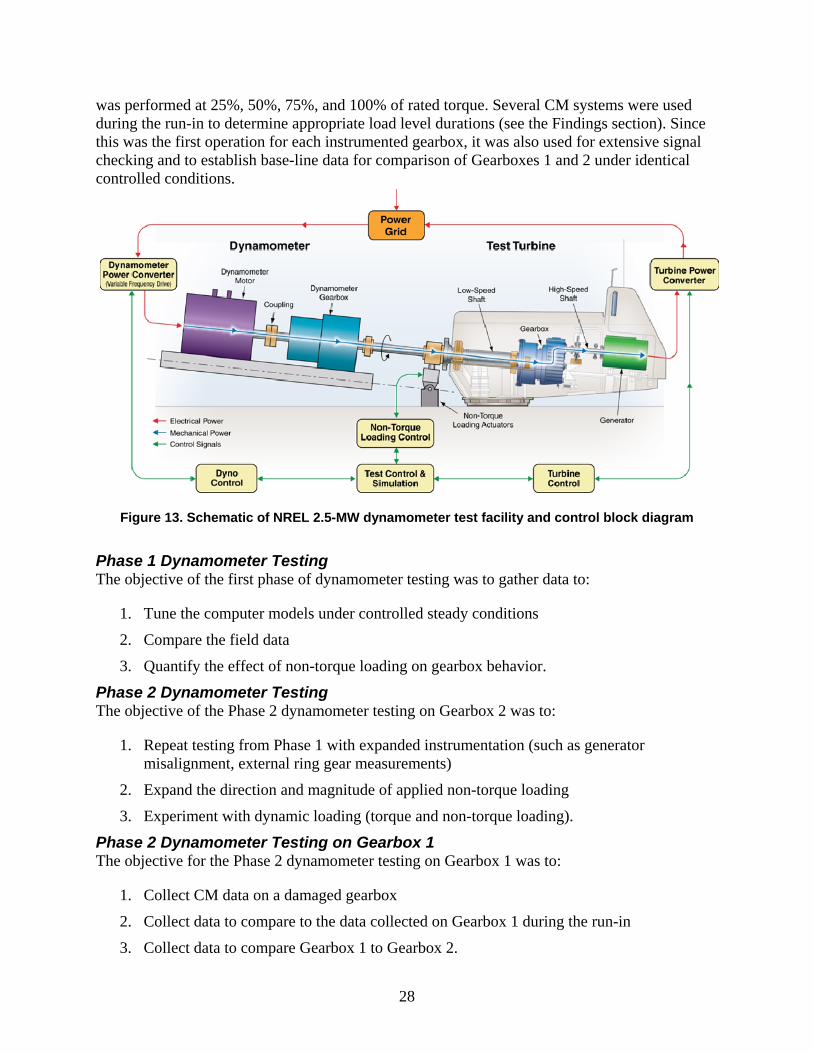
was performed at 25%, 50%, 75%, and 100% of rated torque. Several CM systems were used during the run-in to determine appropriate load level durations (see the Findings section). Since this was the first operation for each instrumented gearbox, it was also used for extensive signal checking and to establish base-line data for comparison of Gearboxes 1 and 2 under identical controlled conditions.
Figure 13. Schematic of NREL 2.5-MW dynamometer test facility and control block diagram
Phase 1 Dynamometer Testing The objective of the first phase of dynamometer testing was to gather data to:
1. Tune the computer models under controlled steady conditions
2. Compare the field data
3. Quantify the effect of non-torque loading on gearbox behavior.
Phase 2 Dynamometer Testing The objective of the Phase 2 dynamometer testing on Gearbox 2 was to:
1. Repeat testing from Phase 1 with expanded instrumentation (such as generator misalignment, external ring gear measurements)
2. Expand the direction and magnitude of applied non-torque loading
3. Experiment with dynamic loading (torque and non-torque loading).
Phase 2 Dynamometer Testing on Gearbox 1 The objective for the Phase 2 dynamometer testing on Gearbox 1 was to:
1. Collect CM data on a damaged gearbox
2. Collect data to compare to the data collected on Gearbox 1 during the run-in
3. Collect data to compare Gearbox 1 to Gearbox 2.
29
Dynamometer Test Preparations Drivetrain Assembly The first activity in the 2.5-MW dynamometer in the GRC project was the installation and commissioning of the GRC drivetrain. In addition to the gearbox, NREL staff assembled a variety of other equipment necessary for this testing.
• Mainframe, generator, and low-speed shaft, obtained from Xcel Energy were installed for this project.
• Wazee Electric refurbished the generator by rewiring the stator, baking the windings, rebalancing the rotor, and installing new bearings. They verified winding integrity with a high-voltage, resistance test.
• Shaft adapters to connect to the dyno driveline were installed. The output flange of the dyno gearbox is connected to a torque transducer spool that measures torque applied to the drive train. The torque spool is connected to a jackshaft assembly that was used in prior testing of 750-kW-size drive train in the NWTC dynamometer. This jackshaft assembly has two crown-tooth, flexible couplings at both ends and a 6-meter shaft between. The assembly allows the test article to move in response to torque and non-torque shaft loads without affecting the dyno’s gearbox. Another feature of the jackshaft assembly is a yoke to which non-torque actuators could be attached. Finally, there is a shaft adapter that connects the “downwind” flexible coupling to the hub flange on the GRC drivetrain’s main shaft. The custom parts needed for initial installation of the GRC drivetrain were designed by PEI and fabricated locally.
A tower adapter was used to connect the GRC drivetrain to the floor. It uses the bolt circle in the drivetrain’s main frame that would normally be used to mount the turbine’s yaw bearing. The adapter is solidly bolted to a Baycast baseplate integral to the dynamometer foundation. These adapters were designed by PEI and fabricated locally.
The turbine controller was modified and supplied by Energy Maintenance Services (EMS). The controller contains power electronics, programmable logic controller (PLC), cabinets for main contactors, control and safety relays, and monitoring devices. Systems irrelevant to dyno testing (yaw, blade tip, pitch, brake controls) were disabled. In this configuration, the control system was primarily used to sequence soft-starter firing and main/bypass contactors during generator synchronization to the grid.
The GRC generator was connected to the dyno’s 3 MVA, 690V, electrical service by a 690/600V step-down transformer that NREL had available from previous dyno testing.
NREL provided the external lubrication system for the gearbox using equipment that had been used in earlier dynamometer tests.
Dynamometer Control The dynamometer was operated exclusively in torque control mode during Phase 1 testing. During a typical test run, the test article was cleared of faults and issued a start command through a remote control panel interface to the PLC. The dynamometer torque command was set to provide a gentle ramp-up to rated speed, typically requiring 1%–2% of rated torque of the test article. The generator contactor and soft starter were activated as the generator approached either
30
the 1,200 or 1,800 rpm synchronous speeds corresponding to the small (200 kW) or large (750 kW) generator windings. Generator selection is a function of the wind speed (simulated) and controller configuration. After the grid connection was established, the torque set point was increased to achieve the desired operating point for the test case, typically specified in kW electrical output.
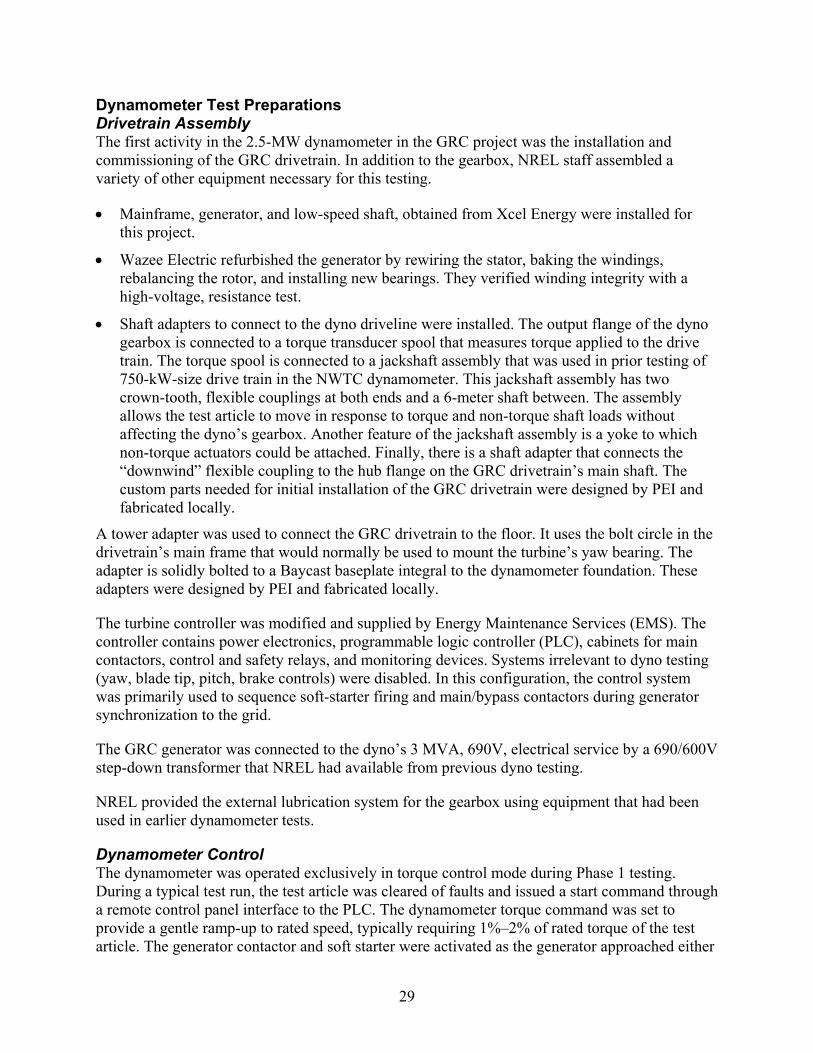
During Phase 2 testing, the dynamometer control was enhanced to provide more precise control of the startup ramp rate and dynamometer behavior during grid connection. In this configuration, the dynamometer was started in speed control mode at a preprogrammed rate of change (ramp-rate). At generator synchronous speed, the torque set point was set to the current torque demand and the dynamometer is switched to torque control mode. Once in torque control mode, the dynamometer ramps at a specified rate to a predetermined torque value. Details of the asynchronous generator control mode are shown in Figure 14.
Figure 14. Asynchronous generator control mode
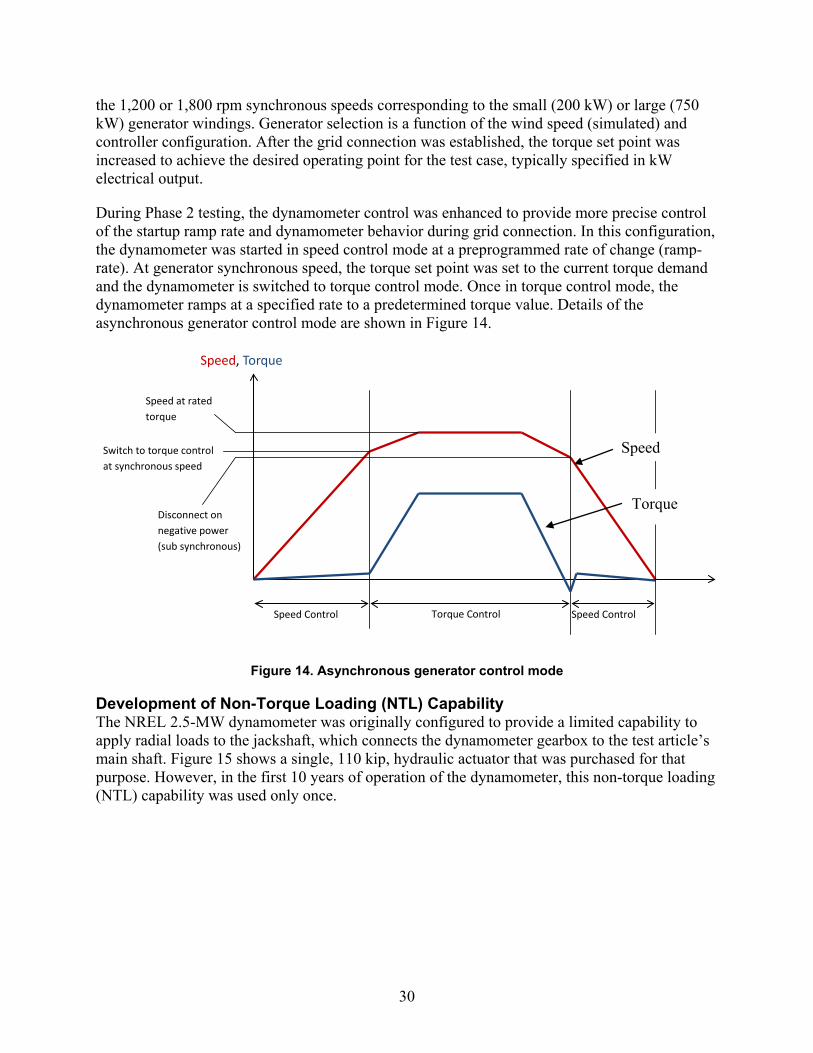
Development of Non-Torque Loading (NTL) Capability The NREL 2.5-MW dynamometer was originally configured to provide a limited capability to apply radial loads to the jackshaft, which connects the dynamometer gearbox to the test article’s main shaft. Figure 15 shows a single, 110 kip, hydraulic actuator that was purchased for that purpose. However, in the first 10 years of operation of the dynamometer, this non-torque loading (NTL) capability was used only once.
Speed, Torque
Speed Control Torque Control Speed Control
Disconnect on negative power (sub synchronous)
Switch to torque control at synchronous speed
Speed at rated torque
Speed
Torque
31
Figure 15. NREL 2.5-MW dynamometer, original NTL configuration shown highlighted in red
Importance of Non-Torque Loading During the planning of the GRC testing, it was recognized that an NTL capability would need to be developed. This would simulate asymmetrical rotor loads on a wind turbine. Torque loads, which are provided by the dynamometer motor and gearbox, arise from the in-plane component of aerodynamic forces on the rotor. Non-torque loads occur in the other five degrees of freedom. Thrust load derives from the out-of-plane component of aerodynamic forces on the rotor and acts axially in alignment with the main shaft. This direction is defined as the positive X-axis in the coordinate system used in the GRC project. Shaft bending loads in pitch and yaw arise from uneven aerodynamic loads on the rotor. Imbalance from top to bottom of the rotor causes pitching moment (about the Y-axis). Imbalance from side-to-side causes yaw moment (about the Z-axis). Finally, there are vertical and horizontal shear loads that result primarily from rotor weight (vertical) and yaw forces (horizontal). Of these the most important are thought to be bending moments and thrust force.
In a three-point suspension drivetrain, shaft-bending moments cause radial reaction forces that pass through the gearbox. In a perfect world, these radial reactions pass from the main shaft, through the gearbox’s carrier bearings, a stiff gearbox housing, the gearbox trunnions, and into the mainframe. However, in the real world, these reactions can alter shaft alignment to the gearbox and the gear mesh patterns in the gearbox’s low-speed stage.
Thrust loads are designed to be transmitted through the main bearing directly into the main frame without affecting the gearbox. However, because the main bearing has some axial clearance, reversing thrust loads moves the gearbox axially. This motion can affect internal components in the gearbox.
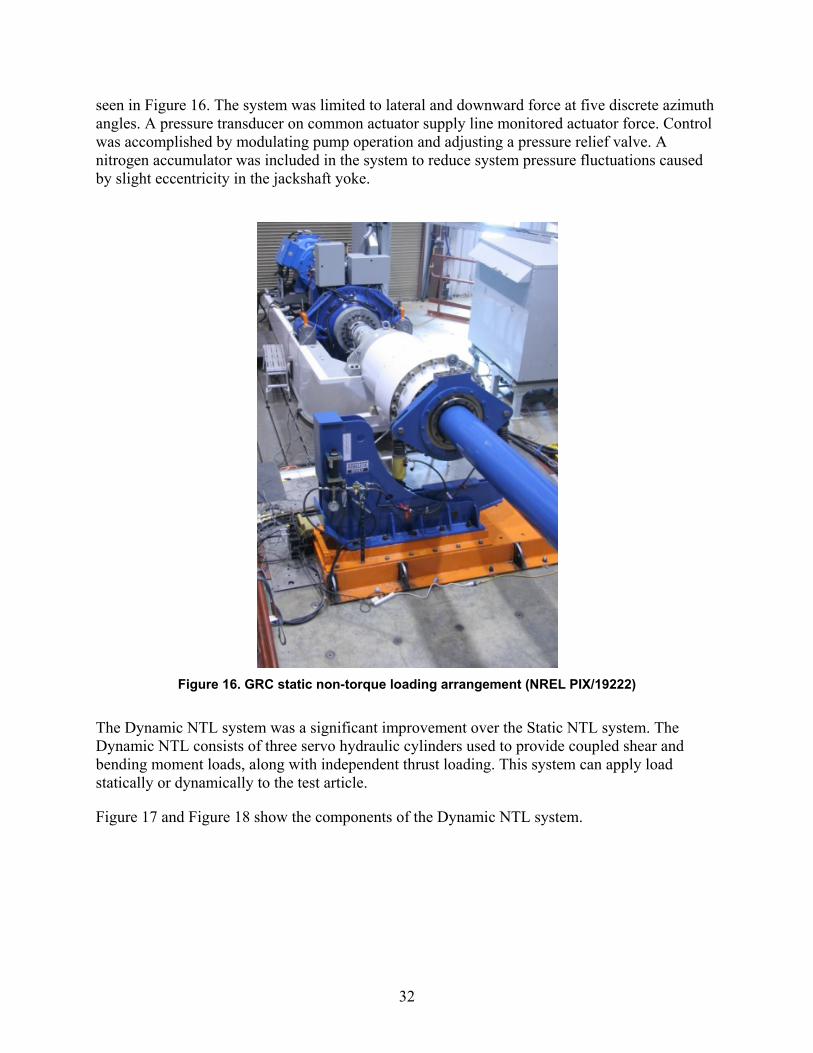
Static NTL System The first NTL system to be used in GRC testing was called the Static Non-Torque Loading System. It was first used in Phase 1 dyno testing. The equipment featured two single-acting actuators attached to a bearing yoke on the coupling shaft. One of the yellow actuators can be
32
seen in Figure 16. The system was limited to lateral and downward force at five discrete azimuth angles. A pressure transducer on common actuator supply line monitored actuator force. Control was accomplished by modulating pump operation and adjusting a pressure relief valve. A nitrogen accumulator was included in the system to reduce system pressure fluctuations caused by slight eccentricity in the jackshaft yoke.
Figure 16. GRC static non-torque loading arrangement (NREL PIX/19222)
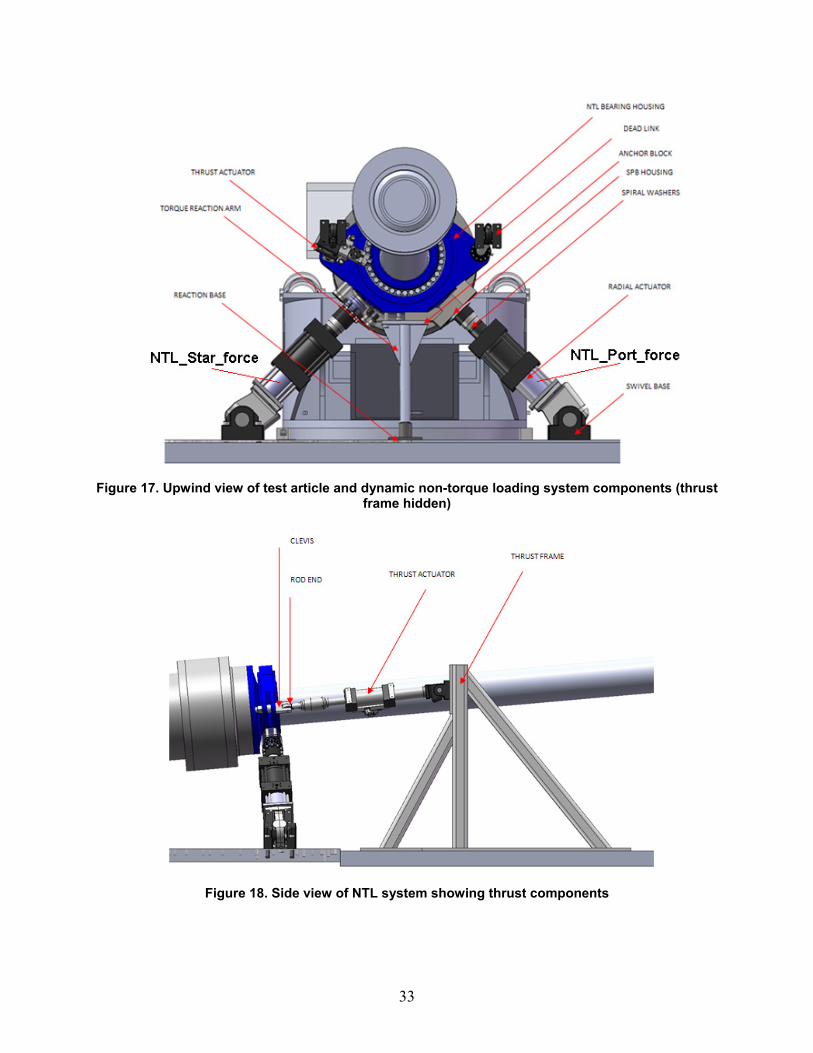
The Dynamic NTL system was a significant improvement over the Static NTL system. The Dynamic NTL consists of three servo hydraulic cylinders used to provide coupled shear and bending moment loads, along with independent thrust loading. This system can apply load statically or dynamically to the test article.
Figure 17 and Figure 18 show the components of the Dynamic NTL system.
33
Figure 17. Upwind view of test article and dynamic non-torque loading system components (thrust
frame hidden)
Figure 18. Side view of NTL system showing thrust components
34
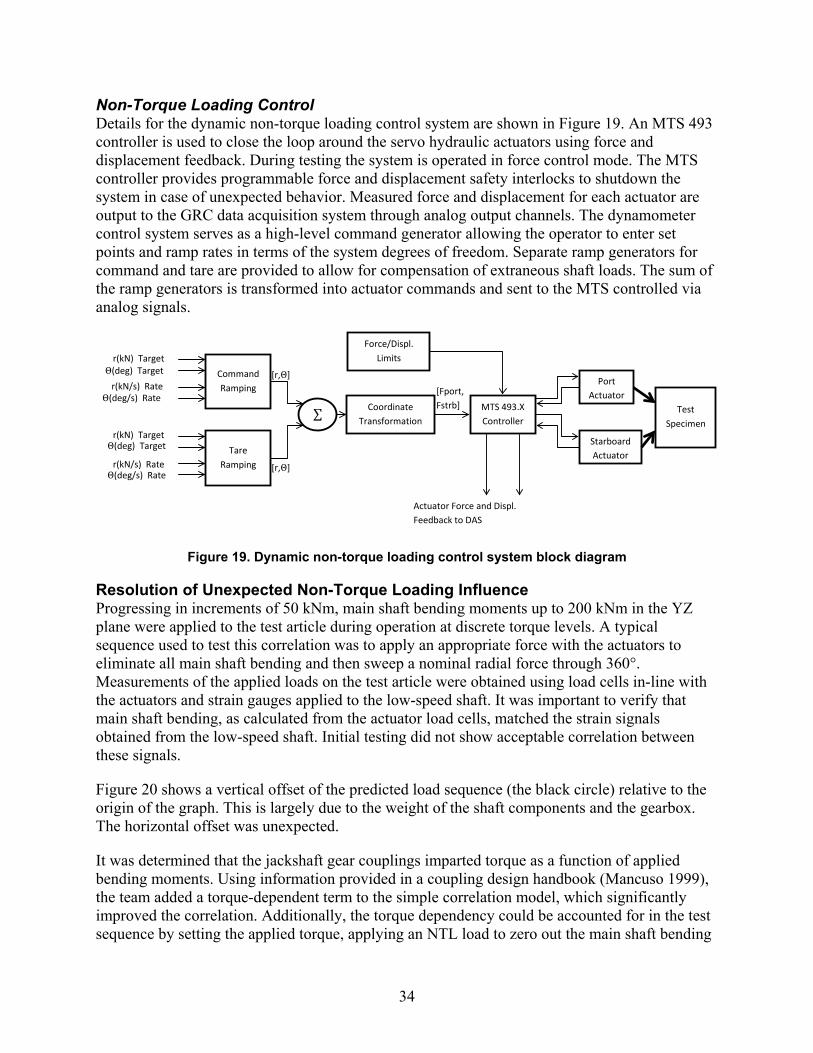
Non-Torque Loading Control Details for the dynamic non-torque loading control system are shown in Figure 19. An MTS 493 controller is used to close the loop around the servo hydraulic actuators using force and displacement feedback. During testing the system is operated in force control mode. The MTS controller provides programmable force and displacement safety interlocks to shutdown the system in case of unexpected behavior. Measured force and displacement for each actuator are output to the GRC data acquisition system through analog output channels. The dynamometer control system serves as a high-level command generator allowing the operator to enter set points and ramp rates in terms of the system degrees of freedom. Separate ramp generators for command and tare are provided to allow for compensation of extraneous shaft loads. The sum of the ramp generators is transformed into actuator commands and sent to the MTS controlled via analog signals.
Figure 19. Dynamic non-torque loading control system block diagram
Resolution of Unexpected Non-Torque Loading Influence Progressing in increments of 50 kNm, main shaft bending moments up to 200 kNm in the YZ plane were applied to the test article during operation at discrete torque levels. A typical sequence used to test this correlation was to apply an appropriate force with the actuators to eliminate all main shaft bending and then sweep a nominal radial force through 360°. Measurements of the applied loads on the test article were obtained using load cells in-line with the actuators and strain gauges applied to the low-speed shaft. It was important to verify that main shaft bending, as calculated from the actuator load cells, matched the strain signals obtained from the low-speed shaft. Initial testing did not show acceptable correlation between these signals.
Figure 20 shows a vertical offset of the predicted load sequence (the black circle) relative to the origin of the graph. This is largely due to the weight of the shaft components and the gearbox. The horizontal offset was unexpected.
It was determined that the jackshaft gear couplings imparted torque as a function of applied bending moments. Using information provided in a coupling design handbook (Mancuso 1999), the team added a torque-dependent term to the simple correlation model, which significantly improved the correlation. Additionally, the torque dependency could be accounted for in the test sequence by setting the applied torque, applying an NTL load to zero out the main shaft bending
Port Actuator
Starboard Actuator
Test Specimen
MTS 493.X Controller
Command Ramping
Tare Ramping
∑ Coordinate
Transformation
r(kN) Target Θ(deg) Target
r(kN/s) Rate Θ(deg/s) Rate
r(kN) Target Θ(deg) Target
r(kN/s) Rate Θ(deg/s) Rate
[Fport, Fstrb]
[r,Θ]
[r,Θ]
Actuator Force and Displ. Feedback to DAS
Force/Displ. Limits
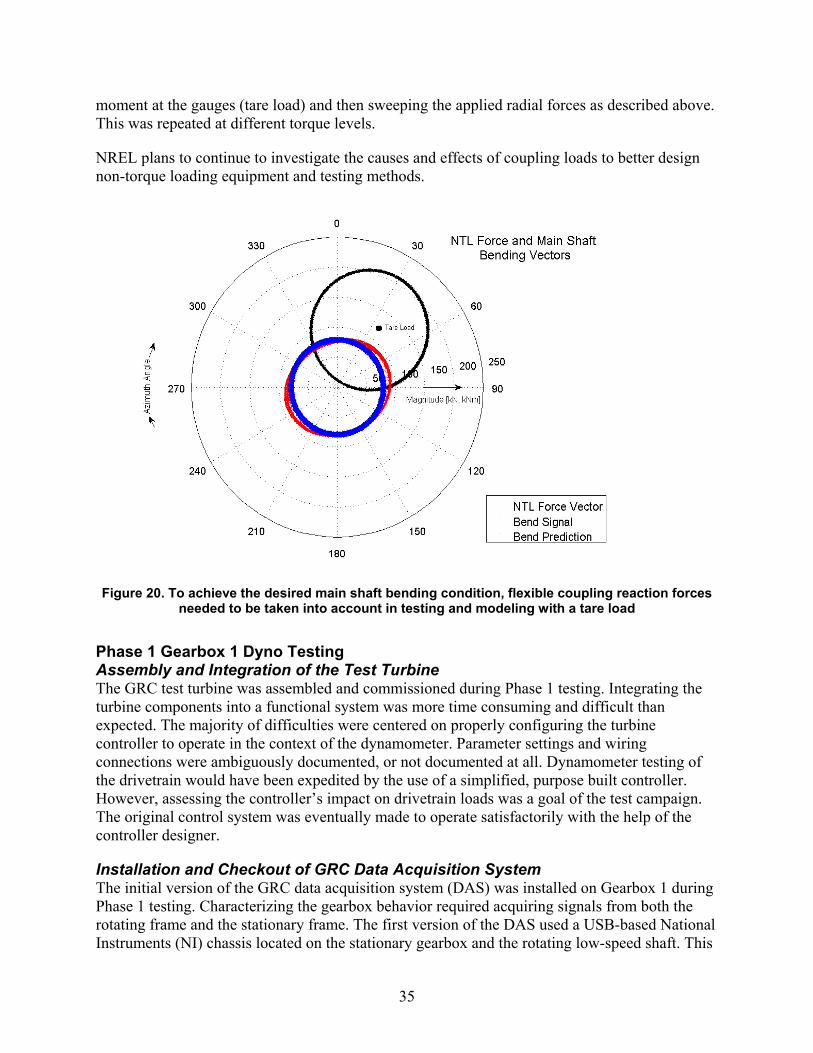
35
moment at the gauges (tare load) and then sweeping the applied radial forces as described above. This was repeated at different torque levels.
NREL plans to continue to investigate the causes and effects of coupling loads to better design non-torque loading equipment and testing methods.
Figure 20. To achieve the desired main shaft bending condition, flexible coupling reaction forces
needed to be taken into account in testing and modeling with a tare load
Phase 1 Gearbox 1 Dyno Testing Assembly and Integration of the Test Turbine The GRC test turbine was assembled and commissioned during Phase 1 testing. Integrating the turbine components into a functional system was more time consuming and difficult than expected. The majority of difficulties were centered on properly configuring the turbine controller to operate in the context of the dynamometer. Parameter settings and wiring connections were ambiguously documented, or not documented at all. Dynamometer testing of the drivetrain would have been expedited by the use of a simplified, purpose built controller. However, assessing the controller’s impact on drivetrain loads was a goal of the test campaign. The original control system was eventually made to operate satisfactorily with the help of the controller designer.
Installation and Checkout of GRC Data Acquisition System The initial version of the GRC data acquisition system (DAS) was installed on Gearbox 1 during Phase 1 testing. Characterizing the gearbox behavior required acquiring signals from both the rotating frame and the stationary frame. The first version of the DAS used a USB-based National Instruments (NI) chassis located on the stationary gearbox and the rotating low-speed shaft. This
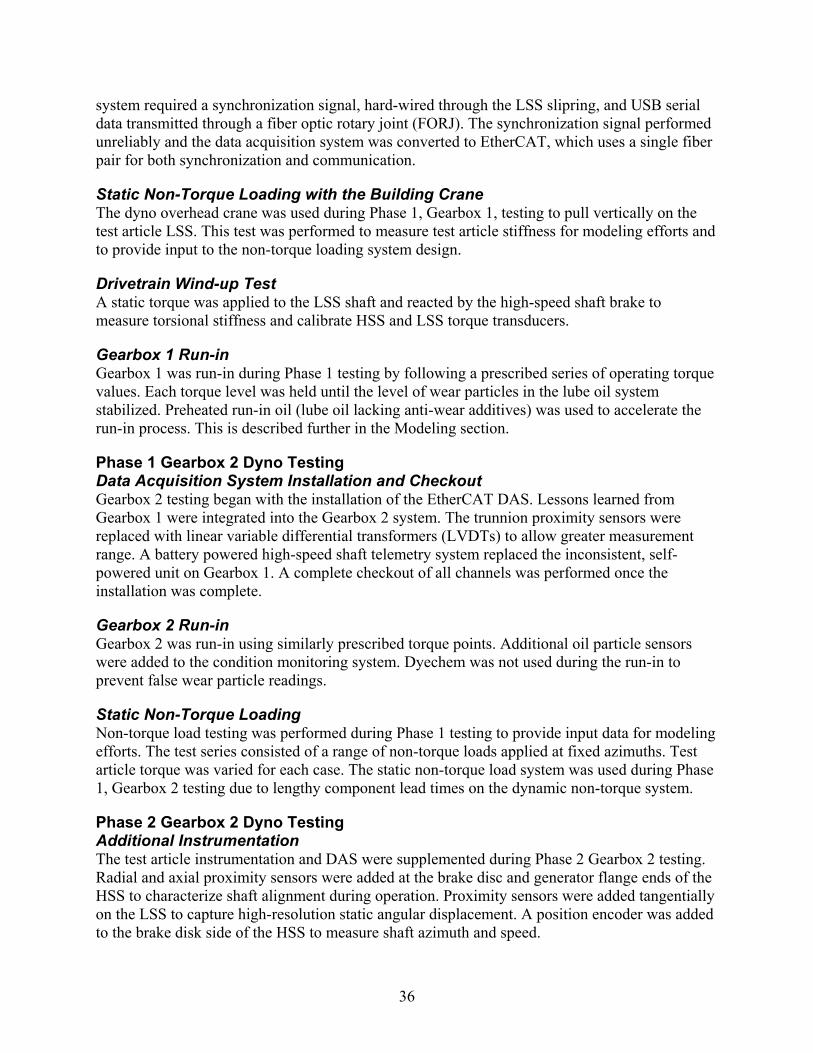
36
system required a synchronization signal, hard-wired through the LSS slipring, and USB serial data transmitted through a fiber optic rotary joint (FORJ). The synchronization signal performed unreliably and the data acquisition system was converted to EtherCAT, which uses a single fiber pair for both synchronization and communication.
Static Non-Torque Loading with the Building Crane The dyno overhead crane was used during Phase 1, Gearbox 1, testing to pull vertically on the test article LSS. This test was performed to measure test article stiffness for modeling efforts and to provide input to the non-torque loading system design.
Drivetrain Wind-up Test A static torque was applied to the LSS shaft and reacted by the high-speed shaft brake to measure torsional stiffness and calibrate HSS and LSS torque transducers.
Gearbox 1 Run-in Gearbox 1 was run-in during Phase 1 testing by following a prescribed series of operating torque values. Each torque level was held until the level of wear particles in the lube oil system stabilized. Preheated run-in oil (lube oil lacking anti-wear additives) was used to accelerate the run-in process. This is described further in the Modeling section.
Phase 1 Gearbox 2 Dyno Testing Data Acquisition System Installation and Checkout Gearbox 2 testing began with the installation of the EtherCAT DAS. Lessons learned from Gearbox 1 were integrated into the Gearbox 2 system. The trunnion proximity sensors were replaced with linear variable differential transformers (LVDTs) to allow greater measurement range. A battery powered high-speed shaft telemetry system replaced the inconsistent, self-powered unit on Gearbox 1. A complete checkout of all channels was performed once the installation was complete.
Gearbox 2 Run-in Gearbox 2 was run-in using similarly prescribed torque points. Additional oil particle sensors were added to the condition monitoring system. Dyechem was not used during the run-in to prevent false wear particle readings.
Static Non-Torque Loading Non-torque load testing was performed during Phase 1 testing to provide input data for modeling efforts. The test series consisted of a range of non-torque loads applied at fixed azimuths. Test article torque was varied for each case. The static non-torque load system was used during Phase 1, Gearbox 2 testing due to lengthy component lead times on the dynamic non-torque system.
Phase 2 Gearbox 2 Dyno Testing Additional Instrumentation The test article instrumentation and DAS were supplemented during Phase 2 Gearbox 2 testing. Radial and axial proximity sensors were added at the brake disc and generator flange ends of the HSS to characterize shaft alignment during operation. Proximity sensors were added tangentially on the LSS to capture high-resolution static angular displacement. A position encoder was added to the brake disk side of the HSS to measure shaft azimuth and speed.
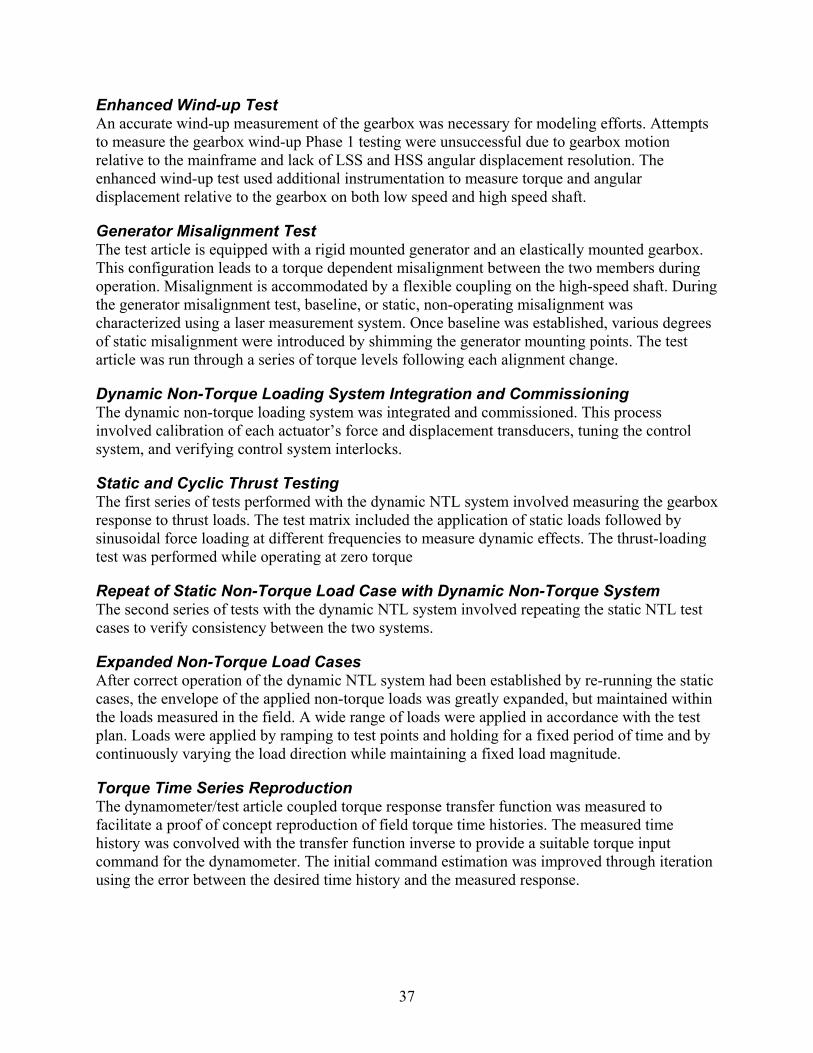
37
Enhanced Wind-up Test An accurate wind-up measurement of the gearbox was necessary for modeling efforts. Attempts to measure the gearbox wind-up Phase 1 testing were unsuccessful due to gearbox motion relative to the mainframe and lack of LSS and HSS angular displacement resolution. The enhanced wind-up test used additional instrumentation to measure torque and angular displacement relative to the gearbox on both low speed and high speed shaft.
Generator Misalignment Test The test article is equipped with a rigid mounted generator and an elastically mounted gearbox. This configuration leads to a torque dependent misalignment between the two members during operation. Misalignment is accommodated by a flexible coupling on the high-speed shaft. During the generator misalignment test, baseline, or static, non-operating misalignment was characterized using a laser measurement system. Once baseline was established, various degrees of static misalignment were introduced by shimming the generator mounting points. The test article was run through a series of torque levels following each alignment change.
Dynamic Non-Torque Loading System Integration and Commissioning The dynamic non-torque loading system was integrated and commissioned. This process involved calibration of each actuator’s force and displacement transducers, tuning the control system, and verifying control system interlocks.
Static and Cyclic Thrust Testing The first series of tests performed with the dynamic NTL system involved measuring the gearbox response to thrust loads. The test matrix included the application of static loads followed by sinusoidal force loading at different frequencies to measure dynamic effects. The thrust-loading test was performed while operating at zero torque
Repeat of Static Non-Torque Load Case with Dynamic Non-Torque System The second series of tests with the dynamic NTL system involved repeating the static NTL test cases to verify consistency between the two systems.
Expanded Non-Torque Load Cases After correct operation of the dynamic NTL system had been established by re-running the static cases, the envelope of the applied non-torque loads was greatly expanded, but maintained within the loads measured in the field. A wide range of loads were applied in accordance with the test plan. Loads were applied by ramping to test points and holding for a fixed period of time and by continuously varying the load direction while maintaining a fixed load magnitude.
Torque Time Series Reproduction The dynamometer/test article coupled torque response transfer function was measured to facilitate a proof of concept reproduction of field torque time histories. The measured time history was convolved with the transfer function inverse to provide a suitable torque input command for the dynamometer. The initial command estimation was improved through iteration using the error between the desired time history and the measured response.

38
Non-Torque Load Reproduction To facilitate proof of concept reproduction of field non-torque load time histories, measured shaft bending data were processed to produce magnitude and direction signals relative to a stationary frame. Reproduction of the field data was accomplished by feeding the processed magnitude and direction signals into the NTL command generator.
No Load Speed Oscillations Skidding of the planet bearings was investigated by rapidly changing the test article speed under no load conditions.
Carrier Barring Clearance Removal The test article is equipped with trunnion pins designed to slide in the thrust direction. In normal operation, the carrier bearings are only required to support a small thrust load due to the weight of the gearbox on a 6º incline. A spring-loaded mechanism was designed to pull the trunnion pins toward the rotor simulating loading conditions that might arise from malfunctioning or frozen trunnion pins.
Fixing the Trunnion Blocks The gearbox response to rigid trunnion mounts was investigated by preloading the trunnion pushing against steel shims. Preload was accomplished by pulling up on the trunnion bushing and inserting steel shims in the gap. The preload maintained contact between the gearbox and mainframe through a fraction of rated torque.
Phase 2 Gearbox 1 Dyno Testing GRC Vibration CM System A 12 channel, 40-kHz vibration measurement system was used in conjunction with the standard data acquisition system for Gearbox 1, Phase 2 dynamometer testing. This system was added to capture vibration signature resulting from damage that occurred during field testing.
No Load, Torque Only, and Torque with Non-Torque Testing The impact on the gearbox response resulting from the oil loss damage was investigated using a series of no-load, torque only, and non-torque/torque tests in accordance with the test plan. Gearbox vibration signatures during no load speed sweeps were taken before and after the testing campaign to assess whether additional degradation was occurring.
Other Testing
Bearing Load Calibration A fixture was designed to provide a means to correlate strain gage response measured in the planet bearings to the forces transmitted through the carrier pins to the planet gears. A complete test program was developed to ensure consistent calibration of all 36 half-bridge signals—a complex task since the loads that are transmitted follow multiple paths through as many as 13 rollers on each of six bearings. The load distribution through the rollers is a complex function of the bearing geometry, the gear and carrier stiffness, and the fit between the bearing inner race and the planet pin. As described in the Gearbox Instrumentation section, grooves were ground into the inner races of each of the six planet bearings. Each groove was fitted with two strain
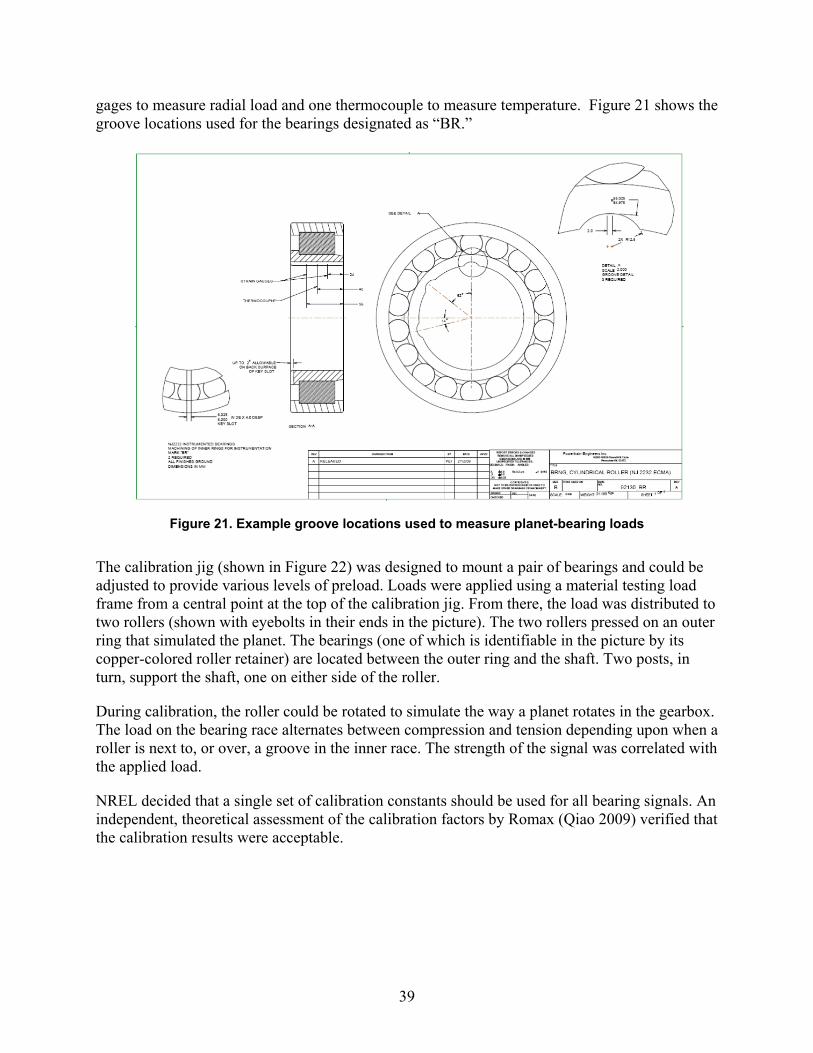
39
gages to measure radial load and one thermocouple to measure temperature. Figure 21 shows the groove locations used for the bearings designated as “BR.”
Figure 21. Example groove locations used to measure planet-bearing loads
The calibration jig (shown in Figure 22) was designed to mount a pair of bearings and could be adjusted to provide various levels of preload. Loads were applied using a material testing load frame from a central point at the top of the calibration jig. From there, the load was distributed to two rollers (shown with eyebolts in their ends in the picture). The two rollers pressed on an outer ring that simulated the planet. The bearings (one of which is identifiable in the picture by its copper-colored roller retainer) are located between the outer ring and the shaft. Two posts, in turn, support the shaft, one on either side of the roller.
During calibration, the roller could be rotated to simulate the way a planet rotates in the gearbox. The load on the bearing race alternates between compression and tension depending upon when a roller is next to, or over, a groove in the inner race. The strength of the signal was correlated with the applied load.
NREL decided that a single set of calibration constants should be used for all bearing signals. An independent, theoretical assessment of the calibration factors by Romax (Qiao 2009) verified that the calibration results were acceptable.

40
Figure 22. Bearing calibration fixture mounted in the NREL load frame (NREL PIX/19256)
Static Dynamometer Modal Test As part of the effort to understand how installation of a drive train in a dynamometer differs from installation of that same drivetrain in a wind turbine, Purdue University staff and students performed a survey of the fundamental vibration modes of the GRC drivetrain as it was installed in the NREL 2.5-MW dynamometer (Bond, Koester, and Adams 2011). They found one mode where the frequency was 29.7 Hz, which is very close to that of the generator speed (30.2 Hz at rated power). The main conclusion of this work was that, while designing a dynamometer test set up, resonances should be considered from the combination of the test drivetrain and the dynamometer because these resonances will affect control of the dynamometer and structural response of the test drivetrain.
Elastomeric Trunnion Characterization The gearbox torque arms are supported in two locations using viscoelastic rubber elements. Gearbox torque and non-torque loads, noise, and structural vibrations travel through these trunnions and into the bedplate. Given the importance of this load path, an investigation of the response of the rubber elements to loading was undertaken. The rubber mounts were removed and tested by Romax at the Tun Abdul Razak research Center (TARRC) (Crowther & Zaidi 2010). Static and dynamic benchtop tests determined that the rubber mount stiffness was nonlinear and temperature, frequency, and preload dependent (see Figure 23). The results were used to organize a collaborative modeling study to accurately model the behavior of the rubber.
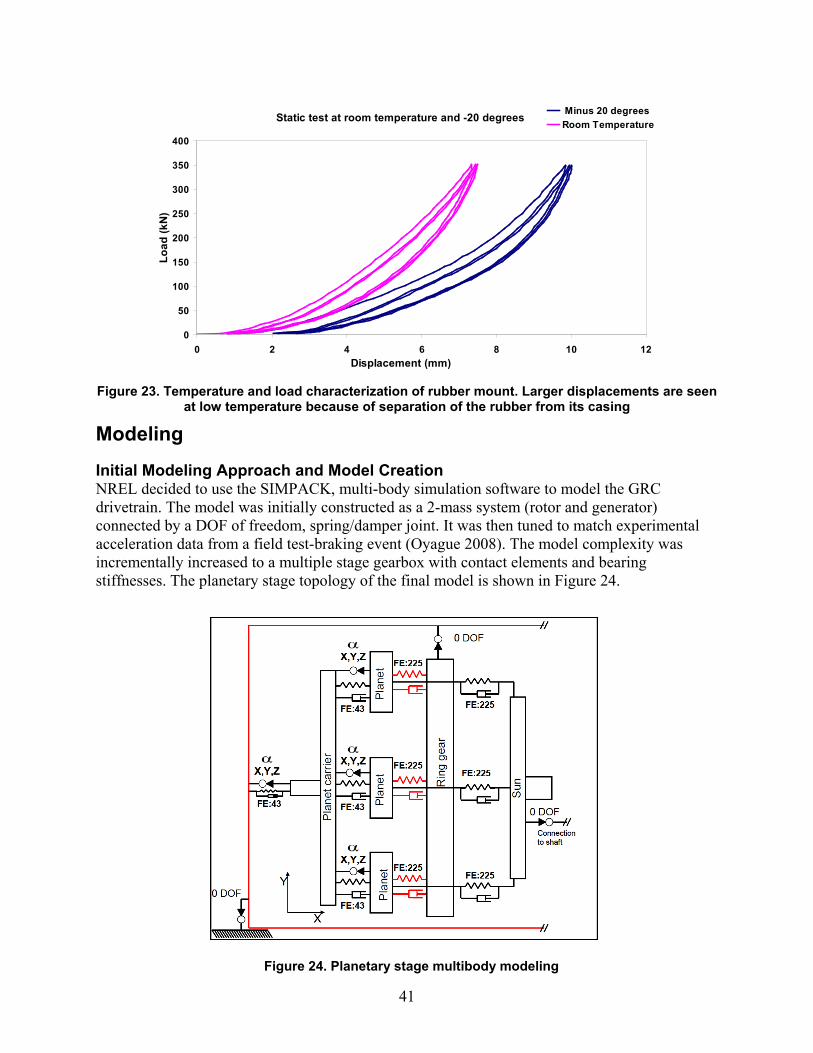
41
Figure 23. Temperature and load characterization of rubber mount. Larger displacements are seen
at low temperature because of separation of the rubber from its casing
Modeling
Initial Modeling Approach and Model Creation NREL decided to use the SIMPACK, multi-body simulation software to model the GRC drivetrain. The model was initially constructed as a 2-mass system (rotor and generator) connected by a DOF of freedom, spring/damper joint. It was then tuned to match experimental acceleration data from a field test-braking event (Oyague 2008). The model complexity was incrementally increased to a multiple stage gearbox with contact elements and bearing stiffnesses. The planetary stage topology of the final model is shown in Figure 24.
Static test at room temperature and -20 degrees
0
50
100
150
200
250
300
350
400
0 2 4 6 8 10 12Displacement (mm)
Load
(kN
)
Minus 20 degreesRoom Temperature
Figure 24. Planetary stage multibody modeling
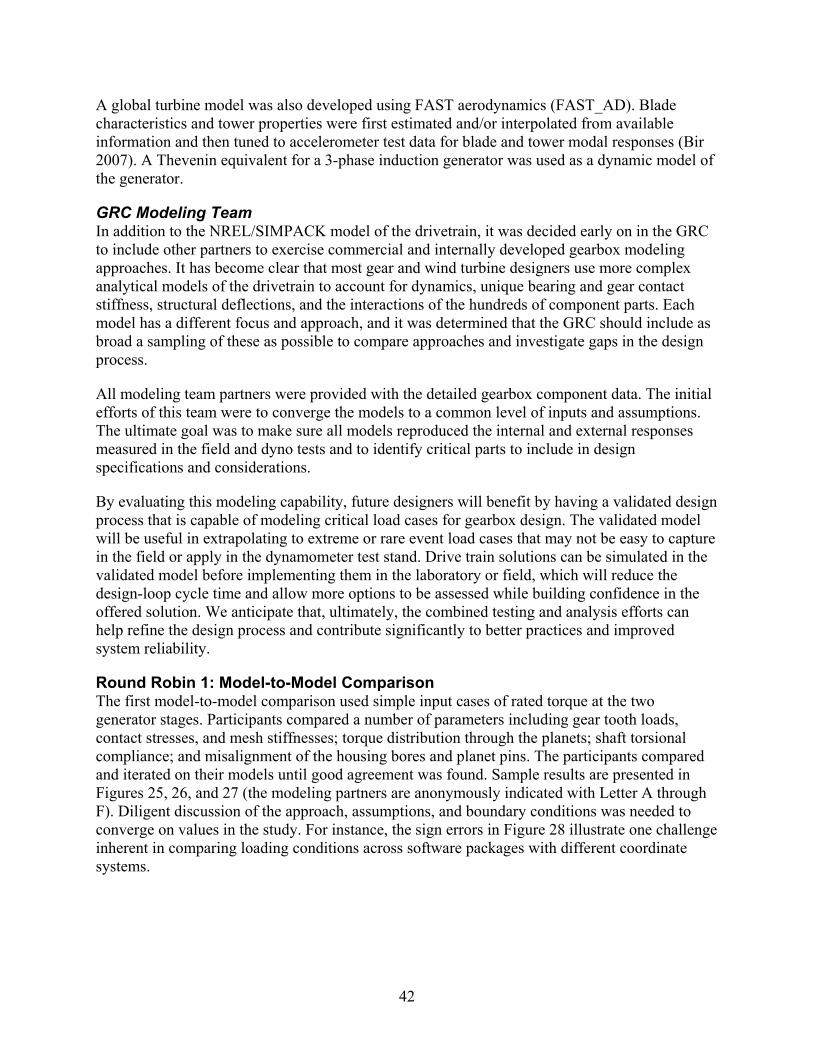
42
A global turbine model was also developed using FAST aerodynamics (FAST_AD). Blade characteristics and tower properties were first estimated and/or interpolated from available information and then tuned to accelerometer test data for blade and tower modal responses (Bir 2007). A Thevenin equivalent for a 3-phase induction generator was used as a dynamic model of the generator.
GRC Modeling Team In addition to the NREL/SIMPACK model of the drivetrain, it was decided early on in the GRC to include other partners to exercise commercial and internally developed gearbox modeling approaches. It has become clear that most gear and wind turbine designers use more complex analytical models of the drivetrain to account for dynamics, unique bearing and gear contact stiffness, structural deflections, and the interactions of the hundreds of component parts. Each model has a different focus and approach, and it was determined that the GRC should include as broad a sampling of these as possible to compare approaches and investigate gaps in the design process.
All modeling team partners were provided with the detailed gearbox component data. The initial efforts of this team were to converge the models to a common level of inputs and assumptions. The ultimate goal was to make sure all models reproduced the internal and external responses measured in the field and dyno tests and to identify critical parts to include in design specifications and considerations.
By evaluating this modeling capability, future designers will benefit by having a validated design process that is capable of modeling critical load cases for gearbox design. The validated model will be useful in extrapolating to extreme or rare event load cases that may not be easy to capture in the field or apply in the dynamometer test stand. Drive train solutions can be simulated in the validated model before implementing them in the laboratory or field, which will reduce the design-loop cycle time and allow more options to be assessed while building confidence in the offered solution. We anticipate that, ultimately, the combined testing and analysis efforts can help refine the design process and contribute significantly to better practices and improved system reliability.
Round Robin 1: Model-to-Model Comparison The first model-to-model comparison used simple input cases of rated torque at the two generator stages. Participants compared a number of parameters including gear tooth loads, contact stresses, and mesh stiffnesses; torque distribution through the planets; shaft torsional compliance; and misalignment of the housing bores and planet pins. The participants compared and iterated on their models until good agreement was found. Sample results are presented in Figures 25, 26, and 27 (the modeling partners are anonymously indicated with Letter A through F). Diligent discussion of the approach, assumptions, and boundary conditions was needed to converge on values in the study. For instance, the sign errors in Figure 28 illustrate one challenge inherent in comparing loading conditions across software packages with different coordinate systems.
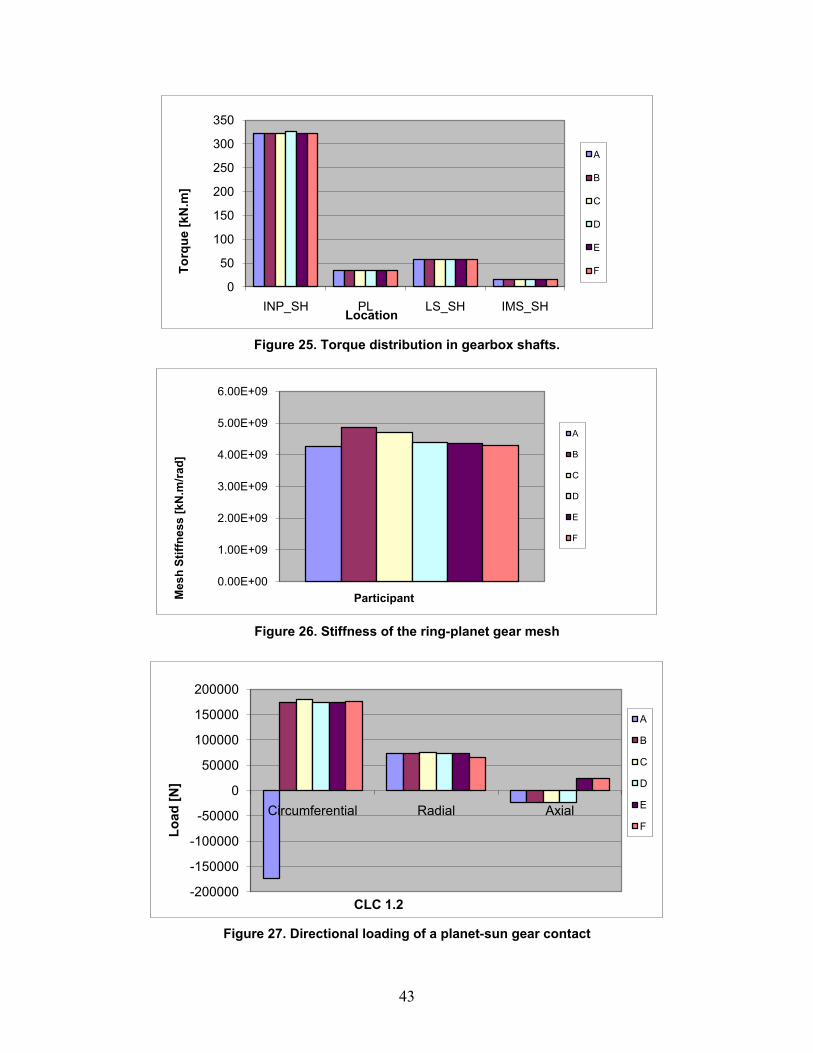
43
Figure 25. Torque distribution in gearbox shafts.
Figure 26. Stiffness of the ring-planet gear mesh
Figure 27. Directional loading of a planet-sun gear contact
0
50
100
150
200
250
300
350
INP_SH PL LS_SH IMS_SH
Torq
ue [k
N.m
]
Location
A
B
C
D
E
F
0.00E+00
1.00E+09
2.00E+09
3.00E+09
4.00E+09
5.00E+09
6.00E+09
Mes
h St
iffne
ss [k
N.m
/rad]
Participant
A
B
C
D
E
F
-200000
-150000
-100000
-50000
0
50000
100000
150000
200000
Circumferential Radial Axial
Load
[N]
CLC 1.2
A
B
C
D
E
F
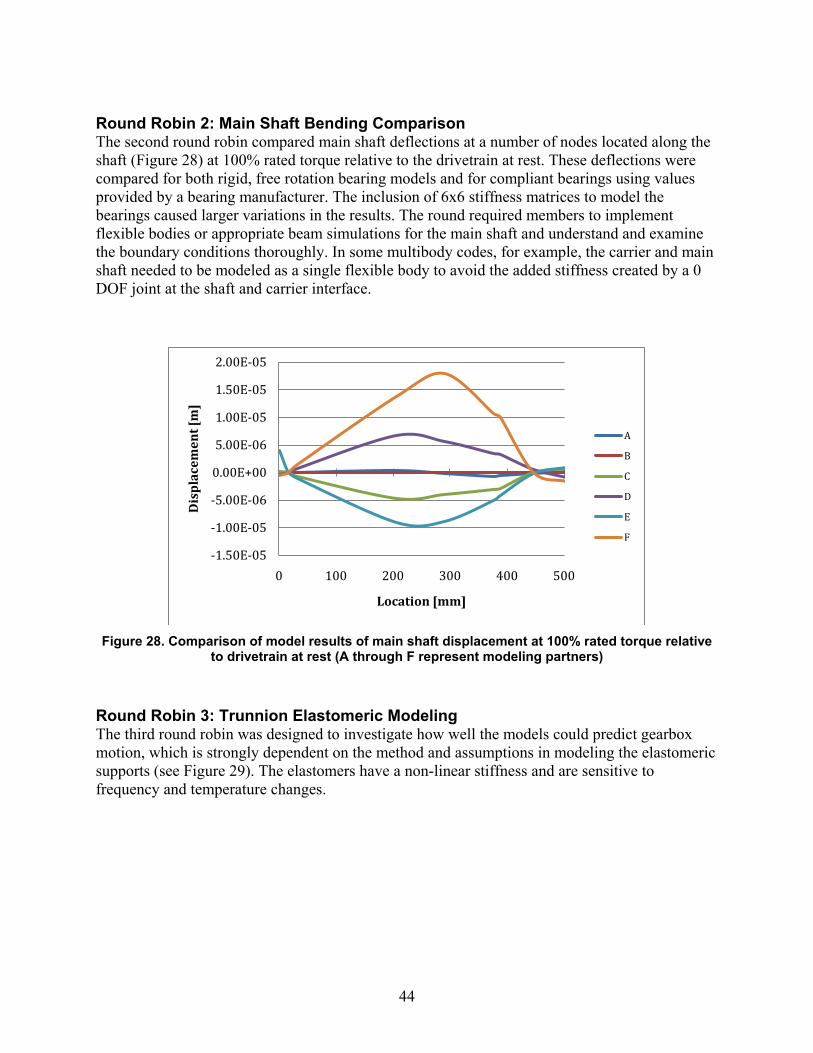
44
Round Robin 2: Main Shaft Bending Comparison The second round robin compared main shaft deflections at a number of nodes located along the shaft (Figure 28) at 100% rated torque relative to the drivetrain at rest. These deflections were compared for both rigid, free rotation bearing models and for compliant bearings using values provided by a bearing manufacturer. The inclusion of 6x6 stiffness matrices to model the bearings caused larger variations in the results. The round required members to implement flexible bodies or appropriate beam simulations for the main shaft and understand and examine the boundary conditions thoroughly. In some multibody codes, for example, the carrier and main shaft needed to be modeled as a single flexible body to avoid the added stiffness created by a 0 DOF joint at the shaft and carrier interface.
Figure 28. Comparison of model results of main shaft displacement at 100% rated torque relative
to drivetrain at rest (A through F represent modeling partners)
Round Robin 3: Trunnion Elastomeric Modeling The third round robin was designed to investigate how well the models could predict gearbox motion, which is strongly dependent on the method and assumptions in modeling the elastomeric supports (see Figure 29). The elastomers have a non-linear stiffness and are sensitive to frequency and temperature changes.
-1.50E-05
-1.00E-05
-5.00E-06
0.00E+00
5.00E-06
1.00E-05
1.50E-05
2.00E-05
0 100 200 300 400 500
Dis
pla
cem
ent [
m]
Location [mm]
A
B
C
D
E
F

45
Figure 29. Torque arm trunnion configuration and cutaway showing rubber element
Trunnion proximity sensors were used to calculate global gearbox motion (see Figure 30). Data was provided for the following cases:
• ~0 Torque, 0 NTL
• 25% Torque, 0 NTL
• ~0 Torque, static NTL
• Transient Start.
Figure 30. Dynamometer test setup showing trunnion LVDT proximity sensor (NREL PIX/19259)
Torque Arms
Rubber Mount
46
Participants developed elastomer material models and tuned them to a benchtop test conducted by Romax (Crowther & Zaidi 2010). Three different stiffness models used are shown in Figure 31 (A, B and C represent different modeling partners). The results of the study revealed that the elastomers were not commonly modeled with a non-linear spring in industry. However, some partners in the study conducted sensitivity studies and found that the gearbox internal responses were not significantly affected by the non-linear stiffness of the elastomer as long as the linear stiffness value used was within a reasonable limit.
Figure 31. Trunnion radial stiffness model results
Round Robin 4: Ring Gear Load Distribution The fourth round robin investigated the modeling of the load distribution across the ring gear face width using measured tooth root strain data. It also investigated the ability of models to produce an external load distribution at the measurement location on the test article. The goals were to validate the model load predictions and validate the external measurement of load distribution. Modelers were provided with a 100% steady state load case, which showed variation in the ring gear load distribution at the three measurement locations (see Figure 32).
0
100
200
300
400
500
600
0 2 4 6 8 10 12
Load
[kN
]
Displacement [mm]
Test A B C

47
Figure 32. Ring gear load distribution for 100% torque dynamometer testing
Modeling results are shown in Figure 33. Due to the limitations of the multibody software approach, these measurements could not be verified using multi body simulation (MBS) codes alone. Full FEA codes and hybrid codes with focus on gear contact analysis worked best for this comparison. Many factors contributed to the shifting ring gear load centroid, but the modelers generally found that flexible body models of the ring gear, carrier, and housing were necessary to predict the changing ring gear load. One modeler was able to capture the shifting effect only after increasing the fidelity of the model to full contact elements for all roller bearings in the gearbox (as opposed to the more common usage of a 6x6 stiffness matrix for bearing modeling). Accurate planet bearing, planet carrier, and ring gear modeling was necessary to capture the shifting load effect. The external strain gauge findings are presented in the Findings section.
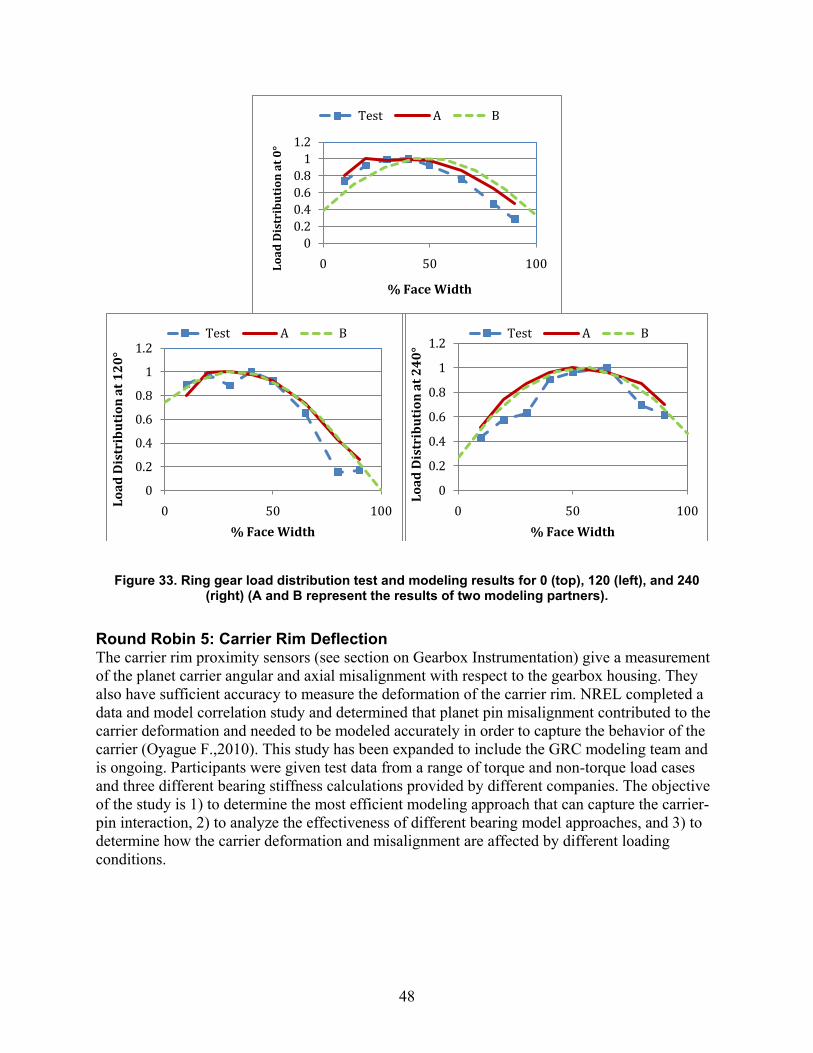
48
Figure 33. Ring gear load distribution test and modeling results for 0 (top), 120 (left), and 240 (right) (A and B represent the results of two modeling partners).
Round Robin 5: Carrier Rim Deflection The carrier rim proximity sensors (see section on Gearbox Instrumentation) give a measurement of the planet carrier angular and axial misalignment with respect to the gearbox housing. They also have sufficient accuracy to measure the deformation of the carrier rim. NREL completed a data and model correlation study and determined that planet pin misalignment contributed to the carrier deformation and needed to be modeled accurately in order to capture the behavior of the carrier (Oyague F.,2010). This study has been expanded to include the GRC modeling team and is ongoing. Participants were given test data from a range of torque and non-torque load cases and three different bearing stiffness calculations provided by different companies. The objective of the study is 1) to determine the most efficient modeling approach that can capture the carrier-pin interaction, 2) to analyze the effectiveness of different bearing model approaches, and 3) to determine how the carrier deformation and misalignment are affected by different loading conditions.
00.20.40.60.8
11.2
0 50 100Load
Dis
trib
uti
on a
t 0
°% Face Width
Test A B
0
0.2
0.4
0.6
0.8
1
1.2
0 50 100Load
Dis
trib
uti
on a
t 1
20
°
% Face Width
Test A B
0
0.2
0.4
0.6
0.8
1
1.2
0 50 100
Load
Dis
trib
uti
on a
t 2
40
°
% Face Width
Test A B

49
External Modeling Efforts Romax Romax performed an engineering analysis of the GRC test article (Wright, et al. 2011). In addition, Romax completed two sensitivity studies.
The first study was focused on the effect of non-torque loading on the gearbox bearings. The study shows that the impact of the non-torque loading would be limited to the bearings in the low speed and perhaps the planetary stages but would not impact the intermediate and high-speed stage bearings. See Figure 34.
Figure 34. Peak contact stress values for GRC gearbox bearings with varying values of pitch
moment. (This Romax figure designates pitch axis as the “X-axis”).
The second study examined the effect of bearing bore wear on the gear durability. The radial clearance of the upwind intermediate speed shaft bearing was changed. It showed a significant effect on the maximum stress on the high-speed shaft and intermediate shaft gear. This shows the importance of selecting and controlling this clearance in the design and manufacturing to achieve the appropriate gear life.
50
SKF SKF analyzed the GRC gearbox for bearing system response using an approach of increasing simulation complexity and load complexity in three phases. Using an in-house code capable of full finite element analysis, they began with a simplified model and static load case and progressed to modeling a fully flexible model system with transient torque spikes from measured field data. In Phase 1, they found that inclusion of a flexible housing improved the simulated load share at the TRBs of the two parallel stages (Raju, 2008). In Phase 2, a sensitivity study was conducted that showed that the planet bearing radial loads and life predictions were most sensitive to the planet bearing and carrier bearing operating clearances and misalignment (Raju, 2008). Phase 3 showed that planet bearing contact pressures exceeded the bearing ratings during a transient torque event in the field (Raju, 2010).
Future Work The test-modeling round robin studies have followed a progressive approach, working from outer measurement validation to internal measurement validation. In this regard, follow-on studies will compare modeling results to test data for planet tilt and sun pinion orbit. In addition, modal response comparisons are needed in order to validate the housing and carrier finite element meshes being used by GRC partners. These activities are planned for the following year.
Failure Database
Overall Project Development In October 2009, a Participant Register was created to track potential participants in the GRC database, and NREL began inviting membership in the database portion of the collaborative. Potential partners were sent nondisclosure agreements (NDAs) which ensured that NREL and the partners would protect proprietary information gathered by the project. By early 2010, the project had attracted about a dozen members who, collectively, represented about 17% of the total U.S. wind generating capacity. A monthly GRC Database Council conference call was established to provide a forum for participant feedback and information sharing. Recruiting efforts were put on hold for the remainder of calendar year 2010 to give the program a chance to mature and "work out the bugs." In early 2011, a presentation was made at the annual AWEA Operations and Maintenance conference and members were again invited. There are a number of new NDA requests in process.
In February of 2010, and again in February of 2011, GRC held conferences with the entire GRC membership. In both years, breakout sessions provided database partners an opportunity to help shape the program.
Software Development Simultaneously with the initial recruitment of partners, work began on a data model of a generic gearbox. The gearbox data modeling effort was intended to be comprehensive in order to include most of the detail that might be captured in the future. Once the model was complete, design was initiated for a software package to capture gearbox failure data in the field (on tower or in shop) during rebuilds. To keep the scope reasonable, the software implemented only those portions of the data model that were deemed critical to future research efforts. To keep costs low and development time short, the software was developed in house with a set of commonly available
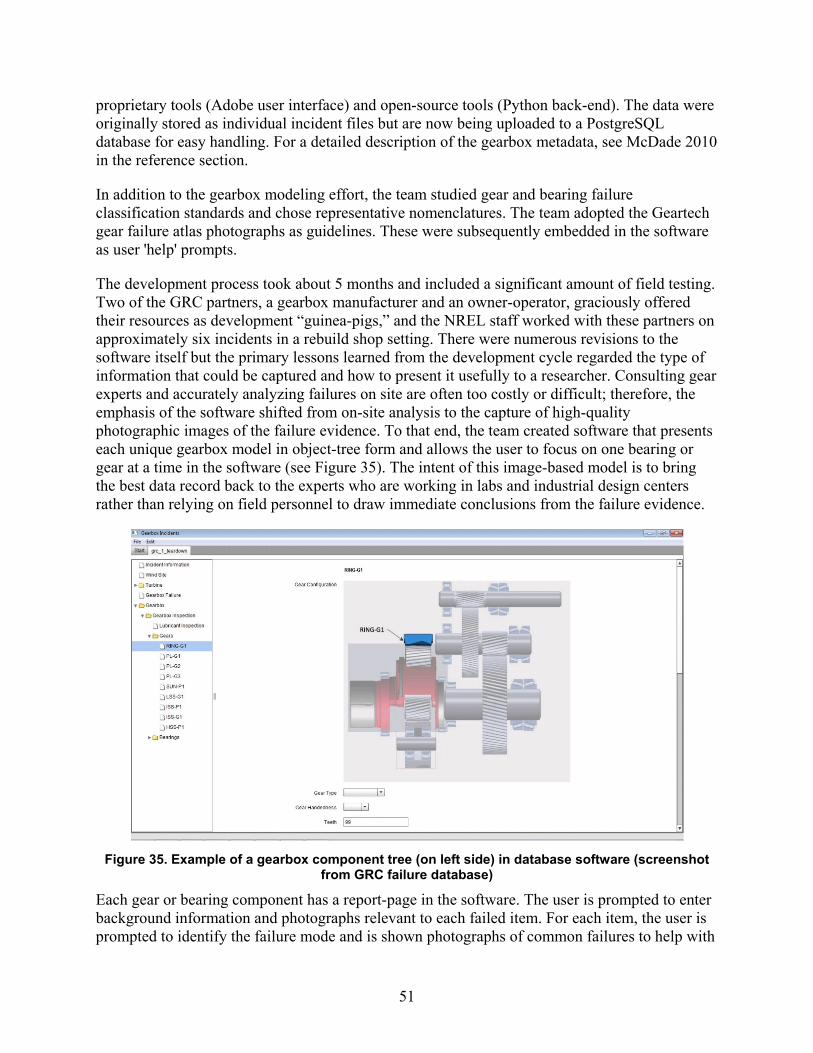
51
proprietary tools (Adobe user interface) and open-source tools (Python back-end). The data were originally stored as individual incident files but are now being uploaded to a PostgreSQL database for easy handling. For a detailed description of the gearbox metadata, see McDade 2010 in the reference section.
In addition to the gearbox modeling effort, the team studied gear and bearing failure classification standards and chose representative nomenclatures. The team adopted the Geartech gear failure atlas photographs as guidelines. These were subsequently embedded in the software as user 'help' prompts.
The development process took about 5 months and included a significant amount of field testing. Two of the GRC partners, a gearbox manufacturer and an owner-operator, graciously offered their resources as development “guinea-pigs,” and the NREL staff worked with these partners on approximately six incidents in a rebuild shop setting. There were numerous revisions to the software itself but the primary lessons learned from the development cycle regarded the type of information that could be captured and how to present it usefully to a researcher. Consulting gear experts and accurately analyzing failures on site are often too costly or difficult; therefore, the emphasis of the software shifted from on-site analysis to the capture of high-quality photographic images of the failure evidence. To that end, the team created software that presents each unique gearbox model in object-tree form and allows the user to focus on one bearing or gear at a time in the software (see Figure 35). The intent of this image-based model is to bring the best data record back to the experts who are working in labs and industrial design centers rather than relying on field personnel to draw immediate conclusions from the failure evidence.
Figure 35. Example of a gearbox component tree (on left side) in database software (screenshot
from GRC failure database)
Each gear or bearing component has a report-page in the software. The user is prompted to enter background information and photographs relevant to each failed item. For each item, the user is prompted to identify the failure mode and is shown photographs of common failures to help with
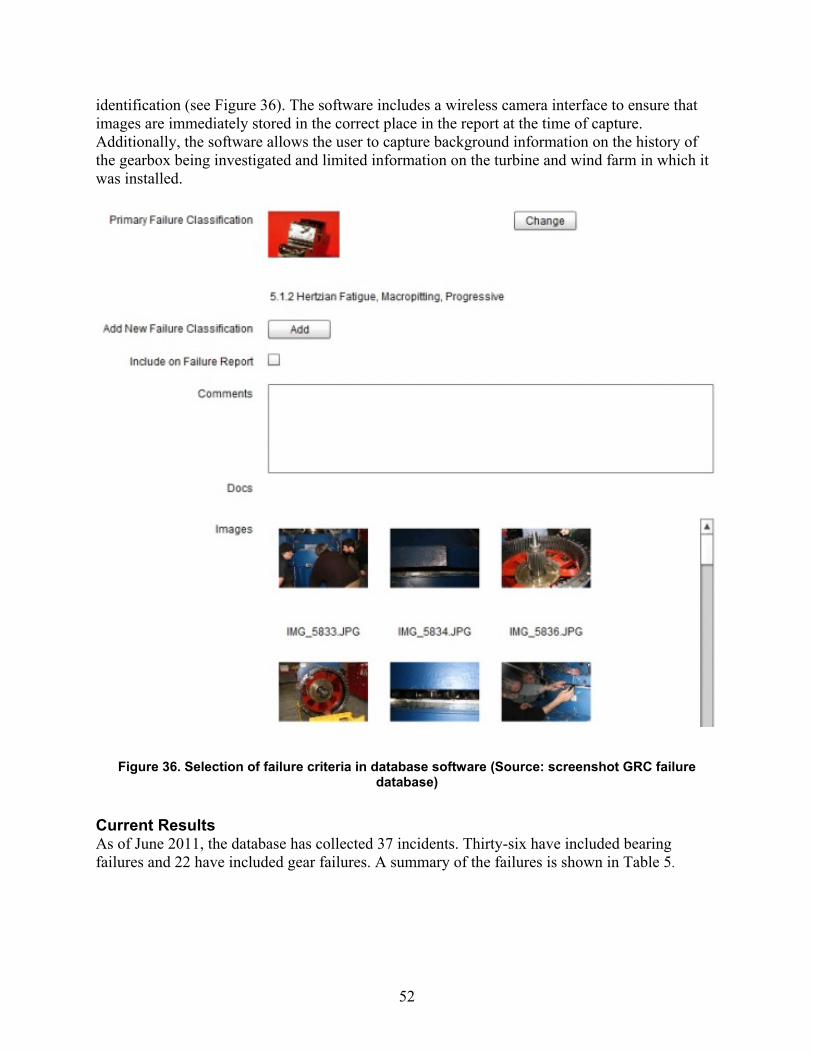
52
identification (see Figure 36). The software includes a wireless camera interface to ensure that images are immediately stored in the correct place in the report at the time of capture. Additionally, the software allows the user to capture background information on the history of the gearbox being investigated and limited information on the turbine and wind farm in which it was installed.
Figure 36. Selection of failure criteria in database software (Source: screenshot GRC failure database)
Current Results As of June 2011, the database has collected 37 incidents. Thirty-six have included bearing failures and 22 have included gear failures. A summary of the failures is shown in Table 5.
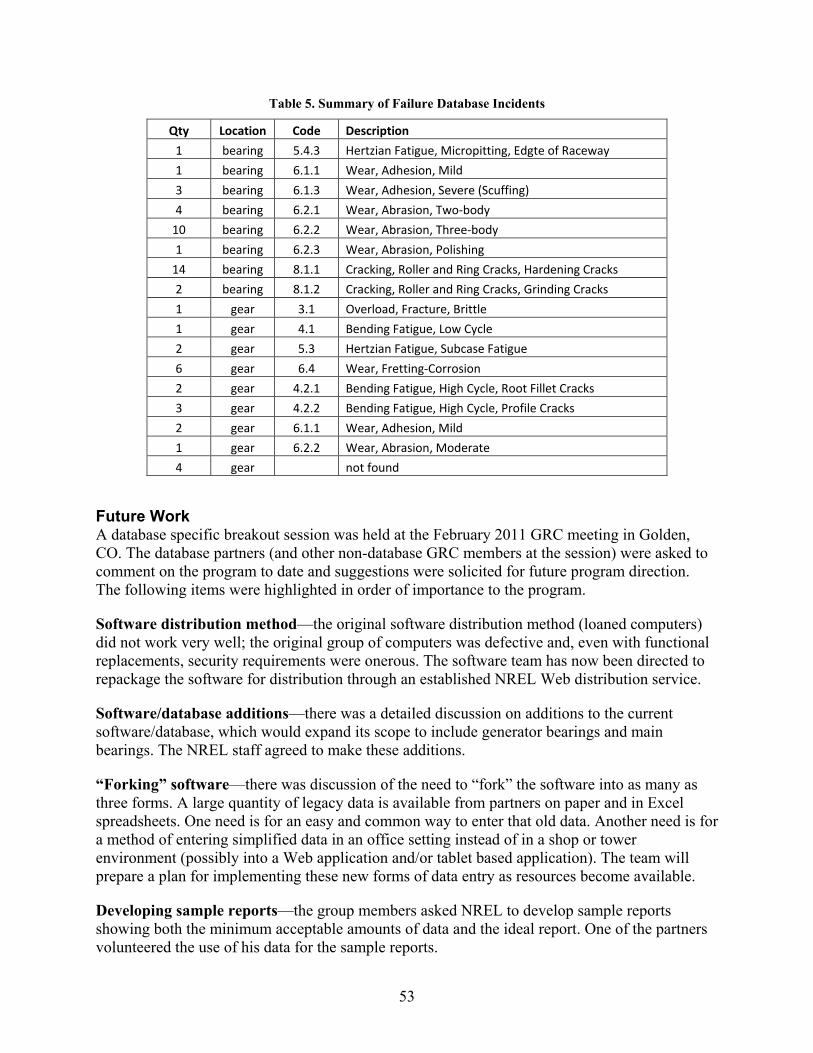
53
Table 5. Summary of Failure Database Incidents
Qty Location Code Description
1 bearing 5.4.3 Hertzian Fatigue, Micropitting, Edgte of Raceway
1 bearing 6.1.1 Wear, Adhesion, Mild
3 bearing 6.1.3 Wear, Adhesion, Severe (Scuffing)
4 bearing 6.2.1 Wear, Abrasion, Two-body
10 bearing 6.2.2 Wear, Abrasion, Three-body
1 bearing 6.2.3 Wear, Abrasion, Polishing
14 bearing 8.1.1 Cracking, Roller and Ring Cracks, Hardening Cracks
2 bearing 8.1.2 Cracking, Roller and Ring Cracks, Grinding Cracks
1 gear 3.1 Overload, Fracture, Brittle
1 gear 4.1 Bending Fatigue, Low Cycle
2 gear 5.3 Hertzian Fatigue, Subcase Fatigue
6 gear 6.4 Wear, Fretting-Corrosion
2 gear 4.2.1 Bending Fatigue, High Cycle, Root Fillet Cracks
3 gear 4.2.2 Bending Fatigue, High Cycle, Profile Cracks
2 gear 6.1.1 Wear, Adhesion, Mild
1 gear 6.2.2 Wear, Abrasion, Moderate
4 gear not found Future Work A database specific breakout session was held at the February 2011 GRC meeting in Golden, CO. The database partners (and other non-database GRC members at the session) were asked to comment on the program to date and suggestions were solicited for future program direction. The following items were highlighted in order of importance to the program.
Software distribution method—the original software distribution method (loaned computers) did not work very well; the original group of computers was defective and, even with functional replacements, security requirements were onerous. The software team has now been directed to repackage the software for distribution through an established NREL Web distribution service.
Software/database additions—there was a detailed discussion on additions to the current software/database, which would expand its scope to include generator bearings and main bearings. The NREL staff agreed to make these additions.
“Forking” software—there was discussion of the need to “fork” the software into as many as three forms. A large quantity of legacy data is available from partners on paper and in Excel spreadsheets. One need is for an easy and common way to enter that old data. Another need is for a method of entering simplified data in an office setting instead of in a shop or tower environment (possibly into a Web application and/or tablet based application). The team will prepare a plan for implementing these new forms of data entry as resources become available.
Developing sample reports—the group members asked NREL to develop sample reports showing both the minimum acceptable amounts of data and the ideal report. One of the partners volunteered the use of his data for the sample reports.
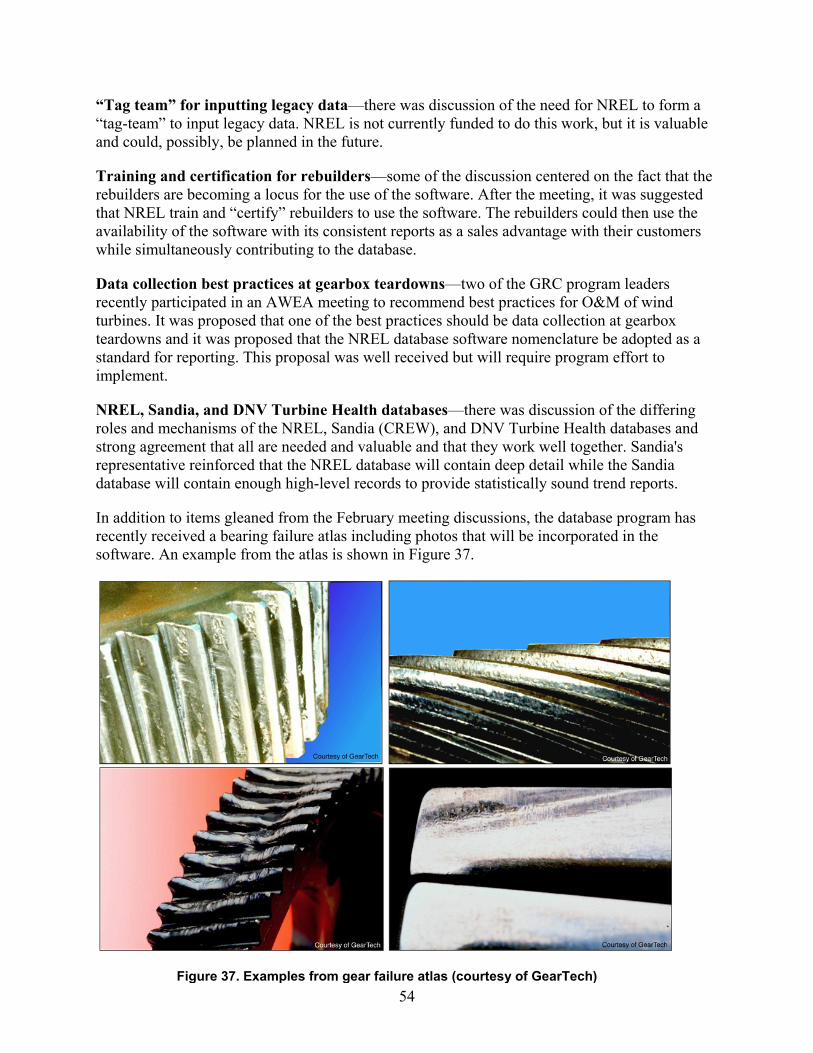
54
“Tag team” for inputting legacy data—there was discussion of the need for NREL to form a “tag-team” to input legacy data. NREL is not currently funded to do this work, but it is valuable and could, possibly, be planned in the future.
Training and certification for rebuilders—some of the discussion centered on the fact that the rebuilders are becoming a locus for the use of the software. After the meeting, it was suggested that NREL train and “certify” rebuilders to use the software. The rebuilders could then use the availability of the software with its consistent reports as a sales advantage with their customers while simultaneously contributing to the database.
Data collection best practices at gearbox teardowns—two of the GRC program leaders recently participated in an AWEA meeting to recommend best practices for O&M of wind turbines. It was proposed that one of the best practices should be data collection at gearbox teardowns and it was proposed that the NREL database software nomenclature be adopted as a standard for reporting. This proposal was well received but will require program effort to implement.
NREL, Sandia, and DNV Turbine Health databases—there was discussion of the differing roles and mechanisms of the NREL, Sandia (CREW), and DNV Turbine Health databases and strong agreement that all are needed and valuable and that they work well together. Sandia's representative reinforced that the NREL database will contain deep detail while the Sandia database will contain enough high-level records to provide statistically sound trend reports.
In addition to items gleaned from the February meeting discussions, the database program has recently received a bearing failure atlas including photos that will be incorporated in the software. An example from the atlas is shown in Figure 37.
Figure 37. Examples from gear failure atlas (courtesy of GearTech)
55
Once adequate data have been collected, the database team will need to focus on providing data summaries, which are valuable to industry. The first will be simple Pareto charts, which help researchers and industry to focus on the most common problems. Beyond that, the program envisions more sophisticated analyses that can range from root-cause investigations of details such as alloy failures to more general analysis which, in conjunction with the Sandia and DNV data efforts, could pinpoint individual wind regimes that cause more gearbox problems than others. The data are also envisioned to be a resource for the GRC Modeling team's efforts to upgrade gearbox design tools.
Conclusions The database effort is widely acknowledged in the wind industry as an important step in quantifying gearbox-related problems. Anecdotal information indicates that there have been a variety of gearbox-related issues across the spectrum from design to manufacturing to maintenance. The GRC database is the first industry-wide U.S. effort to collect verifiable data on the extent and nature of the problems. After a little less than a year of work, it is obvious that this is not the usual research project; it resembles a sales effort more than a laboratory research program.
To be of value, the database needs a large number of entries that are representative of the entire span of field failures. To achieve this level of data population, project managers must constantly stay in contact with participants, overcoming resistance to using the database. Potential participants are often excited about the program but reluctant to sign the NDA and actually start collecting data. These people will need additional information and personal contact outlining the value of the program to participants and to the industry as a whole. Existing participants have been enthusiastic at meetings but less forthcoming with data. To achieve maximum participation, the program will need to provide improved software, more personal contact, and more hands-on data collection. To achieve success, the program will also need to take responsibility for developing innovative ways to capture legacy data. The key to program success will be a high level of personal contact with participants including help with data entry, training in photography and use of the software, and personal involvement in initial gearbox teardown efforts for new users.
The NREL team's primary conclusion is that populating the GRC database is a tremendously valuable process, which will take patience and human resources, but will be well worth the effort in understanding gearbox failure causes.
Condition Monitoring
Testing CM research was conducted under the GRC by working with commercial equipment suppliers and O&M partners. The monitoring systems used at different stages of the GRC tests are listed in Table 6. For detailed description of these different systems, please refer to the Phase 1 and 2 test plan (to be published). A graphic illustration of the system setup for Phase 2 of the dynamometer testing of Gearbox 2 is shown in Figure 38. In this figure, the different commercial monitoring packages are not spelled out. Instead the different types of monitoring techniques that these packages represent are used.

56
Figure 38. CM system setup in the Phase 2 dynamometer testing of Gearbox 2
Table 6. CM System Implementation at Different Stages of the GRC Tests
Make Model Dynamometer
Testing of Gearbox 1
Field Testing of Gearbox 1
Phase 1 Dynamometer
Testing of Gearbox 2
Phase 2 Dynamometer
Testing of Gearbox 2
Dynamometer Re-Testing of
Gearbox 1
SKF
WindCon X X X X X
Dynamic Motor Analyzer X X
SwanTech SWANwind X X X X X
Kittiwake
Online Sensor Suite X X X X X
Particle Content Sensor X X X
Macom TechAlert10 X X X X X
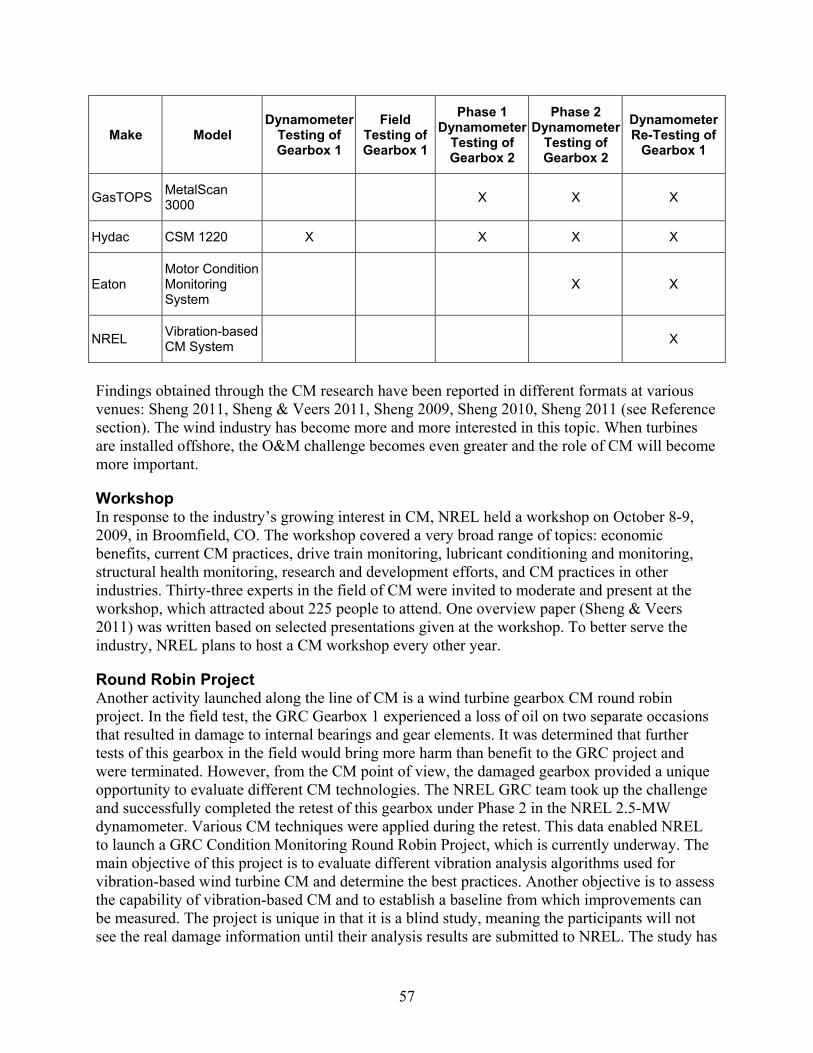
57
Make Model Dynamometer
Testing of Gearbox 1
Field Testing of Gearbox 1
Phase 1 Dynamometer
Testing of Gearbox 2
Phase 2 Dynamometer
Testing of Gearbox 2
Dynamometer Re-Testing of
Gearbox 1
GasTOPS MetalScan 3000 X X X
Hydac CSM 1220 X X X X
Eaton Motor Condition Monitoring System
X X
NREL Vibration-based CM System X
Findings obtained through the CM research have been reported in different formats at various venues: Sheng 2011, Sheng & Veers 2011, Sheng 2009, Sheng 2010, Sheng 2011 (see Reference section). The wind industry has become more and more interested in this topic. When turbines are installed offshore, the O&M challenge becomes even greater and the role of CM will become more important.
Workshop In response to the industry’s growing interest in CM, NREL held a workshop on October 8-9, 2009, in Broomfield, CO. The workshop covered a very broad range of topics: economic benefits, current CM practices, drive train monitoring, lubricant conditioning and monitoring, structural health monitoring, research and development efforts, and CM practices in other industries. Thirty-three experts in the field of CM were invited to moderate and present at the workshop, which attracted about 225 people to attend. One overview paper (Sheng & Veers 2011) was written based on selected presentations given at the workshop. To better serve the industry, NREL plans to host a CM workshop every other year.
Round Robin Project Another activity launched along the line of CM is a wind turbine gearbox CM round robin project. In the field test, the GRC Gearbox 1 experienced a loss of oil on two separate occasions that resulted in damage to internal bearings and gear elements. It was determined that further tests of this gearbox in the field would bring more harm than benefit to the GRC project and were terminated. However, from the CM point of view, the damaged gearbox provided a unique opportunity to evaluate different CM technologies. The NREL GRC team took up the challenge and successfully completed the retest of this gearbox under Phase 2 in the NREL 2.5-MW dynamometer. Various CM techniques were applied during the retest. This data enabled NREL to launch a GRC Condition Monitoring Round Robin Project, which is currently underway. The main objective of this project is to evaluate different vibration analysis algorithms used for vibration-based wind turbine CM and determine the best practices. Another objective is to assess the capability of vibration-based CM and to establish a baseline from which improvements can be measured. The project is unique in that it is a blind study, meaning the participants will not see the real damage information until their analysis results are submitted to NREL. The study has
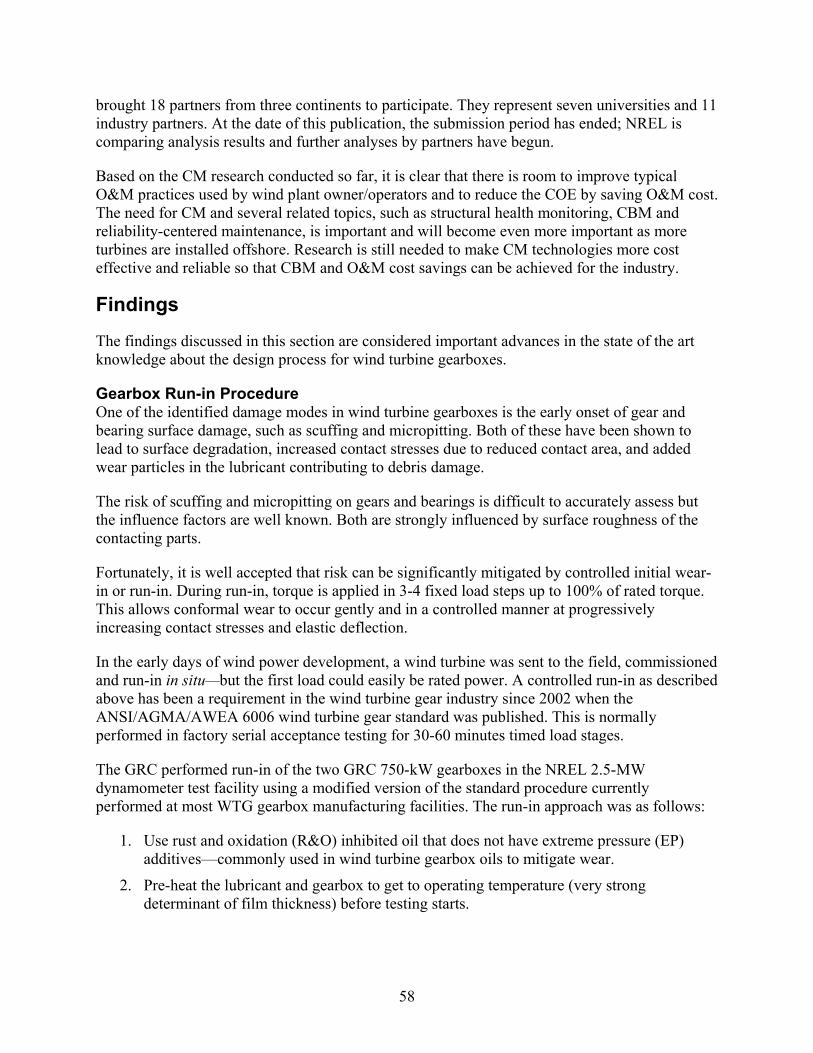
58
brought 18 partners from three continents to participate. They represent seven universities and 11 industry partners. At the date of this publication, the submission period has ended; NREL is comparing analysis results and further analyses by partners have begun.
Based on the CM research conducted so far, it is clear that there is room to improve typical O&M practices used by wind plant owner/operators and to reduce the COE by saving O&M cost. The need for CM and several related topics, such as structural health monitoring, CBM and reliability-centered maintenance, is important and will become even more important as more turbines are installed offshore. Research is still needed to make CM technologies more cost effective and reliable so that CBM and O&M cost savings can be achieved for the industry.
Findings
The findings discussed in this section are considered important advances in the state of the art knowledge about the design process for wind turbine gearboxes.
Gearbox Run-in Procedure One of the identified damage modes in wind turbine gearboxes is the early onset of gear and bearing surface damage, such as scuffing and micropitting. Both of these have been shown to lead to surface degradation, increased contact stresses due to reduced contact area, and added wear particles in the lubricant contributing to debris damage.
The risk of scuffing and micropitting on gears and bearings is difficult to accurately assess but the influence factors are well known. Both are strongly influenced by surface roughness of the contacting parts.
Fortunately, it is well accepted that risk can be significantly mitigated by controlled initial wear-in or run-in. During run-in, torque is applied in 3-4 fixed load steps up to 100% of rated torque. This allows conformal wear to occur gently and in a controlled manner at progressively increasing contact stresses and elastic deflection.
In the early days of wind power development, a wind turbine was sent to the field, commissioned and run-in in situ—but the first load could easily be rated power. A controlled run-in as described above has been a requirement in the wind turbine gear industry since 2002 when the ANSI/AGMA/AWEA 6006 wind turbine gear standard was published. This is normally performed in factory serial acceptance testing for 30-60 minutes timed load stages.
The GRC performed run-in of the two GRC 750-kW gearboxes in the NREL 2.5-MW dynamometer test facility using a modified version of the standard procedure currently performed at most WTG gearbox manufacturing facilities. The run-in approach was as follows:
1. Use rust and oxidation (R&O) inhibited oil that does not have extreme pressure (EP) additives—commonly used in wind turbine gearbox oils to mitigate wear.
2. Pre-heat the lubricant and gearbox to get to operating temperature (very strong determinant of film thickness) before testing starts.
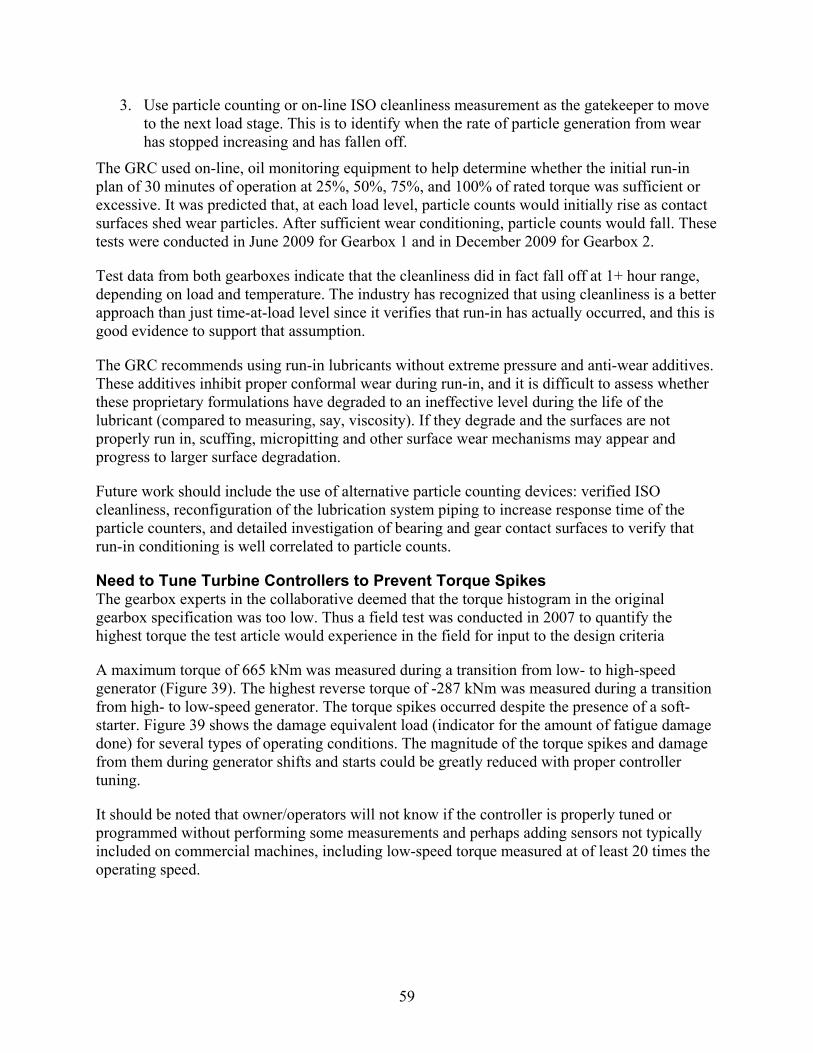
59
3. Use particle counting or on-line ISO cleanliness measurement as the gatekeeper to move to the next load stage. This is to identify when the rate of particle generation from wear has stopped increasing and has fallen off.
The GRC used on-line, oil monitoring equipment to help determine whether the initial run-in plan of 30 minutes of operation at 25%, 50%, 75%, and 100% of rated torque was sufficient or excessive. It was predicted that, at each load level, particle counts would initially rise as contact surfaces shed wear particles. After sufficient wear conditioning, particle counts would fall. These tests were conducted in June 2009 for Gearbox 1 and in December 2009 for Gearbox 2.
Test data from both gearboxes indicate that the cleanliness did in fact fall off at 1+ hour range, depending on load and temperature. The industry has recognized that using cleanliness is a better approach than just time-at-load level since it verifies that run-in has actually occurred, and this is good evidence to support that assumption.
The GRC recommends using run-in lubricants without extreme pressure and anti-wear additives. These additives inhibit proper conformal wear during run-in, and it is difficult to assess whether these proprietary formulations have degraded to an ineffective level during the life of the lubricant (compared to measuring, say, viscosity). If they degrade and the surfaces are not properly run in, scuffing, micropitting and other surface wear mechanisms may appear and progress to larger surface degradation.
Future work should include the use of alternative particle counting devices: verified ISO cleanliness, reconfiguration of the lubrication system piping to increase response time of the particle counters, and detailed investigation of bearing and gear contact surfaces to verify that run-in conditioning is well correlated to particle counts.
Need to Tune Turbine Controllers to Prevent Torque Spikes The gearbox experts in the collaborative deemed that the torque histogram in the original gearbox specification was too low. Thus a field test was conducted in 2007 to quantify the highest torque the test article would experience in the field for input to the design criteria
A maximum torque of 665 kNm was measured during a transition from low- to high-speed generator (Figure 39). The highest reverse torque of -287 kNm was measured during a transition from high- to low-speed generator. The torque spikes occurred despite the presence of a soft-starter. Figure 39 shows the damage equivalent load (indicator for the amount of fatigue damage done) for several types of operating conditions. The magnitude of the torque spikes and damage from them during generator shifts and starts could be greatly reduced with proper controller tuning.
It should be noted that owner/operators will not know if the controller is properly tuned or programmed without performing some measurements and perhaps adding sensors not typically included on commercial machines, including low-speed torque measured at of least 20 times the operating speed.
60
Figure 39. Measured damage equivalent loads per type of event
Effect of Main Shaft Bending Moments on Gearbox Gearboxes are designed primarily to withstand torque loads exerted by input and output shafts and reacted by connections between housing and frame. Non-torque loads such as shaft thrust and bending have historically been left out of the dynamometer test validation process. However, in wind turbines, especially those with three-point suspensions, many experts suspect that this assumption is not valid and could be a major contributor to gearbox problems in wind turbines. The GRC systematically applied non-torque loads in dynamometer tests to assess their effects. Results indicate that these loads do affect tooth contact patterns in the low-speed stage in a manner that could shorten gearbox life (LaCava 2011). Further analysis is planned to determine effects on other internal components (such as bearings) and to identify how to account for this effect in the design.
These findings were based on Phase 2 dynamometer tests of Gearbox 2. Preliminary analysis has included assessment of low-speed shaft bending, gearbox displacement and rotation, and tooth mesh patterns between the planets and the ring gear. Bending in the main shaft was found to affect the planet-ring gear mesh pattern and planet carrier misalignment. The gear load distribution shift was large enough, in some cases, to result in a significant increase in edge loading. Edge loading is known to contribute to high contact stresses and shorter gear life. Figure 40 shows an example of the effect for three separate non-torque load cases.
0
50
100
150
200
250
-50 0 50 100 150 200 250 300 350 400
Ten minute mean torque [kNm]
Dam
age
Equi
vale
nt lo
ad (6
00 s
ec, 1
Hz,
m=
6) [k
Nm
]
normal operationidleparkeddownshiftupshiftstartstop
61
Figure 40. Ring gear edge loading caused by non-torque loading
Additional work is needed to better understand this phenomenon. First, the test conditions and data are to be distributed to GRC members to enable detailed modeling and analysis. This analysis is expected to suggest which features of the GRC gearbox design contribute most to the observed phenomenon. Second, changes in the GRC gearbox design for Phase 3 testing could be implemented to verify whether proposed improvements are effective.
Effect of Main Shaft Thrust Loads on Gearbox Another non-torque load is the axial force of thrust of the turbine rotor on the drivetrain. In typical configurations, this load should be transmitted solely through the main bearing to the drivetrain main frame support structure. The gearbox should be uncoupled from it. However, the main bearing permits small axial displacements of the main shaft during occasional thrust reversals that have been observed in field testing. It is possible that these displacements might cause damage inside the gearbox. NREL conducted a test in Phase 2, Gearbox 2 testing to assess the potential of thrust loads to affect gearbox behavior. The thrust actuator in the non-torque loading equipment was used to apply positive and negative thrust up to 50 kN in a cyclical fashion. At low frequencies no changes were noted to gearbox internal behavior. Expectations were that, at high frequencies, gearbox inertia would cause relative motion between the main shaft and the gearbox housing, which could cause internal changes. However, the non-torque loading controller was not able to apply reversing loads above 3 Hz during this test sequence. So no internal gearbox effects were observed.
This initial result is not conclusive. Future work can enable the non-torque loading equipment to apply loads at the desired frequencies and to explore loads of greater magnitude. Alternatively, axial loads may be applied to the gearbox housing directly rather than on the upwind end of the main shaft bearing.
Planet-Bearing Load Share Field testing has shown that there are significant loading differences between the upwind and downwind rows of planet bearings in the first stage of the gearbox (see Figure 41). We found that the effect of the overhung weight of the rotor causes planet carrier and housing motions and elastic deflections that contribute significantly to shifting of the upwind/ downwind planet bearing load share. Dynamic upwind/downwind variations occur most dramatically at low to
<-Upwind Downwind->0
200
400
600
800
1000
1200
1400
1600
1800
2000
Gear Face Width
µ Stra
in
Ring Gear Load Distribution at 120°
MY = -180 kNmMY = 0 kNmMY = 170 kNm
<-Upwind Downwind->0
200
400
600
800
1000
1200
1400
1600
1800
2000
Gear Face Width
µ Stra
in
Ring Gear Load Distribution at 240°
MY = -180 kNmMY = 0 kNmMY = 170 kNm

62
moderate loads (50% or lower). There is also evidence that bearing and planet pin fits contribute to carrier dynamic deflection (Oyague, 2010).
Figure 41. Mean pin load distribution for rated torque field test for three planets pins A, B and C
In addition, the load share between the planets varies once per revolution, as shown in Figure 42. These time-varying loads have been shown to reduce gearbox life in GRC partner studies (Crowther 2010). These results suggest that the complete carrier, gearbox support structure, and the gear and bearing elements should be modeled together to capture the system effects.
Figure 42. Planet load share versus main shaft rotation for three planets designated A, B and C
<-Upwind Downwind->
Load
ABC
0 50 100 150 200 250 300 3500.5
0.6
0.7
0.8
0.9
1
1.1
1.2
1.3
1.4
1.5
Main Shaft Azimuth [deg]
Kγ
Planet Load Share vs Main Shaft Rotation
ABC
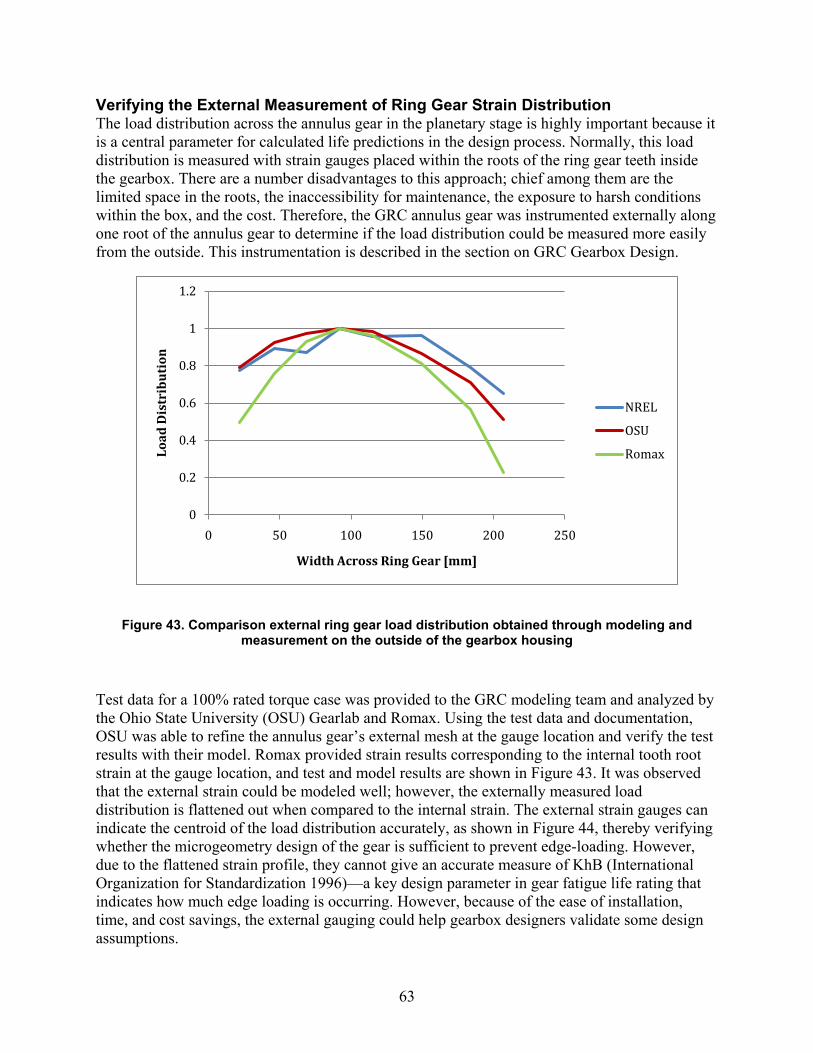
63
Verifying the External Measurement of Ring Gear Strain Distribution The load distribution across the annulus gear in the planetary stage is highly important because it is a central parameter for calculated life predictions in the design process. Normally, this load distribution is measured with strain gauges placed within the roots of the ring gear teeth inside the gearbox. There are a number disadvantages to this approach; chief among them are the limited space in the roots, the inaccessibility for maintenance, the exposure to harsh conditions within the box, and the cost. Therefore, the GRC annulus gear was instrumented externally along one root of the annulus gear to determine if the load distribution could be measured more easily from the outside. This instrumentation is described in the section on GRC Gearbox Design.
Figure 43. Comparison external ring gear load distribution obtained through modeling and measurement on the outside of the gearbox housing
Test data for a 100% rated torque case was provided to the GRC modeling team and analyzed by the Ohio State University (OSU) Gearlab and Romax. Using the test data and documentation, OSU was able to refine the annulus gear’s external mesh at the gauge location and verify the test results with their model. Romax provided strain results corresponding to the internal tooth root strain at the gauge location, and test and model results are shown in Figure 43. It was observed that the external strain could be modeled well; however, the externally measured load distribution is flattened out when compared to the internal strain. The external strain gauges can indicate the centroid of the load distribution accurately, as shown in Figure 44, thereby verifying whether the microgeometry design of the gear is sufficient to prevent edge-loading. However, due to the flattened strain profile, they cannot give an accurate measure of KhB (International Organization for Standardization 1996)—a key design parameter in gear fatigue life rating that indicates how much edge loading is occurring. However, because of the ease of installation, time, and cost savings, the external gauging could help gearbox designers validate some design assumptions.
0
0.2
0.4
0.6
0.8
1
1.2
0 50 100 150 200 250
Load
Dis
trib
uti
on
Width Across Ring Gear [mm]
NREL
OSU
Romax
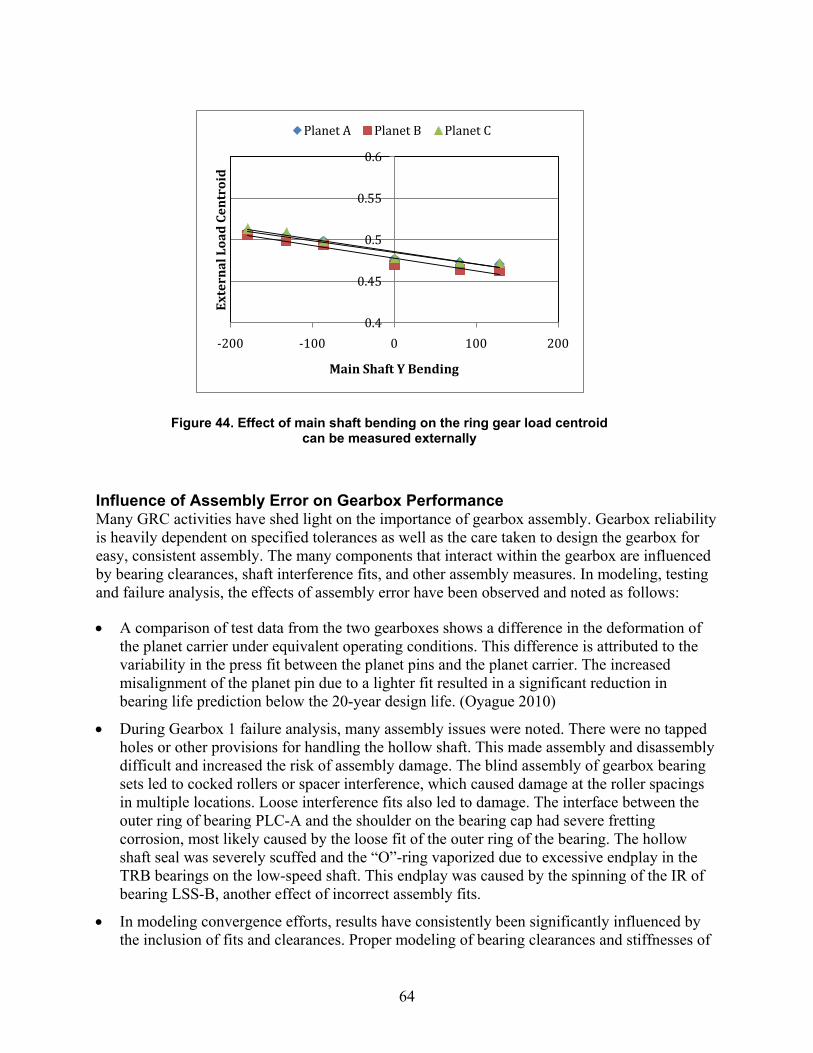
64
Influence of Assembly Error on Gearbox Performance Many GRC activities have shed light on the importance of gearbox assembly. Gearbox reliability is heavily dependent on specified tolerances as well as the care taken to design the gearbox for easy, consistent assembly. The many components that interact within the gearbox are influenced by bearing clearances, shaft interference fits, and other assembly measures. In modeling, testing and failure analysis, the effects of assembly error have been observed and noted as follows:
• A comparison of test data from the two gearboxes shows a difference in the deformation of the planet carrier under equivalent operating conditions. This difference is attributed to the variability in the press fit between the planet pins and the planet carrier. The increased misalignment of the planet pin due to a lighter fit resulted in a significant reduction in bearing life prediction below the 20-year design life. (Oyague 2010)
• During Gearbox 1 failure analysis, many assembly issues were noted. There were no tapped holes or other provisions for handling the hollow shaft. This made assembly and disassembly difficult and increased the risk of assembly damage. The blind assembly of gearbox bearing sets led to cocked rollers or spacer interference, which caused damage at the roller spacings in multiple locations. Loose interference fits also led to damage. The interface between the outer ring of bearing PLC-A and the shoulder on the bearing cap had severe fretting corrosion, most likely caused by the loose fit of the outer ring of the bearing. The hollow shaft seal was severely scuffed and the “O”-ring vaporized due to excessive endplay in the TRB bearings on the low-speed shaft. This endplay was caused by the spinning of the IR of bearing LSS-B, another effect of incorrect assembly fits.
• In modeling convergence efforts, results have consistently been significantly influenced by the inclusion of fits and clearances. Proper modeling of bearing clearances and stiffnesses of
Figure 44. Effect of main shaft bending on the ring gear load centroid can be measured externally
0.4
0.45
0.5
0.55
0.6
-200 -100 0 100 200
Exte
rnal
Loa
d C
entr
oid
Main Shaft Y Bending
Planet A Planet B Planet C

65
contact elements, especially in the planetary stage, is critical in order to capture accurate carrier deformation, main shaft bending, and ring gear load distribution.
• Modeling of the GRC gearbox has been used to show that optimized clearances in the planetary stage can significantly reduce time-varying contact stresses (Crowther 2010) and thus result in longer gearbox life.
It is up to designers to understand and model these variations and optimizations and apply them in a practical and robust assembly specification.
Improved Instrumentation Based on the experiences of data acquisition and processing and the feedback GRC members have provided on the analysis and presentations of test data, the following instrumentation improvements are advised for the next round of testing.
• Measurement of oil flow to each distribution point within the gearbox to verify the efficacy of the lubrication system
• Pressure differential measurements of each lubrication system filter element to quantify efficiency losses
• High-speed shaft torque and bending, and angular position measurements to better quantify gearbox loading, high-speed shaft bending, and total transmission error
• More locations for external strain gages on ring gear to study the ring load shift and ring gear flexibility in more depth
• Manifold pressure and sump level to ensure proper lubrication in the field
• Planet gages located in more positions in the bearing load zone
• Load distribution on the sun to study the effectiveness of the floating configuration
• Bearing load sensing.
The GRC measured loads on bearings with an axial groove configuration. This configuration in combination with appropriate data analysis methods enabled NREL and their partners to use these signals to calculate planet load share and the circumferential and axial distribution of bearing radial loads. There is a wealth of information in these data that the GRC will continue to investigate.
However, the groove configuration was not ideal for measurement of load distribution within each bearing. There were too few grooves and they were located on the assumption that the pressure distribution would be symmetrical about the “top dead center” position, which corresponds to the direction of motion of each planet. Subsequent analysis by Timken (Marks 2011) indicated that pressure distribution is skewed toward the planet/sun mesh due to the helix angle of the planet teeth. Circumferential grooves with more gages throughout the load zone may provide superior resolution of this phenomenon.
Failure Database Development A key finding from the database development project area was the need to categorize failures into generally recognized failure modes (micropitting, scuffing, etc). This was facilitated by
66
incorporating reference pictures directly into the database software program. Also of value is a standardized reporting format. Several participants have adopted this strategy into their standard operations. They have found commercial value in claiming adherence to standardized categorization and reporting methods.
CM Findings There were no standards in the industry to follow for conducting the run-in test of wind turbine gearboxes. Normally, a time interval-based approach is adopted. The GRC run-in tests have shown that ISO cleanliness measurement could be used to monitor and control the run-in of wind turbine gearboxes. It was observed that the ISO cleanliness levels, especially the readings from the 14 microns bin, increase with the start up of run-in at a certain load level and the readings will level off, which can be used to determine when to stop the run-in at one load level and step up to a higher level.
Wind turbine owner/operators have different opinions on the potential benefits of CM systems despite the fact that they have been successfully used in other more mature industries and demonstrated cost savings through earlier damage detection. Also, owner/operators may rely solely on CM equipment suppliers to determine which technique to choose from and may get the misconception that one CM system can detect all problems seen in wind turbines. The GRC tests have demonstrated that different monitoring techniques can reveal different details of the monitored drivetrain components. As a result, an integrated approach is recommended. For additional information, please refer to Sheng 2009 and Sheng 2011.
For oil debris monitoring, different venders have different claims on the effectiveness of placing sensors in either the inline or offline filtration loop. The GRC test results have indicated that wear debris count appears effective for monitoring machine, but its reading is affected by sensor mounting locations. If the sensor mounting location is appropriate, similar trends in wear debris counts between the offline filter loop and the inline filter loop can be obtained. Additional information can be found in Sheng 2011.
There are still some debates on how beneficial oil conditioning might be. The GRC tests have demonstrated that lubrication oil filtration, moisture prevention by breathers, and heat control are useful to keep wind turbine gearbox oil dry and clean. For additional information, please refer to Sheng 2010 and Sheng 2011.
Gearbox 1 Failure Analysis After multiple oil losses in the field and condition monitoring testing in the dynamometer, Gearbox 1 was sent for disassembly and inspection. GEARTECH was contracted to perform the failure analysis (Errichello 2011). Simultaneously, the inspection was used as an opportunity to gather measurements of bearing clearances, shaft end play, housing bore alignment, shaft and bore interference fits, and gear microgeometry. These measurements are currently being used in modeling efforts.
Failure Findings The primary failure mode of the HS gearset was severe scuffing. The root cause of failure was most likely lubricant starvation. The wear pattern indicates the HS gear mesh was misaligned causing higher load at the rotor end of the teeth. Figure 45 shows the damage.
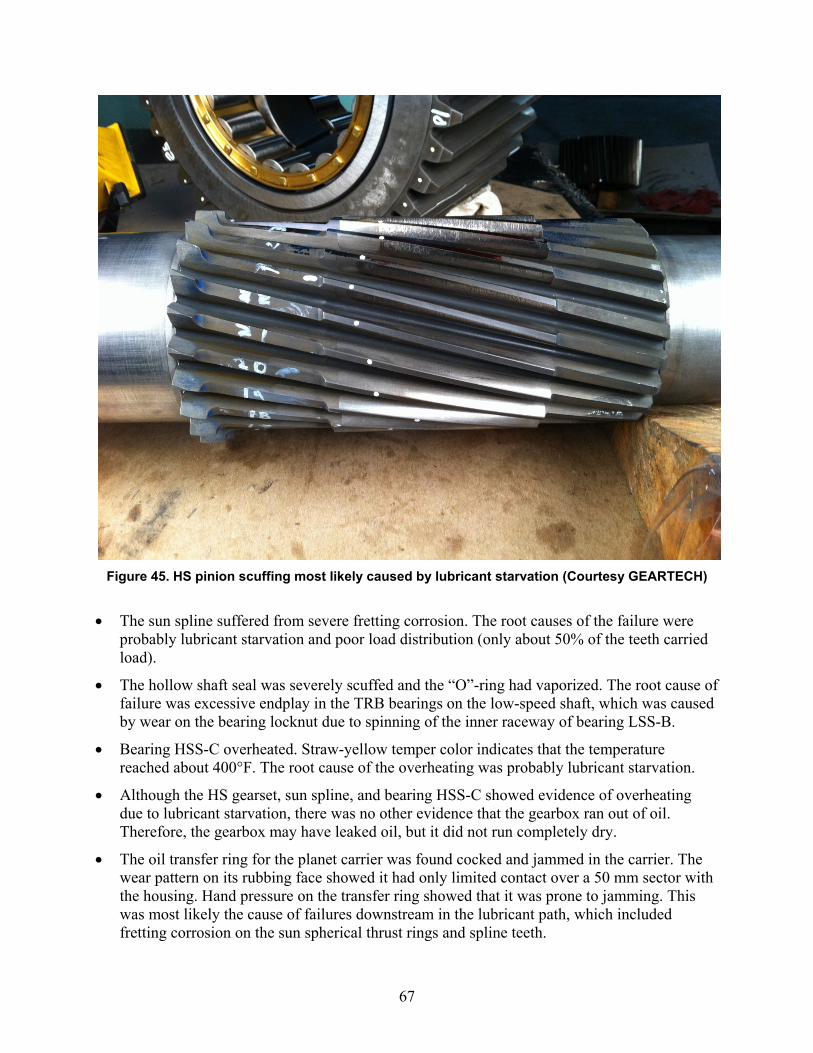
67
Figure 45. HS pinion scuffing most likely caused by lubricant starvation (Courtesy GEARTECH)
• The sun spline suffered from severe fretting corrosion. The root causes of the failure were
probably lubricant starvation and poor load distribution (only about 50% of the teeth carried load).
• The hollow shaft seal was severely scuffed and the “O”-ring had vaporized. The root cause of failure was excessive endplay in the TRB bearings on the low-speed shaft, which was caused by wear on the bearing locknut due to spinning of the inner raceway of bearing LSS-B.
• Bearing HSS-C overheated. Straw-yellow temper color indicates that the temperature reached about 400°F. The root cause of the overheating was probably lubricant starvation.
• Although the HS gearset, sun spline, and bearing HSS-C showed evidence of overheating due to lubricant starvation, there was no other evidence that the gearbox ran out of oil. Therefore, the gearbox may have leaked oil, but it did not run completely dry.
• The oil transfer ring for the planet carrier was found cocked and jammed in the carrier. The wear pattern on its rubbing face showed it had only limited contact over a 50 mm sector with the housing. Hand pressure on the transfer ring showed that it was prone to jamming. This was most likely the cause of failures downstream in the lubricant path, which included fretting corrosion on the sun spherical thrust rings and spline teeth.
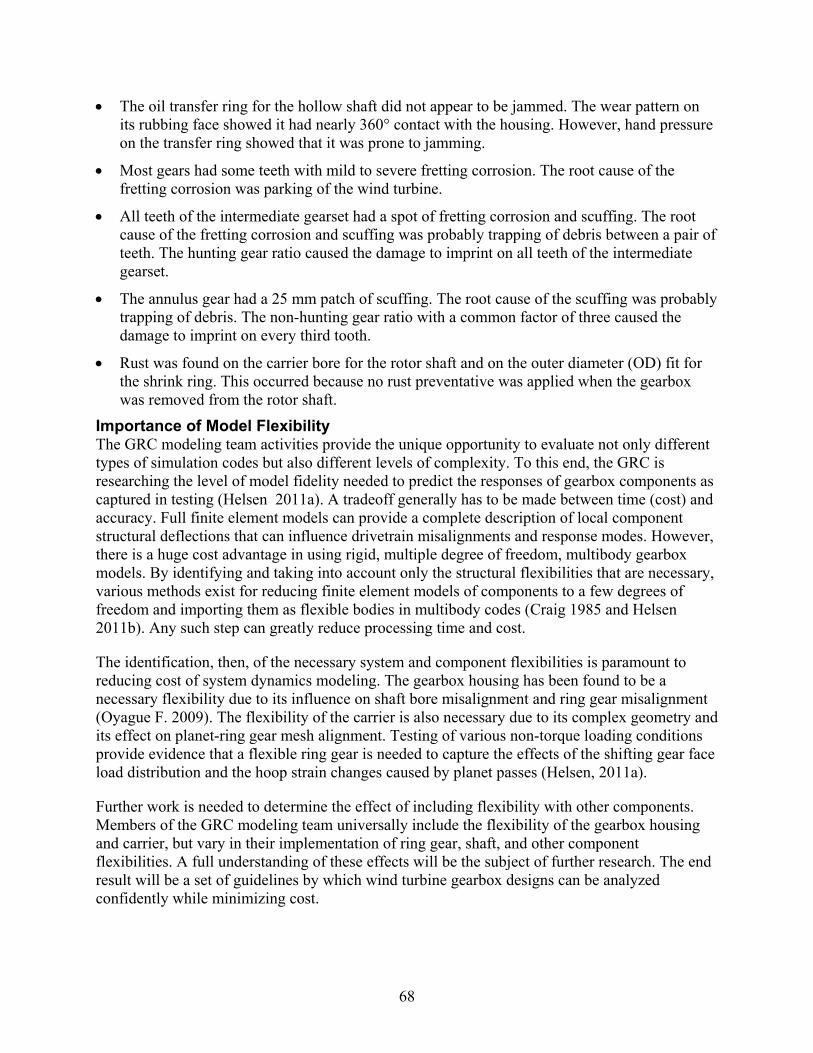
68
• The oil transfer ring for the hollow shaft did not appear to be jammed. The wear pattern on its rubbing face showed it had nearly 360° contact with the housing. However, hand pressure on the transfer ring showed that it was prone to jamming.
• Most gears had some teeth with mild to severe fretting corrosion. The root cause of the fretting corrosion was parking of the wind turbine.
• All teeth of the intermediate gearset had a spot of fretting corrosion and scuffing. The root cause of the fretting corrosion and scuffing was probably trapping of debris between a pair of teeth. The hunting gear ratio caused the damage to imprint on all teeth of the intermediate gearset.
• The annulus gear had a 25 mm patch of scuffing. The root cause of the scuffing was probably trapping of debris. The non-hunting gear ratio with a common factor of three caused the damage to imprint on every third tooth.
• Rust was found on the carrier bore for the rotor shaft and on the outer diameter (OD) fit for the shrink ring. This occurred because no rust preventative was applied when the gearbox was removed from the rotor shaft.
Importance of Model Flexibility The GRC modeling team activities provide the unique opportunity to evaluate not only different types of simulation codes but also different levels of complexity. To this end, the GRC is researching the level of model fidelity needed to predict the responses of gearbox components as captured in testing (Helsen 2011a). A tradeoff generally has to be made between time (cost) and accuracy. Full finite element models can provide a complete description of local component structural deflections that can influence drivetrain misalignments and response modes. However, there is a huge cost advantage in using rigid, multiple degree of freedom, multibody gearbox models. By identifying and taking into account only the structural flexibilities that are necessary, various methods exist for reducing finite element models of components to a few degrees of freedom and importing them as flexible bodies in multibody codes (Craig 1985 and Helsen 2011b). Any such step can greatly reduce processing time and cost.
The identification, then, of the necessary system and component flexibilities is paramount to reducing cost of system dynamics modeling. The gearbox housing has been found to be a necessary flexibility due to its influence on shaft bore misalignment and ring gear misalignment (Oyague F. 2009). The flexibility of the carrier is also necessary due to its complex geometry and its effect on planet-ring gear mesh alignment. Testing of various non-torque loading conditions provide evidence that a flexible ring gear is needed to capture the effects of the shifting gear face load distribution and the hoop strain changes caused by planet passes (Helsen, 2011a).
Further work is needed to determine the effect of including flexibility with other components. Members of the GRC modeling team universally include the flexibility of the gearbox housing and carrier, but vary in their implementation of ring gear, shaft, and other component flexibilities. A full understanding of these effects will be the subject of further research. The end result will be a set of guidelines by which wind turbine gearbox designs can be analyzed confidently while minimizing cost.

69
Reproduction of Field Bending and Torque in Dynamometer A comparison of the field and dynamometer torque measurements is shown in Figure 46. As can be seen in Figure 47, the system resonances introduced extra torque dynamics into the testing. The response was hampered by the slow dynamometer response, but the concept showed potential.
Figure 46. Time series of field torque data reproduced in dynamometer dynamic testing
Figure 47. FFT of field torque data reproduced in dynamometer dynamic testing
Torque variations in the field are not reproduced in typical dynamometer testing. These variations can be reproduced in the dynamometer, but limitations in the test equipment must be considered because they may limit the bandwidth (e.g. a long jackshaft and low frequency response of the dynamometer) or can introduce unwanted dynamics (e.g. system natural
0 20 40 60 80 100 12050
100
150
200
250
300
Torq
ue [k
Nm
]
Time [sec]
Field TorqueDyno Torque
0 0.2 0.4 0.6 0.8 1 1.2 1.4 1.6 1.8 20
2
4
6
8
10
12Single-Sided Amplitude Spectrum of Data
Frequency [HZ]
Mag
nitu
de
Field TorqueDyno Torque
1p
IntroducedDynamics
ωn Drivetrain
3p
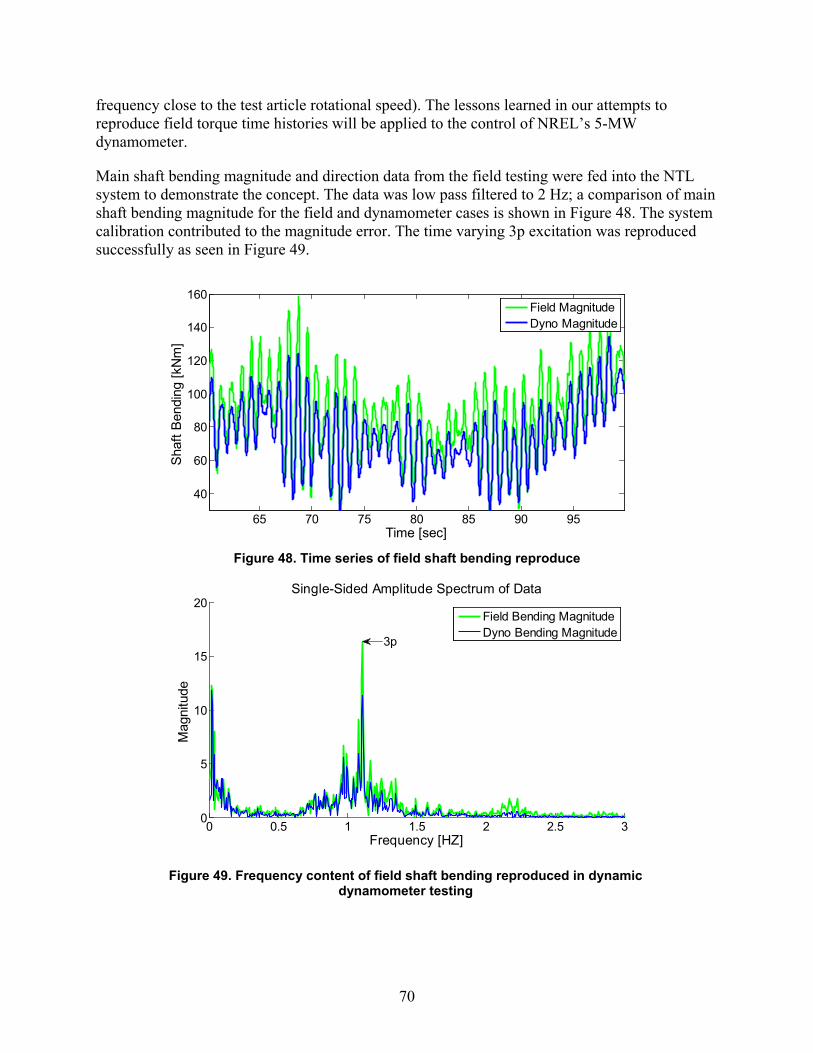
70
frequency close to the test article rotational speed). The lessons learned in our attempts to reproduce field torque time histories will be applied to the control of NREL’s 5-MW dynamometer.
Main shaft bending magnitude and direction data from the field testing were fed into the NTL system to demonstrate the concept. The data was low pass filtered to 2 Hz; a comparison of main shaft bending magnitude for the field and dynamometer cases is shown in Figure 48. The system calibration contributed to the magnitude error. The time varying 3p excitation was reproduced successfully as seen in Figure 49.
Figure 48. Time series of field shaft bending reproduce
65 70 75 80 85 90 95
40
60
80
100
120
140
160
Time [sec]
Sha
ft B
endi
ng [k
Nm
]
Field MagnitudeDyno Magnitude
0 0.5 1 1.5 2 2.5 30
5
10
15
20Single-Sided Amplitude Spectrum of Data
Frequency [HZ]
Mag
nitu
de
Field Bending MagnitudeDyno Bending Magnitude
3p
Figure 49. Frequency content of field shaft bending reproduced in dynamic dynamometer testing
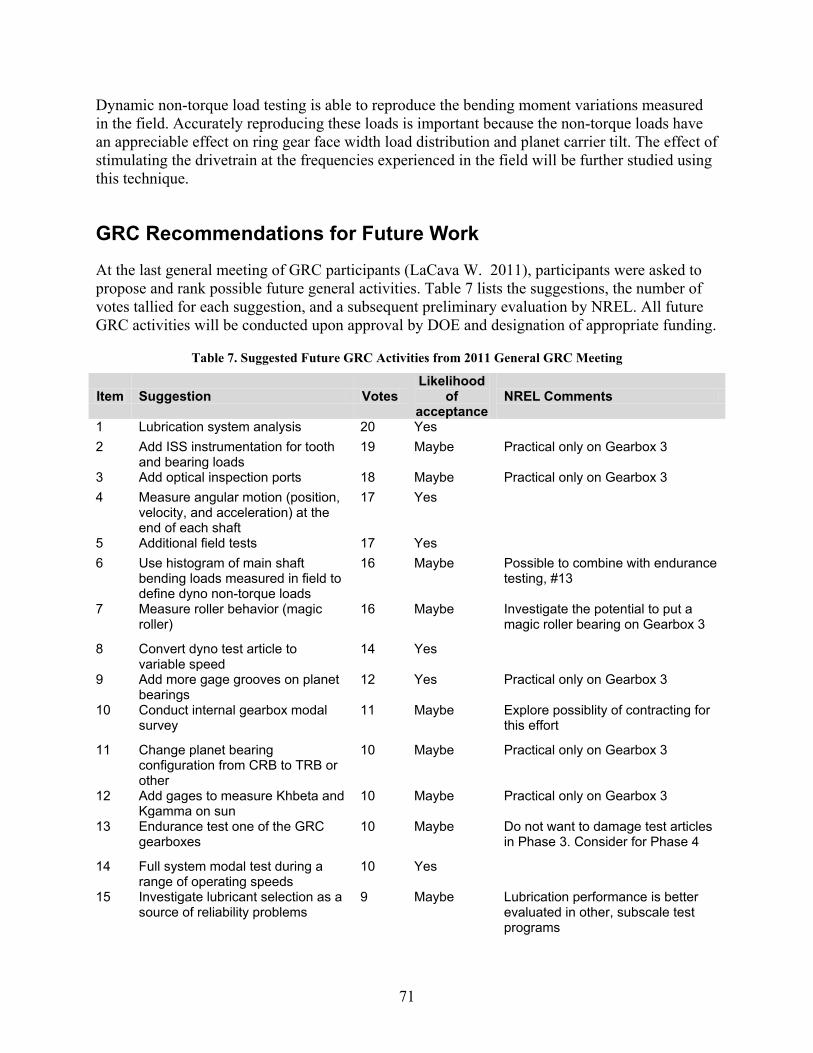
71
Dynamic non-torque load testing is able to reproduce the bending moment variations measured in the field. Accurately reproducing these loads is important because the non-torque loads have an appreciable effect on ring gear face width load distribution and planet carrier tilt. The effect of stimulating the drivetrain at the frequencies experienced in the field will be further studied using this technique.
GRC Recommendations for Future Work
At the last general meeting of GRC participants (LaCava W. 2011), participants were asked to propose and rank possible future general activities. Table 7 lists the suggestions, the number of votes tallied for each suggestion, and a subsequent preliminary evaluation by NREL. All future GRC activities will be conducted upon approval by DOE and designation of appropriate funding.
Table 7. Suggested Future GRC Activities from 2011 General GRC Meeting
Item Suggestion Votes Likelihood
of acceptance
NREL Comments
1 Lubrication system analysis 20 Yes 2 Add ISS instrumentation for tooth
and bearing loads 19 Maybe Practical only on Gearbox 3
3 Add optical inspection ports 18 Maybe Practical only on Gearbox 3 4 Measure angular motion (position,
velocity, and acceleration) at the end of each shaft
17 Yes
5 Additional field tests 17 Yes 6 Use histogram of main shaft
bending loads measured in field to define dyno non-torque loads
16 Maybe Possible to combine with endurance testing, #13
7 Measure roller behavior (magic roller)
16 Maybe Investigate the potential to put a magic roller bearing on Gearbox 3
8 Convert dyno test article to variable speed
14 Yes
9 Add more gage grooves on planet bearings
12 Yes Practical only on Gearbox 3
10 Conduct internal gearbox modal survey
11 Maybe Explore possiblity of contracting for this effort
11 Change planet bearing configuration from CRB to TRB or other
10 Maybe Practical only on Gearbox 3
12 Add gages to measure Khbeta and Kgamma on sun
10 Maybe Practical only on Gearbox 3
13 Endurance test one of the GRC gearboxes
10 Maybe Do not want to damage test articles in Phase 3. Consider for Phase 4
14 Full system modal test during a range of operating speeds
10 Yes
15 Investigate lubricant selection as a source of reliability problems
9 Maybe Lubrication performance is better evaluated in other, subscale test programs
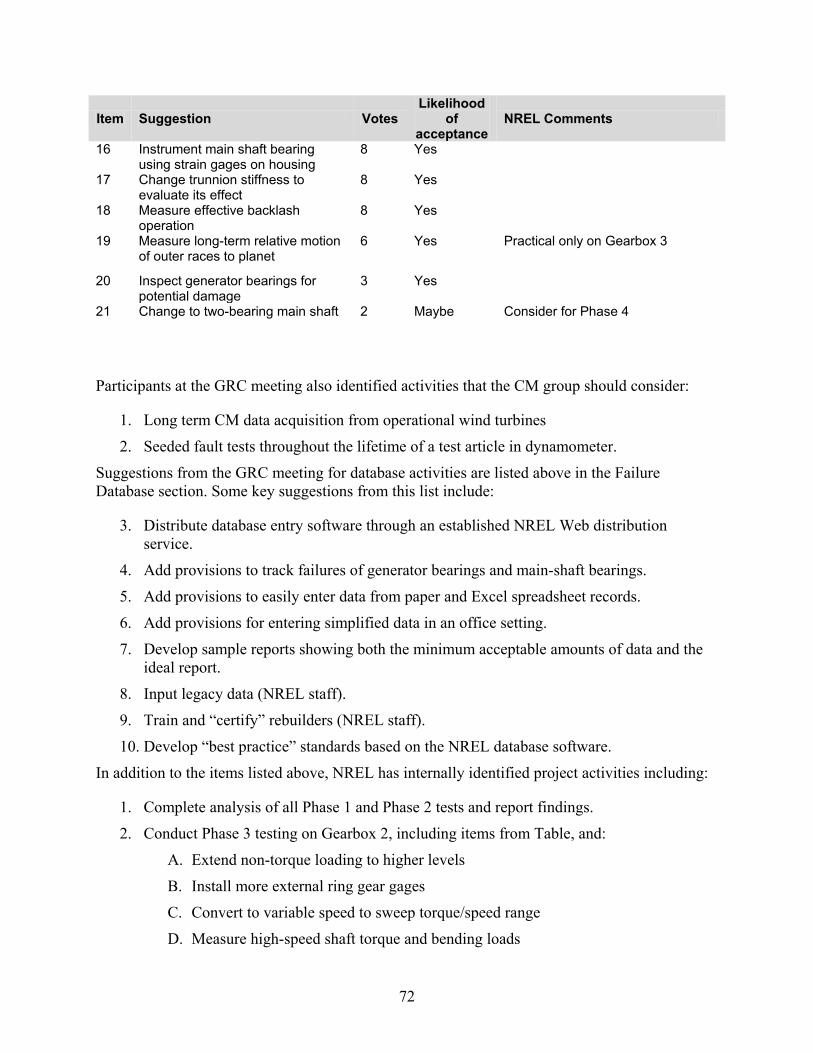
72
Item Suggestion Votes Likelihood
of acceptance
NREL Comments
16 Instrument main shaft bearing using strain gages on housing
8 Yes
17 Change trunnion stiffness to evaluate its effect
8 Yes
18 Measure effective backlash operation
8 Yes
19 Measure long-term relative motion of outer races to planet
6 Yes Practical only on Gearbox 3
20 Inspect generator bearings for potential damage
3 Yes
21 Change to two-bearing main shaft 2 Maybe Consider for Phase 4
Participants at the GRC meeting also identified activities that the CM group should consider:
1. Long term CM data acquisition from operational wind turbines
2. Seeded fault tests throughout the lifetime of a test article in dynamometer.
Suggestions from the GRC meeting for database activities are listed above in the Failure Database section. Some key suggestions from this list include:
3. Distribute database entry software through an established NREL Web distribution service.
4. Add provisions to track failures of generator bearings and main-shaft bearings.
5. Add provisions to easily enter data from paper and Excel spreadsheet records.
6. Add provisions for entering simplified data in an office setting.
7. Develop sample reports showing both the minimum acceptable amounts of data and the ideal report.
8. Input legacy data (NREL staff).
9. Train and “certify” rebuilders (NREL staff).
10. Develop “best practice” standards based on the NREL database software.
In addition to the items listed above, NREL has internally identified project activities including:
1. Complete analysis of all Phase 1 and Phase 2 tests and report findings.
2. Conduct Phase 3 testing on Gearbox 2, including items from Table, and:
A. Extend non-torque loading to higher levels
B. Install more external ring gear gages
C. Convert to variable speed to sweep torque/speed range
D. Measure high-speed shaft torque and bending loads

73
E. Measure high-speed shaft tooth contact loads
F. Fix lubrication system and flow meters on each leg
G. Identify sensitivity of bearing temps to lubrication flows
H. Extend thrust load testing to higher loads and frequencies
I. Evaluate effect of changes of gearbox angular alignment with main shaft
J. Evaluate effect of changes of gearbox axial position with main shaft
K. Evaluate effect of high-speed shaft misalignment on high-speed shaft bearings and tooth mesh
L. Investigate HSS torque limiting methods
M. Determine if gearbox lube problems seen in Gearbox 1 are occurring in Gearbox 2
N. Change generator inertia to investigate effect of 30 Hz resonance.
3. Install Gearbox 2 into a field turbine and conduct field tests.
4. Redesign and rebuild Gearbox 1 and redesignate it as Gearbox 3.
5. Conduct full Phase 3 dynamometer tests on Gearbox 3 including, possibly:
A. Install alternate carrier bearings to permit removal of radial clearance
B. Improve lubrication / fix problems
C. Augment instrumentation as listed above.
74
References
Bir, G.O.; Oyague, F. (2007). Estimation of Blade and Tower Properties for the Gearbox Research Collaborative Wind Turbine. NREL/TP-500-42250.
Blau, P. J.; Walker, L.R.; Xu, H.; Parten, R.; Qu, J.; and Geer, T. (2010). Wear Analysis of Wind Turbine Gearbox Bearings. ORNL/TM-2010/59.
Bond, R. (2011). “NREL Large Dynamometer Modal Test.” GRC General Meeting, 2011 p. 17 (internal report). Golden, CO: NREL.
Bond, R.; Koester, D.; and Adams, D. (2011). “NREL Large Turbine Dynamometer Modal Test.” GRC General Meeting, 2011. p. 17 (internal report). Golden, CO: NREL.
Craig, R. (1985). “A review of time domain and freqeuncy domain component mode synthesis methods.” Joint Mechanics Conference. Albuquerque.
Crowther, A. (2010). “Sources of time-varying contact stress and misalignments in wind turbine planetary sets.” Wind Energy WE-10-0069. Romax Technology, Ltd., Boulder, CO.
Crowther, A.; Zaidi, N. A. (2010). Gearbox rubber mount: Characteristic on Test Bench and In Situ during Dynamometer Tests. Romax Technology, Ltd., Boulder, CO.
Errichello, B. (2011). Failure Analysis of NREL Field Test Gearbox No. 1. GEARTECH Report No. 2443. Townsend, MT.
Helsen, J.; LaCava, W. (2011a). Experimental Assessment of the Main Requirements for Flexible Multibody Wind Turbine Gearbox Models (forthcoming).
Helsen, J.; Vanhollebeke; F. Marrant, B.;Vandepitte, D.; Desmet, W (2011b). “Multibody modelling of varying complexity for modal behavior analysis of wind turbine gearboxes.” Renewable Energy Journal.
International Electrotechnical Commission. (2004). Wind Turbine Generator Systems - Part 1: Safety Requirements. Geneva, Switzerland: International Electrotechnical Commission.
International Organization for Standardization. (1996). ISO-6336-1: Calculation of load capacity of spur and helical gears. Geneva, Switzerland: ISO.
International Organization for Standardization. (2005). Wind Turbines - Part 4: Standard for Design and Specification of Gearboxes. ISO/IEC 81400-4:2005. Geneva, Switzerland: ISO, February 2005.
Jonkman, J. (2010). FAST An Aeroelastic Design Code for Horizontal Axis Wind Turbines. Retrieved 2010 05-November from National Wind Technology Center website. http://wind.nrel.gov/designcodes/simulators/fast/
KISSsoft AG. (n.d.). http://www.kisssoft.ch/english/upcoming_developments.htm.
75
Kochmann, M. (2010). Simulation of wind turbine drive trains in certification using SimPac. Gilching, Germany: SimPack.
LaCava, W. (2011). GRC General Meeting Proceedings (internal report). Golden, CO: National Renewable Energy Laboratory.
LaCava, W. ; McNiff, B. (2011). “Comparing In-field Gearbox response to Different Dynamometer Test Conditions.” AWEA 2011. Anaheim: NREL CP-500-51690.
Mancuso, J. R. (1999). Couplings and Joints Design, Selection, and Application (Second ed.). New York, NY: Marcel Dekker, Inc.
Marks, C. (2011). “Planetary Bearing Analysis with Strain Gauge Data.” GRC General Meeting, 2011, p. 31 (internal report). Golden, CO: NREL.
McDade, M.; Munch, K.(2010). Gearbox Reliability Collaborative: Gearbox inspection Metadata. NREL/TP-500-49133.
McNiff, B. (forthcoming). Gearbox Reliability Collaborative Phase II Test Plan. Golden, CO: NREL.
McNiff, B. W. (1990). Variations in Gear Fatigue Life for Different Wind Turbine Braking Strategies. Golden, CO: Solar Energy Research Institute.
McNiff, B.; Musial, W. D. (2004). “Developing a Wind Turbine Gearbox Load Description.” Global Windpower Conference and Exhibition. Chicago, IL: American Wind Energy Association.
McNiff, B.; van Dam, J.; Gorman, J.; Link, H. (forthcoming). Gearbox Reliability Collaborative Phase I Test Plan, NREL/TP-500-47842. Golden, CO: NREL.
Musial, W. D.; McNiff, B. (2000). “Wind Turbine Testing in the NREL Dynamometer Test Stand, NREL/CP-500-28411.” Windpower 2000. Palm Springs, CA: American Wind Energy Association.
Oyague, F. (2008). Progressive Dynamical Drive Train Modeling as Part of NREL Gearbox Reliability Collaborative: Preprint. NREL Report No. CP-500-43473. Golden, CO: NREL. p. 16.
Oyague F.; Butterfield, C.P.; Sheng, S. (2009). “NREL Gearbox Reliability Collaborative Analysis Round Robin: Preprint.” Presented American Wind Energy Association WINDPOWER 2009 Conference, Chicago, IL, May 4-7, 2009. NREL Report No. CP-500-45325.
Oyague, F. (2010a). NREL Gearbox Reliability Collaborative Experimental Data Overview and Analysis. AWEA 2010. NREL/CP-500-48232.
Oyague, F. (2010b). GRC 750 / 48.2 Description and Loading Document. Golden, CO: NREL.
76
Peeters, J.; Vandepitte, D.; Sas, P. (2003). “Dynamic analysis of an integrated drivetrain in a wind turbine.” European Wind Energy Conference, EWEC2003. Madrid.
Poore, R. (2003). WindPACT Drive Train Designs Study, NREL/SR-500-33196. Golden, CO: National Renewable Energy Laboratory.
Qiao, M. (2009). Analysis of Static Calibration Test for Planet Bearing. Romax.
Raju, D. (2008). NREL: Gearbox Reliability Collaborative. Gearbox bearing system analysis. Phase 1 , SKF ECS.
Raju, D. (2008). NREL: Gearbox Reliability Collaborative. Gearbox bearing system analysis. Phase 2 , SKF ECS.
Raju, D. (2010). NREL: Gearbox Reliability Collaborative. Gearbox bearing system analysis. Phase 3 , SKF ECS.
Rasmussen, F. T. (2004). The Gearbox Problem Revisited, Riso Fact Sheet, AED-RB-17(EN). Roskilde, DK: Risoe National Laboratory.
Sheng, S. (2009). “Investigation of Various Wind Turbine Drivetrain Condition Monitoring Techniques”. The 7th International Workshop on Structural Health Monitoring 2009, Stanford, CA, USA, September 9-11, 2009. Sheng, S. (2010). “Investigation of Oil Conditioning and Monitoring Techniques for Wind Turbine Gearboxes.” The Society of Tribologists and Lubrication Engineers (STLE) 65th Annual Meeting and Exhibition. Las Vegas, NV, USA, May 16-20, 2010. Sheng, S. (2011a). “Investigation of Oil Conditioning, Real-time Monitoring and Oil Sample Analysis for Wind Turbine Gearboxes.” The American Wind Energy Association (AWEA) Project Performance and Reliability Workshop. San Diego, CA, USA, January 12-13, 2011. Sheng, S. (2011b). “Investigation of Various Condition Monitoring Techniques Based on a Damaged Wind Turbine Gearbox.” To be presented at The International Workshop on Structural Health Monitoring 2011. Stanford, CA, USA, September 13-15, 2011. Sheng, S. (future). Wind Turbine Drivetrain Condition Monitoring: Phase I and II of the GRC Tests (forthcoming). Golden, NREL. Sheng, S.; Veers, P. “Wind Turbine Drivetrain Condition Monitoring – An Overview.” Machinery Failure Prevention Technology (MFPT): The Applied Systems Health Management Conference 2011. Virginia Beach, VA, USA, May 10-12, 2011. Tavner, P. X. (2006). Reliability Analysis for Wind Turbines. Wind Energy Journal, Volume 10, Issue 1. John Wiley and Sons.
van Dam, J. (2007). Torque Measurements on GRC Test Turbine 1 (internal report). Golden, CO: NREL.

77
van Dam, J. (2008a). Ponnequin Blade Freq Results.xls (internal report). Golden, CO: NREL.
van Dam, J. (2008b). Acceleration Measurements on Modified Tower Turbine 25 (internal report). Golden, CO: NREL.
van Dam, J. (forthcoming). Gearbox Reliability Collaborative Bearing Calibration, NREL/TP-500--47852. Golden, CO: NREL.
Windpower Monthly. (2005). “Facing up to the Gearbox Challenge: A survey of gearbox failure and collected industry knowledge.” Windpower Monthly, Volume 21 #11-November 2005.
Wright, Z.; Halse, C.; Crowther, A. (2011). NREL GRC Gearbox Engineering Assessment. Golden, CO: NREL.
Other GRC Publications
Butterfield, S.; Sheng, S.; Oyague, F. (2009). “Wind Energy's New Role in Supplying the World's Energy: What Role Will Structural Health Monitoring Play?” Seventh International Workshop on Structural Health Monitoring 2009. Stanford, CA, September 9-11. NREL/ CP-500-46180.
Crowther, A. R.; Lockton, A; Wright, Z. (2010). “Technology trends and design approaches for wind turbine drivetrains.” Proceedings 8th IFToMM International Conference on Rotordynamics. Seoul, Korea: Romax technology Limited. September 12-15, KIST.
Day, J. (2009). Calculation of NREL GRC 750kW gearbox lubrication requirements (internal report). Golden, CO: NREL. October 19.
Dempsey, P.; Sheng, S. (2011). Investigation of Data Fusion Applied to Health Monitoring of Wind Turbine Drivetrain Components. NREL/ PR-5000-51467 (forthcoming). Golden, CO: NREL.
McDade, M. (2011). Gearbox Reliability Collaborative Failure Database. Presented at the AWEA Wind Project Performance and Reliability Workshop, Seattle, WA., January 12 – 13, 2011. NREL/PR-5000-50179. Golden, CO: NREL.
Muljadi, E. (2011). Mechanical Stress Reduction in a Gearbox for Variable Speed Wind Turbine Generator. NREL /MP-550-49456 (internal report). Golden, CO: NREL.
Munch, K.; McDade, M. (2010). Gearbox Reliability Collaborative: Gearbox Inspection Metadata. NREL/TP-500-49133. Golden, CO: NREL. p. 8.
Musial, W.D.; Butterfield, C.P.; McNiff, B. (2007). Improving Wind Turbine Gearbox Reliability. Proceedings EWEC 2007. Milan. April.
Oyague, F. (2008b). Progressive Dynamical Drivetrain Modeling as Part of NREL Gearbox Reliability Collaborative. NREL/ PO-500-43068. Golden, CO: NREL.
78
Oyague, F. (2009). Gearbox Modeling and Load Simulation of a Baseline 750-kW Wind Turbine Using State-of-the-Art Simulation Codes. NREL/TP-500-41160. Golden, CO: NREL. pp. 94.
Oyague, F. (2010). Gearbox Reliability Collaborative Experimental Data Overview & Analysis. (Presentation). NREL/PR-500-48176. Golden, CO: NREL. p.15.
Oyague, F. (2009). NREL Gearbox Reliability Collaborative Dynamic Analysis Efforts. NREL/CP-5000-45015. Golden, CO: NREL
Sheng, S. (2009). “Overview of GRC Condition Monitoring.” Presented Sandia Reliability Workshop, Albuquerque, NM, June 17-18, 2009. http://www.sandia.gov/wind/2009Reliability/PDFs/Day2-06-ShawnSheng.pdf.
Sheng, S. (2010). Wind Turbine Micropitting Workshop: A Recap. NREL/TP-500-46572. Golden, CO: NREL. p. 52.
Sheng, S.; Herguth, W.; Drake, T. (2011). “Investigation of Image-Based Particle Shape and Size Analysis Techniques for Wind Turbine Gearbox Lubricants.” Presented Society of Tribologists and Lubrication Engineers (STLE) 66th Annual Meeting and Exhibition, Atlanta, GA, May 15-19, 2011. NREL/AB-5000-51073. Golden, CO: NREL.
Sheng, S.; McDade, M.; Errichello, R. (2011). “Wind Turbine Gearbox Failure Modes – A Brief.” To be presented ASME/STLE 2011 International Joint Tribology Conference, Los Angeles, CA, October 23-26, 2011.
Veers, P.; Link, H.; McNiff, B.; LaCava, W.; Lambert, S.; Wallen, R. (2011),” (poster) Augmenting Dynamometer Testing to Improve Wind Turbine Gearbox Design Validation, presented at the European Wind Energy Conference, Brussels, Belgium, March 14-17, 2011. NREL/PO-5000-50664.

79
Appendix A – GRC Partners
The following is a partial list of GRC partners. Some partners prefer anonymity and, therefore, are not listed here.
Argonne National Laboratory
Brüel & Kjær Vibro A/S
Castrol Industrial North America Inc.
CC Jensen Inc.
Centre for Ships and Ocean Structures, Norwegian University of Science and Technology
Colorado School of Mines
Eaton Corp.
GasTOPS Ltd.
GE Bently Nevada
GE Transportation
GEARTECH
Herguth Laboratories, Inc.
HYDAC
Impact Technologies, LLC
IVC Technologies
KISSsoft
Kittiwake Developments
Katholieke Universiteit Leuven
The Lubrizol Corporation
M/A-COM Technology Solutions
Milburn Engineering, Inc.
National Instruments
NRG Systems Inc.
Gear and Power Transmission Research Laboratory, Ohio State University
Powertrain Engineering Inc.
Purdue University
Romax Technology Ltd
SAMTECH
Schenck Trebel Corporation
Sentient Corporation
SIMPACK
SKF
SKF Baker Instrument Company
StandardAero
STC Consultants (SKF)
Scientech (previously Swantech)
Terra-Gen Power, LLC
The Timken Company
University of Cincinnati
University of Connecticut
University of Iowa
University of New South Wales in Australia
Vestas Wind Systems A/S
Wichita State University
Xcel Energy

80
Appendix B – Excerpt from Failure Database Input from Gearbox #1
This section contains screen dumps from the GRC Failure database related to the teardown of GRC gearbox 1. Photo credits: M. McDade (NREL) or R. Errichello GEARTECH
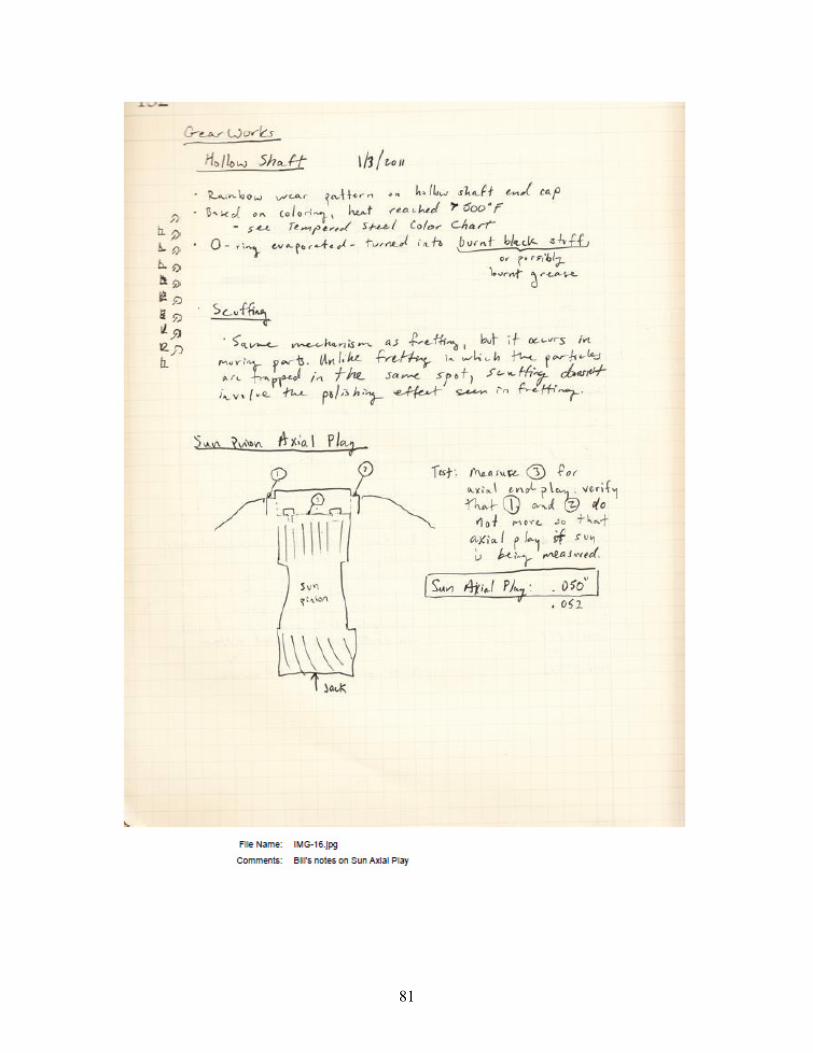
81
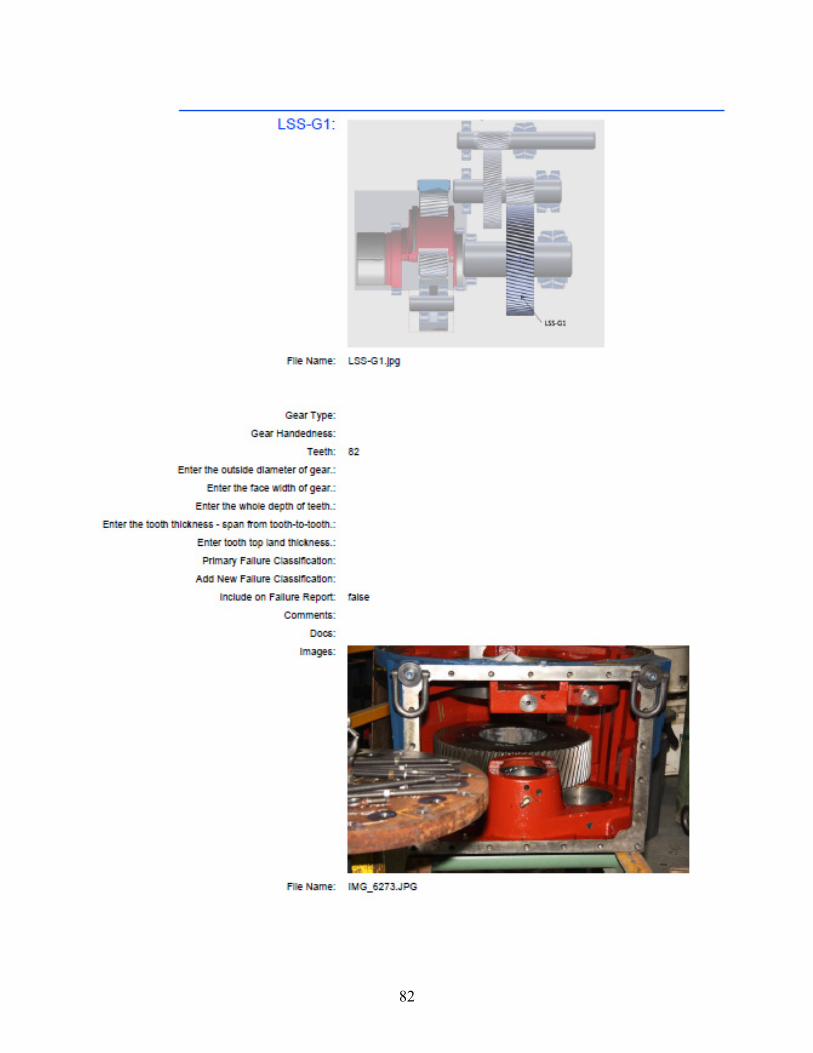
82
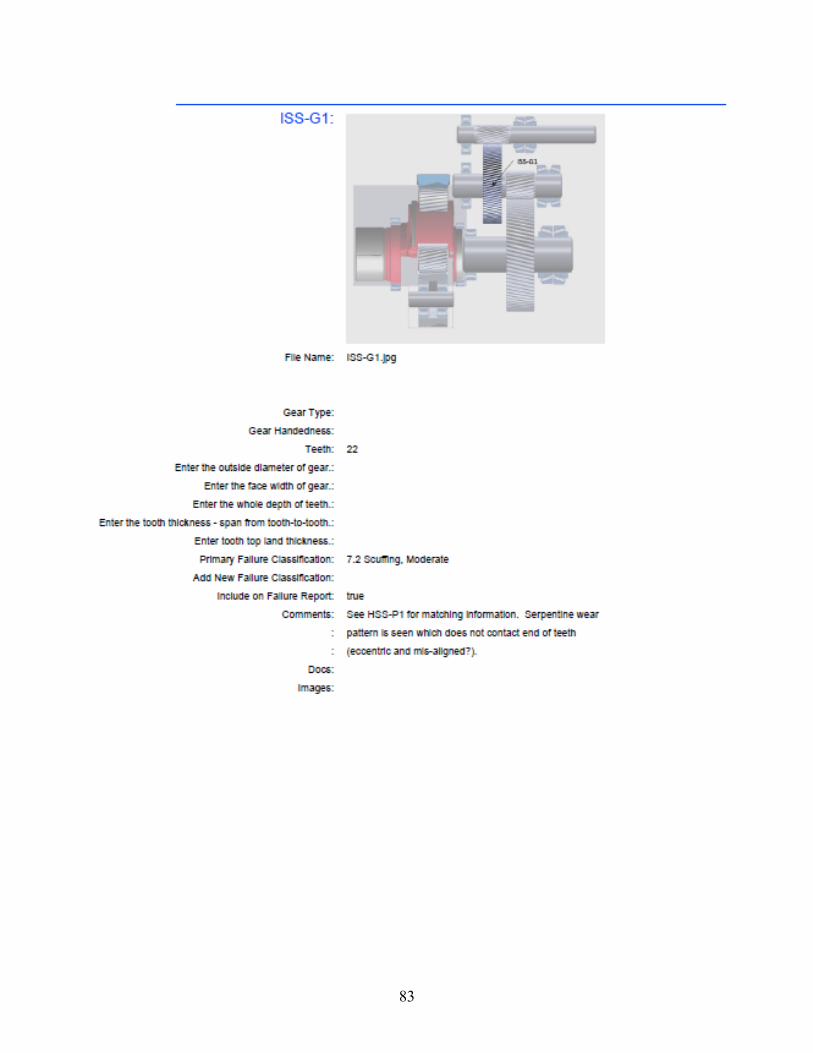
83
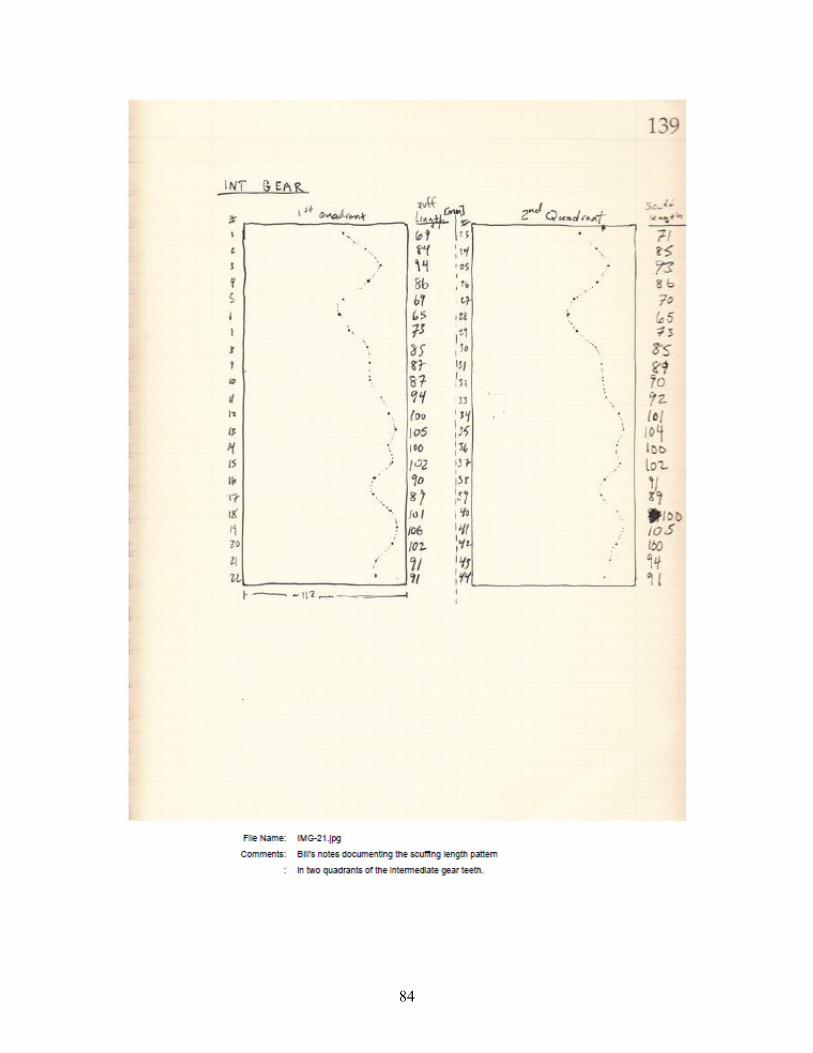
84

85


![[5] Planetary gear and Mechanical paradox Gear design ...Eng).pdf · 1 [5] Planetary gear and Mechanical paradox Gear design system (English Version) Fig.5.1 Planetary gear and Mechanical](https://static.fdocuments.us/doc/165x107/5a78d0067f8b9aa17b8cf015/5-planetary-gear-and-mechanical-paradox-gear-design-engpdf1-5-planetary.jpg)