Intraspecific variation in lizard’s antipredatory behaviour · FCUP Intraspecific variation in...
63
Intraspecific variation in lizard’s antipredatory behaviour Àlex Cortada Salas Mestrado em Biodiversidade, Genética e Evolução Departamento de Biologia 2016 Orientador Miguel A. Carretero, Principle Researcher, CIBIO/InBIO,Universidade do Porto
Transcript of Intraspecific variation in lizard’s antipredatory behaviour · FCUP Intraspecific variation in...
Intraspecific variation in lizard’s antipredatory behaviour
Àlex Cortada Salas
Mestrado em Biodiversidade, Genética e Evolução Departamento de Biologia 2016
Orientador Miguel A. Carretero, Principle Researcher, CIBIO/InBIO,Universidade do Porto


FCUP
Intraspecific variation in lizard’s antipredatory behaviour
3
Acknowledgements
First of all, before what concerns the thesis itself, I would like to thank everything that
made it possible for me to be in Portugal in the first place. In fact, I first arrived to CIBIO
as an internship student to do the final project of my Biology degree in Barcelona. So, I
really would like to thank to Gustavo Llorente, the person who, when I exposed to him
my will of doing an internship somewhere in Europe and that I was highly interested in
reptiles and evolutionary ecology, he didn’t hesitate and immediately gave me a name:
Dr. Miguel A. Carretero. This was around the beginning of the 2012, when I first started
mailing Miguel to organize the internship one year in advance.
Now, four years later I’m glad to say that Miguel hasn’t been only the supervisor of both
my internship and Master thesis, but a true friend. So I really wish to thank him for all his
infinite patience and understanding, sharing with me the way he sees science and being
there when I needed. And also for the long conversations where topics rapidly change,
starting with lizards’ ecology and ending with Middle East politics, learning a lot in
between. Thus, thank you.
There’s many other people I would like to thank for making those years in Portugal a
great experience:
Xavier Santos, for all his support, comments, good vibes and incredible cooking skills.
Antigoni Kaliontzopoulou for her help and support as well as the brainstorming moments
and construction of gadgets to study lizards’ performance.
Fernando Martínez, Guillermo Velo, Daniele Salvi, Zbyszek Boratynski, José Carlos
Brito, Enrique García-Muñoz, Antonio Muñoz, Lucia and Michael Jowers for climbing
moments, sharing waves, volleyball matches and different crazy moments.
Catarina Rato, Veronica Gomes and Anamarija Zagar for the help in the “behavioural
lab” and their support.
Also to Teresa for the indispensable morning coffee and talk to start the day and Sr.
Bernardino for his constant availability to help when necessary.
Beatriz Tomé and Iolanda Rocha for the shared fieldwork and dinners.
Marc, Olatz, Leili, Hosein, Eudald, Mario, Diana and many others for the enjoyable
moments.

FCUP
Intraspecific variation in lizard’s antipredatory behaviour
4
All my closest friends, especially to the Galzeran group, Carlos, Clàudia and Eugènia for
the long distance support, providing me always a place to stay in Barcelona and the
many laughs.
My parents, Carles Cortada and Montserrat Salas, for the endless emotional support and
their economical help that made me possible to be in Portugal and attend this Master
course.
Joana Mendes, for being there in the good and the bad moments supporting and helping
me, for all the love and joy. Thank you.

FCUP
Intraspecific variation in lizard’s antipredatory behaviour
5
FCUP
Intraspecific variation in lizard’s antipredatory behaviour
6
Abstract
Predation pressure plays a determinant role on animal populations selecting
antipredatory strategies in the putative prey. Among them, antipredator behaviours are
of interest when analysing species interactions since selection may favour animals taking
advantage of previous experiences to prevent new attacks. Lacertid lizards use the
escape towards a refuge as the most common tactic when detected by a predator. Both
escape and recovery have been previously documented to vary across and within
species. Here it was analysed in parallel both the predation intensity and the
antipredatory behaviour to assess the degree of intraspecific variation and how it relates
to the given predator-prey interactions. The presence of close conspecifics, lizards’
activity and state of the tail were accounted because of their possible contribution in
shifting both escape and recovery behaviours. Size and sexual variation were also
considered in order to infer eventual interactions between natural and sexual selection
and the possible contribution of experience in predator avoidance.
I studied six populations of the generalist lacertid Podarcis bocagei from NW Portugal,
three located in open landscapes of coastal dunes and other three inhabiting agricultural
areas with granitic walls. During spring and summer days with suitable conditions for
lizards’ activity, lizard traits were recorded (sex, size class) together with environment
characteristics (refuge, temperatures) and behavioural responses when simulating a
predatory attack for 80-100 lizards on each population. Simultaneously, predator
pressure was estimated by placing clay lizard models (100/site/day) to record predatory
attacks. Due to their multivariate and complex nature, data were analysed using mixed
models and model selection approach.
Among populations, lizards adjusted their escape behaviour (FID) responding to
changes in predation intensity, while all other variables were further affected by the
habitat type. Regarding the recovery tactics, lizards shifted the time they spent inside
refuges according to the cost of lost opportunities, rather than predation risk itself.
Recovery behaviours were the only studied variables for which both slight differences
between sexes and size class (adult/juvenile) were found. The complex variation
observed appear to be in agreement with the predictions of the escape theory. Further
manipulative experiments are needed to disentangle between the effects of plasticity and
selection.

Resumo
A pressão de predação tem um papel crucial em populações animais, através da
seleção de estratégias anti-predatórias na potencial presa. Entre estas,
comportamentos anti-predatórios têm particular interesse aquando da análise de
interações entre espécies, uma vez que a seleção pode favorecer animais que tiram
proveito de experiências anteriores para evitar novos ataques. Lagartixas da família
Lacertidae utilizam a fuga para um refúgio como a táctica mais comum depois de serem
detectadas por um predador. Tanto a fuga como a recuperação, como já documentado,
variam entre e dentro de diferentes espécies. Neste trabalho foram paralelamente
analisados a intensidade de predação e os comportamentos anti-predatórios para
avaliar o grau de variação intraespecífica e a forma como esta se relaciona com
determinadas interações entre predador e presa. A presença de conspecíficos na
proximidade, a actividade das lagartixas e o estado da cauda foram utilizados devido à
sua possível contribuição na modificação de comportamentos de fuga e recuperação. O
tamanho e a variação sexual foram também considerados para inferir sobre eventuais
interações entre seleção natural e sexual e possível contribuição de experiência prévia
para evitar predadores.
Para tal foram estudadas seis populações da espécie generalista Podarcis bocagei do
NO de Portugal, das quais três em ambientes abertos de dunas costeiras e as restantes
três em áreas de ocupação agrícola com paredes de pedra. Durante os dias de
primavera e verão com condições favoráveis à actividade das lagartixas foi realizado o
registo das características físicas (sexo, tamanho) assim como características
ambientais (refúgio, temperaturas) e respostas comportamentais aquando da simulação
de um ataque predatório para 80 – 100 lagartixas em cada população.
Simultaneamente, a pressão de predação foi estimada através da colocação de modelos
de plasticina de lagartixas (100/local/dia) para registo de ataques predatórios.
Entre populações, as lagartixas ajustaram o seu comportamento de fugida (FID) em
resposta a variações na intensidade de predação, enquanto todas as outras variáveis
foram apenas afectadas pelo tipo de habitat. Em relação às tácticas de recuperação, as
lagartixas modificaram o tempo que permaneciam dentro dos refúgios de acordo com o
custo de oportunidades perdidas (alimentação, termorregulação, etc), em vez de o
modificarem de acordo com o risco de serem predados. Comportamentos de
recuperação foram as únicas variáveis para as quais se verificaram diferenças entre os
sexos e tamanhos (adultos/juvenis). A complexa variação observada parece concordar
com predições da teoria de fugida. Mais experiências são necessárias para entender os
efeitos de plasticidade e seleção.
Keywords
Antipredatory behaviour, predation intensity, Podarcis bocagei, optimal escape theory,
recovery, Flight inititiation distance, distance fled, emergence, refuge, thermoregulatory
costs, habitat structure, model selection, cross-validation

Index of contents
List of Figures 10
List of Tables 11
List of Abbreviations 12
General introduction
Predation selection 14
Escape behaviour 15
Bocage’s wall lizard 16
Objectives 20
Material and Methods
Study sites 22
Behavioural observations 23
Predator pressure estimation 25
Statistical analyses 27
Results
Predation pressure 35
Antipredatory behaviour 37
Escape behaviour 39
Recovery behaviour 41
Discussion
Behavioural responses 46
Conclusions 50
References 51
Supplementary material
Annex 1 58
Annex 2 61

FCUP
Intraspecific variation in lizard’s antipredatory behaviour
10
List of Figures
Fig. 1 Distribution range of Podarcis bocagei in the Iberian Peninsula.
Fig. 2 Sexual dimorphism and copulation in P. bocagei.
Fig. 3 Studied areas and their location in North Portugal.
Fig. 4 Field methodology and the behavioural responses registered.
Fig. 5 Clay models.
Fig. 6 Percentage of tail-loss in the six studied populations.
Fig. 7 Results of the cross-validation analysis for the eight best ranked models for FID.
Fig. 8 Density plot of the cross-validation results for the eight best ranked models for
FID.
Fig. 9 Interaction between the sex and the habitat type in the emergence time.
Fig. 10 Results of the cross-validation analysis for the 10 best ranked models for
emergence
Fig. 11 Density plot of the cross-validation results for the 10 best ranked models for
emergence time.
FCUP
Intraspecific variation in lizard’s antipredatory behaviour
11
List of Tables
Table 1. Factor type and levels of the independent variables used for statistical analyses.
Table 2. Models created for each combination of random factors.
Table 3. Presence and rough abundance of each predator species in the different
locations.
Table 4. Descriptive statistics of the behavioural variables for each population.
Table 5. ANCOVA comparisons of escape variables.
Table 6. ANCOVA comparisons of recovery variables.

FCUP
Intraspecific variation in lizard’s antipredatory behaviour
12
List of Abbreviations
AICc – corrected Akaike information criterion
ANCOVA – Analysis of covariance
BIC – Bayesian information criterion
DNA – Deoxyribonucleic acid
E – Classifier error
ESP – Esposende
FID – flight initiation distance
GI – Gião Igreja
GR – Gião Rochio
IUCN – International Union for Conservation of Nature
LRT – Likelihood ratio test
MAD – Madalena
MIN – Mindelo
ML – Maximum likelihood
ND4 – NADH Dehydrogenase 4
REML – Restricted maximum likelihood
SE – Standard error
SMC – São Mamede do Coronado
SVL – snout-vent length
Ta – Air temperature
Tr – Refuge temperature
Ts – Substrate temperature
VIF – Variance inflation factor
δar – Thermoregulatory cost associated with refuge/air temperatures
δsr – Thermoregulatory cost associated with refuge/substrate temperatures

FCUP
Intraspecific variation in lizard’s antipredatory behaviour
13
GENERAL INTRODUCTION
FCUP
Intraspecific variation in lizard’s antipredatory behaviour
14
Predation selection
Species are subject to several selection pressures, representing the main source of the
evolutionary shift and speciation processes (Schluter, 2001). Among these selection
pressures, predation seems to be one of the most relevant due to its direct effect on
populations: the elimination of individuals in itself. The consequence is the individual
survival and increased probability of reproductive success of those individuals that better
avoid predators throughout their lives. Thus, predation pressure plays a determinant role
on animal populations selecting antipredatory strategies in the putative prey (Begon et
al., 1990).
Across potential prey taxa, the wide range of developed defensive tactics can be based
on morphological, physiological or behavioural traits (Rosier & Langkilde, 2011).
Moreover, some defensive strategies involve highly complex displays, like in the case of
detection avoidance: the combination of behavioural traits (postures and movements)
with morphological characteristics (colouration and shape) provides an enhanced
disguise, a strategy widely used across cephalopods and some reptiles (Stevens &
Merilaita, 2011). After being detected, deterring an attack relies on intimidation and
deception tactics (living in groups, being large-sized) as well as fighting back, with flight
as the last resource (Rosier & Langkilde, 2011). In all these possible cases,
morphological, physiological and/or behavioural traits potentially interact between them
creating a myriad of antipredatory strategies in animal species. Therefore, the ways to
survive an encounter with a predator are extremely variable, mainly depending on the
ecological characteristics (comprising both biotic and abiotic components) to what a
given species has been exposed through evolutionary time, thus establishing the
relevance of predation pressure in relation to all other selective forces (Stankowich et
al., 2014)
In environments with constantly changing predator intensities, antipredatory behaviours
are the most relevant defensive tactics due to their plasticity, and because selection
favours animals that learn quickly to avoid predators (Marcellini & Jenssen, 1991), thus
taking advantage of previous survived encounters. Behavioural tactics are less costly
than the development and maintenance of both morphological and physiological
permanent defences (like spikes or poison) or than the loss and regeneration of body
parts, what makes animals more vulnerable to subsequent attacks (Rosier & Langkilde,
2011). However, defensive behaviours can entail other associated costs regarding

FCUP
Intraspecific variation in lizard’s antipredatory behaviour
15
individual fitness: time spent inside a refuge or scanning for predators could otherwise
be invested in activities like foraging, defending the territory or looking for mates
(Ydenberg & Dill, 1986). Therefore, the resulting trade-off should have induced the ability
to accurately assess both the risks imposed by predators and the costs of vigilance and
fleeing, effectively responding only when necessary (Martin, 2001).
Escape behaviour
Small lizards like lacertids, which lack specialized defensive devices, use the escape
towards a refuge as the most common tactic when detected by a predator. Nevertheless,
fleeing into a refuge has several and important costs for lizards because of their
heliothermic condition and the inherent thermoregulation needs (Carretero et al., 2006).
Since available refuges usually present suboptimal temperatures for most physiological
processes of lizards, using them entails a decrease of the body temperature below
preferred levels, with negative effects on their fitness, such as reduced locomotion
performance or inefficient digestive processes (Martín & López, 1999a). According to
Martin (2001), optimization of antipredatory responses (regarding both predation risks
and the associated costs of fleeing) relies on a proper adjustment of escape decisions,
effectively responding to the specific levels of predation intensity and their possible short
term fluctuations. In lizards this is mostly achieved by altering the flight initiation distance
(FID; the distance between predator and prey when the latter starts to flee) when faced
by a predator as well as modifying the recovery behaviour after retreating into a refuge
(Martín & López, 1999b).
The FID is known to be highly related with the risk of being predated and, therefore,
widely used as a proxy of wariness/boldness on this vertebrate group (Martín & López,
1999a; Cooper et al., 2014a). In the framework of the optimal escape theory, prey might
adjust their escape behaviour such that the flight initiation distance would be the point
where the costs of staying exceed the costs of fleeing (Ydenberg & Dill, 1986).
For some American species of lizards it has been described how escape strategies vary
between populations according to differences on predation pressure, with the most
predated lizards being the “shier” ones (Husak & Rouse, 2006a). Through several
studies, it has also been shown that this behaviour adjustment effectively occurs in
lacertid lizards (e.g., Podarcis muralis), with individuals from high predation
environments showing more wariness (thus, with greater FID) than those under low
FCUP
Intraspecific variation in lizard’s antipredatory behaviour
16
predation regimes (Diego-Rasilla, 2003; Zani et al., 2013a). These adjustments are also
reflected in the recovery behaviour of some Lacertids, where time spent inside the refuge
depends on both thermoregulatory costs and the perceived predation risk (Martín &
López, 1999b; Carretero et al., 2006).
Escape behaviour can be affected by other selective pressures besides predation itself.
Environmental conditions or habitat type have an intrinsic effect in some lizards’
behaviour, for instance being more cautious and moving erratically in areas with low
vegetation, compared to areas with higher vegetation cover (Pietrek et al., 2009).
Morphological restrictions associated with microhabitat and refuge use (Kaliontzopoulou
et al., 2010a) might also affect the escape behaviour, by altering locomotor capacity.
Poor body condition in lizards, like in the case of tail loss, can also affect their behaviour,
with animals tending to stay closer to potential refuges (García-Muñoz et al., 2011).
Sexual selection might also influence escape behaviour, favouring the males that remain
visible for longer when a predator appears, allowing them to better defend their territory
against competitors and getting more mating opportunities (Cooper, 2003). Moreover,
the effect of the sexual selection in the escape behaviour intensifies in species where
males show highly conspicuous coloration, making them more easily detected by
predators (Plasman et al., 2007).
It has been suggested that the capacity to quickly respond to changes in the predation
intensity is an adaptive characteristic of the escape behaviour, independently of the
genetic basis (Delibes & Blázquez, 1998). However, behavioural plasticity itself has a
genetic basis in lizards, which relates to the development, and also variation through
time, of the brain areas involved with the processing of sensorial information (Font et al.,
2012). Therefore, since observed differences between populations could hide a genetic
component, it is important to use a model species with low genetic variation across
populations to further investigate the escape and recovery behaviours in lizards under
different predation regimes.
Bocage’s wall lizard
Bocage’s wall lizard, Podarcis bocagei (Seoane, 1884) (Galán, 2015), belongs to the
reptile family Lacertidae. It is a small body sized lizard, endemic to the northwest region
of the Iberian Peninsula (Fig. 1). Previous molecular studies using the mitochondrial DNA
gene ND4 showed a low genetic diversity within the species (Pinho et al., 2007) as well

FCUP
Intraspecific variation in lizard’s antipredatory behaviour
17
as evidence of a postglacial expansion towards north of the distribution range, after a
previous retraction during Pleistocene glaciations.
Figure 1. Distribution range of Podarcis bocagei in the Iberian Peninsula. Source: data downloaded from IUCN.
Sexual dimorphism is accentuated in P. bocagei (Fig. 2). Males have robust and bigger
heads compared to females, result of both sexual selection due to the need to hold and
immobilize the female during copulation and the need to fight other males in territory
defence (Stamps, 1983). Females have a longer trunk, when compared with the rest of
the body, than males, as an evolutionary response to the need to accommodate the eggs
during mating season. This comes from the increased number of the presacral vertebrae
in females (Kaliontzopoulou et al., 2008). Males are dorsally green during the
reproductive season and have brownish body sides, while both females and juveniles
have brown dorsa and sides. In addition, the tail of the juveniles has a conspicuous green
colouration, interpreted as an antipredator mechanism (Castilla et al., 1999a). The
ventral part is generally white or grey, but can be orange in the bigger males. As in the
majority of reptile species, becoming sexually mature is related with growing to a
minimum size, instead of reaching a determined age. In females, the minimum size is
FCUP
Intraspecific variation in lizard’s antipredatory behaviour
18
44-45 mm of snout-vent length (SVL) and for males it is 46-51 mm. Once adults, the
mean SVL for males is 56.9 mm and 54.7 mm for females (Galán, 1996).
The activity period of this species begins between February and March and lasts until
the end of November. Populations near the coast are active all year round. Despite
generally having a unimodal daily activity, in summer months the high temperatures
during the middle of the day lead to a bimodal activity (Galán, 2009b). Thermal and water
characteristics of each area also condition the periods of daily activity. P. bocagei has a
generalist diet, including diptera, coleoptera, hymenoptera and other small invertebrates
captured through active search (Galán & Fernández, 1993). Mating season takes place
between April and July, and the number of laid eggs ranges between 2 and 7 (Galan,
1997). After hatching, the juveniles appear between the beginning of July and mid-
September.
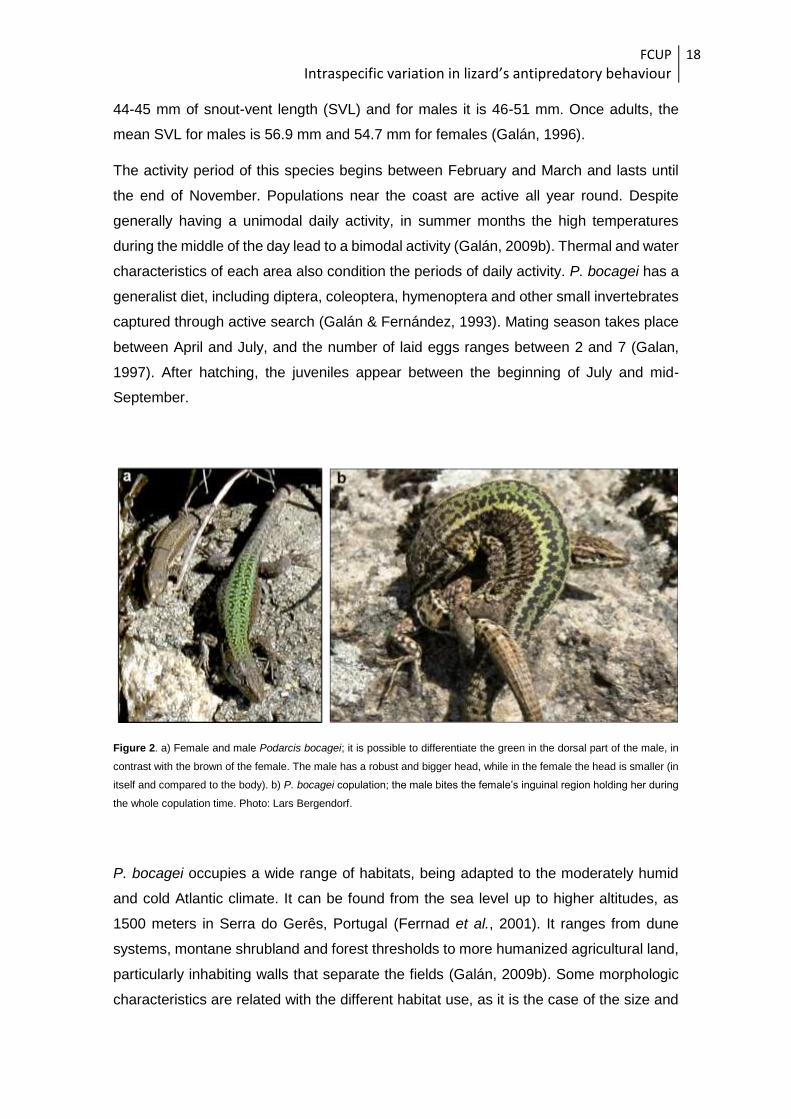
Figure 2. a) Female and male Podarcis bocagei; it is possible to differentiate the green in the dorsal part of the male, in
contrast with the brown of the female. The male has a robust and bigger head, while in the female the head is smaller (in
itself and compared to the body). b) P. bocagei copulation; the male bites the female’s inguinal region holding her during
the whole copulation time. Photo: Lars Bergendorf.
P. bocagei occupies a wide range of habitats, being adapted to the moderately humid
and cold Atlantic climate. It can be found from the sea level up to higher altitudes, as
1500 meters in Serra do Gerês, Portugal (Ferrnad et al., 2001). It ranges from dune
systems, montane shrubland and forest thresholds to more humanized agricultural land,
particularly inhabiting walls that separate the fields (Galán, 2009b). Some morphologic
characteristics are related with the different habitat use, as it is the case of the size and

FCUP
Intraspecific variation in lizard’s antipredatory behaviour
19
shape of the head; it being bigger in animals inhabiting dune or bush areas, compared
to lizards living in stone walls, given that the latter are under selection resulting from the
use of small crevices as refuge (Kaliontzopoulou et al., 2010a).
These lizards are predated by several different species in their distribution and habitat
range. Among aerial predators we can find Falco tinnunculus (Common kestrel), Buteo
buteo (Common buzzard), Corvus monedula (Eurasian jackdaw) and Larus michahellis
(Yellow-legged gull). Several ophidians can predate on small lizards, including the
saurophagus specialists from the Coronella genus (Smooth snakes), Vipera latastei, V.
seoanei (Lataste and Seoane vipers) and Malpolon monspessulanus (Montpellier
snake), as well as the Ocellated lizard Timon lepidus (Galán, 2009b). In areas with
human presence, the domestic cat, Felis silvestris catus, may also predate on P. bocagei
lizards (Carretero pers. obs.).
FCUP
Intraspecific variation in lizard’s antipredatory behaviour
20
Objectives
The aim of the present work is to infer the factors determining the intraspecific variation
in the antipredatory behaviour of lizards’ species focusing on predation pressure. This
has been previously studied in species where some of their populations had undergone
a strong predatory release, such as in the case of islands. On these scenarios, the
marked differences in the presence of natural predators among different populations led
to drastic changes in antipredator tactics, from behavioural responses like lower FID
distances in lower predation environments (Cooper, Jr. et al., 2009) to physiological
ones, involving the ability to rapidly regrow the tail after autotomy if predators are highly
abundant (Pafilis et al., 2009).
However, here I want to explore the ability of lizards to properly assess both the variable
predation risks and the associated costs of fleeing when considering low-spatial scale
scenarios. Thus, studying populations from relatively closer areas (avoiding the
mainland-island approach) will allow to infer if lizards are able to accurately modulate
their antipredatory behaviours accordingly to slight changes in predator intensities. In
order to do this, I decided to use the Bocage’s wall lizard as model species due to its
presence across a large area of north Portugal (Galán, 2015), potentially being exposed
to different types and levels of predation pressures. Also, the low genetic variation across
populations (Pinho et al., 2007) contributed to the use of this species as study model,
reducing the possible differences in antipredatory tactics originated due to deep
evolutionary history.
Therefore, the main objective of this study is to determine how the effect of different
predation intensities is involved with the antipredator behaviour of Podarcis bocagei,
while also accounting for differences on habitat use across populations.
In order to achieve this global objective, a field study of the escape behaviour in P.
bocagei was carried out, together with a posterior statistical procedure characterized by
a model selection approach. Through this, I pursued to determine the effect of different
predation intensities in the escape and recovery behaviours of lizards, by establishing
which of its components experience larger shifts (being more plastic) and the direction
of the responses. At the same time, possible interactions between natural and sexual
selection, as well as the contribution of other lizard variables (e.g., state of the tail as
antipredator device, activity and presence of conspecifics) were also considered when
exploring differences in antipredatory behaviours among populations.

FCUP
Intraspecific variation in lizard’s antipredatory behaviour
21
MATERIALS & METHODS

FCUP
Intraspecific variation in lizard’s antipredatory behaviour
22
Study sites
Fieldwork for the present study was conducted on 6 different coastal locations from
north-western Portugal with known populations of Podarcis bocagei (Fig. 3): Mindelo
(MIN; 41°19'07.19" N, 8°44'17.59" W), Madalena (MAD; 41º 6’ 14’’N, 8º 39’41’’W),
Esposende (ESP; 41°32'52.88" N, 8°47'27.59" W), Gião “Igreja” (GI; 41°18'37.32" N ,
8°40'12.93" W), Gião “Rochio” (GR, 41°17'59.71" N, 8°41'00.57" W) and São Mamede
do Coronado (SMC; 41°16'34.90" N 8°34'17.63" W). These locations were specifically
sampled in order to represent two major habitat types used by the study species
(Kaliontzopoulou et al., 2010b), coastal dunes and granitic agricultural walls, within a
geographically restricted and climatically homogenous area. The first three locations
(MIN, MAD and ESP) consisted on open landscapes of Atlantic coastal dunes, with a
typical habitat structure ranging from foredunes and interdunes dominated by the
European beachgrass (Ammophila arenaria) and other psammophile vegetation to
backdunes with dominance of the maritime pine (Pinus pinaster) (Barreto-Caldas et al.,
1999).
Figure 3. Studied areas and their location in North Portugal.

FCUP
Intraspecific variation in lizard’s antipredatory behaviour
23
On the other side, populations in GI, GR and SMC are located within agricultural areas
where the main habitat for the species consists on granitic walls, being characterized by
the presence of abundant crevices as potential refuges as well as some level of
vegetation cover in some sections: thornless blackberry (Rubus ulmifolius) and common
ivy (Hedera helix) on the upper parts of the walls and different ferns and ruderal species
on the ground-level part of the walls.
Behavioural observations
Fieldwork was carried out during spring and summer days with suitable weather
conditions for lizards’ activity, which consisted on sunny and warm days, although not
extremely warm, and without strong wind. In order to prevent affecting the risk perception
of lizards by potential confounding effects (Burger & Gochfeld, 1993), all observations
were made by the same researcher (A.C.S.), wearing similar clothes and walking slowly
in a constant pace until individuals were sighted. To ensure the independency of
observations, transects were especially conducted to prevent repetitive encounters with
the same individuals. Those animals with evident signs of low body condition (bad
nutrition status) or lost limbs were excluded from the study.
Once an individual was detected, the use of binoculars allowed to record some of the
lizards’ traits from the distance without altering them: class (adult male, adult female or
juvenile), activity (if it was basking/thermoregulating or actively moving/foraging),
“sociality” (if it was close to or interacting with another conspecific) and regeneration
status of the tail (whether its tail was apparently original or had been previously
lost/regenerated). Upon properly identifying an individual, the researcher walked directly
towards it at a constant speed simulating a predatory attack until the subject fled (Martin
& Lopez, 1999). Diverse behavioural responses were recorded comprising both escape
and recovery lizards’ tactics (Fig. 4). Regarding the escape behaviour, the approach
distance, also known as flight initiation distance (FID; observer-lizard distance when the
latter begins to flee) and the distance fled (between the spot where the lizard started to
move and the selected refuge) were recorded.
FCUP
Intraspecific variation in lizard’s antipredatory behaviour
24
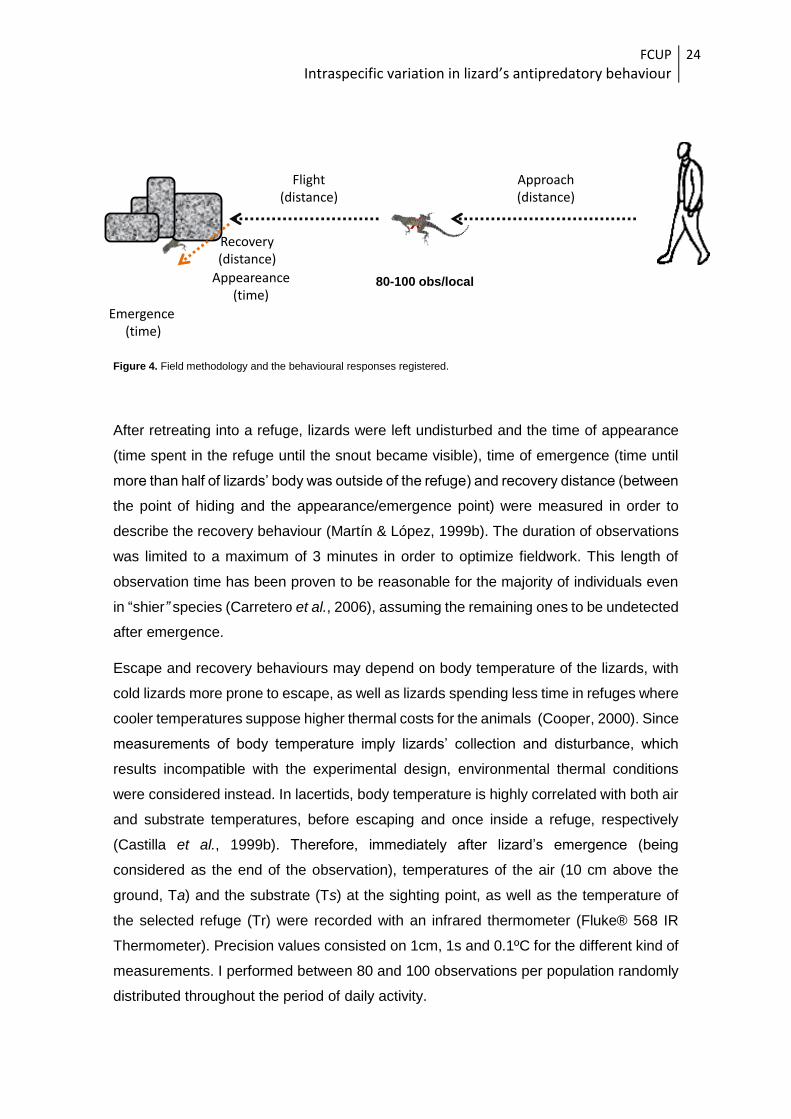
After retreating into a refuge, lizards were left undisturbed and the time of appearance
(time spent in the refuge until the snout became visible), time of emergence (time until
more than half of lizards’ body was outside of the refuge) and recovery distance (between
the point of hiding and the appearance/emergence point) were measured in order to
describe the recovery behaviour (Martín & López, 1999b). The duration of observations
was limited to a maximum of 3 minutes in order to optimize fieldwork. This length of
observation time has been proven to be reasonable for the majority of individuals even
in “shier” species (Carretero et al., 2006), assuming the remaining ones to be undetected
after emergence.
Escape and recovery behaviours may depend on body temperature of the lizards, with
cold lizards more prone to escape, as well as lizards spending less time in refuges where
cooler temperatures suppose higher thermal costs for the animals (Cooper, 2000). Since
measurements of body temperature imply lizards’ collection and disturbance, which
results incompatible with the experimental design, environmental thermal conditions
were considered instead. In lacertids, body temperature is highly correlated with both air
and substrate temperatures, before escaping and once inside a refuge, respectively
(Castilla et al., 1999b). Therefore, immediately after lizard’s emergence (being
considered as the end of the observation), temperatures of the air (10 cm above the
ground, Ta) and the substrate (Ts) at the sighting point, as well as the temperature of
the selected refuge (Tr) were recorded with an infrared thermometer (Fluke® 568 IR
Thermometer). Precision values consisted on 1cm, 1s and 0.1ºC for the different kind of
measurements. I performed between 80 and 100 observations per population randomly
distributed throughout the period of daily activity.
Figure 4. Field methodology and the behavioural responses registered.
X
Flight(distance)
Approach(distance)
Appeareance(time)
Recovery(distance)
Emergence(time)
Attack simulation
80-100 obs/local

FCUP
Intraspecific variation in lizard’s antipredatory behaviour
25
Predation pressure estimation
Estimating predation pressure has been shown in the literature to be a problematic issue
(Castilla & Labra, 1998; Vervust et al., 2011; Zani et al., 2013b). Different methods had
been used with this purpose: i) recording the frequency of tail-loss (either broken or
regenerated tails) among lizards as an estimate of relative predation pressure between
populations (Turner et al., 1982); ii) the use of soft (clay) models of the studied prey
species to record and compare the number of predatory attacks between locations
(Diego-Rasilla, 2003; Husak & Rouse, 2006b); and iii) recording both the
absence/presence of putative predator species and quantifying the number of individual
predators detected per location (Zani et al., 2013b). However, some of these methods
can be problematic due to the inherent biology of the study species and the predator
species present. Regarding the comparison of tail-loss frequencies between populations,
the loss of the tail in lizards can also be the result of an episode of conspecific
aggressiveness (Itescu et al., 2016), triggered either by dominance behaviour or a
cannibalism attempt, which has already been recorded in other species of the same
genus (Salvador, 1986). Moreover, even when not taking into account intraspecific
aggression, the incidence of tail loss may not be easily interpretable (Bateman &
Fleming, 2009), since a higher frequency of lost tails could indicate either a higher
predation intensity or a greater inefficiency of the predators present. Regarding the use
of soft replicas, differences in predator species composition between locations (e.g.,
aerial/terrestrial, generalist/specialized) can produce misleading results due to their
different response, hence number of registered attacks, towards immobile lizard models
(Husak et al., 2006; Bitenc et al., in preparation). On the other hand, the direct
observation and surveys needed to get strong estimates for predator species presence
and abundances usually implies a complete parallel study, thus requiring even more
sampling efforts that sometimes are simply not available due to resources and timing
constraints. Therefore, a combination of all these three methods was chosen to best
estimate the main trends in the variation of relative predation intensities between the
populations of interest.

FCUP
Intraspecific variation in lizard’s antipredatory behaviour
26
Following the same procedures as in Bitenc et al. (in
preparation), the used clay models were made to
resemble real lizards as closely as possible (Fig. 5).
They were painted according to the sexual dimorphism
present in P. bocagei (Galán, 2008), with half of the
models painted green to represent males and the other
half brown to represent females. The body of the models
was 54 – 58 mm long, which falls within the average
snout-vent length (SVL) of adults of P. bocagei (Galán,
1986). On each location, 100 models were placed on
the usual lizards’ locations during the lizard daily activity
period. In particular, models were left for eight/nine hours over the day and collected in
the same afternoon. Overnight exposure was not contemplated in this study due to the
strict diurnal activity of P. bocagei (Galán, 2009a). Models were always placed on open,
exposed surfaces without vegetation cover to simulate immobile thermoregulating
lizards. The models were placed following a linear transect with a 2 m interval between
them. When collecting the models, they were carefully inspected for any kind of damage
and its position on the replica (head, body, limbs, tail) was registered, as well as
occasional disappearances of models. Damage could take the form of either known
predator marks or unknown sources (also contemplating possible human interaction).
Frequencies of tail loss across populations were obtained by recording with binoculars
the state of the tail of all lizards that contributed to the field observations. Only broken or
partially regenerated tails were considered to avoid the cases in which tail loss was most
likely suffered when juveniles.
In order to obtain rough estimates regarding predator species composition, total numbers
of detected individual predators were registered during transects to record lizards’
behavioural responses. To make comparisons possible between localities, all
observations were made by the same researcher (A.C.S). Differences in sampling effort
between days and localities were taken into account by dividing, in each case, the
number of individuals detected by the hours spent in the field.
Figure. 5 Clay models.

FCUP
Intraspecific variation in lizard’s antipredatory behaviour
27
Statistical Analyses
Due to largely unbalanced numbers of adult and juvenile lizards detected during the
present study, with the later ones being much less abundant, these were removed from
the main analysis. To study the possible contribution of experience in predator
avoidance, comparisons between adult and juvenile lizards were performed in a separate
analysis of covariance, in which “size class” (adult/juvenile) was the only factor
considered and Ta as the respective covariate. Due to the aforementioned differences
on sample size between the two classes of lizards, a re-sampling approach allowed to
randomly select a subsample of adult individuals from the original dataset equivalent to
the total number of juveniles available. This procedure was repeated 1000 times and, as
a result, here it is reported the percentage of the times in which significant differences
arose between the two different size classes of lizards.
Regarding the main analysis of this work, initially based in linear mixed models, the
dependent variables reflecting lizards’ escape (1) and recovery (2) behavioural
responses are, respectively: 1) FID and fled distance, and 2) recovery distance,
appearance and emergence time. The contemplated independent variables are shown
in the Table 1. The main factors of interest are habitat type and predation level for which
I have major predictions, where increased predation levels are expected to translate into
“shier” animals while habitat type could determine general constraints on their
responses. Remaining variables, such as presence of conspecifics, activity, sex and tail
state, will be used in an exploratory way because their effect on escape tactics could
interact in highly complex responses. Among fixed factors, predation level which is
nested within habitat type, requires especial attention. The reason behind its nested
nature relies in the fact that predation estimations in the field, as it can be seen in the
results, revealed differences in predator species composition between habitats. Thus,
despite distinguishing in both habitat types only between the same two levels of
predation intensity (categorized as “high” and “low”), we assumed that they were not
comparable amongst them, selecting a nested design for this factor instead of a crossed
one. Hour and month as independent variables were also included as potential random
factors to account for possible differences due to daily activity and seasonality in
reproductive condition of the species (Galán, 2009a), if necessary.

FCUP
Intraspecific variation in lizard’s antipredatory behaviour
28
Table 1. Factor type and levels of the independent variables used for statistical analyses.
Factor Type Levels
Habitat type Fixed Dunes, Walls
Predation level Fixed
Nested within Habitat High, Low
Sex Fixed Male, Female
Regeneration Fixed Yes, No
Activity Fixed Yes, No
Sociality Fixed Yes, No
Hour Random 21 levels (half hour
intervals)
Month Random 5 levels
Both air (Ta) and substrate (Ts) temperatures were considered as covariates, together
with the thermoregulatory costs associated to the use of refuges with sub-optimal thermal
conditions by ectotherm animals like P. bocagei. Since lizards from the genus Podarcis
had shown to be able to use both radiation and conduction as heat sources (Perera,
2005), the thermoregulatory costs were estimated while considering the combination of
refuge temperature (Tr) with both Ta and Ts. These costs were calculated according to
Scheers & Van Damme (2002): Tr+Ta
|Tr-Ta|=δar and
Tr+Ts
|Tr-Ts|=δsr , where δar and δsr
correspond to the costs of refuge usage regarding air and substrate thermal conditions,
respectively.
Due to the exploratory nature of this study, where despite for habitat type and predation,
there are not specific predictions on the ensemble of the remaining factors’ effect on the
response variables, a model selection approach was selected (Grueber et al., 2011). In
the same frame of work, where I wanted to investigate both i) the different level of
response of each dependent variable regarding the main effects of habitat and predation
and ii) preliminary assess the role of the other included independent variables in P.
bocagei antipredatory behaviour, multiple univariate analyses were chosen to perform
instead of a single multivariate analysis (Huberty & Morris, 1989).

FCUP
Intraspecific variation in lizard’s antipredatory behaviour
29
Therefore, for each of the five studied behavioural responses (FID, fled distance,
recovery distance, appearance and emergence time) it was performed the same general
step-procedure, taking into account the underlying biological reasoning to select for
predictor variables in each case.
1) A preliminary screening of the raw data allowed to search for notable outliers and
missing data on each response variable. Both boxplots and Cleveland dotplots
were used as graphical tools to visualize potential outliers. Outliers with
deviations due to obvious human errors or extreme and punctual responses of
lizards (e.g., allowing to virtually catch them) were discarded.
2) Collinearity among continuous explanatory variables was inspected by means of
a correlation matrix with the function “corr.test” implemented in the R package
“psych” (Revelle, 2016), which provides adjusted p-values for multiple tests.
Additionally to manual inspection, an analysis of the variance inflation factor (VIF)
was also implemented as a collinearity diagnostic (Liao & Valliant, 2012). A
threshold of VIF < 2 was set, with covariates being sequentially dropped if that
values is exceeded, until the recalculated VIF for the remaining ones were
comprised within the accepted values (Zuur et al., 2010).
3) Following a procedure similar to the one described in Grueber et al. (2011), the
assessment of the random structure of the model was the next step in the proper
model selection process. With this purpose, four possible models were
constructed to test whether random intercepts for random factors of “hour” and
“month” should be included or not in the next models (Table 2): i) a null model
with no random structure, ii) and iii) models only comprising either “month” or
“hour” as a random factor to test for the significance of the one not included when
comparing them with the full random model, iv) a full random model comprising
both random variables.
Table 2. Models created for each combination of random factors.
Model Random factors included
Null model -
Random “hour” + (1|month)
Random “month” + (1|hour)
Full random model + (1|hour)+(1|month)
FCUP
Intraspecific variation in lizard’s antipredatory behaviour
30
The mentioned models were constructed while establishing the same preliminary
fixed structure (yet not explored), which comprised the most complex possible
structure in terms of predictor variables under the constraints of biological
reasoning towards them. The used fixed structures for each of the dependent
variables were as follows:
FID ~ Ta + Ts + habitat*sex + habitat/predation + regen + active + social +
habitat:active + sex:regen + habitat:social
Fled ~ FID + Ta + Ts + habitat*sex + habitat/predation + regen + active + social +
habitat:active + sex:regen + habitat:social
Recovery distance ~ fled + δar + δsr + habitat*sex + habitat/predation + regen
+ active + social + habitat:active + sex:regen + habitat:social
Appearance time ~ fled + reco + δar + δsr + habitat*sex + habitat/predation +
regen + active + social + habitat:active + sex:regen + habitat:social
Emergence time ~ fled + reco + δar + δsr + habitat*sex + habitat/predation +
regen + active + social + habitat:active + sex:regen + habitat:social
Multiple linear regression models were therefore fitted with the correspondent
fixed structure. As it can be noted, the fixed categorical factors are the same for
all 5 models, while the selected covariates differ. The reason behind this relies
on biological logic and the sequential nature of the lizards’ escape and recovery
responses. Before retreating into a refuge, I assume that the potential covariates
influencing the “escape tactics” (FID and fled) are the temperatures (Ta and Ts)
of the external environment were the lizard was sighted. Moreover, the inclusion
of FID as covariate for fled responds to the fact that the decision making process
of the lizard when retreating into a closer or further refuge could be modulated by
the perceived instantaneous predation risk (inherent to the FID). Actually, FID
FCUP
Intraspecific variation in lizard’s antipredatory behaviour
31
and fled distances have shown to be correlated in some lizard species (Carretero
et al., 2006; Samia et al., 2015). After retreating into a -usually colder- refuge, I
expect that the associated thermoregulatory costs ( δar and δsr ) would modulate
the lizard recovery behaviours rather than the exterior temperature conditions.
Also, one could also hypothesize that the physical effort of running towards a
refuge (reflected by fled) would also affect the time spent within the refuge before
recovering its condition. Since fled could be correlated with FID, the inclusion of
the first as a covariate would allow to account for both the effect of the escape
effort and the perceived instantaneous risk while avoiding the collinearity of
including both FID and fled. Therefore, fled, δar and δsr were used as
covariates for recovery distance, appearance time and emergence time.
The four possible random structures were ranked according to the corrected
Akaike Information Criterion (AICc; Hurvich & Tsai, 1989) while using a restricted
maximum likelihood (REML) estimation (Zuur et al., 2009). Afterwards, they were
also tested with likelihood ratio tests (LRT) between pairs of nested models to
validate the obtained ranked results. The best candidate random structure was
kept for the rest of the model selection process in which, together with the
respective previously set fixed effects, they constituted the global model.
4) After defining the best random structure, the assessment of the fixed structure of
the models was performed by using the function dredge of the R package MuMIn
(Barton, 2016). With this procedure, the combination of the pre-established fixed
structures together with the obtained random structures (also known as global
model) allowed to generate a full submodel set of all simpler factor combinations.
Simultaneously, all obtained models were automatically ranked according to its
AICc index. Bayesian information criterion (BIC) was also used to validate the
obtained classification. The obtained model set was not restricted (forced to
always include any given factor) subsequently including the null model in the
analysis. To be able to compare between models with different fixed structures,
these were fitted by maximum likelihood (ML) estimation (Zuur et al., 2009).
5) Likelihood ratio tests (LRT) were systematically performed between pairs of
nested models from the subset of these best ranked according to the AICc index
(ΔAICc < 3). If significant differences arose between models we kept the more
complex one as the best “suitable”, while non-significances drove to kept the
simpler ones. Following this procedure, a single best candidate model was

FCUP
Intraspecific variation in lizard’s antipredatory behaviour
32
obtained for each dependent variable.
6) Since LRTs are performed manually between pairs of nested models, more fitted
models could eventually be overlooked by the researcher. Therefore, as a
secondary approach to select proper model parameters and to confirm the
previously obtained model as the best candidate to explain our data, I conducted
a k-fold cross-validation (Stone, 1974). In each case, only the first 8 ranked
models according to AICc were included since the best candidate was always
within them. The cross-validation approach allows to obtain an estimation of the
robustness or predictive performance of a given model by dividing the data into
subgroups, using one part to train the model and the other to validate it (Stone,
1974). In k-fold cross-validation, data is partitioned into k folds (equally in size),
with a single fold kept for validation and the remaining ones used to train the
model. This procedure is repeated k times so each single fold had been used for
validation. As a result, an estimate of the classifier error is obtained. However, to
obtain an accurate estimate of the accuracy of a classifier, the k-fold cross-
validation is run n times, in each case starting with a different random
arrangement of the data into the k-folds. Here, I conducted a k-fold cross-
validation with k=10 and n=100. The models with the best performance will be
those with minimum values for the average classifier error (E) while also having
lower standard deviations of the mentioned classifier errors (σ). Different types
of graphics were used to depict the obtained results. If cross-validation pointed
to a different model as the best candidate, further inspection was given to select
between them.
7) After assessing the best candidate model for each dependent variable, visual
inspection of the residuals (using q-q plots and observed vs fitted values) together
with Shapiro-Wilks’ and Levene’s tests (p-values set at α=0.05) were used to
assess the normality of the data and the homogeneity of variances, respectively.
Logarithmic (log10) and square root transformations were considered when
these assumptions were not met and all the previous model selection process
was repeated with the new transformed variables. When necessary, 0.5 was
added to the variables presenting zero values before logarithmic transformations
took place.
8) For each final candidate model, an analysis of covariance (ANCOVA) with Type

FCUP
Intraspecific variation in lizard’s antipredatory behaviour
33
III sums of squares was conducted in order to study the significance of each
included parameter, since being incorporated in the candidate model not always
related with having a significant effect. Type III sums of squares were preferred
due to some differences in sample sizes between groups, since this fact could
mask the significance of some factors if Type I sums of squares was chosen
instead. When a factor appeared to have a significant effect on the dependent
variable, means of the given response variable for the different groups were
given. Multiple comparisons were not necessary due to the presence of only two
levels on each included independent variable. If significances arose due to
interactions, significant main effects were therefore not interpreted.
All statistical analyses were performed using R v. 2.14.2 (R Core Team, 2016).

FCUP
Intraspecific variation in lizard’s antipredatory behaviour
34
RESULTS

FCUP
Intraspecific variation in lizard’s antipredatory behaviour
35
Predation pressure
In total, 1800 clay models (300 per location, 100 per location and day -9 hours-) were
exposed in the field in order to register predatory attacks. In coastal dunes habitats, no
marks were detected in any of the 900 of total models exposed. In localities within
agricultural areas, marks were found, but only consisted on 1-2 models per locality
presenting marks clearly attributable to avian species.
On the other hand I could only rely on the tail-loss frequency and the estimations of
predator abundances to assess differences in predation intensity between localities. The
percentage of lizards with broken or partially regenerated tails (Fig. 6) showed to be
different across the six populations (chi-square test; χ2=12.26, d.f.=5, P=0.03139). When
considering only the four populations with higher percentages of tail-loss (GI, 65.3%
n=75; SMC, 65.1%, n=89; MIN, 70.5%, n=95 and ESP, 67.4%, n=83), no differences
were shown between them (chi-square test; χ2=0.76, d.f.=3, P=0.85). Also, no
differences were found between the two populations with lower percentages (GR, 48.7%,
n=78; MAD, 55.4%, n=92) (chi-square test; χ2=0.517, d.f.=1, P=0.471). Moreover,
values from each of the two detected groups (with either higher or lower tail-loss
percentages) were pooled together and compared, still observing differences between
them (chi-square test; χ2=10.107, d.f.=1, P=0.0014).
Figure 6. Percentage of tail-loss in the six studied populations.
FCUP
Intraspecific variation in lizard’s antipredatory behaviour
36
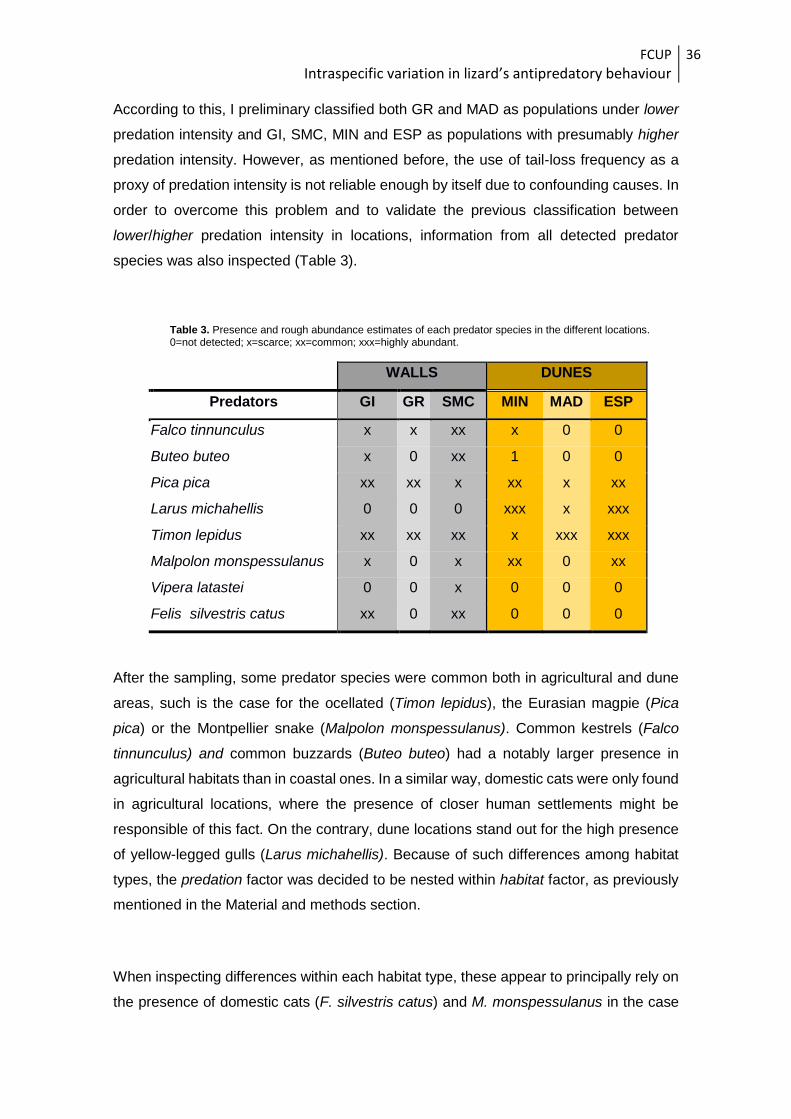
According to this, I preliminary classified both GR and MAD as populations under lower
predation intensity and GI, SMC, MIN and ESP as populations with presumably higher
predation intensity. However, as mentioned before, the use of tail-loss frequency as a
proxy of predation intensity is not reliable enough by itself due to confounding causes. In
order to overcome this problem and to validate the previous classification between
lower/higher predation intensity in locations, information from all detected predator
species was also inspected (Table 3).
Table 3. Presence and rough abundance estimates of each predator species in the different locations. 0=not detected; x=scarce; xx=common; xxx=highly abundant.
WALLS DUNES
Predators GI GR SMC MIN MAD ESP
Falco tinnunculus x x xx x 0 0
Buteo buteo x 0 xx 1 0 0
Pica pica xx xx x xx x xx
Larus michahellis 0 0 0 xxx x xxx
Timon lepidus xx xx xx x xxx xxx
Malpolon monspessulanus x 0 x xx 0 xx
Vipera latastei 0 0 x 0 0 0
Felis silvestris catus xx 0 xx 0 0 0
After the sampling, some predator species were common both in agricultural and dune
areas, such is the case for the ocellated (Timon lepidus), the Eurasian magpie (Pica
pica) or the Montpellier snake (Malpolon monspessulanus). Common kestrels (Falco
tinnunculus) and common buzzards (Buteo buteo) had a notably larger presence in
agricultural habitats than in coastal ones. In a similar way, domestic cats were only found
in agricultural locations, where the presence of closer human settlements might be
responsible of this fact. On the contrary, dune locations stand out for the high presence
of yellow-legged gulls (Larus michahellis). Because of such differences among habitat
types, the predation factor was decided to be nested within habitat factor, as previously
mentioned in the Material and methods section.
When inspecting differences within each habitat type, these appear to principally rely on
the presence of domestic cats (F. silvestris catus) and M. monspessulanus in the case
FCUP
Intraspecific variation in lizard’s antipredatory behaviour
37
of wall habitats and L. michahellis and M. monspessulanus in dune habitats. Regarding
agricultural walls, the mentioned differences were due to the complete absence of the
above mentioned predators in GR while they appeared to be quite more abundant (or at
least detectable) in GI and SMC, thus giving more support to the previous classification
of localities with high/low predation intensities. The same pattern was detected in coastal
dune habitats, where the population of MAD (previously classified as with low predation
intensity) had no detected predatory snakes and a low presence of yellow-legged gulls,
highly contrasting with the other two locations where the detection of these species was
more relevant. Therefore, contrasting the results of both tail-loss frequencies and
predator species abundances led to the final classification of GR (from “walls”) and MAD
(from “dunes”) as locations with lower predation intensities, while all other locations were
thereafter treated as locations with higher predation intensities.
Antipredatory behaviour
Behavioural responses were collected for a total number of 552 lizards: 322
corresponding to adult males, 190 for adult females and 40 for juveniles. Despite
differences in absolute numbers for adult males and females, the sex ratio was found to
be the same across all six studied populations (chi-square test; χ2=5.096, d.f.=5,
P=0.404). Regarding the juveniles, their different presence between populations (ranging
from 1 to 16 individuals) and the much lower number of observations when compared
with the adults, suggested to remove them from the main analysis as previously stated.
However, comparisons between the overall behavioural responses of adults and
juveniles were inspected in a separate analysis where a re-sampling approach allowed
to obtain equal sample sizes between groups (adult-juveniles). Results are given in terms
of the percentage of times in which significant differences arose between lizards’ classes
when performing 10000 repetitions for each dependent variable: FID (21,44%), fled
(1,04%), appearance (91,76%), emergence time (63,15%) and recovery distance (
25,2%). Appearance time, in relation with other variables, presented a higher percentage
of significant tests, where juveniles commonly took shorter times to exit the refuge.
After juvenile removal, together with the exclusion of eight clear outliers, the final dataset
consisted on 504 observations. Table 4 comprises descriptive statistics for each studied
location. Data are presented as means ± SE.
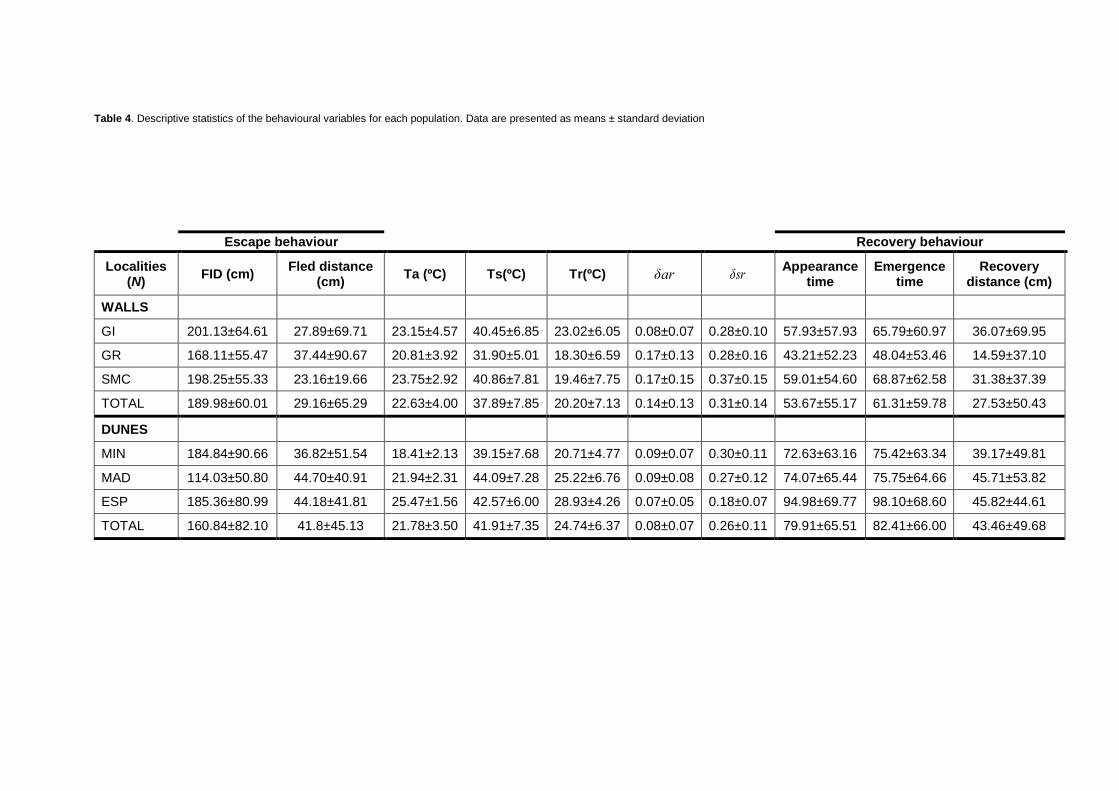
Table 4. Descriptive statistics of the behavioural variables for each population. Data are presented as means ± standard deviation
Escape behaviour Recovery behaviour
Localities (N)
FID (cm) Fled distance
(cm) Ta (ºC) Ts(ºC) Tr(ºC) δar δsr
Appearance time
Emergence time
Recovery distance (cm)
WALLS
GI 201.13±64.61 27.89±69.71 23.15±4.57 40.45±6.85 23.02±6.05 0.08±0.07 0.28±0.10 57.93±57.93 65.79±60.97 36.07±69.95
GR 168.11±55.47 37.44±90.67 20.81±3.92 31.90±5.01 18.30±6.59 0.17±0.13 0.28±0.16 43.21±52.23 48.04±53.46 14.59±37.10
SMC 198.25±55.33 23.16±19.66 23.75±2.92 40.86±7.81 19.46±7.75 0.17±0.15 0.37±0.15 59.01±54.60 68.87±62.58 31.38±37.39
TOTAL 189.98±60.01 29.16±65.29 22.63±4.00 37.89±7.85 20.20±7.13 0.14±0.13 0.31±0.14 53.67±55.17 61.31±59.78 27.53±50.43
DUNES
MIN 184.84±90.66 36.82±51.54 18.41±2.13 39.15±7.68 20.71±4.77 0.09±0.07 0.30±0.11 72.63±63.16 75.42±63.34 39.17±49.81
MAD 114.03±50.80 44.70±40.91 21.94±2.31 44.09±7.28 25.22±6.76 0.09±0.08 0.27±0.12 74.07±65.44 75.75±64.66 45.71±53.82
ESP 185.36±80.99 44.18±41.81 25.47±1.56 42.57±6.00 28.93±4.26 0.07±0.05 0.18±0.07 94.98±69.77 98.10±68.60 45.82±44.61
TOTAL 160.84±82.10 41.8±45.13 21.78±3.50 41.91±7.35 24.74±6.37 0.08±0.07 0.26±0.11 79.91±65.51 82.41±66.00 43.46±49.68
FCUP
Intraspecific variation in lizard’s antipredatory behaviour
39
Escape behaviour
Collinearity was not found among the continuous independent variables considered for
both FID and fled distances, thus none of them were excluded for the construction of the
global models. FID and fled distances were logarithmically transformed as well as the
respective continuous covariates in order to improve normality, eliminate heterogeneity
of variances and to linearize the correspondent relationships. Neither in FID or fled
distances the inclusion of random variables was suggested by comparisons among all
possible random structures.
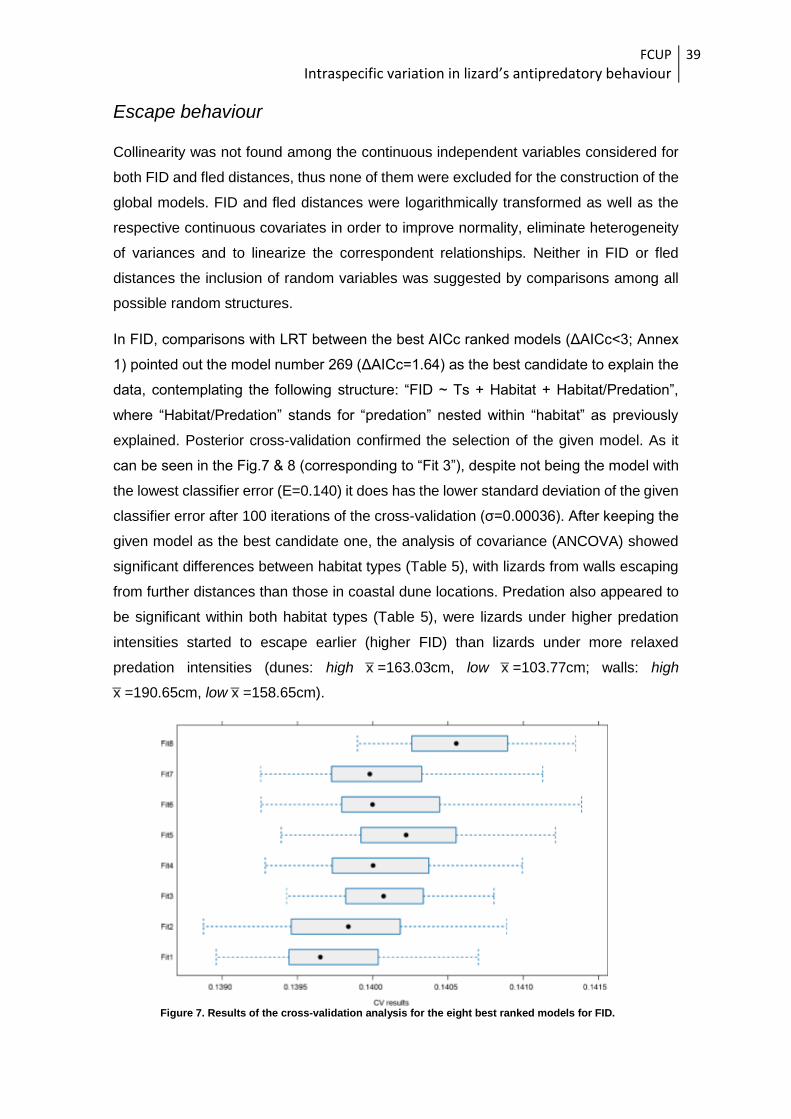
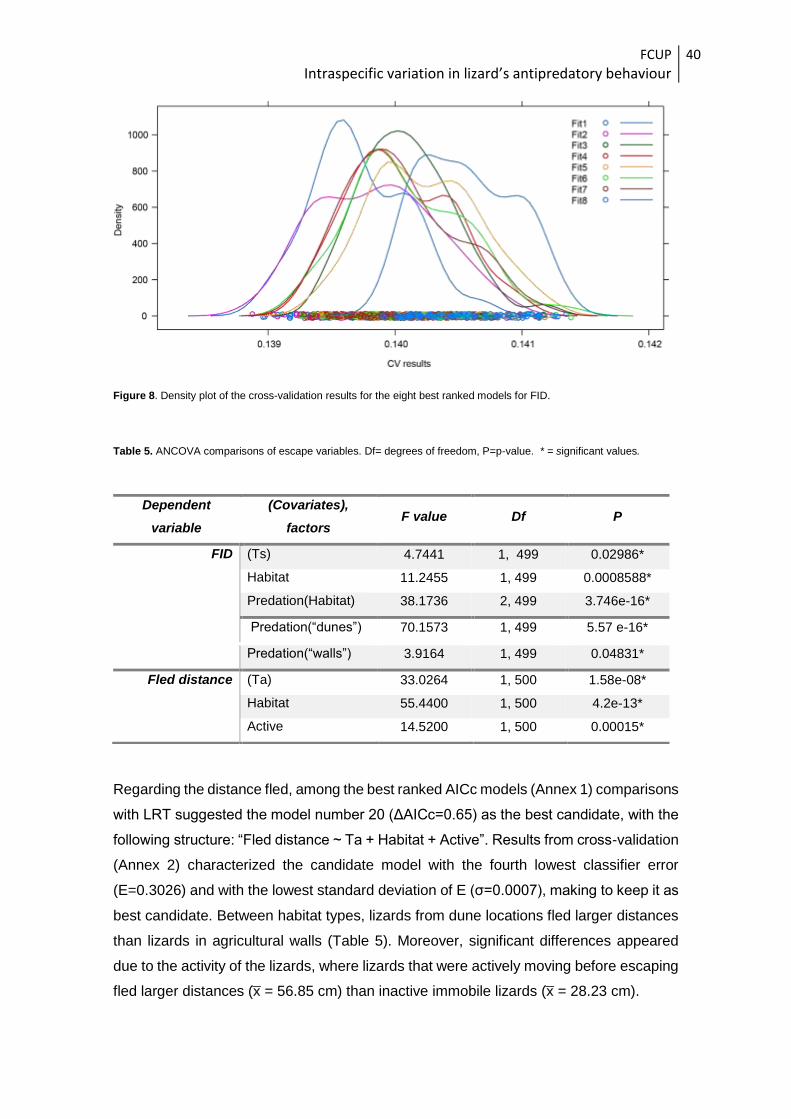
In FID, comparisons with LRT between the best AICc ranked models (ΔAICc<3; Annex
1) pointed out the model number 269 (ΔAICc=1.64) as the best candidate to explain the
data, contemplating the following structure: “FID ~ Ts + Habitat + Habitat/Predation”,
where “Habitat/Predation” stands for “predation” nested within “habitat” as previously
explained. Posterior cross-validation confirmed the selection of the given model. As it
can be seen in the Fig.7 & 8 (corresponding to “Fit 3”), despite not being the model with
the lowest classifier error (E=0.140) it does has the lower standard deviation of the given
classifier error after 100 iterations of the cross-validation (σ=0.00036). After keeping the
given model as the best candidate one, the analysis of covariance (ANCOVA) showed
significant differences between habitat types (Table 5), with lizards from walls escaping
from further distances than those in coastal dune locations. Predation also appeared to
be significant within both habitat types (Table 5), were lizards under higher predation
intensities started to escape earlier (higher FID) than lizards under more relaxed
predation intensities (dunes: high x̅ =163.03cm, low x̅ =103.77cm; walls: high
x̅ =190.65cm, low x̅ =158.65cm).
Figure 7. Results of the cross-validation analysis for the eight best ranked models for FID.
FCUP
Intraspecific variation in lizard’s antipredatory behaviour
40
Figure 8. Density plot of the cross-validation results for the eight best ranked models for FID.
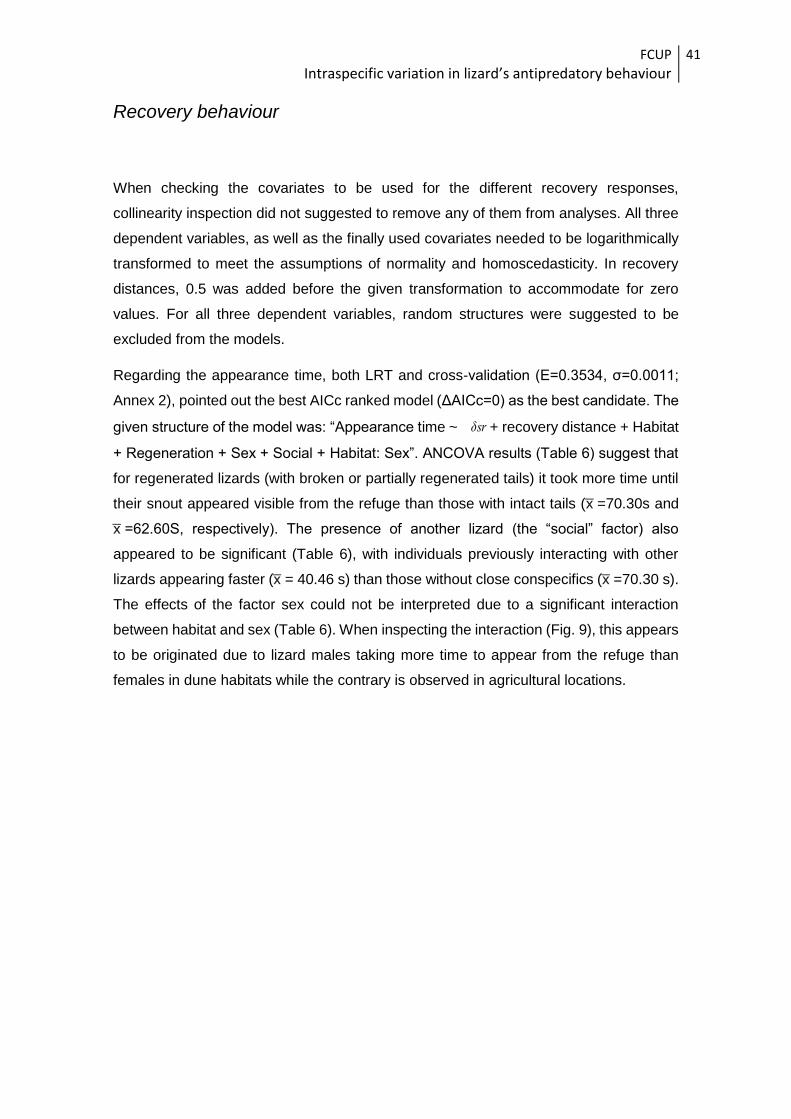
Table 5. ANCOVA comparisons of escape variables. Df= degrees of freedom, P=p-value. * = significant values.
Regarding the distance fled, among the best ranked AICc models (Annex 1) comparisons
with LRT suggested the model number 20 (ΔAICc=0.65) as the best candidate, with the
following structure: “Fled distance ~ Ta + Habitat + Active”. Results from cross-validation
(Annex 2) characterized the candidate model with the fourth lowest classifier error
(E=0.3026) and with the lowest standard deviation of E (σ=0.0007), making to keep it as
best candidate. Between habitat types, lizards from dune locations fled larger distances
than lizards in agricultural walls (Table 5). Moreover, significant differences appeared
due to the activity of the lizards, where lizards that were actively moving before escaping
fled larger distances (x̅ = 56.85 cm) than inactive immobile lizards (x̅ = 28.23 cm).
Dependent
variable
(Covariates),
factors F value Df P
FID (Ts) 4.7441 1, 499 0.02986*
Habitat 11.2455 1, 499 0.0008588*
Predation(Habitat) 38.1736 2, 499 3.746e-16*
Predation(“dunes”) 70.1573 1, 499 5.57 e-16*
Predation(“walls”) 3.9164 1, 499 0.04831*
Fled distance (Ta) 33.0264 1, 500 1.58e-08*
Habitat 55.4400 1, 500 4.2e-13*
Active 14.5200 1, 500 0.00015*
FCUP
Intraspecific variation in lizard’s antipredatory behaviour
41
Recovery behaviour
When checking the covariates to be used for the different recovery responses,
collinearity inspection did not suggested to remove any of them from analyses. All three
dependent variables, as well as the finally used covariates needed to be logarithmically
transformed to meet the assumptions of normality and homoscedasticity. In recovery
distances, 0.5 was added before the given transformation to accommodate for zero
values. For all three dependent variables, random structures were suggested to be
excluded from the models.
Regarding the appearance time, both LRT and cross-validation (E=0.3534, σ=0.0011;
Annex 2), pointed out the best AICc ranked model (ΔAICc=0) as the best candidate. The
given structure of the model was: “Appearance time ~ δsr + recovery distance + Habitat
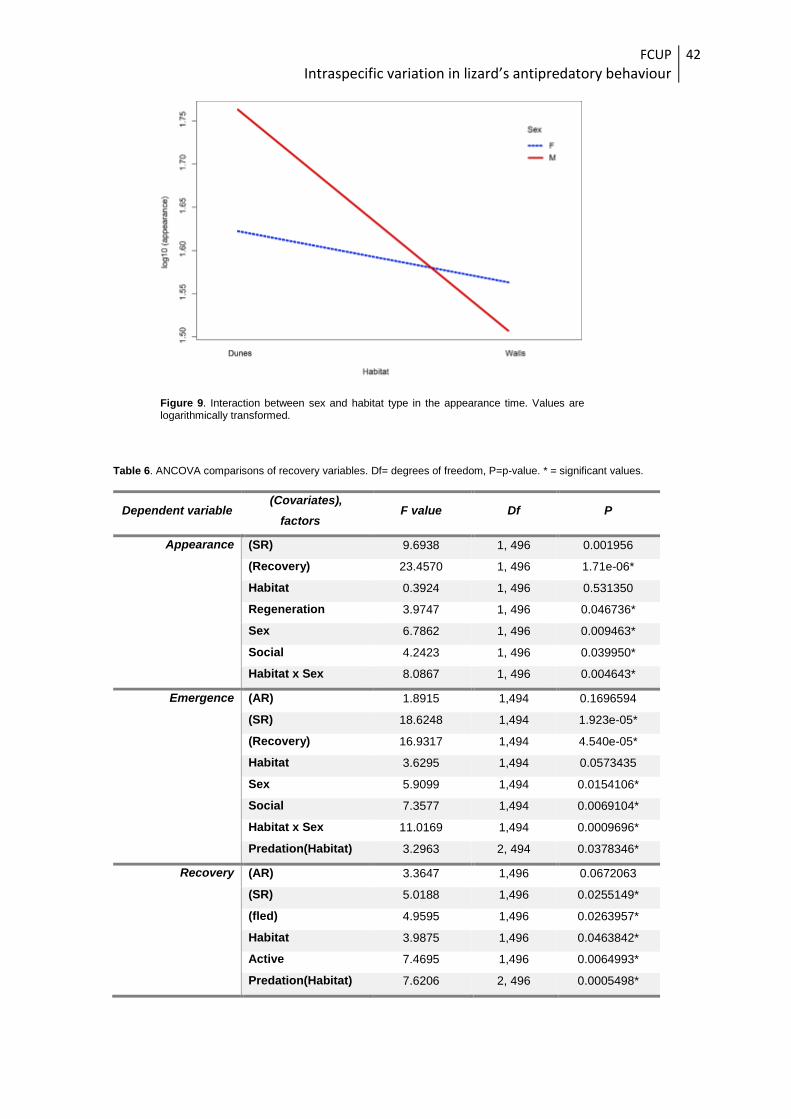
+ Regeneration + Sex + Social + Habitat: Sex”. ANCOVA results (Table 6) suggest that
for regenerated lizards (with broken or partially regenerated tails) it took more time until
their snout appeared visible from the refuge than those with intact tails (x̅ =70.30s and
x̅ =62.60S, respectively). The presence of another lizard (the “social” factor) also
appeared to be significant (Table 6), with individuals previously interacting with other
lizards appearing faster (x̅ = 40.46 s) than those without close conspecifics (x̅ =70.30 s).
The effects of the factor sex could not be interpreted due to a significant interaction
between habitat and sex (Table 6). When inspecting the interaction (Fig. 9), this appears
to be originated due to lizard males taking more time to appear from the refuge than
females in dune habitats while the contrary is observed in agricultural locations.
FCUP
Intraspecific variation in lizard’s antipredatory behaviour
42
Figure 9. Interaction between sex and habitat type in the appearance time. Values are logarithmically transformed.
Table 6. ANCOVA comparisons of recovery variables. Df= degrees of freedom, P=p-value. * = significant values.
Dependent variable (Covariates),
factors F value Df P
Appearance (SR) 9.6938 1, 496 0.001956
(Recovery) 23.4570 1, 496 1.71e-06*
Habitat 0.3924 1, 496 0.531350
Regeneration 3.9747 1, 496 0.046736*
Sex 6.7862 1, 496 0.009463*
Social 4.2423 1, 496 0.039950*
Habitat x Sex 8.0867 1, 496 0.004643*
Emergence (AR) 1.8915 1,494 0.1696594
(SR) 18.6248 1,494 1.923e-05*
(Recovery) 16.9317 1,494 4.540e-05*
Habitat 3.6295 1,494 0.0573435
Sex 5.9099 1,494 0.0154106*
Social 7.3577 1,494 0.0069104*
Habitat x Sex 11.0169 1,494 0.0009696*
Predation(Habitat) 3.2963 2, 494 0.0378346*
Recovery (AR) 3.3647 1,496 0.0672063
(SR) 5.0188 1,496 0.0255149*
(fled) 4.9595 1,496 0.0263957*
Habitat 3.9875 1,496 0.0463842*
Active 7.4695 1,496 0.0064993*
Predation(Habitat) 7.6206 2, 496 0.0005498*

FCUP
Intraspecific variation in lizard’s antipredatory behaviour
43
For emergence time, incongruences arose between the selected model using LRT
comparisons and the cross-validation procedure (Fig. 10 & 11). The first candidate model
(the tenth in the AICc ranking; “Fit 10” in Figure 10) showed high values of E so, after
more LRT comparisons, the second fitted model (E=0.3422 and σ=0.00097) was chosen
instead: “Emergence time ~ δar + δsr + recovery distance + Habitat + Sex + Social +
Habitat: Sex+Habitat/Predation”. In comparison to the appearance time, the
thermoregulatory cost between refuge and air temperatures was also included as
covariate. In parallel with the results of the appearance time, the same significant effects
for the factor “social” and the interaction between sex and habitat were detected (Table
6). However, a significant effect on emergence time appeared due to differences in
predation intensity. Specifically, only within wall habitats these differences were found,
with lizards from environments with higher predation intensities taking more time to exit
the refuge (x̅ =67.46s) than those under lower predation regimes (x̅ =48.04s; F(1,494)=6.14
P=0.013).
Figure 10. Results of the cross-validation analysis for the 10 best ranked models for emergence time.

FCUP
Intraspecific variation in lizard’s antipredatory behaviour
44
Figure 11. Density plot of the cross-validation results for the 10 best ranked models for emergence time.
For the recovery distance the best candidate model showed to be the second best AICc
ranked model (ΔAICc=0.09), which also had good values from the cross-validation
results (E=0.653 and σ=0.0018, Annex 2): “Recovery ~ δar + δsr + fled distance +
Habitat + Active +Habitat/Predation”. In the case of the recovery distance, together with
the two calculated thermoregulatory costs also fled distance was included as covariate.
Active lizards had larger recovery distances (x̅ =49.73cm) than inactive ones (x̅ =30.45;
Table 6). The habitat factor showed a significant effect (Table 6), with lizards in dune
habitats reappearing further away from the hiding spot (x̅ =42.87cm) than lizards using
walls as main habitat (x̅ =27.43). Moreover, the factor “predation within habitat” had also
a significant effect (Table 6). However, and similar to the case of the emergence time,
this effect was only present in wall habitats, were lizards under high predation intensities
had larger recovery distances (x̅ =36.07cm) while lizards under lower predation
intensities appeared closer to the original hiding point (x̅ =14.60cm).

FCUP
Intraspecific variation in lizard’s antipredatory behaviour
45
DISCUSSION
FCUP
Intraspecific variation in lizard’s antipredatory behaviour
46
Behavioural responses
As initially predicted, the antipredatory behaviour of P. bocagei differed among
populations under different levels of predation intensity. Lizards’ behaviour adjustment
regarding variable predation risks is mainly achieved by means of altering their FID,
which has been largely recorded in the literature to be the most adaptable of the
antipredatory behaviours (Samia et al., 2015). In both dune and wall habitat types, lizards
that commonly faced higher possibilities of being attacked by a predator fled to a refuge
earlier (or form longer distances) than those under lower risk, since the costs of staying
would surpass the costs of fleeing in their case. This confirms that Bocage’s wall lizards,
independently of the environment they inhabit, are able to reliably assess both the
predation risk and the costs associated to opportunities lost for other activities (e.g., of
feeding, mating and guarding) according to the optimal escape theory (Ydenberg & Dill,
1986). Remarkably, this result is supported by a multipopulation design in a continental
environment where studied populations are located within a relatively small spatial range.
On the other hand, habitat type also conditions the lizards’ escape decisions. The fact
that lizards inhabiting agricultural walls flee from larger distances than the ones in dune
habitats, might be induced by its higher perch position, which makes them more
conspicuous to aerial predators and, subsequently, tolerating less risk. A complementary
explanation on the earlier fleeing of the lizards located in higher wall perch with wider
visual fields could be also the ability to easier detect an approaching predator from the
distance.
The influence of the habitat complexity, rather than the predation intensity, conditioned
the distance that lizards covered before hiding inside a refuge, being mostly related with
the availability of refuges rather than the modification of the behaviour in itself. In
agricultural walls, the presence of numerous crevices allows lizards to rapidly hide within
one of them, while the more open structure of coastal dunes, where shrubs are patchily
distributed forces lizards to cover larger distances between reaching the refuge. Studies
in other Podarcis species showed that, after removing the effect of refuge availability
when studying populations with similar habitat structure, the distance lizards fled towards
a refuge was not modified under different risk levels (Diego-Rasilla, 2003; Carretero et
al., 2013) thus corresponding with the lack of detected differences in this behaviour
between predation pressure levels in this work. However, despite assuming a similar
structure within each habitat type, the availability of several refuges could still be masking

FCUP
Intraspecific variation in lizard’s antipredatory behaviour
47
the lizards’ need to adjust for this behaviour. Differences observed in fled distances due
to the activity of lizards might be explained by the fact that, while active foraging lizards
moved away from refuges to search for prey, immobile thermoregulating animals were
closer to potential refuges. This translates again into differences on the refuge
availability. A similar case may be taking place when considering the recovery distance,
where previously active lizards also appeared further away from the original hiding point
in the case of agricultural walls, similarly as in Carretero et al. (2006). Again, the type of
refuge used may be underlying the effect observed due to activity, since “inactive” lizards
were close to, and hided inside, crevices with no secondary exits, while foraging lizards
commonly hide under more open vegetation covers offering more exit options. Lizards
in coastal locations, using either big shrubs or wood walkways to hide, had more
opportunities than lizards in wall crevices to reappear further away avoiding the
“predatory risk”, again by simple means of differences in the habitat structure.
In the escape behaviour of different lizard species, the FID and the distance fled are
related to each other (Cooper, 2000; Carretero et al., 2006). The animals, threatened by
a predator, decide when to escape according to the distance from the nearest refuge. In
the present work, such correlations were not found between escape distances. However,
these studies were usually conducted on open areas with limited available refuges,
forcing the lizards to be aware of the location of each refuge; hence, the complexity of
the different studied habitats here and the absence of clear refuges for the lizards to
consider, could be masking the relationship between FID and fled distances.
While previous studies on lizards found out the recovery behaviour to respond in front of
different predation risks (Martín & López, 1999b; Cooper, Jr. et al., 2009), in the present
work these behaviours did not vary due to different predation levels but rather accounted
for the associated costs of retreating into a refuge. This suggests that predators
scavenging near lizards’ refuges are relatively rare compared to predation pressure on
active or basking lizards. Lizards that were in the presence of a conspecific when fleeing
appeared and emerged sooner from the refuge, thus being able to resume their activities.
This agrees with the literature on other lizard species (Diaz-Uriarte, 1999), where the
time spent inside a refuge decreased for males in the presence of females to avoid the
loss of courtship opportunities, as well as for both sexes in the presence of same sex
neighbours, presumably to minimize the loss of thermal conditions regarding their
competitors.
Lizards with broken or only partially regenerated tails took longer to appear from the
selected refuge, which relates with the greater need of these lizards to avoid potential
FCUP
Intraspecific variation in lizard’s antipredatory behaviour
48
predators, since they are temporarily unable to rely on the autotomy of the tail as an
antipredator behaviour (Arnold, 1988; Clause & Capaldi, 2006; García-Muñoz et al.,
2011)
The results showed that the sexual selection did not interact with the escape tactics in
male and female lizards, were the first would be expected to be bolder due their known
territorial and guarding behaviours (Font et al., 2012). While other studies found such
differences (Husak et al., 2006), they did it by studying species in which males had
remarkably conspicuous (bright blue) colorations, making them clearly more vulnerable
to predators. Apparently the level of sexual dimorphism and weak territoriality in P.
bocagei does not have the same relevance when considering adjusting escape
decisions. Only in the recovery time, an interaction of sex and habitat was found to take
place, with males taking more time to exit the refuge in dune habitats than those in walls,
while females remained hidden mostly the same amount of time. Again, the structure of
the habitat could play an important role in this interaction, in the sense that the males
restricted to crevices did not have any other choice than to remain within the refuge,
while males on dune habitats hiding inside shrubs or under wood walkways could easily
spend the “hiding” time looking for prey items. Differences between sexes could have
arose due to the fact that males, more than females, need to resume their activities as
soon as possible due to potential competitors (Cooper, 1999).
In this work, clear differences in the antipredatory behaviour between populations of P.
bocagei were found. Despite similar results have been obtained by other works, they
commonly compared populations on islands with extreme differences in predator species
composition (Cooper et al., 2014b), populations with contrasted environmental
conditions (Diego-Rasilla, 2003) or even two co-occurring different lineages of a species
without gene flow (Carretero et al., 2006). Here, a Podarcis species with a low genetic
variation was studied in a low-spatial framework, where the differences in antipredatory
tactics are clearly attributable to the ability of the species to accurately adjust its
antipredator behaviour in response to variable predation intensities. This adjustment of
the escape behaviour (by means of altered FID), even took place between populations
not separated more than one kilometre apart, as it is the case for Gião “Igreja” and Gião
“Rochio”, where the presence/absence of domestic cats, well known to affect lizard
populations (Li et al., 2014), seems to be the main trigger of the adjustment.
However, the presence of different predators within the same area could be
simultaneously affecting lizards’ behavioural response. Flexibility in antipredatory
behaviour has been reported to allow lizards coping with multiple types of predators in

FCUP
Intraspecific variation in lizard’s antipredatory behaviour
49
other Podarcis species (Amo et al., 2005). Therefore, further experimental research
needs to be conducted, accounting for the different predators, to get more insights into
the antipredatory tactics of P. bocagei.
Moreover, it is important not to forget that what we are actually studying represents an
instant picture of a complex and dynamic system, in which predator-prey interactions
potentially change over time, raising the need to extend this kind of work not only to
different spatial scales, but also temporal ones. By doing so, we will be able to determine
the degree and rate of behavioural change within populations.
Differences observed between adult and juvenile lizards, where the latter emerge sooner
from the refuge, thus taking more risks (or inefficiently assessing them), are corroborated
by previous literature (Samia et al., 2015). This could give us some insights into the
importance of previous experience when assessing predation risks and respond
accordingly to them. However, to discard a possible ontogenic origin of these changes
in lizards, and further disentangle the effects of both natural selection and phenotypic
plasticity in the antipredatory behaviour, common garden experiments would represent
the next step to take.

FCUP
Intraspecific variation in lizard’s antipredatory behaviour
50
Conclusions
The main conclusions that can be extracted from the present work are:
Antipredatory behaviours in P. bocagei vary across and within mainland
populations.
Behavioural adjustments to different predation environments are mainly achieved
by modifications in the flight initiation distance (FID).
The inherent characteristics of the habitat structure play an important role in
shaping the studied escape and recovery tactics.
In the decision-making process after being retreated into a refuge, lizards adjust
their recovery behaviours accounting for the associated costs of hiding rather
than for the previously experienced predation risk.
Overall, antipredator behaviours differ in their degree of shift, with FID being the
most plastic and relevant component of antipredator tactics when lizards avoid
predation.
FCUP
Intraspecific variation in lizard’s antipredatory behaviour
51
References
Amo, L., López, P. & Martín, J. 2005. Flexibility in antipredatory behavior allows wall
lizards to cope with multiple types of predators. Ann. Zool. Fennici 42: 109–121.
Arnold, E. 1988. Caudal autotomy as a defence. In: Biology of the Reptiles (R. Gans, C.,
Huey, ed), pp. 235–273. Alan R. Liss, New York, NY.
Barreto-Caldas, F., Honrado, J.J. & Paiva, A.P. 1999. Vegetação da área de paisagem
Protegida do Litoral de Esposende (Portugal). Quercetea 39–59.
Barton, K. 2016. MuMIn: Multi-Model Inference.
Bateman, P.W. & Fleming, P. a. 2009. To cut a long tail short: A review of lizard caudal
autotomy studies carried out over the last 20 years. J. Zool. 277: 1–14.
Begon, M., Harper, J.L. & Townsend, C.R. 1990. Ecology: Individuals, Populations and
Communities, 2nd editio. Blackwell Scientific Publications, Boston, MA.
Burger, J. & Gochfeld, M. 1993. The importance of the human face in risk perception by
Black Iguanas, Ctenosaura similis. J. Herpetol. 27: 426.
Carretero, M. A., Vasconcelos, R., Fonseca, M., Kaliontzopoulou, A., Brito, J.C., Harris,
D.J., et al. 2006. Escape tactics of two syntopic forms of the Lacerta perspicillata
complex with different colour patterns. Can. J. Zool. 84: 1594–1603.
Carretero, M. A., Argaña, E. & Duarte, R. (2013): Investigating the degree of behavioural
plasticity in lacertids by comparing two populations of Podarcis carbonelli under
different disturbance regimes. 17th European Congress of Herpetology, Veszprém
(Hungary), 22-27 August 2013.
Castilla, A.M. & Labra, A. 1998. Predation and spatial distribution of the lizard Podarcis
hispanica atrata: an experimental approach. Acta Oecologica 19: 107–114.
Castilla, A.M., Van Damme, R. & Bauwens, D. 1999a. Field body temperature,
mechanisms of thermoregulation and evolution of thermal characteristics in lacertid
lizards. Nat. Croat. 8: 253–274.
Castilla, A.M., Van Damme, R. & Bauwens, D. 1999b. Field body temperatures,
mechanisms of thermoregulation and evolution of thermal characteristics in lacertid
lizards. Nat. Croat. 8: 253–274.

FCUP
Intraspecific variation in lizard’s antipredatory behaviour
52
Clause, A.R. & Capaldi, E.A. 2006. Caudal autotomy and regeneration in lizards. J. Exp.
Zool. Part A Comp. Exp. Biol. 305: 965–973.
Cooper, Jr., W.E., Hawlena, D. & Pérez-Mellado, V. 2009. Islet tameness: escape
behavior and refuge use in populations of the Balearic lizard (Podarcis lilfordi)
exposed to differing predation pressure. Can. J. Zool. 87: 912–919.
Cooper, W.E. 2000. Effect of temperature on escape behaviour by an ectothermic
vertebrate, the keeled earless lizard (Holbrookia propinqua). Behaviour 137: 1299–
1315.
Cooper, W.E. 2003. Sexual dimorphism in distance from cover but not escape behavior
by the keeled earless lizard Holbrookia propinqua. J. Herpetol. 37: 374–378.
Cooper, W.E. 1999. Tradeoffs between courtship, fighting, and antipredatory behavior
by a lizard, Eumeces laticeps. Behav. Ecol. Sociobiol. 47: 54–59.
Cooper, W.E., Pyron, R.A. & Garland, T. 2014a. Island tameness: living on islands
reduces flight initiation distance. Proc. R. Soc. B Biol. Sci. 281: 20133019–
20133019.
Delibes, M. & Blázquez, M.C. 1998. Tameness of insular lizards and loss of biological
diversity. Conserv. Biol. 12: 1142–1143.
Diaz-Uriarte, R. 1999. Anti-predator behaviour changes following an aggressive
encounter in the lizard Tropidurus hispidus. Proc. R. Soc. B Biol. Sci. 266: 2457–
2464.
Diego-Rasilla, F.J. 2003. Influence of predation pressure on the escape behaviour of
Podarcis muralis lizards. Behav. Processes 63: 1–7.
Ferrnad, N., Ferrand de Almeida, P., Gonçalves, H., Sequeira, F., Teixeira, J. & Ferrand
de Almeida, F. 2001. Anfíbios e Répteis de Portugal (FAPAS, Câmara Municipal do
Porto eds). Porto.
Font, E., Barbosa, D., Sampedro, C. & Carazo, P. 2012. Social behavior, chemical
communication, and adult neurogenesis: Studies of scent mark function in Podarcis
wall lizards. Gen. Comp. Endocrinol. 177: 9–17. Elsevier Inc.
Galán, P. 1986. Morfología y distribución del género Podarcis Wagler, 1830 (Sauria,
Lacertidae) en el noroeste de la Península Ibérica. Rev. Española Herpetol. 1: 85–
142.

FCUP
Intraspecific variation in lizard’s antipredatory behaviour
53
Galán, P. 1996. Sexual maturity in a population of the lacertid lizard Podarcis bocagei.
Herpetol. J. 6: 87-93.
Galán, P. 1997. Reproductive ecology of the lacertid lizard Podarcis bocagei. Ecography
(Cop.). 20: 197–209.
Galán, P. 2008. Ontogenetic and sexual variation in the coloration of the lacertid lizards
Iberolacerta monticola and Podarcis bocagei. Do the females prefer the greener
males? Anim. Biol. 58: 173–198.
Galán, P. 2009a. Lagartija de Bocage – Podarcis bocagei (Seoane, 1884). Museo
Nacional de Ciencias Naturales, Madrid.
Galán, P. 2009b. Podarcis bocagei (A. Salvador & A. Marco, eds). Museo Nacional de
Ciencias Naturales, Madrid.
Galán, P. 2015. Lagartija de Bocagei – Podarcis bocagei. In: Enciclopedia Virtual de los
Vertebrados Españoles (A. Salvador & A. Marco, eds). Museo Nacional de Ciencias
Naturales, Madrid.
Galán, P. & Fernández, G. 1993. Anfibios e réptiles de Galicia. Edicións Xerais de
Galicia, Vigo.
García-Muñoz, E., Ceacero, F., Pedrajas, L., Kaliontzopoulou, A. & Carretero, M.A.
2011. Tail tip removal for tissue sampling has no short-term effects on microhabitat
selection by Podarcis bocagei, but induced autotomy does. Acta Herpetol. 6: 223–
227.
Grueber, C.E., Nakagawa, S., Laws, R.J. & Jamieson, I.G. 2011. Multimodel inference
in ecology and evolution: challenges and solutions. J. Evol. Biol. 24: 699–711.
Huberty, C.J. & Morris, J.D. 1989. Multivariate analysis versus multiple univariate
analyses. Psychol. Bull. 105: 302–308.
Hurvich, C. & Tsai, C. 1989. Regression and time series model selection in small
samples. Biometrika 76: 297–307.
Husak, J.F., Macedonia, J.M., Fox, S.F. & Sauceda, R.C. 2006. Predation cost of
conspicuous male coloration in Collared lizards (Crotaphytus collaris): an
experimental test using clay-covered model lizards. Ethology 112: 572–580.

FCUP
Intraspecific variation in lizard’s antipredatory behaviour
54
Husak, J.F. & Rouse, M.N. 2006a. Population variation in escape behavior and limb
morphology of collared lizards (Crotaphytus collaris) in Oklahoma. Herpetologica
62: 156–163.
Husak, J.F. & Rouse, M.N. 2006b. Population variation in escape behavior and limb
morphology of collared lizards (Crotaphytus collaris) in Oklahoma. Herpetologica
62: 156–163.
Itescu, Y., Schwarz, R., Meiri, S. & Pafilis, P. 2016. Intra-specific competition, not
predation, drives lizard tail loss on islands. J. Anim. Ecol., doi: 10.1111/1365-
2656.12591.
Kaliontzopoulou, A., Carretero, M.A. & Llorente, G.A. 2010a. Intraspecific
ecomorphological variation: linear and geometric morphometrics reveal habitat-
related patterns within Podarcis bocagei wall lizards. J. Evol. Biol. 23: 1234–1244.
Kaliontzopoulou, A., Carretero, M. A. & Llorente, G. a. 2010b. Sexual dimorphism in traits
related to locomotion: Ontogenetic patterns of variation in Podarcis wall lizards. Biol.
J. Linn. Soc. 99: 530–543.
Kaliontzopoulou, A., Llorente, G. & Carretero, M. 2008. Interspecific and intersexual
variation in presacral vertebrae number in Podarcis bocagei and P. carbonelli.
Amphibia-Reptilia 29: 288–292.
Li, B., Belasen, A., Pafilis, P., Bednekoff, P. & Foufopoulos, J. 2014. Effects of feral cats
on the evolution of anti-predator behaviours in island reptiles: insights from an
ancient introduction. Proc. R. Soc. B Biol. Sci. 281: 20140339–20140339.
Liao, D. & Valliant, R. 2012. Variance inflation factors in the analysis of complex survey
data. Surv. Methodol. 38: 53–62.
Marcellini, D.L. & Jenssen, T.A. 1991. Avoidance learning by the curly-tailed lizard,
Leicephalus schreibersi: Implications for anti-predator behaviour. J. Herpetol. 2:
238–241.
Martin, J. 2001. When hiding from predators is costly: optimization of refuge use in
lizards. Etologia 9: 9–13.
Martin, J. & Lopez, P. 1999. An Experimental test of the costs of antipredatory refuge
use in the Wall Lizard, Podarcis muralis. Oikos 84: 499–505.
Martín, J. & López, P. 1999a. An experimental test of the costs of antipredatory refuge
use in the wall lizard, Podarcis muralis. Oikos 65: 328–333.
FCUP
Intraspecific variation in lizard’s antipredatory behaviour
55
Martín, J. & López, P. 1999b. When to come out from a refuge: risk-sensitive and state-
dependent decisions in an alpine lizard. Behav. Ecol. 10: 487–492.
Pafilis, P., Simou, C., Tsasi, G. & Valakos, E. 2009. Predation pressure, density-induced
stress and tail regeneration: a casual-nexus situation or a bunch of independent
factors? Amphibia-Reptilia 30: 471–482.
Perera, A. 2005. Autoecología de Lacerta perspicillata: efectos de la insularidad en un
lacértido continental. University of Salamanca, Salamanca, Spain.
Pietrek, A.G., Walker, R.S. & Novaro, A.J. 2009. Susceptibility of lizards to predation
under two levels of vegetative cover. J. Arid Environ. 73: 574–577. Elsevier Ltd.
Pinho, C., Harris, D.J. & Ferrand, N. 2007. Contrasting patterns of population subdivision
and historical demography in three western Mediterranean lizard species inferred
from mitochondrial DNA variation. Mol. Ecol. 16: 1191–1205.
Plasman, M., Duchateau, M.J. & Macedonia, J. 2007. Anti-predation behaviour of
Dickerson’s collared lizard, Crotaphytus dickersonae. Anim. Biol. 57: 231–246.
R Core Team. 2016. R: A language and environment for statistical computing. R
Foundation for Statistical Computing, Vienna, Austria.
Revelle, W. 2016. psych: Procedures for Personality and Psychological Research.
Northwestern University, Evanston, Illinois, USA.
Rosier, R.L. & Langkilde, T. 2011. Behaviour under risk: how animals avoid becoming
dinner. Nat. Educ. Knowl. 2: 8.
Salvador, A. 1986. Podarcis lilfordi (Günther, 1874) Balearen-Eidechse. In: Handbuch
der Reptilien und Amphibien Europas. Band 2/II. Echsen (Sauria) III (Lacertidae III:
Podarcis) (W. Böhme, ed), pp. 83–110. Aula-Verlag, Wiesbaden.
Samia, D.S.M., Blumstein, D.T., Stankowich, T. & Cooper, W.E. 2015. Fifty years of
chasing lizards: new insights advance optimal escape theory. Biol. Rev. 91(2): 349-
366.
Scheers, H. & Van Damme, R. 2002. Micro-scale differences in thermal habitat quality
and a possible case of evolutionary flexibility in the thermal physiology of lacertid
lizards. Oecologia 132: 323–331.
Schluter, D. 2001. Ecology and the origin of species. Trends Ecol. Evol. 16: 372–380.
Stamps, J. 1983. Lizard Ecology: Studies of a Model Organism. R. B. Huey, Cambridge.

FCUP
Intraspecific variation in lizard’s antipredatory behaviour
56
Stankowich, T., Haverkamp, P.J. & Caro, T. 2014. Ecological drivers of antipredator
defenses in carnivores. Evolution (N. Y). 68: 1415–1425.
Stevens, M. & Merilaita, S. 2011. Animal Camouflage: Mechanisms and Function.
Cambridge University Press, Cambridge.
Stone, M. 1974. Cross-validatory choice and assessment of statistical predictions. J. R.
Stat. Soc. 36: 111–147.
Turner, F.B., Medica, P.A., Jennrich, R.I. & Maza, B.G. 1982. Frequencies of broken tails
among Uta stansburiana in southern Nevada and a test of the predation hypothesis.
Copeia 1982: 835–840.
Vervust, B., Loy, H. & Damme, R. 2011. Seeing through the lizard’s trick: do avian
predators avoid autotomous tails? Open Life Sci. 6: 293–299.
Ydenberg, R.C. & Dill, L.M. 1986. The Economics of fleeing from predators. In: Advances
in the Study of Behavior, pp. 229–249.
Zani, P. a., Tillman, J.L. & Scoular, K.M. 2013a. Geographic variation of movement and
display behavior of Side-blotched Lizards (Uta stansburiana) related to predation
environment. J. Herpetol. 47: 85–92.
Zuur, A.F., Ieno, E.N. & Elphick, C.S. 2010. A protocol for data exploration to avoid
common statistical problems. Methods Ecol. Evol. 1: 3–14.
Zuur, A.F., Ieno, E.N., Walker, N., Saveliev, A.A. & Smith, G.M. 2009. Mixed effects
models and extensions in ecology with R. Springer New York, New York, NY.

FCUP
Intraspecific variation in lizard’s antipredatory behaviour
57
SUPPLEMENTARY MATERIAL
Annex 1 Ranking by means of AICc of all subset models within the global model considered for each dependent variable. Yellow = preliminary chosen models. Green = final candidate model.
FID: ranked models according to AICc.
Model selection table (Int) act air grn hbt rgn sex scl hbt:prd hbt:sex df logLik AICc delta weight 285 1.856 0.2367 + + + 7 135.332 -256.4 0.00 0.264 829 1.854 0.2313 + + + + + 9 136.737 -255.1 1.33 0.135 269 1.840 0.2322 + + 6 133.486 -254.8 1.64 0.116 349 1.850 0.2394 + + + + 8 135.539 -254.8 1.65 0.115 317 1.859 0.2385 + + + + 8 135.472 -254.7 1.79 0.108 287 1.801 0.0587 0.2226 + + + 8 135.454 -254.6 1.82 0.106 286 1.857 + 0.2367 + + + 8 135.342 -254.4 2.05 0.095 281 2.235 + + + 6 132.838 -253.5 2.93 0.061 Models ranked by AICc(x)
Fled distance: ranked models according to AICc.
Model selection table
(Int) act air FID grn hbt rgn sex scl act:hbt hbt:prd hbt:sex hbt:scl df logLik AICc delta weight
84 -0.4011 + 1.322 + + 6 -234.031 480.2 0.00 0.060
596 -0.4511 + 1.335 + + + 8 -232.110 480.5 0.28 0.052
88 -0.1820 + 1.337 -0.11150 + + 7 -233.186 480.6 0.37 0.050
20 -0.3923 + 1.343 + 5 -235.378 480.9 0.65 0.043
1108 -0.4142 + 1.313 + + + 7 -233.356 480.9 0.71 0.042
1112 -0.1829 + 1.328 -0.11820 + + + 8 -232.407 481.1 0.87 0.039
24 -0.1732 + 1.358 -0.11150 + 6 -234.537 481.2 1.01 0.036
532 -0.4349 + 1.351 + + 7 -233.560 481.3 1.12 0.034

Appearance time: ranked models according to AICc.
Model selection table (Int) act AR fld hbt rec rgn sex scl SR hbt:prd hbt:sex rgn:sex df logLik AICc delta weight 2553 1.519 + 0.1197 + + + -1.0620 + 9 -267.188 552.7 0.00 0.167 3577 1.544 + 0.1119 + + + -1.0740 + + 11 -265.391 553.3 0.58 0.125 2554 1.530 + + 0.1231 + + + -1.0650 + 10 -266.615 553.7 0.94 0.105 10745 1.551 + 0.1208 + + + -1.0590 + + 10 -266.784 554.0 1.27 0.088 2555 1.518 0.4163 + 0.1218 + + + -1.2680 + 10 -266.845 554.1 1.40 0.083 3545 1.591 + 0.1121 + + -1.0170 + + 10 -266.901 554.2 1.51 0.079 3579 1.545 0.5409 + 0.1141 + + + -1.3430 + + 12 -264.816 554.3 1.53 0.078 2557 1.478 0.03166 + 0.1175 + + + -1.0630 + 10 -266.949 554.3 1.60 0.075 3578 1.554 + + 0.1153 + + + -1.0780 + + 12 -264.878 554.4 1.65 0.073 11769 1.575 + 0.1131 + + + -1.0720 + + + 12 -265.012 554.7 1.92 0.064 2521 1.568 + 0.1207 + + -0.9961 + 8 -269.199 554.7 1.95 0.063
Emergence time: ranked models according to AICc.
--- Model selection table (Int) act AR hbt rec rgn sex scl SR act:hbt hbt:prd hbt:sex rgn:sex df logLik AICc delta weight 3545 1.674 + 0.09805 + + -1.438 + + 10 -252.697 525.8 0.00 0.120 3547 1.676 0.6821 + 0.10080 + + -1.775 + + 11 -251.734 526.0 0.16 0.111 3546 1.684 + + 0.10220 + + -1.445 + + 11 -251.893 526.3 0.48 0.094 3548 1.688 + 0.7092 + 0.10530 + + -1.796 + + 12 -250.850 526.3 0.50 0.094 3577 1.642 + 0.09791 + + + -1.476 + + 11 -251.999 526.5 0.70 0.085 3579 1.643 0.7041 + 0.10070 + + + -1.826 + + 12 -250.971 526.6 0.74 0.083 3580 1.656 + 0.7280 + 0.10490 + + + -1.841 + + 13 -250.193 527.1 1.29 0.063 3578 1.654 + + 0.10180 + + + -1.479 + + 12 -251.294 527.2 1.38 0.060 2553 1.612 + 0.10670 + + + -1.463 + 9 -254.517 527.4 1.56 0.055 2521 1.648 + 0.10740 + + -1.415 + 8 -255.637 527.6 1.73 0.051 11769 1.676 + 0.09920 + + + -1.473 + + + 12 -251.516 527.7 1.83 0.048

Recovery distance: ranked models according to AICc. Global model call: lm(formula = reco ~ fled + AR + SR + sex * habitat + habitat/predation + regen + active + social + sex:regen + habitat:social, data = impdata) --- Model selection table (Int) act AR fld hbt sex scl SR hbt:prd hbt:sex df logLik AICc delta weight 432 0.7569 + -1.618 0.1727 + + 1.6350 + 10 -551.666 1123.8 0.00 0.183 400 0.8030 + -1.632 0.1827 + 1.6590 + 9 -552.752 1123.9 0.09 0.175 302 0.8362 + 0.1749 + + + 8 -554.348 1125.0 1.21 0.100 430 0.7735 + 0.1735 + + 0.8409 + 9 -553.348 1125.1 1.28 0.096 464 0.8109 + -1.737 0.1793 + + 1.7100 + 10 -552.307 1125.1 1.28 0.096 496 0.7659 + -1.711 0.1702 + + + 1.6820 + 11 -551.319 1125.2 1.40 0.091 398 0.8204 + 0.1835 + 0.8574 + 8 -554.456 1125.2 1.43 0.090 270 0.8852 + 0.1852 + + 7 -555.492 1125.2 1.43 0.089 944 0.7800 + -1.627 0.1760 + + 1.6360 + + 11 -551.455 1125.4 1.67 0.079 Models ranked by AICc(x)
Annex 2
Cross-validation results (k=10, n=100) for the fled distance best candidate models. Final
candidate model is “Fit 4”.
Cross-validation results (k=10, n=100) for the appearance time best candidate models.
Final candidate model is “Fit 1”
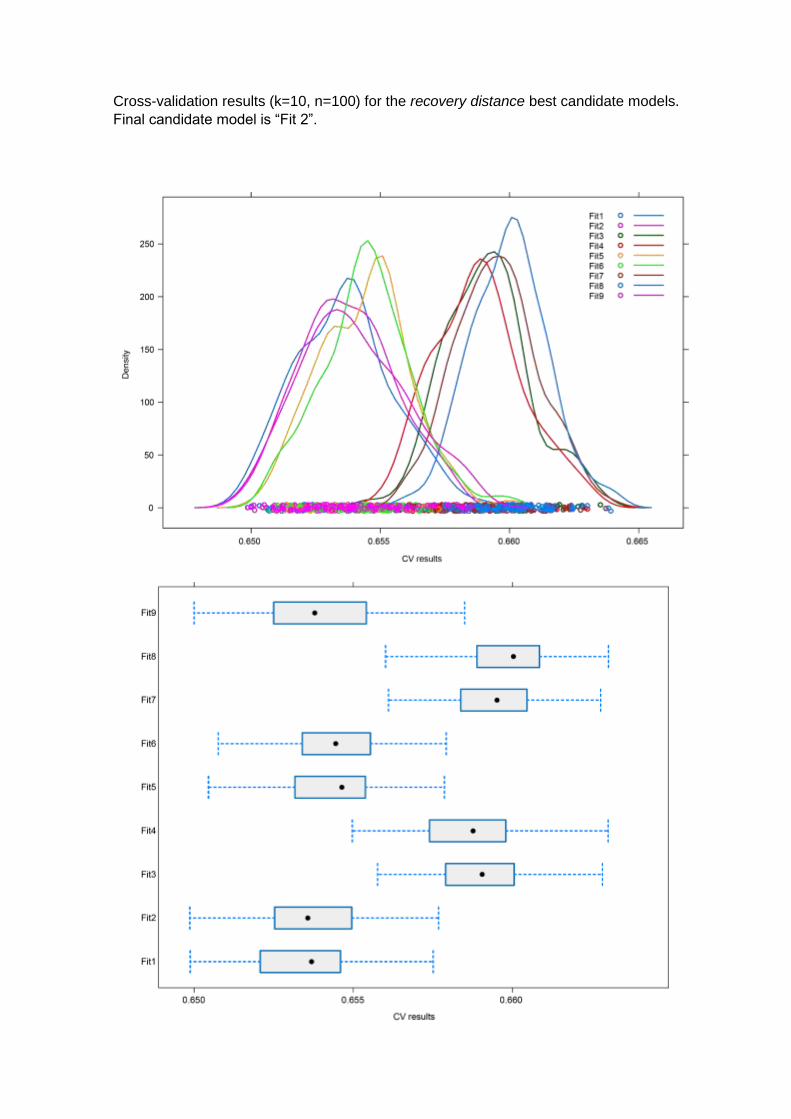
Cross-validation results (k=10, n=100) for the recovery distance best candidate models.
Final candidate model is “Fit 2”.


![Intraspecific morphological and genetic variation of ......variation in non-model organisms is increasingly possible owing to advancements in methods and decreases in costs [5]. In](https://static.fdocuments.us/doc/165x107/602f61c70a36dc6abe5b4068/intraspecific-morphological-and-genetic-variation-of-variation-in-non-model.jpg)