Intra- and inter-individual variation in the foraging ... · gentoo penguin diet and behaviour are...
16
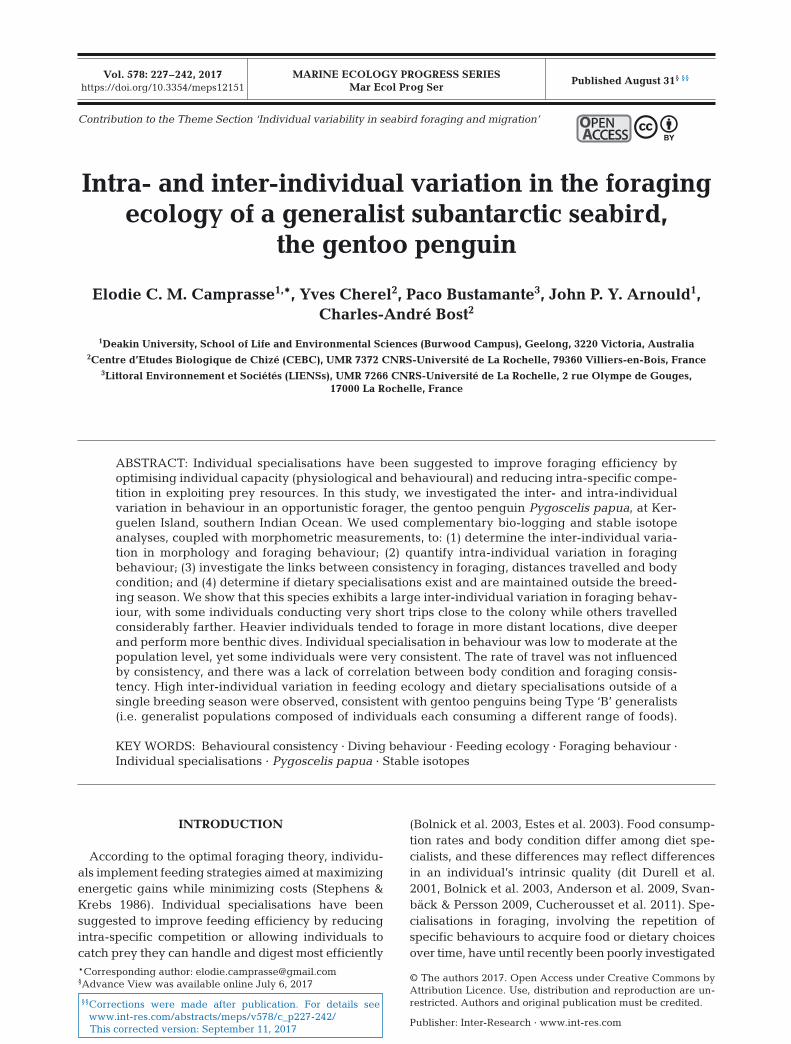
MARINE ECOLOGY PROGRESS SERIES Mar Ecol Prog Ser Vol. 578: 227–242, 2017 https://doi.org/10.3354/meps12151 Published August 31 § §§ INTRODUCTION According to the optimal foraging theory, individu- als implement feeding strategies aimed at maximizing energetic gains while minimizing costs (Stephens & Krebs 1986). Individual specialisations have been suggested to improve feeding efficiency by reducing intra-specific competition or allowing individuals to catch prey they can handle and digest most efficiently (Bolnick et al. 2003, Estes et al. 2003). Food consump- tion rates and body condition differ among diet spe- cialists, and these differences may reflect differences in an individual’s intrinsic quality (dit Durell et al. 2001, Bolnick et al. 2003, Anderson et al. 2009, Svan- bäck & Persson 2009, Cucherousset et al. 2011). Spe- cialisations in foraging, involving the repetition of specific behaviours to acquire food or dietary choices over time, have until recently been poorly investigated © The authors 2017. Open Access under Creative Commons by Attribution Licence. Use, distribution and reproduction are un- restricted. Authors and original publication must be credited. Publisher: Inter-Research · www.int-res.com *Corresponding author: [email protected] § Advance View was available online July 6, 2017 Intra- and inter-individual variation in the foraging ecology of a generalist subantarctic seabird, the gentoo penguin Elodie C. M. Camprasse 1, *, Yves Cherel 2 , Paco Bustamante 3 , John P. Y. Arnould 1 , Charles-André Bost 2 1 Deakin University, School of Life and Environmental Sciences (Burwood Campus), Geelong, 3220 Victoria, Australia 2 Centre d’Etudes Biologique de Chizé (CEBC), UMR 7372 CNRS-Université de La Rochelle, 79360 Villiers-en-Bois, France 3 Littoral Environnement et Sociétés (LIENSs), UMR 7266 CNRS-Université de La Rochelle, 2 rue Olympe de Gouges, 17000 La Rochelle, France ABSTRACT: Individual specialisations have been suggested to improve foraging efficiency by optimising individual capacity (physiological and behavioural) and reducing intra-specific compe- tition in exploiting prey resources. In this study, we investigated the inter- and intra-individual variation in behaviour in an opportunistic forager, the gentoo penguin Pygoscelis papua, at Ker- guelen Island, southern Indian Ocean. We used complementary bio-logging and stable isotope analyses, coupled with morphometric measurements, to: (1) determine the inter-individual varia- tion in morphology and foraging behaviour; (2) quantify intra-individual variation in foraging behaviour; (3) investigate the links between consistency in foraging, distances travelled and body condition; and (4) determine if dietary specialisations exist and are maintained outside the breed- ing season. We show that this species exhibits a large inter-individual variation in foraging behav- iour, with some individuals conducting very short trips close to the colony while others travelled considerably farther. Heavier individuals tended to forage in more distant locations, dive deeper and perform more benthic dives. Individual specialisation in behaviour was low to moderate at the population level, yet some individuals were very consistent. The rate of travel was not influenced by consistency, and there was a lack of correlation between body condition and foraging consis- tency. High inter-individual variation in feeding ecology and dietary specialisations outside of a single breeding season were observed, consistent with gentoo penguins being Type ‘B’ generalists (i.e. generalist populations composed of individuals each consuming a different range of foods). KEY WORDS: Behavioural consistency · Diving behaviour · Feeding ecology · Foraging behaviour · Individual specialisations · Pygoscelis papua · Stable isotopes OPEN PEN ACCESS CCESS Contribution to the Theme Section ‘Individual variability in seabird foraging and migration’ §§ Corrections were made after publication. For details see www.int-res.com/abstracts/meps/v578/c_p227-242/ This corrected version: September 11, 2017
Transcript of Intra- and inter-individual variation in the foraging ... · gentoo penguin diet and behaviour are...
MARINE ECOLOGY PROGRESS SERIESMar Ecol Prog Ser
Vol. 578: 227–242, 2017https://doi.org/10.3354/meps12151
Published August 31§ §§
INTRODUCTION
According to the optimal foraging theory, individu-als implement feeding strategies aimed at maximizingenergetic gains while minimizing costs (Stephens &Krebs 1986). Individual specialisations have beensuggested to improve feeding efficiency by reducingintra-specific competition or allowing individuals tocatch prey they can handle and digest most efficiently
(Bolnick et al. 2003, Estes et al. 2003). Food consump-tion rates and body condition differ among diet spe-cialists, and these differences may reflect differencesin an individual’s intrinsic quality (dit Durell et al.2001, Bolnick et al. 2003, Anderson et al. 2009, Svan-bäck & Persson 2009, Cucherousset et al. 2011). Spe-cialisations in foraging, involving the repetition ofspecific behaviours to acquire food or dietary choicesover time, have until recently been poorly investigated
© The authors 2017. Open Access under Creative Commons byAttribution Licence. Use, distribution and reproduction are un -restricted. Authors and original publication must be credited.
Publisher: Inter-Research · www.int-res.com
*Corresponding author: [email protected]§Advance View was available online July 6, 2017
Intra- and inter-individual variation in the foragingecology of a generalist subantarctic seabird,
the gentoo penguin
Elodie C. M. Camprasse1,*, Yves Cherel2, Paco Bustamante3, John P. Y. Arnould1, Charles-André Bost2
1Deakin University, School of Life and Environmental Sciences (Burwood Campus), Geelong, 3220 Victoria, Australia2Centre d’Etudes Biologique de Chizé (CEBC), UMR 7372 CNRS-Université de La Rochelle, 79360 Villiers-en-Bois, France
3Littoral Environnement et Sociétés (LIENSs), UMR 7266 CNRS-Université de La Rochelle, 2 rue Olympe de Gouges, 17000 La Rochelle, France
ABSTRACT: Individual specialisations have been suggested to improve foraging efficiency byoptimising individual capacity (physiological and behavioural) and reducing intra-specific compe-tition in exploiting prey resources. In this study, we investigated the inter- and intra-individualvariation in behaviour in an opportunistic forager, the gentoo penguin Pygoscelis papua, at Ker-guelen Island, southern Indian Ocean. We used complementary bio-logging and stable isotopeanalyses, coupled with morphometric measurements, to: (1) determine the inter-individual varia-tion in morphology and foraging behaviour; (2) quantify intra-individual variation in foragingbehaviour; (3) investigate the links between consistency in foraging, distances travelled and bodycondition; and (4) determine if dietary specialisations exist and are maintained outside the breed-ing season. We show that this species exhibits a large inter-individual variation in foraging behav-iour, with some individuals conducting very short trips close to the colony while others travelledconsiderably farther. Heavier individuals tended to forage in more distant locations, dive deeperand perform more benthic dives. Individual specialisation in behaviour was low to moderate at thepopulation level, yet some individuals were very consistent. The rate of travel was not influencedby consistency, and there was a lack of correlation between body condition and foraging consis-tency. High inter-individual variation in feeding ecology and dietary specialisations outside of asingle breeding season were observed, consistent with gentoo penguins being Type ‘B’ generalists(i.e. generalist populations composed of individuals each consuming a different range of foods).
KEY WORDS: Behavioural consistency · Diving behaviour · Feeding ecology · Foraging behaviour ·Individual specialisations · Pygoscelis papua · Stable isotopes
OPENPEN ACCESSCCESS
Contribution to the Theme Section ‘Individual variability in seabird foraging and migration’
§§Corrections were made after publication. For details seewww.int-res. com/abstracts/meps/v578/c_p227-242/This corrected version: September 11, 2017

Mar Ecol Prog Ser 578: 227–242, 2017
(Bolnick et al. 2003, Estes et al. 2003, Cook et al.2006). Individual specialists have been defined as ‘in-dividuals whose niche is substantially narrower thantheir population’s niche for reasons not attributableto their sex, age or discrete morphological group’(Bolnick et al. 2003, p. 3). Even populations usuallythought to be generalists can actually be composed ofindividual specialists, referred to as Type ‘B’ general-ists (individuals each specialising on a different butnarrow range of food types) as op posed to Type ‘A’generalists (individuals all taking a wide range of foodtypes) (Araújo et al. 2011, Loxdale et al. 2011, Layman& Allgeier 2012, Fodrie et al. 2015).
Information on individual specialisations is crucial,as they may have significant ecological consequencesat the individual and population levels, and mayimpact ecological processes and foraging dynamics(Bolnick et al. 2003, Matich et al. 2011, Ceia & Ramos2015). Thus, it is of importance to identify the mech-anisms generating inter-individual variation andstudy the wider implications of variation in foragingbehaviour to understand trophic relationships be -
tween the animals and their environment (Bolnick etal. 2003, Baylis et al. 2015, Ceia & Ramos 2015, Ker-naléguen et al. 2015). The study of individual special-isations requires longitudinal sampling, in which thesame individuals are sampled over time (Bolnick etal. 2003, Araújo et al. 2011). Ideally, the use of com-plementary techniques that represent different time -scales and resolutions should be implemented toaccurately describe individual specialisations andtheir persistence (Kernaléguen et al. 2016). Seabirdsare suitable models to study individual specialisa-tions, as most species nest in large colonies that allowfor easy access to individuals that use the same envi-ronment, are strongly constrained during breedingas central place foragers and may compete for thesame resources (Ratcliffe et al. 2013).
Gentoo penguins Pygoscelis papua are among themost widespread penguin species, distributed fromthe northern subantarctic islands (Crozet; 46° S) tothe Antarctic Peninsula (62 to 69° S; Williams 1995).These birds are considered inshore opportunistic for-agers, consuming both benthic and pelagic species,and exhibiting high plasticity in their diet, marinehabitat use and dive behaviour (Bost & Jouventin1990, Woehler 1995, Lescroël & Bost 2005, Miller etal. 2009). They consume patchy prey encompassing alarge size range, from small crustaceans to large fishspecies (Hindell 1989, Robinson & Hindell 1996).Accordingly, their diets vary substantially amongbreeding locations, within colonies and also withinindividuals of the same colony (Croxall et al. 1988,
Bost & Jouventin 1990, Robinson & Hindell 1996,Lescroël et al. 2004, Polito et al. 2015).
As gentoo penguins are long-lived and sedentary(Williams & Rodwell 1992), individuals are expectedto learn to apply efficient foraging tactics throughouttheir lifetime and, thus, increase their individual effi-ciency when foraging under situations of competitionor food limitation (Estes et al. 2003). Indeed, recentstudies suggest that individuals exhibit some degreeof prey selection and specialisation, as judged bystomach content analysis and stable isotope values(Polito et al. 2015). However, there is little informa-tion on individual consistency in foraging behaviourand on whether such specialisations are linked todiet in this species.
In the present study, we investigated inter- and intra-individual variation in the foraging ecology of gentoo penguins. We used complementary bio-loggingand stable isotope analysis, coupled with morphomet-ric measurements to: (1) describe their inter-individualvariation in morphology, spatial use and dive be -haviour; (2) quantify their intra-individual variation inforaging behaviour; (3) investigate the links betweenconsistency in foraging behaviour, distances travelledand body condition; and (4) describe their inter-individual variation in feeding ecology, and determineif dietary specialisations exist and are maintained out-side of the breeding season. We predicted that: (1) individuals would differ greatly in foraging metrics, asgentoo penguin diet and behaviour are known to varyamong colonies and between individuals of the samecolonies, and that such variation would be attributed todifferences in body mass, which influences dive depth(Lescroël et al. 2004, Lescroël & Bost 2005, Cook et al.2013, Polito et al. 2015, Camprasse et al. 2017); (2) di-etary and behavioural consistency would be detected,as populations usually considered generalists are in-creasingly shown to be composed of individual spe-cialists (Woo et al. 2008, Araújo et al. 2011, Loxdale etal. 2011, Layman & Allgeier 2012, Fodrie et al. 2015);and (3) individuals displaying higher consistency inforaging behaviour would travel shorter distances andhave higher body condition, as such consistency isthought to allow individuals to forage more efficiently(Bolnick et al. 2003, Estes et al. 2003).
MATERIALS AND METHODS
Study site and instrumentation
The study was performed at Kerguelen Island inthe southern Indian Ocean, one of the major breed-
228

Camprasse et al.: Variation in gentoo penguin foraging ecology
ing grounds for gentoo penguins (hereafter referredto as gentoos) with 40 000 pairs (Lescroël et al. 2004,Lynch 2013). Gentoos breed along most of the Ker-guelen coastline in many small to medium-sizedcolonies ranging from 15 to >400 pairs). As the dietand foraging behaviour of this species are knownto vary substantially among colonies and withinbreeding locations, especially on Kerguelen Island(Lescroël et al. 2004, Lescroël & Bost 2005), 2 colonieswere selected to ensure that the patterns observedwere not solely dependent upon colony location.Accordingly, field work was conducted at the PointeSuzanne and Estacade colonies (ca. 20 km apart,49° 26’ S, 70° 26’ E and 49° 15’ S, 70° 33’ E, respec-tively, with ca. 50 and 25 chicks, respectively; Fig. 1).Both colonies face the open ocean. The PointeSuzanne colony, however, faces a wider range of foraging habitats due to its proximity to a more shel-tered bay (Baie Norvégienne). The Estacade colonyis localized westward of the Polar Front, a productivefrontal zone, on the eastward side of the Kerguelenshelf. Gentoos were in the late chick-rearing (i.e.crèche) stage at both study sites. Logistical con-straints prevented sampling other colonies, as well asgreater sample sizes, and so our results on site effectsmust be interpreted with caution.
We deployed data loggers on breeding gentoosduring the late chick-rearing period (crèche stage:chicks >4−5 wk old), in the 2014/15 breeding season(Table 1). To determine the at-sea movements anddiving behaviour of the penguins, we used Fastloc
GPS loggers (F2G 134A; FastLoc®; Sirtrack; 69 × 28 ×21 mm, 39 g in air), alone or in combination withtime-depth recorders (TDR, LAT1800S, Lotek Wire-less; 36 × 11 × 7.2 mm, 4.8 g in air). GPS loggers wereprogrammed to sample position every 5 min. TheTDR units were set to record depth and temperatureat 1 s intervals. All attached devices, alone or in com-bination, weighed <1% body mass.
At Pointe Suzanne, sampling occurred between 24November and 9 December 2014. In total, 24 birdswere instrumented for 4 to 16 d according to the possibilities of recapture. We used either 2 kinds ofinstruments (GPS+TDR: n = 18), or only 1 instrument(GPS: n = 4, TDR: n = 2). At Estacade, 9 birds wereinstrumented between 20 December 2014 and 4 Jan-uary 2015 with GPS+TDR for 4 to 15 d.
All instrumented birds were confirmed breeders,with only birds that were observed feeding chicks be-ing sampled. Individuals were weighed in a cloth bagusing a suspension scale (±25 g, Pesola) before dataloggers were attached to the dorsal feathers using wa-terproof tape (Tesa 4651) and cyanoacrylate glue(Loctite 401 Instant Adhesive). Individuals were thenreleased and resumed normal behaviours. With theexception of 3 individuals from Estacade that were re-captured on the beach a few kilometres north or southof the colony, all birds were recaptured at the colonyafter several foraging trips. The data loggers were re-moved and individuals were weighed again. Meas-urements of bill length and depth were taken withVernier callipers (±0.05 mm) and flipper length with a
229
Fig. 1. One track per gentoo penguinPygoscelis papua instrumented atPointe Suzanne (left panel) and Estacade (right panel), Kerguelen Islands, Indian Ocean, during thecrèche period in December 2014 to
January 2015

Mar Ecol Prog Ser 578: 227–242, 2017
metal ruler (±1 mm). In addition, a blood sample(0.5−1.5 ml) was obtained by venipuncture of a tarsalvein for stable isotope analysis and molecular sex de-termination. Feathers (n = 3−6) were plucked from thethorax region for stable isotope analysis. Handlingtimes ranged from 15 to 20 min, during which thebird’s head was covered with a hood to reduce stress.Of the 33 birds instrumented at the 2 study sites, 28birds were recaptured, of which 4 did not go to sea toforage and 2 individuals had TDRs that malfunctioned.Overall, 22 individuals provided data which wereanalysed (Pointe Suzanne: n = 17, Estacade: n = 5). All22 individuals conducted more than 1 trip, with 19providing both TDR and GPS data.
Isotopic analyses
The δ13C values of seabirds reflect their foraginghabitats (Cherel & Hobson 2007, Jaeger et al. 2010),
while their δ15N values increase withtrophic level (Cherel et al. 2010). Iso-topic values were measured on wholeblood and feathers. The rationale isthat the 2 complementary tissues inte-grate different periods of information,due to the fact that the keratin infeathers is inert after synthesis (de -tails in Cherel et al. 2008). Blood is ametabolic active tissue that integratesa period of weeks before sampling,whereas feathers reflect the diet atthe time they were grown, as feathersare metabolically inert after they aregrown (Cherel et al. 2000). In thepresent study, blood isotopic valuesintegrated a few weeks before sampling, thus corresponding to thebreeding period (Bearhop et al. 2006).In contrast, gentoos moult once a year,at the end of the breeding period,after a period of 10 d at sea dedicatedto replenishment of body reserves(Croxall & Davis 1999, Polito et al.2011). They then fast ashore for about3 wk, using their body reserves tocover the energetic and nutrientneeds for moulting and fasting (Crox-all & Davis 1999). Hence, the iso-topic values of feathers document the foraging ecology of penguins duringthe pre-moult period of hyperphagiaat sea during which they build up
energy reserves (Cherel et al. 2008), here almost 1 yrbefore sampling the instrumented gentoos.
In the laboratory, blood samples were freeze-driedand powdered. Lipid extraction was unnecessary, asthe C:N mass ratio was <3.5 for all blood samples(Cherel et al. 2005b); C:N mass ratios ± SD were3.29 ± 0.06 (whole blood, n = 25) and 3.17 ± 0.05(feathers, n = 27). A pool of 3 feathers bird−1 wascleaned of surface lipids and contaminants using a2:1 chloroform:methanol bath, air-dried and cut intosmall pieces. For each feather, the rachis and the top5 mm of the feather synthesised at sea were dis-carded before analysis so that the remaining feathersections were homogeneous and corresponded to thefasting period (Cherel et al. 2005a).
Nitrogen and carbon isotopic ratios were measuredon aliquots of 0.2 to 0.4 mg with a continuous-flowisotope-ratio mass spectrometer (Thermo ScientificDelta V Advantage) coupled to an elemental ana -lyser (Thermo Scientific Flash EA 1112). Results are
230
Bird Sex Body Initial Bill Bill Flipper Tracking Totalcondition mass depth length length time no. of
index (kg) (mm) (mm) (mm) (d) trips
Pointe Suzanne4 F 0.4 5.0 13.4 81.0 225.0 8.3 157 F −0.4 5.8 16 95.0 244.0 6.9 49 F −0.4 3.6 13.3 76.0 215.0 10.9 1110 F −0.4 4.4 15.6 81.0 220.0 7.0 913 F −0.4 4.4 15.8 80.0 221.0 10 315 F −0.3 5.2 15.1 88.0 232.0 4.0 320 F 0.2 5.0 14.9 75.0 230.0 4.5 322 F 0.0 4.5 15.5 81.0 210.0 13.3 624 F 0.4 5.1 14.3 84.0 220.0 4.4 31 M −1.7 4.3 16.7 95.0 234.0 6.5 92 M − 5.9 11.8 − 235.0 8.2 123 M 0.4 6.8 18.1 91.0 245.0 7.9 25 M − 6.1 16.5 − 235.0 6.1 36 M 0.4 5.9 18.4 79.0 231.0 − −11 M −0.1 5.8 16.5 89.0 238.0 8.7 312 M 0.3 5.7 17.6 85.0 225.0 8.0 214 M −0.2 5.3 16.5 90.0 228.0 4.4 417 M −0.1 5.3 16.8 85.0 230.0 5.4 319 M −0.2 5.7 18.2 89.0 232.0 − −23 M −0.3 5.8 17.3 95.0 232.0 − −
Estacade26 – − 4.5 − − − 6.1 228 − − 6.4 − − − 15.4 327 F − 5 17.1 82.0 220.0 4.0 325 M − 6.6 − 91.0 234.0 5.9 230 M 1.4 7.8 19.5 92.0 235.0 6.2 633 M 1.1 6.3 16.4 85.0 224.0 − −
Table 1. Summary of bio-logging deployments for gentoo penguins Pygoscelispapua instrumented and retrieved at Pointe Suzanne and Estacade (Ker -guelen Islands, Indian Ocean) during the crèche period in December 2014 to
January 2015; F: female, M: male, –: missing data

Camprasse et al.: Variation in gentoo penguin foraging ecology
presented in the usual δ notation relative to ViennaPeeDee Belemnite (VPDB) for carbon and atmo -spheric N2 (AIR) for nitrogen. Replicate measure-ments of internal laboratory standards (acetanilideand peptone) indicated measurement errors <0.15‰for both δ13C and δ15N. Blood and/or feather sam-pling was not possible on all individuals instru-mented, resulting in the collection of either no sam-ples, only feathers, only blood, or both samples foreach individual. Stable isotope values were obtainedfrom 25 individuals for blood (11 females, 14 males),and 27 individuals for feathers (11 females, 13 males,3 unknown). Both tissues were sampled in 24 individ-uals (11 females, 13 males). Of these 24 individuals,16 also had both GPS and TDR data, 1 had TDR dataonly, 3 had GPS data only, and 4 did not have anybio-logging data.
Data processing
All data analyses were conducted in the R Statisti-cal Environment in version 3.3 (R Core Team 2015).The GPS records for each bird were visually in -spected to identify individual foraging trips. As somebirds hauled out in some locations distant from thecolony for a few hours to several days, foraging tripswere defined as the time between when an indi -vidual left a land-based position until it came backashore. The diveMove package (Luque 2007) wasused to apply a speed filter to the GPS data to removeerroneous locations (with a speed threshold of 1.5 ms−1 based on the 95th percentile of swim speeds for allindividuals). The GPS records were interpolated to1 s intervals in the adehabitatLT package (Calenge2015) to provide spatial information for the diverecords. Furthermore, the packages trip (Sumner2009) and sp (Pebesma & Bivand 2005) were used toobtain summaries of at-sea movements and investi-gate the consistency in habitat use. Individual trackswere overlaid with a grid comprised of 2 × 2 km cells,where the number of grid cells used were calculatedfor each trip. Means and coefficients of variation foreach individual were calculated for trip duration,maximum range, and horizontal distance travelledper trip and per hour. Bearing for each trip was calcu-lated as the angle between the colony and the mostdistal point of the tracks, and standard deviation inbearing was calculated for each individual using thecircular package (Agostinelli & Lund 2011).
The diveMove package was used to obtain sum-maries of diving metrics from TDR records (onlydives deeper than 2 m were considered to be forag-
ing dives, following Lescroël & Bost 2005). The lubri-date package (Grolemund & Wickham 2011) wasused to identify night and day dives based on sunsetand sunrise times at the relevant sites. Benthic andpelagic dives were determined based on the propor-tion of dive time that was spent in the bottom phasefor each dive (phase detected by the ‘diveStats’ func-tion after descent and before ascent), and the depthachieved on consecutive dives. If the dive depthstayed within 5% of the maximum depth for this divefor more than 15 s, and if the dive was within 5% ofthe maximum depth achieved during the last 15 minof diving, the dive was labelled as ‘flat-benthic’. If thedive was within 5% of the maximum depth achievedfor ‘flat-benthic’ dives during the last 15 min of div-ing, but the other criterion was not met, the dive waslabelled as ‘V-benthic’. If the dive met neither ofthese criteria, the dive was labelled as ‘pelagic’. Theproportion of pelagic dives was then determined.Means and standard deviations per trip were calcu-lated for bottom time and mean bottom depth of eachdive, the total vertical distance travelled per trip andper hour, and the proportion of pelagic and night div-ing. Horizontal and vertical distances travelled weresummed to provide an index of foraging energy ex -penditure per trip and per hour (Wilson et al. 1986).
An index of consistency in habitat use was calcu-lated for each animal. For each trip, the number ofgrid cells used by the individuals was identified. Thenumber of shared grid cells between each pair oftrips (e.g. trip 1 and trip 2, trip 2 and trip 3, trip 1 andtrip 3 etc.) was determined and the average of thesecalculated. This number was then divided by theaverage number of grid cells used per trip. Differentgrid cell sizes were tested to calculate the index ofconsistency in habitat use (from 1 × 1 km to 10 × 10 km)to check the influence of grid cell size on our estimateof spatial consistency. Indices obtained, regardless ofcell grid sizes, were highly correlated, and data fromthe 2 × 2 km grid cell size are presented.
Statistical analyses
Body mass and morphometric measurements werecorrelated (linear regressions: beak depth: F1,18 =14.62, R2 = 0.42, p = 0.001; flipper length: F1,18 = 14.15,R2 = 0.65, p = 0.001) and therefore, only relationshipswith body mass were further investigated in models.A principal component analysis was run on flipper andbill length and bill depth with the FactoMineR pack-age (Lê et al. 2008). Residuals from a linear regres-sion of the first principal component against body
231
Mar Ecol Prog Ser 578: 227–242, 2017
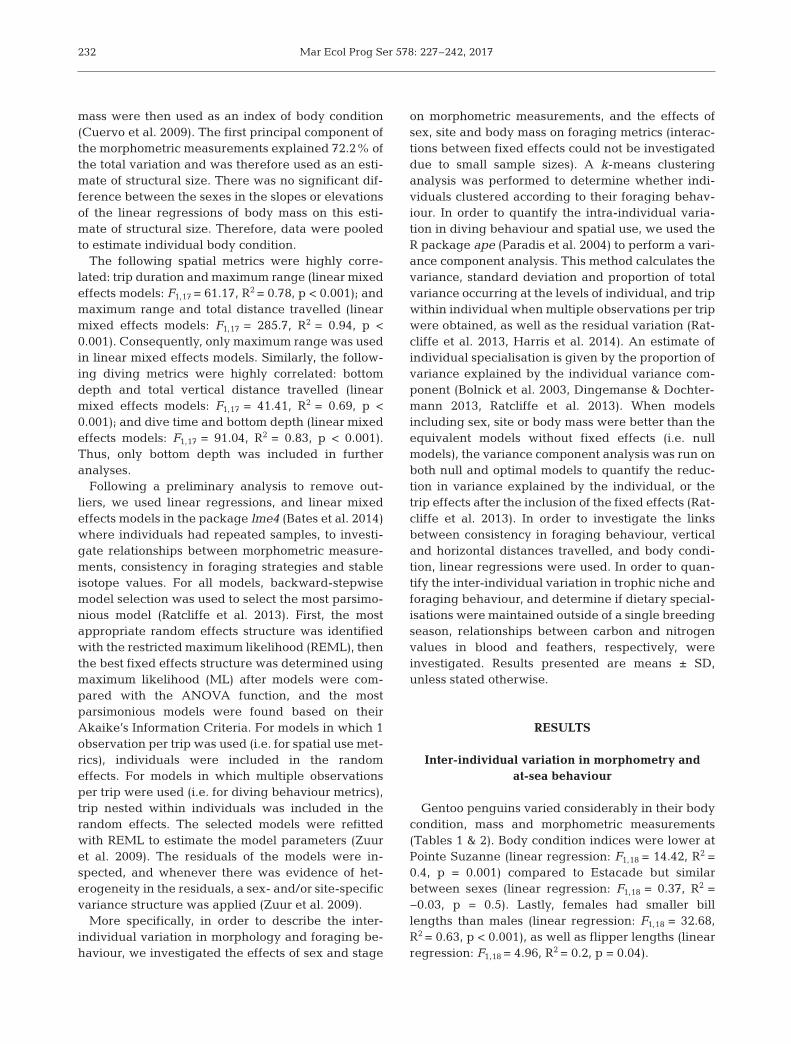
mass were then used as an index of body condition(Cuervo et al. 2009). The first principal component ofthe morphometric measurements ex plained 72.2% ofthe total variation and was therefore used as an esti-mate of structural size. There was no significant dif-ference between the sexes in the slopes or elevationsof the linear regressions of body mass on this esti-mate of structural size. Therefore, data were pooledto estimate individual body condition.
The following spatial metrics were highly corre-lated: trip duration and maximum range (linear mixedeffects models: F1,17 = 61.17, R2 = 0.78, p < 0.001); andmaximum range and total distance travelled (linearmixed effects models: F1,17 = 285.7, R2 = 0.94, p <0.001). Consequently, only maximum range was usedin linear mixed effects models. Similarly, the follow-ing diving metrics were highly correlated: bottomdepth and total vertical distance travelled (linearmixed effects models: F1,17 = 41.41, R2 = 0.69, p <0.001); and dive time and bottom depth (linear mixedeffects models: F1,17 = 91.04, R2 = 0.83, p < 0.001).Thus, only bottom depth was included in furtheranalyses.
Following a preliminary analysis to remove out-liers, we used linear regressions, and linear mixedeffects models in the package lme4 (Bates et al. 2014)where individuals had repeated samples, to investi-gate relationships between morphometric measure-ments, consistency in foraging strategies and stableisotope values. For all models, backward-stepwisemodel selection was used to select the most parsimo-nious model (Ratcliffe et al. 2013). First, the mostappropriate random effects structure was identifiedwith the restricted maximum likelihood (REML), thenthe best fixed effects structure was determined usingmaximum likelihood (ML) after models were com-pared with the ANOVA function, and the most parsimonious models were found based on theirAkaike’s Information Criteria. For models in which 1observation per trip was used (i.e. for spatial use met-rics), individuals were included in the randomeffects. For models in which multiple observationsper trip were used (i.e. for diving behaviour metrics),trip nested within individuals was included in therandom effects. The selected models were refittedwith REML to estimate the model parameters (Zuuret al. 2009). The residuals of the models were in -spected, and whenever there was evidence of het-erogeneity in the residuals, a sex- and/or site-specificvariance structure was applied (Zuur et al. 2009).
More specifically, in order to describe the inter-individual variation in morphology and foraging be -haviour, we investigated the effects of sex and stage
on morphometric measurements, and the effects ofsex, site and body mass on foraging metrics (interac-tions between fixed effects could not be investigateddue to small sample sizes). A k-means clusteringanalysis was performed to determine whether indi-viduals clustered according to their foraging behav-iour. In order to quantify the intra-individual varia-tion in diving behaviour and spatial use, we used theR package ape (Paradis et al. 2004) to perform a vari-ance component analysis. This method calculates thevariance, standard deviation and proportion of totalvariance occurring at the levels of individual, and tripwithin individual when multiple observations per tripwere obtained, as well as the residual variation (Rat-cliffe et al. 2013, Harris et al. 2014). An estimate ofindividual specialisation is given by the proportion ofvariance explained by the individual variance com-ponent (Bolnick et al. 2003, Dingemanse & Dochter-mann 2013, Ratcliffe et al. 2013). When modelsincluding sex, site or body mass were better than theequivalent models without fixed effects (i.e. nullmodels), the variance component analysis was run onboth null and optimal models to quantify the reduc-tion in variance explained by the individual, or thetrip effects after the inclusion of the fixed effects (Rat-cliffe et al. 2013). In order to investigate the linksbetween consistency in foraging behaviour, verticaland horizontal distances travelled, and body condi-tion, linear regressions were used. In order to quan-tify the inter-individual variation in trophic niche andforaging behaviour, and determine if dietary special-isations were maintained outside of a single breedingseason, relationships between carbon and nitrogenvalues in blood and feathers, respectively, wereinvestigated. Results presented are means ± SD,unless stated otherwise.
RESULTS
Inter-individual variation in morphometry andat-sea behaviour
Gentoo penguins varied considerably in their bodycondition, mass and morphometric measurements(Tables 1 & 2). Body condition indices were lower atPointe Suzanne (linear regression: F1,18 = 14.42, R2 =0.4, p = 0.001) compared to Estacade but similarbetween sexes (linear regression: F1,18 = 0.37, R2 =−0.03, p = 0.5). Lastly, females had smaller billlengths than males (linear regression: F1,18 = 32.68,R2 = 0.63, p < 0.001), as well as flipper lengths (linearregression: F1,18 = 4.96, R2 = 0.2, p = 0.04).
232
Camprasse et al.: Variation in gentoo penguin foraging ecology
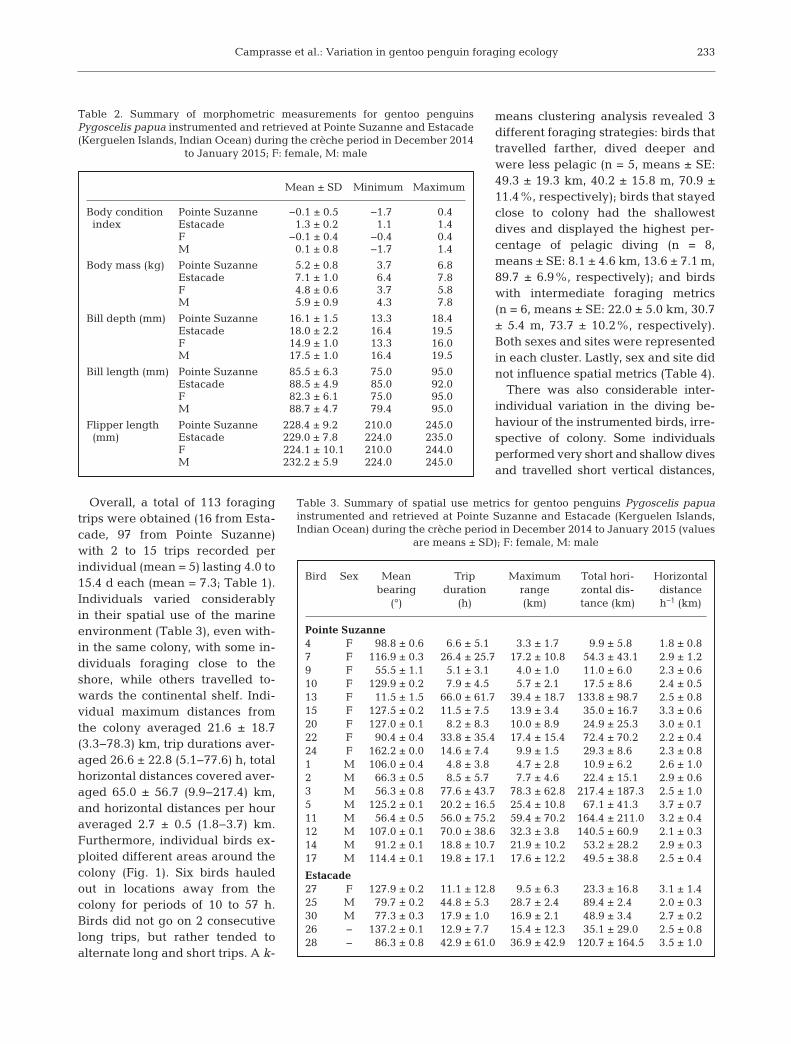
Overall, a total of 113 foragingtrips were obtained (16 from Esta-cade, 97 from Pointe Suzanne)with 2 to 15 trips recorded perindividual (mean = 5) lasting 4.0 to15.4 d each (mean = 7.3; Table 1).Individuals varied considerablyin their spatial use of the marineenvironment (Table 3), even with -in the same colony, with some in -dividuals foraging close to theshore, while others travelled to -wards the continental shelf. Indi-vidual maximum distances fromthe colony averaged 21.6 ± 18.7(3.3−78.3) km, trip durations aver-aged 26.6 ± 22.8 (5.1−77.6) h, totalhorizontal distances covered aver-aged 65.0 ± 56.7 (9.9−217.4) km,and horizontal distances per houraveraged 2.7 ± 0.5 (1.8−3.7) km.Furthermore, individual birds ex -ploited different areas around thecolony (Fig. 1). Six birds hauledout in locations away from thecolony for periods of 10 to 57 h.Birds did not go on 2 consecutivelong trips, but rather tended toalternate long and short trips. A k-
means clustering analysis revealed 3different foraging strategies: birds thattravelled farther, dived deeper andwere less pelagic (n = 5, means ± SE:49.3 ± 19.3 km, 40.2 ± 15.8 m, 70.9 ±11.4%, respectively); birds that stayedclose to colony had the shallowestdives and displayed the highest per-centage of pelagic diving (n = 8,means ± SE: 8.1 ± 4.6 km, 13.6 ± 7.1 m,89.7 ± 6.9%, respectively); and birdswith intermediate foraging metrics(n = 6, means ± SE: 22.0 ± 5.0 km, 30.7± 5.4 m, 73.7 ± 10.2%, respectively).Both sexes and sites were representedin each cluster. Lastly, sex and site didnot influence spatial metrics (Table 4).
There was also considerable inter-individual variation in the diving be -haviour of the instrumented birds, irre-spective of colony. Some individualsperformed very short and shallow divesand travelled short vertical distances,
233
Mean ± SD Minimum Maximum
Body condition Pointe Suzanne −0.1 ± 0.5 −1.7 0.4index Estacade 1.3 ± 0.2 1.1 1.4
F −0.1 ± 0.4 −0.4 0.4 M 0.1 ± 0.8 −1.7 1.4
Body mass (kg) Pointe Suzanne 5.2 ± 0.8 3.7 6.8 Estacade 7.1 ± 1.0 6.4 7.8 F 4.8 ± 0.6 3.7 5.8 M 5.9 ± 0.9 4.3 7.8
Bill depth (mm) Pointe Suzanne 16.1 ± 1.5 13.3 18.4 Estacade 18.0 ± 2.2 16.4 19.5 F 14.9 ± 1.0 13.3 16.0 M 17.5 ± 1.0 16.4 19.5
Bill length (mm) Pointe Suzanne 85.5 ± 6.3 75.0 95.0 Estacade 88.5 ± 4.9 85.0 92.0 F 82.3 ± 6.1 75.0 95.0 M 88.7 ± 4.7 79.4 95.0
Flipper length Pointe Suzanne 228.4 ± 9.2 210.0 245.0(mm) Estacade 229.0 ± 7.8 224.0 235.0
F 224.1 ± 10.1 210.0 244.0 M 232.2 ± 5.9 224.0 245.0
Table 2. Summary of morphometric measurements for gentoo penguinsPygoscelis papua instrumented and retrieved at Pointe Suzanne and Estacade(Kerguelen Islands, Indian Ocean) during the crèche period in December 2014
to January 2015; F: female, M: male
Bird Sex Mean Trip Maximum Total hori- Horizontal bearing duration range zontal dis- distance
(°) (h) (km) tance (km) h−1 (km)
Pointe Suzanne4 F 98.8 ± 0.6 6.6 ± 5.1 3.3 ± 1.7 9.9 ± 5.8 1.8 ± 0.87 F 116.9 ± 0.3 26.4 ± 25.7 17.2 ± 10.8 54.3 ± 43.1 2.9 ± 1.29 F 55.5 ± 1.1 5.1 ± 3.1 4.0 ± 1.0 11.0 ± 6.0 2.3 ± 0.610 F 129.9 ± 0.2 7.9 ± 4.5 5.7 ± 2.1 17.5 ± 8.6 2.4 ± 0.513 F 11.5 ± 1.5 66.0 ± 61.7 39.4 ± 18.7 133.8 ± 98.7 2.5 ± 0.815 F 127.5 ± 0.2 11.5 ± 7.5 13.9 ± 3.4 35.0 ± 16.7 3.3 ± 0.620 F 127.0 ± 0.1 8.2 ± 8.3 10.0 ± 8.9 24.9 ± 25.3 3.0 ± 0.122 F 90.4 ± 0.4 33.8 ± 35.4 17.4 ± 15.4 72.4 ± 70.2 2.2 ± 0.424 F 162.2 ± 0.0 14.6 ± 7.4 9.9 ± 1.5 29.3 ± 8.6 2.3 ± 0.81 M 106.0 ± 0.4 4.8 ± 3.8 4.7 ± 2.8 10.9 ± 6.2 2.6 ± 1.02 M 66.3 ± 0.5 8.5 ± 5.7 7.7 ± 4.6 22.4 ± 15.1 2.9 ± 0.63 M 56.3 ± 0.8 77.6 ± 43.7 78.3 ± 62.8 217.4 ± 187.3 2.5 ± 1.05 M 125.2 ± 0.1 20.2 ± 16.5 25.4 ± 10.8 67.1 ± 41.3 3.7 ± 0.711 M 56.4 ± 0.5 56.0 ± 75.2 59.4 ± 70.2 164.4 ± 211.0 3.2 ± 0.412 M 107.0 ± 0.1 70.0 ± 38.6 32.3 ± 3.8 140.5 ± 60.9 2.1 ± 0.314 M 91.2 ± 0.1 18.8 ± 10.7 21.9 ± 10.2 53.2 ± 28.2 2.9 ± 0.317 M 114.4 ± 0.1 19.8 ± 17.1 17.6 ± 12.2 49.5 ± 38.8 2.5 ± 0.4
Estacade27 F 127.9 ± 0.2 11.1 ± 12.8 9.5 ± 6.3 23.3 ± 16.8 3.1 ± 1.425 M 79.7 ± 0.2 44.8 ± 5.3 28.7 ± 2.4 89.4 ± 2.4 2.0 ± 0.330 M 77.3 ± 0.3 17.9 ± 1.0 16.9 ± 2.1 48.9 ± 3.4 2.7 ± 0.226 − 137.2 ± 0.1 12.9 ± 7.7 15.4 ± 12.3 35.1 ± 29.0 2.5 ± 0.828 − 86.3 ± 0.8 42.9 ± 61.0 36.9 ± 42.9 120.7 ± 164.5 3.5 ± 1.0
Table 3. Summary of spatial use metrics for gentoo penguins Pygoscelis papuainstrumented and retrieved at Pointe Suzanne and Estacade (Kerguelen Islands,Indian Ocean) during the crèche period in December 2014 to January 2015 (values
are means ± SD); F: female, M: male

Mar Ecol Prog Ser 578: 227–242, 2017
while others dived for much longer and deeper, andtravelled much greater vertical distances (Table 5). Onaverage, individuals spent 70.9 ± 20.1 (29.5−106.8) s atthe bottom of dives, dived to bottom depths of 26.0 ±14.7 (5.1−61.6) m, and travelled total vertical distancesof 26.6 ± 23.2 (2.1−74.5) km, and hourly vertical dis-tances of 0.8 ± 0.2 (0.4−1.1) km. Accordingly, the dis-tance travelled (both horizontal and vertical) varied
between individuals (mean dis-tance per trip: 96.6 ± 81.0[13.3− 279.6] km; mean dis-tance per hour of foraging:3.5 ± 0.6 [2.3−4.8] km).
Sex and site did not signifi-cantly influence dive depth(Table 4). Some individuals per-formed almost entirely pe lagicdives while, for others, benthicdives represented up to 48% ofall dives (Table 5). Furthermore,individuals varied in their div-ing schedule, with some indi-viduals diving half of their timeat night, and other individualsdiving mostly during the day(Table 5, Fig. 2). Daylight diveswere on average 30.3 ± 37.5 mdeep and 68.5 ± 53.2 s long (n =24 336, 75% of dives recorded)
while night dives were on average 9.2 ± 10.2 m deepand 52.3 ± 39.9 s long (n = 8298, 25% of dives recorded).Several individuals dived at night during multiple-daytrips while other birds performed short trips (ca. 10 kmfrom the colony) and dived predominantly at night. Thefrequency of night diving in creased with the proportionof pelagic diving, which averaged 76.8% during theday and 92.9% at night (Fig. 2).
234
Variable Type of model Parameters LR/F test df p
Maximum Linear Random effect: bird 33.21 6 <0.0001range mixed effects Fixed effects
Sex 3.21 8 0.07Site 0 8 0.98
Body mass 3.15 8 0.08
Bottom Linear Random effect: bird/trip 1236.29 9 <0.0001depth mixed effects Fixed effects
Sex 3.2 8 0.07Site 0.46 8 0.5
Body mass 7.29 8 0.01
Repeatability Linear model Sex 1.42 2, 18 0.27indices Site 0.04 1, 18 0.84
Proportion of Linear Fixed effects 84.83 4 <0.0001pelagic dives mixed effects Dive depth
Table 4. Model ANOVA testing the effect of gentoo penguin Pygoscelis papua sex andsite on maximum range, bottom depth and repeatability, including bird as a randomfactor or trip nested within bird (likelihood ratio [LR] for linear mixed effects modelsand F values for simple linear regressions). The last row reports on the linear mixedeffects model testing the effect of dive depth on the proportion of pelagic dives. Values
in bold are significant
Bird Sex Bottom Bottom Total vertical Hourly vertical Total (horizontal + vertical) Pelagic Night diving (%) time (s) depth (m) distance (km) distance (km) distance travelled diving (% of all dives)
Per trip (km) Per hour (km)
4 F 29.5 ± 15.1 5.1 ± 2.0 3.4 ± 2.1 0.5 ± 0.2 13.3 ± 7.5 2.3 ± 0.8 93.8 ± 3.8 43.8 ± 27.37 F 71.8 ± 30.3 32.6 ± 26.1 33.3 ± 35.8 0.9 ± 0.5 87.6 ± 78.5 3.8 ± 0.7 75.4 ± 20.3 22.5 ± 19.29 F 33.9 ± 14.7 5.2 ± 1.8 3.4 ± 3.5 0.6 ± 0.3 14.4 ± 9.5 2.8 ± 0.8 89.3 ± 9.9 40.9 ± 34.310 F 51.6 ± 20.5 11.1 ± 5.4 7.6 ± 5.3 0.9 ± 0.3 25.0 ± 13.9 3.3 ± 0.4 92.0 ± 5.6 39.7 ± 33.813 F 86.4 ± 10.7 40.1 ± 8.9 72.3 ± 66.2 1.1 ± 0.1 206.1 ± 164.8 3.6 ± 0.7 77.9 ± 7.2 15.6 ± 9.415 F 88.2 ± 31.6 17.5 ± 11.9 9.9 ± 10.1 0.7 ± 0.3 44.9 ± 26.8 4.0 ± 0.2 96.1 ± 5.1 24.4 ± 18.320 F 68.3 ± 32.2 18.6 ± 15.1 8.8 ± 11.7 0.8 ± 0.5 33.7 ± 36.9 3.8 ± 0.5 87.6 ± 11.7 52.4 ± 42.922 F 79.5 ± 28.3 26.6 ± 13.9 31.0 ± 30.3 0.8 ± 0.4 103.5 ± 99.3 3.1 ± 0.6 80.4 ± 14.7 14.5 ± 5.81 M 54.8 ± 17.0 9.7 ± 5.5 2.1 ± 1.9 0.4 ± 0.3 13.0 ± 8.1 3.1 ± 1.2 95.7 ± 5.3 36.5 ± 25.92 M 89.6 ± 13.8 15.7 ± 8.2 7.2 ± 7.3 0.8 ± 0.2 29.6 ± 22.3 3.6 ± 0.7 88.2 ± 9.5 54.8 ± 17.93 M 101.6 ± 3.2 61.6 ± 8.8 62.2 ± 51.4 0.7 ± 0.3 279.6 ± 238.7 3.3 ± 1.2 52.7 ± 6.9 15.4 ± 5.75 M 69.5 ± 5.3 26.2 ± 6.6 23.2 ± 20.2 1.1 ± 0.3 90.4 ± 61.5 4.8 ± 0.8 86.5 ± 5.1 6.3 ± 5.511 M 53.8 ± 11.3 22.5 ± 6.9 48.3 ± 67.3 0.8 ± 0.1 212.7 ± 278.3 4.1 ± 0.4 80.6 ± 6.6 24.1 ± 5.212 M 106.8 ± 8.9 48.8 ± 3.6 74.5 ± 45.1 1.0 ± 0.1 215.0 ± 106.0 3.1 ± 0.2 66.8 ± 4.8 15.2 ± 4.814 M 57.6 ± 12.0 25.3 ± 8.7 17.7 ± 14.0 0.8 ± 0.3 70.9 ± 42.2 3.7 ± 0.3 74.6 ± 3.9 12.9 ± 6.925 M 72.7 ± 5.3 36.9 ± 9.5 37.1 ± 12.0 0.9 ± 0.4 126.5 ± 14.4 2.9 ± 0.7 68.1 ± 7.3 6.0 ± 2.730 M 88.0 ± 11.6 36.5 ± 10.0 18.6 ± 6.9 1.0 ± 0.3 67.4 ± 6.7 3.8 ± 0.2 57.0 ± 12.4 15.5 ± 3.626 − 65.1 ± 15.5 25.6 ± 19.8 12.9 ± 15.2 0.8 ± 0.7 48.0 ± 44.2 3.3 ± 1.5 74.7 ± 13.0 5.7 ± 8.128 − 78.0 ± 52.1 28.0 ± 24.4 32.5 ± 43.5 0.7 ± 0.5 153.2 ± 208.0 4.2 ± 0.7 76.6 ± 26.8 17.0 ± 16.1
Table 5. Summary of dive metrics and distances travelled for gentoo penguins Pygoscelis papua instrumented and retrieved at PointeSuzanne and Estacade (Kerguelen Islands, Indian Ocean) during the crèche period in December 2014 to January 2015 (values are
means ± SD); F: female, M: male, –: unsexed

Camprasse et al.: Variation in gentoo penguin foraging ecology
Intra-individual variation and consistency inforaging behaviour
The large differences in standard de viations be -tween individuals indicate a substantial degree ofintra-individual variation both in spatial use anddive metrics (Tables 3−5, respectively). At the popu-lation level, the variance component analysisshowed low to moderate individual specialisationsboth in dive behaviour and spatial use (Table 6).The indices of consistency in habitat use were notinfluenced by sex or site (Table 4, mean 0.37 ± 0.20,range: 0.05−0.73, Fig. 3). Some penguins were veryconsistent in the proportion of pelagic or benthicdives they performed (e.g. individual 14 stayedwithin 10% of its own values) while others variedgreatly (e.g. individual 28 ranged from 47 to 98%of pelagic dives between trips; Fig. 4). The total(horizontal + vertical) distance travelled per hourwas not correlated with re peatability indices (linearregression: F1,17 = 0.97, R2 = −0.002, p = 0.34). Lastly,body condition did not vary with consistency inhabitat use (linear regression: F1,12 = 0.16, R2 =−0.07, p = 0.70).
235
Fig. 2. (A) Frequency of night diving, (B) distribution of dive depths across time of day and (C) relationship between night andpelagic diving in gentoo penguins Pygoscelis papua (panels A and B show individuals representative of the most benthic and
the most pelagic individuals) instrumented at Pointe Suzanne during the crèche period in December 2014 to January 2015
Fig. 3. Representative examples for 3 individual gentoo pen-guins Pygoscelis papua of spatial use and repeatability in-dex (RI) for a highly repeatable individual (grey), a moder-ately repeatable one (orange) and an individual with limitedrepeatability (black) among instrumented birds at PointeSuzanne and Estacade during the crèche period in December
2014 to January 2015

Mar Ecol Prog Ser 578: 227–242, 2017
Stable isotope values and link withforaging metrics
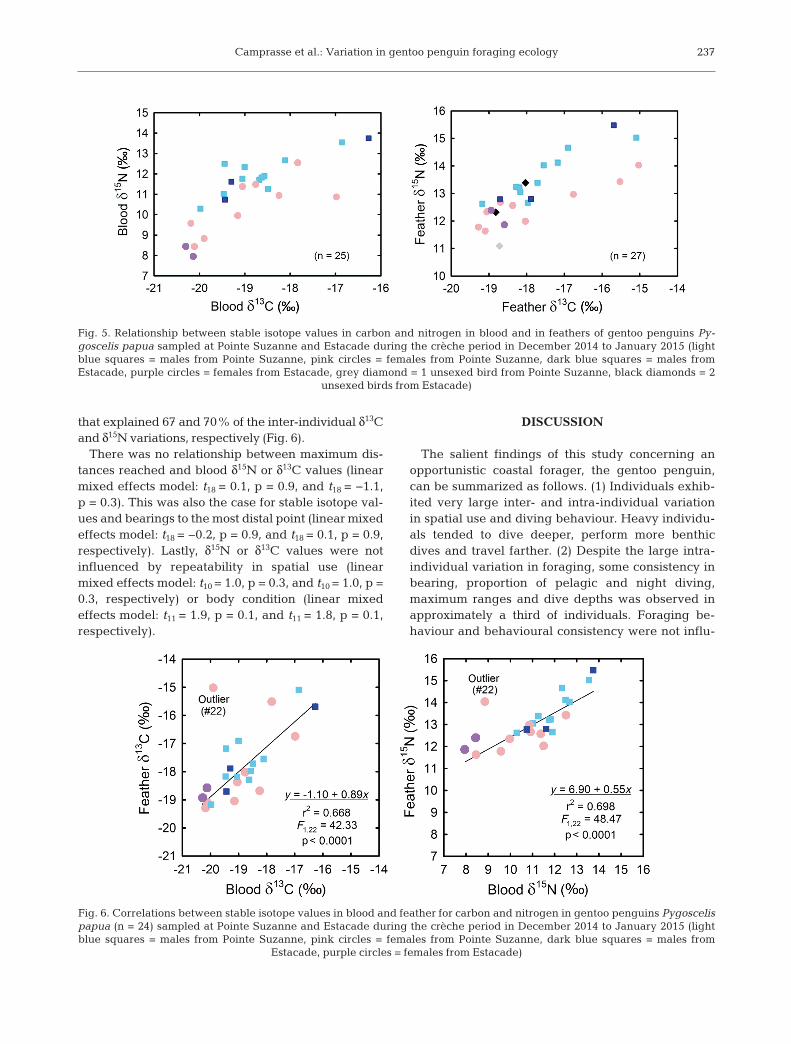
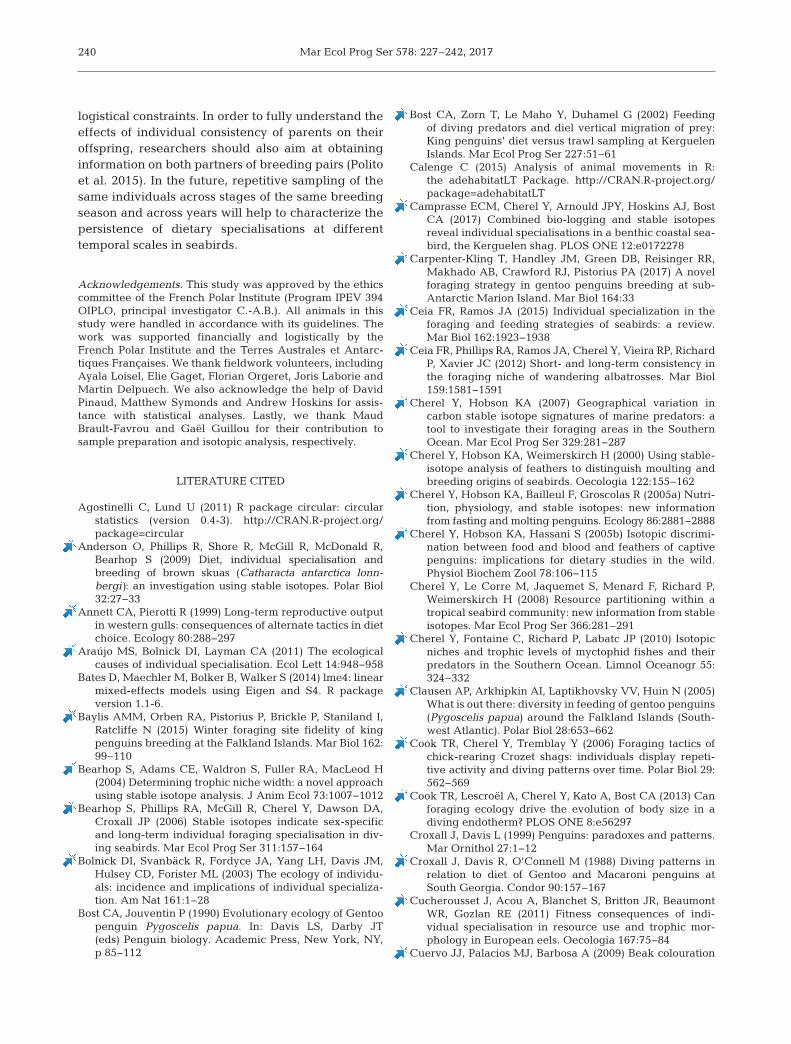
Tissue isotope values varied widelyamong individuals, with δ13C and δ15Nranges of 4.0 and 5.8‰ in blood and4.2 and 4.4‰ in feathers, respectively(Table 7). Values for δ13C and δ15N co-var-ied positively in both tissues (linear re-gression: F1,23 = 31.94, R2 = −0.56, p < 0.001and F1,22 = 38.72, R2 = −0.62, p < 0.001 inblood and feathers, respectively; Fig. 5).There was no significant difference be-tween the sexes in their δ13C values, butmales had higher δ15N values in blood andfeathers (linear mixed effects models: t23 =3.4, p = 0.002 and t23 = 0.9, p = 0.4, for nitrogen and carbon, respectively). Sitedid not influence δ15N and δ13C values(t23 = −0.6, p = 0.5, and t23 = −0.5, p = 0.6, respectively). Isotopic values in blood andfeathers were positively and linearly cor-related. Excluding an outlier (that was de-picted by a preliminary statistical analysis)increased the strength of the relationships
236
Variance component σ2 Σ σ2 %
Maximum rangeIndividual 127.6 11.3 13.7Residual 802.6 28.3 86.3
Bearings to most distal pointIndividual 1572.7 39.7 52.9Residual 1397.6 37.4 47.1
Mean bottom depth (null model)Individual 244.2 15.6 6.2Trip 62.6 7.9 1.6Residual 3612.8 60.1 92.2
Mean bottom depth (model with mass)Individual 150.9 12.3 4.0Trip 62.6 7.9 1.6Residual 3612.4 60.1 94.4
Proportion of pelagic diving (null model)Individual 166.4 12.9 67.5Residual 80.1 9.0 32.5
Proportion of pelagic diving (model with mass)Individual 33.5 5.8 51.3Residual 31.9 5.6 48.7
Table 6. Variance component analysis of dive depths, totaldistances travelled and bearings to most distal point for gentoo penguins Pygoscelis papua instrumented at PointeSuzanne and Estacade (Kerguelen Islands, Indian Ocean)during the crèche period in December 2014 to January2015. σ2 % is an estimate of individual specialisation (see
‘Materials and methods’ for details)Bird Sex Blood Blood Feather Feather
δC13 δN15 δC13 δN15
4 F −18.76 11.49 −18.03 11.997 F −18.25 10.93 −18.7 12.689 F −17.83 12.55 −15.52 13.4210 F −19.05 11.38 −18.37 12.5713 F −20.11 8.44 −19.10 11.6415 F −19.16 9.95 −19.06 12.3320 F −20.18 9.57 −19.28 11.7822 F −19.9 8.83 −15.03 14.0324 F −16.98 10.86 −16.75 12.97
M −18.68 11.70 NA NA2 M −16.86 13.55 −15.09 15.023 M −19.00 12.33 −16.90 14.665 M −19.44 12.50 −17.18 14.126 M −18.57 11.90 −17.97 12.6611 M −19.05 11.76 −18.19 13.2212 M −19.46 11.02 −18.17 13.0514 M −18.49 11.26 −17.71 13.3917 M −18.63 11.83 −18.28 13.2419 M −18.11 12.67 −17.55 14.0323 M −19.98 10.29 −19.17 12.6218 − NA NA −18.72 11.0927 F −20.30 8.43 −18.94 12.4029 F −20.14 7.95 −18.59 11.8625 M −19.30 11.62 −17.88 12.7930 M −16.27 13.75 −15.69 15.4733 M −19.44 10.74 −18.71 12.7826 − NA NA −18.82 12.3228 − NA NA −18.03 13.39
Table 7. Summary of stable isotope values for gentoo penguinsPygoscelis papua sampled at Pointe Suzanne and Estacade(Kerguelen Islands, Indian Ocean) in December 2014 to Jan-uary 2015; F: female, M: male, –: unsexed, NA: missing data
Fig. 4. Boxplots for the proportion of pelagic diving performed in subsequenttrips by individual gentoo penguins Pygoscelis papua instrumented at PointeSuzanne and Estacade during the crèche period in December 2014 to Janu-ary 2015. Bold horizontal line: median of the distribution; box: interquartilerange, IQR (first quartile Q1 to third quartile Q3); whiskers: (Q1 + 1.5 × IQR)
to (Q3 + 1.5 × IQR); points: outliers
Camprasse et al.: Variation in gentoo penguin foraging ecology
that explained 67 and 70% of the inter-individual δ13Cand δ15N variations, respectively (Fig. 6).
There was no relationship between maximum dis-tances reached and blood δ15N or δ13C values (linearmixed effects model: t18 = 0.1, p = 0.9, and t18 = −1.1,p = 0.3). This was also the case for stable isotope val-ues and bearings to the most distal point (linear mixedeffects model: t18 = −0.2, p = 0.9, and t18 = 0.1, p = 0.9,respectively). Lastly, δ15N or δ13C values were notinfluenced by repeatability in spatial use (linearmixed effects model: t10 = 1.0, p = 0.3, and t10 = 1.0, p =0.3, respectively) or body condition (linear mixedeffects model: t11 = 1.9, p = 0.1, and t11 = 1.8, p = 0.1,respectively).
DISCUSSION
The salient findings of this study concerning anopportunistic coastal forager, the gentoo penguin,can be summarized as follows. (1) Individuals exhib-ited very large inter- and intra-individual variationin spatial use and diving behaviour. Heavy individu-als tended to dive deeper, perform more benthicdives and travel farther. (2) Despite the large intra-individual variation in foraging, some consistency inbearing, proportion of pelagic and night diving, maximum ranges and dive depths was observed inapproximately a third of individuals. Foraging be -haviour and behavioural consistency were not influ-
237
Fig. 5. Relationship between stable isotope values in carbon and nitrogen in blood and in feathers of gentoo penguins Py-goscelis papua sampled at Pointe Suzanne and Estacade during the crèche period in December 2014 to January 2015 (lightblue squares = males from Pointe Suzanne, pink circles = females from Pointe Suzanne, dark blue squares = males from Estacade, purple circles = females from Estacade, grey diamond = 1 unsexed bird from Pointe Suzanne, black diamonds = 2
unsexed birds from Estacade)
Fig. 6. Correlations between stable isotope values in blood and feather for carbon and nitrogen in gentoo penguins Pygoscelispapua (n = 24) sampled at Pointe Suzanne and Estacade during the crèche period in December 2014 to January 2015 (lightblue squares = males from Pointe Suzanne, pink circles = females from Pointe Suzanne, dark blue squares = males from
Estacade, purple circles = females from Estacade)

Mar Ecol Prog Ser 578: 227–242, 2017
enced by sex and site. (3) There were large inter-individual variations in stable isotope values, anddietary specialisations were present and maintainedoutside of the single breeding season sampled.
As inshore foragers, gentoos are known to stronglydiffer in their foraging behaviour according to thelocal environment (Lescroël & Bost 2005). Our firstprediction was that instrumented individuals woulddiffer greatly in foraging metrics among colonies andamong individuals of the same colony. In the presentstudy, site did not seem to influence foraging metrics.However, within a single colony, birds exhibited alarge inter-individual variation in foraging behav-iour, with some birds conducting very short tripswithin 5 to 10 km of the colony while others travelledto areas 120 to 140 km away. The more pelagic indi-viduals performed up to half of their dives at nightduring short trips, while more benthic foragers divedpredominantly during the day and reached greaterdepths, regardless of colony. This is consistent withother studies reporting that this species has highbehavioural flexibility over its wide range (Wilson etal. 1991, Robinson & Hindell 1996, Miller et al. 2009,Kokubun et al. 2010). Such flexible foraging habitslikely provide a buffer against changes in prey avail-ability and distribution in a limited, coastal environ-ment (Lescroël & Bost 2005, Miller et al. 2009), asshown in other inshore foragers (Hoskins et al. 2008,Saraux et al. 2011, Camprasse et al. 2017).
In the present study, some of the individuals per-formed trips longer (up to 5.6 d) than previouslyreported during the crèche period in gentoos on Ker-guelen Island (on average 1.3 d in Estacade, Lescroëlet al. 2009). It is possible that some of these birdsabandoned breeding during the study, as continuedprovisioning status could not be determined uponrecapture for all birds. However, a third of birdsknown to still be provisioning chicks at the end of thestudy conducted such long trips. The large inter-individual variation in foraging behaviour observedin instrumented birds could be related to inter-indi-vidual variation in morphology (Bost & Jouventin1990, this study). Indeed, individuals with higherbody mass tended to travel farther, dive deeper andperform more benthic dives, contributing to the ob -served inter-individual differences in foraging. Dif-ferences in dive patterns, associated with larger oxy-gen stores in heavier birds, have been reported inother diving birds (Mori 1998, Cook et al. 2013).
We predicted that behavioural consistency wouldbe detected in instrumented individuals, as numer-ous populations considered generalists have actuallybe shown to be comprised of individual specialists
(Woo et al. 2008, Araújo et al. 2011, Loxdale et al.2011, Layman & Allgeier 2012, Fodrie et al. 2015). Inthe present study, at the population level, individualspecialisations in foraging metrics were low to mod-erate, with bearings to most distal locations and theproportion of pelagic diving exhibiting the highestrepeatability. This suggests that gentoos stay consis-tent in some aspects of their foraging behaviour,which may help to reduce intra-specific competitionand/or may allow individuals to catch prey they caneasily handle and digest (Bolnick et al. 2003, Estes etal. 2003). This seems particularly relevant in inshoreforagers, as they are restricted in their foraging range(Cook et al. 2006, Ratcliffe et al. 2013, Harris et al.2014).
However, a significant degree of be havioural con-sistency at the population level does not mean that allindividuals are consistent (Woo et al. 2008, Ceia et al.2012). Indeed, we observed a large variation in thedegree of individual consistency in spatial use anddive be haviour between instrumented individuals.While some birds exhibited similar foraging strate-gies over the course of multiple consecutive trips,others did not. For example, some individuals dis-played consistency in the proportion of pelagic div-ing from one trip to the next while others were able toswitch from being mostly benthic on one trip to beingentirely pelagic. This highlights the need to samplemultiple trips to obtain a more accurate description ofa bird’s foraging behaviour, particularly in inshoreforagers which may exhibit behavioural plasticity(Saraux et al. 2011, Carpenter-Kling et al. 2017). Thelarge inter- and intra-individual variation in foragingbehaviour discussed here might contribute to gen-toos having stable or expanding populations in partsof their range (e.g. Antarctic Peninsula), where sym-patrically breeding penguin species, more depend-ent on specific resources such as Antarctic krill,experience strong population de clines (Miller et al.2009, Polito et al. 2015).
Our third prediction was that individuals displayinghigher consistency in foraging behaviour would havereduced horizontal and vertical distances travelled,and higher body conditions as individual specialisa-tions are thought to improve foraging efficiency (Wa -tanuki 1992, Voslamber et al. 1995, Annett & Pierotti1999, Golet et al. 2000, Votier et al. 2004). Contrary tothis prediction, no difference in distance travelled(per hour) or body condition was found between con-sistent and non-consistent individuals in the presentstudy. Thus, it seems that instrumented individualsadopted different strategies based on intrinsic factors(i.e. morphology, prey preferences, etc.), ultimately
238

Camprasse et al.: Variation in gentoo penguin foraging ecology
re sulting in different repeatability indices. Indeed,the heavier, more benthic individuals performedmore distant and longer trips, and such trips were lessrepeatable within the timeframe of the study.
Generally, it is unclear whether specialists performbetter than generalists, as contradictory results havebeen reported in the literature (Golet et al. 2000,Votier et al. 2004, Ceia et al. 2012, Dehnhard et al.2016). Our findings are in agreement with results ona long-distance forager, the wandering albatrossDiomedea exulans, demonstrating that specialist andgeneralist individuals had similar levels of body con-dition (Ceia et al. 2012). No effect of specialisation onreproductive outcomes has been detected in otherbird species (Votier et al. 2004, Katzner et al. 2005,Dehnhard et al. 2016). Indeed, even though general-ists may deliver somewhat less energy per day, specialisation may not have an impact on measuresof evolutionary fitness (Woo et al. 2008). In contrast,other studies on gulls, cormorants, guillemots andskuas have shown specialists to have higher repro-ductive success, food delivery rates, chick conditionor adult survival (Watanuki 1992, Voslamber et al.1995, Annett & Pierotti 1999, Golet et al. 2000, Votieret al. 2004). In gentoos, individual specialisations inforaging behaviour may be linked with intrinsic fac-tors, and may be more or less advantageous depend-ing on prey availability, with generalists performingbetter when food availability is low.
Lastly, in agreement with our second prediction,long-term dietary consistency was detected in thebirds sampled. Stable isotope values in blood andfeathers in breeding gentoos were positively cor -related, indicating that dietary specialisations aremaintained outside of the breeding season. This isconsistent with recent stomach contents and stableisotope analysis studies on the diet of gentoos, indi-cating that they may not be as opportunistic as previ-ously thought (Clausen et al. 2005, Polito et al. 2015).Within generalist populations, 2 types can be found:type ‘A’ generalists, when individuals all take a widerange of food types; and type ‘B’ generalists, whenindividuals each specialise on a different range offood types (Bearhop et al. 2004). The results from ourstudy, documenting a large inter-individual variationin diet, matching the high inter-individual variationin foraging behaviour, and documenting the fact thatinstrumented birds tend to display a similar feedingecology in the breeding and inter-breeding seasons,seem to indicate that gentoos at the studied site aretype ‘B’ generalists.
The results of the present study should be inter-preted with caution for two main reasons: the large
difference in sample sizes between colonies wheredeployments were performed, and the potentiallypoor environmental conditions the instrumentedbirds experienced, seemingly leading to low preyavailability as judged by the low number of chicksraised by gentoos and sympatrically breedingshags (E. C. M. Camprasse pers. obs.). More data areneeded from Estacade to confirm the lack of a siteeffect on the gentoos’ foraging behaviour and feed-ing ecology. Factors including a high incidence ofnight diving and long trip durations could reflectpoor environmental conditions in the 2014/2015breeding season, forcing penguins to forage in sub-optimal conditions. This is consistent with poorbreeding success on Kerguelen Islands during de -ployments compared with normal years, with brood-ers losing chicks at the crèche stage (E. C. M. Cam-prasse pers. obs.). In the present study, shallownighttime dives were observed in the more pelagicindividuals, probably to allow them to take advan-tage of pelagic prey distributed near the surface atnight during their diurnal vertical migration. Night/twilight diving has been recorded in pygo scelid pen-guins including gentoos (Croxall et al. 1988, Williams& Rodwell 1992, Robinson & Hindell 1996) and otherpenguin species (Schiavini & Rey 2004, Rey et al.2012), but was thought to be un common in suchvisual predators (Williams 1995, Bost et al. 2002).Lastly, low prey availability, linked with the seem-ingly poor environmental conditions experienced bythe birds instrumented in the present study, couldincrease the degree of individual specialisation, asindividuals are forced to add diff erent alternativeprey not consumed by conspecifics to their diet(Svanbäck & Bolnick 2007, Tinker et al. 2008).
In summary, we showed that gentoo penguins onKerguelen Island exhibited large inter- and intra-individual variations in foraging behaviour. Thesemay provide gentoos greater resilience to bufferagainst changes in prey availability and fast chang-ing environmental conditions, especially as their foraging range is usually limited (Lescroël & Bost2005, Polito et al. 2015). However, within this context,gentoos still exhibit individual specialisation, helpingthem reduce intra-specific competition and/or in -creasing their foraging efficiency (dit Durell 2000,Masello et al. 2013). Dietary specialisations outside ofa single breeding season were also highlighted, sug-gesting that gentoo penguins are type ‘B’ generalists.The next step to understand the consequences of in -dividual specialisations would be to look at the linkbetween behavioural consistency and reproductiveoutput, which could not be done in this study due to
239
Mar Ecol Prog Ser 578: 227–242, 2017
logistical constraints. In order to fully understand theeffects of individual consistency of parents on theiroffspring, researchers should also aim at obtaininginformation on both partners of breeding pairs (Politoet al. 2015). In the future, repetitive sampling of thesame individuals across stages of the same breedingseason and across years will help to characterize thepersistence of dietary specialisations at differenttemporal scales in seabirds.
Acknowledgements. This study was approved by the ethicscommittee of the French Polar Institute (Program IPEV 394OIPLO, principal investigator C.-A.B.). All animals in thisstudy were handled in accordance with its guidelines. Thework was supported financially and logistically by theFrench Polar Institute and the Terres Australes et Antarc-tiques Françaises. We thank fieldwork volunteers, includingAyala Loisel, Elie Gaget, Florian Orgeret, Joris Laborie andMartin Delpuech. We also acknowledge the help of DavidPinaud, Matthew Symonds and Andrew Hoskins for assis-tance with statistical analyses. Lastly, we thank MaudBrault-Favrou and Gaël Guillou for their contribution tosample preparation and isotopic analysis, respectively.
LITERATURE CITED
Agostinelli C, Lund U (2011) R package circular: circular statistics (version 0.4-3). http: //CRAN.R-project.org/package=circular
Anderson O, Phillips R, Shore R, McGill R, McDonald R,Bearhop S (2009) Diet, individual specialisation and breeding of brown skuas (Catharacta antarctica lonn -bergi): an investigation using stable isotopes. Polar Biol32: 27−33
Annett CA, Pierotti R (1999) Long-term reproductive outputin western gulls: consequences of alternate tactics in dietchoice. Ecology 80: 288−297
Araújo MS, Bolnick DI, Layman CA (2011) The ecologicalcauses of individual specialisation. Ecol Lett 14: 948−958
Bates D, Maechler M, Bolker B, Walker S (2014) lme4: linearmixed-effects models using Eigen and S4. R packageversion 1.1-6.
Baylis AMM, Orben RA, Pistorius P, Brickle P, Staniland I,Ratcliffe N (2015) Winter foraging site fidelity of kingpenguins breeding at the Falkland Islands. Mar Biol 162: 99−110
Bearhop S, Adams CE, Waldron S, Fuller RA, MacLeod H(2004) Determining trophic niche width: a novel approachusing stable isotope analysis. J Anim Ecol 73: 1007−1012
Bearhop S, Phillips RA, McGill R, Cherel Y, Dawson DA,Croxall JP (2006) Stable isotopes indicate sex-specificand long-term individual foraging specialisation in div-ing seabirds. Mar Ecol Prog Ser 311: 157−164
Bolnick DI, Svanbäck R, Fordyce JA, Yang LH, Davis JM,Hulsey CD, Forister ML (2003) The ecology of individu-als: incidence and implications of individual specializa-tion. Am Nat 161: 1−28
Bost CA, Jouventin P (1990) Evolutionary ecology of Gentoopenguin Pygoscelis papua. In: Davis LS, Darby JT(eds) Penguin biology. Academic Press, New York, NY,p 85−112
Bost CA, Zorn T, Le Maho Y, Duhamel G (2002) Feedingof diving predators and diel vertical migration of prey: King penguins’ diet versus trawl sampling at KerguelenIslands. Mar Ecol Prog Ser 227: 51−61
Calenge C (2015) Analysis of animal movements in R: the adehabitatLT Package. http: //CRAN.R-project.org/package= adehabitatLT
Camprasse ECM, Cherel Y, Arnould JPY, Hoskins AJ, BostCA (2017) Combined bio-logging and stable isotopesreveal individual specialisations in a benthic coastal sea-bird, the Kerguelen shag. PLOS ONE 12: e0172278
Carpenter-Kling T, Handley JM, Green DB, Reisinger RR,Makhado AB, Crawford RJ, Pistorius PA (2017) A novelforaging strategy in gentoo penguins breeding at sub-Antarctic Marion Island. Mar Biol 164: 33
Ceia FR, Ramos JA (2015) Individual specialization in theforaging and feeding strategies of seabirds: a review.Mar Biol 162: 1923−1938
Ceia FR, Phillips RA, Ramos JA, Cherel Y, Vieira RP, RichardP, Xavier JC (2012) Short- and long-term consistency inthe foraging niche of wandering albatrosses. Mar Biol159: 1581−1591
Cherel Y, Hobson KA (2007) Geographical variation in carbon stable isotope signatures of marine predators: atool to investigate their foraging areas in the SouthernOcean. Mar Ecol Prog Ser 329: 281−287
Cherel Y, Hobson KA, Weimerskirch H (2000) Using stable-isotope analysis of feathers to distinguish moulting andbreeding origins of seabirds. Oecologia 122: 155−162
Cherel Y, Hobson KA, Bailleul F, Groscolas R (2005a) Nutri-tion, physiology, and stable isotopes: new informationfrom fasting and molting penguins. Ecology 86: 2881−2888
Cherel Y, Hobson KA, Hassani S (2005b) Isotopic discrimi-nation between food and blood and feathers of captivepenguins: implications for dietary studies in the wild.Physiol Biochem Zool 78: 106−115
Cherel Y, Le Corre M, Jaquemet S, Menard F, Richard P,Weimerskirch H (2008) Resource partitioning within atropical seabird community: new information from stableisotopes. Mar Ecol Prog Ser 366:281–291
Cherel Y, Fontaine C, Richard P, Labatc JP (2010) Isotopicniches and trophic levels of myctophid fishes and theirpredators in the Southern Ocean. Limnol Oceanogr 55: 324−332
Clausen AP, Arkhipkin AI, Laptikhovsky VV, Huin N (2005)What is out there: diversity in feeding of gentoo penguins(Pygoscelis papua) around the Falkland Islands (South-west Atlantic). Polar Biol 28: 653−662
Cook TR, Cherel Y, Tremblay Y (2006) Foraging tactics ofchick-rearing Crozet shags: individuals display repeti-tive activity and diving patterns over time. Polar Biol 29: 562−569
Cook TR, Lescroël A, Cherel Y, Kato A, Bost CA (2013) Canforaging ecology drive the evolution of body size in a diving endotherm? PLOS ONE 8: e56297
Croxall J, Davis L (1999) Penguins: paradoxes and patterns.Mar Ornithol 27: 1−12
Croxall J, Davis R, O’Connell M (1988) Diving patterns inrelation to diet of Gentoo and Macaroni penguins atSouth Georgia. Condor 90: 157−167
Cucherousset J, Acou A, Blanchet S, Britton JR, BeaumontWR, Gozlan RE (2011) Fitness consequences of indi -vidual specialisation in resource use and trophic mor-phology in European eels. Oecologia 167: 75−84
Cuervo JJ, Palacios MJ, Barbosa A (2009) Beak colouration
240

Camprasse et al.: Variation in gentoo penguin foraging ecology
as a possible sexual ornament in gentoo penguins: sexualdichromatism and relationship to body condition. PolarBiol 32: 1305−1314
Dehnhard N, Eens M, Sturaro N, Lepoint G, Demongin L,Quillfeldt P, Poisbleau M (2016) Is individual consistencyin body mass and reproductive decisions linked to indi-vidual specialization in foraging behavior in a long-livedseabird? Ecol Evol 6: 4488−4501
Dingemanse NJ, Dochtermann NA (2013) Quantifying indi-vidual variation in behaviour: mixed-effect modellingapproaches. J Anim Ecol 82: 39−54
dit Durell SE (2000) Individual feeding specialisation inshorebirds: population consequences and conservationimplications. Biol Rev Camb Philos Soc 75: 503−518
dit Durell SE, Goss-Custard JD, Caldow RW, Malcolm HM,Osborn D (2001) Sex, diet and feeding method-relateddifferences in body condition in the oystercatcherHaematopus ostralegus. Ibis 143: 107−119
Estes J, Riedman M, Staedler M, Tinker M, Lyon B (2003)Individual variation in prey selection by sea otters: pat-terns, causes and implications. J Anim Ecol 72: 144−155
Fodrie FJ, Yeager LA, Grabowski JH, Layman CA, Sher-wood GD, Kenworthy MD (2015) Measuring indi -viduality in habitat use across complex landscapes: approaches, constraints, and implications for assessingresource specialization. Oecologia 178: 75−87
Golet GH, Kuletz KJ, Roby DD, Irons DB (2000) Adult preychoice affects chick growth and reproductive success inpigeon guillemots. Auk 117: 82−91
Grolemund G, Wickham H (2011) Dates and times madeeasy with lubridate. J Stat Softw 40: 1−25
Harris S, Rey AR, Zavalaga C, Quintana F (2014) Strongtemporal consistency in the individual foraging behav-iour of imperial shags Phalacrocorax atriceps. Ibis 156: 523−533
Hindell M (1989) The diet of gentoo penguins Pygoscelispapua at Macquarie Island: winter and early breedingseason. Emu 89: 71−78
Hoskins AJ, Dann P, Ropert-Coudert Y, Kato A, Chiaradia A,Costa DP, Arnould JP (2008) Foraging behaviour andhabitat selection of the little penguin Eudyptula minorduring early chick rearing in Bass Strait, Australia. MarEcol Prog Ser 366: 293−303
Jaeger A, Connan M, Richard P, Cherel Y (2010) Use of stable isotopes to quantify seasonal changes of trophicniche and levels of population and individual specialisa-tion in seabirds. Mar Ecol Prog Ser 401: 269−277
Katzner TE, Bragin EA, Knick ST, Smith AT (2005) Relation-ship between demographics and diet specificity of Imperial Eagles Aquila heliaca in Kazakhstan. Ibis 147:576–586
Kernaléguen L, Arnould JPY, Guinet C, Cherel Y (2015)Determinants of individual foraging specialization inlarge marine vertebrates, the Antarctic and Subantarcticfur seals. J Anim Ecol 84: 1081−1091
Kernaléguen L, Dorville N, Ierodiaconou D, Hoskins AJ andothers (2016) From video recordings to whisker stableisotopes: a critical evaluation of timescale in assessingindividual foraging specialisation in Australian fur seals.Oecologia 180: 657−670
Kokubun N, Takahashi A, Mori Y, Watanabe S, Shin HC(2010) Comparison of diving behavior and foraging habi-tat use between chinstrap and gentoo penguins breedingin the South Shetland Islands, Antarctica. Mar Biol 157: 811−825
Layman CA, Allgeier JE (2012) Characterizing trophic ecol-ogy of generalist consumers: a case study of the invasivelionfish in The Bahamas. Mar Ecol Prog Ser 448: 131−141
Lê S, Josse J, Husson F (2008) FactoMineR: an R package formultivariate analysis. J Stat Softw 25: 1−18
Lescroël A, Bost CA (2005) Foraging under contrastingoceanographic conditions: the gentoo penguin at Ker-guelen Archipelago. Mar Ecol Prog Ser 302: 245−261
Lescroël A, Ridoux V, Bost CA (2004) Spatial and temporalvariation in the diet of the gentoo penguin (Pygoscelispapua) at Kerguelen Islands. Polar Biol 27: 206−216
Lescroël A, Bajzak C, Bost CA (2009) Breeding ecology ofthe gentoo penguin Pygoscelis papua at KerguelenArchipelago. Polar Biol 32: 1495−1505
Loxdale HD, Lushai G, Harvey JA (2011) The evolutionaryimprobability of ‘generalism’ in nature, with special reference to insects. Biol J Linn Soc 103: 1−18
Luque SP (2007) Diving behaviour analysis in R. R News 7: 8−14
Lynch H (2013) Gentoo penguin (Pygoscelis papua). In: Bor-boroglu GP, Boersma PD (eds) Penguins: natural historyand conservation. University of Washington Press, Wash-ington, DC, p 73–90
Masello JF, Wikelski M, Voigt CC, Quillfeldt P (2013) Distri-bution patterns predict individual specialization in thediet of dolphin gulls. PLOS ONE 8: e67714
Matich P, Heithaus MR, Layman CA (2011) Contrasting pat-terns of individual specialization and trophic coupling intwo marine apex predators. J Anim Ecol 80: 294−305
Miller AK, Karnovsky NJ, Trivelpiece WZ (2009) Flexibleforaging strategies of gentoo penguins Pygoscelis papuaover 5 years in the South Shetland Islands, Antarctica.Mar Biol 156: 2527−2537
Mori Y (1998) Optimal choice of foraging depth in divers.J Zool (Lond) 245: 279−283
Paradis E, Claude J, Strimmer K (2004) APE: analyses ofphylogenetics and evolution in R language. Bioinfor -matics 20: 289−290
Pebesma E, Bivand R (2005) Classes and methods for spatialdata in R. R News 5: 9−13
Polito MJ, Abel S, Tobias CR, Emslie SD (2011) Dietary iso-topic discrimination in gentoo penguin (Pygoscelis papua)feathers. Polar Biol 34: 1057−1063
Polito MJ, Trivelpiece WZ, Patterson WP, Karnovsky NJ,Reiss CS, Emslie SD (2015) Contrasting specialist andgeneralist patterns facilitate foraging niche partitioningin sympatric populations of Pygoscelis penguins. MarEcol Prog Ser 519: 221−237
R Core Team (2015) R: a language and environment for statistical computing. R Foundation for Statistical Com-puting, Vienna
Ratcliffe N, Takahashi A, O’Sullivan C, Adlard S, TrathanPN, Harris MP, Wanless S (2013) The roles of sex, massand individual specialisation in partitioning foraging-depth niches of a pursuit-diving predator. PLOS ONE 8: e79107
Rey AR, Pütz K, Scioscia G, Lüthi B, Schiavini A (2012) Sex-ual differences in the foraging behaviour of Magellanicpenguins related to stage of breeding. Emu 112: 90−96
Robinson SA, Hindell MA (1996) Foraging ecology of gentoopenguins Pygoscelis papua at Macquarie Island duringthe period of chick care. Ibis 138: 722−731
Saraux C, Robinson-Laverick SM, Le Maho Y, Ropert-Coud-ert Y, Chiaradia A (2011) Plasticity in foraging strategiesof inshore birds: how little penguins maintain body
241

Mar Ecol Prog Ser 578: 227–242, 2017
reserves while feeding offspring. Ecology 92: 1909−1916Schiavini A, Rey AR (2004) Long days, long trips: foraging
ecology of female rockhopper penguins Eudyptes chryso -come chrysocome at Tierra del Fuego. Mar Ecol Prog Ser275: 251−262
Stephens DW, Krebs JR (1986) Foraging theory. PrincetonUniversity Press, Princeton, NJ
Sumner MD (2009) trip: tools for the analysis of animal trackdata (R package version 1.1-17). http: //CRAN.R-project.org/package=trip
Svanbäck R, Bolnick DI (2007) Intraspecific competitiondrives increased resource use diversity within a naturalpopulation. Proc R Soc Lond B Biol Sci 274: 839−844
Svanbäck R, Persson L (2009) Population density fluctua-tions change the selection gradient in Eurasian perch.Am Nat 173: 507−516
Tinker MT, Bentall G, Estes JA (2008) Food limitation leadsto behavioral diversification and dietary specialization insea otters. Proc Natl Acad Sci USA 105: 560−565
Voslamber B, Platteeuw M, Van Eerden M (1995) Solitaryforaging in sand pits by breeding cormorants Phalacro-corax carbo sinensis: Does specialised knowledge aboutfishing sites and fish behaviour pay off? Ardea 83: 199−212
Votier SC, Bearhop S, Ratcliffe N, Furness RW (2004) Repro-ductive consequences for great skuas specializing as
seabird predators. Condor 106: 275−287Watanuki Y (1992) Individual diet difference, parental care
and reproductive success in slaty-backed gulls. Condor94: 159−171
Williams TD (1995) The penguins; Spheniscidae. OxfordUniversity Press, Oxford
Williams T, Rodwell S (1992) Annual variation in return rate,mate and nest-site fidelity in breeding gentoo and Maca-roni penguins. Condor 94: 636−645
Wilson RP, Grant WS, Duffy DC (1986) Recording devices onfree-ranging marine animals: Does measurement affectforaging performance? Ecology 67: 1091−1093
Wilson RP, Culik B, Spairani HJ, Coria NR, Adelung D(1991) Depth utilization by penguins and gentoo penguindive patterns. J Ornithol 132: 47−60
Woehler E (1995) Consumption of Southern Ocean marineresources by penguins. In: Dann P, Norman I, Reilly P(eds) The penguins: ecology and management. SurreyBeatty & Sons, Chipping Norton, p 266−294
Woo KJ, Elliott KH, Davidson M, Gaston AJ, Davoren GK(2008) Individual specialization in diet by a generalistmarine predator reflects specialization in foraging be -haviour. J Anim Ecol 77: 1082−1091
Zuur A, Ieno E, Walker N, Saveliev A, Smith G (2009) Mixedeffects models and extensions in ecology with R.Springer Science and Business Media, New York, NY
242
Editorial responsibility: Sue Lewis (Guest Editor), Penicuik, UK
Submitted: November 28, 2016; Accepted: April 10, 2017Proofs received from author(s): June 12, 2017