Interval timers and coupled oscillators both mediate the effect of temporally structured cueing
9
Interval timers and coupled oscillators both mediate the effect of temporally structured cueing Tim Martin, a, ⁎ Jon M. Houck, b Dubravko Kičić, c and Claudia D. Tesche b a Department of Ophthalmology and Center for Visual Science, University of Rochester, Rochester, NY, USA b Department of Psychology, University of New Mexico, Albuquerque, NM, USA c BioMag Laboratory, Engineering Center, Helsinki University Central Hospital, Helsinki, Finland Received 29 June 2007; revised 18 November 2007; accepted 18 January 2008 Available online 31 January 2008 When observers are presented with targets in the context of temporal structure, performance is modulated by that structure. Interval timing mechanisms and coupled oscillators are two popular classes of model that attempt to explain how temporal structure modulates attention and motor performance to bring about the behavioral costs and benefits of temporal structure. In this experiment, participants made speeded choice reactions to targets following a series of visual warning stimuli. The warning stimuli afforded prediction of target onset time. Brain activity related to temporally focused attention and motor preparation was measured using magnetoencephalography. Parietal, cerebellar, and somatomotor activity was found to be associated with response latency and the performance benefit of the cued relative to uncued targets. Parietal activity was consistent with an interval timing mechanism, while somatomotor activity was more consistent with a coupled oscillator mechanism. Cerebellar activity had features consistent with both mechanisms. To our knowledge, this is the first evidence that both processes occur simultaneously. © 2008 Elsevier Inc. All rights reserved. Precise spatiotemporal performance is required by many com- mon tasks, including most sports, listening to or playing music, and dancing. Appropriate behaviors must be executed at the right time and place. Two classes of theories for the temporal component of performance on such tasks are stochastic clock theories (Gibbon, 1977) and coupled oscillator theories (Haken et al., 1985; Large and Jones, 1999). In the experiment reported below, observers were presented with an isochronous countdown to a target that required a speeded choice response. Brain activity was measured with magnet- oencephalography (MEG). Sources were observed in occipital cortex, medial posterior parietal cortex (MPC), medial cerebellum, and somatomotor cortex. Slow-wave activity consistent with sto- chastic clock process was observed in parietal cortex and cerebel- lum. Cerebellar and somatomotor activity at the stimulus frequency predicted the behavioral benefit conferred by the countdown, con- sistent with a coupled oscillator mechanism. One prominent stochastic clock model is the Scalar Expectancy Theory (SET; Gibbon, 1977; Gibbon and Church, 1990). Accord- ing to SET, an internal pulse generator is connected to an accu- mulator by a gate. When a stimulus signals the beginning of a to- be-timed interval, the gate closes, allowing pulses from the gene- rator to pass to the accumulator. The stimulus signaling the end of the interval causes the gate to open, and the accumulation of pulses stops. The result in the accumulator can be passed on to long-term memory (LTM), where it becomes part of the LTM representation of previously encoded intervals. The accumulator result can also be passed on to a comparator, which also receives a signal from the LTM representation of the interval. These two representations, the current accumulator count and the LTM representation, can then be compared for the purpose of directing behavior and making deci- sions. Although there are many other stochastic timing models, the basic mechanisms of SET are typical. In contrast to stochastic clock theories of interval timing, cou- pled oscillator theories propose that temporal patterns are encoded in the period and phase of oscillatory activity. According to this type of account, oscillatory activity should entrain to the frequency of a rhythmic stimulus train. A good example of a well-specified coupled oscillator model is that of Large and Jones (1999) based on Dynamic Attending Theory (DAT; Jones, 1976; Jones and Boltz, 1989), a theory of how attention changes through time as a func- tion of the temporal structure of stimulation. DAT proposes that endogenous oscillations termed attending rhythms are perceptually coupled to the environment. This coupling allows the environment to exert an influence on attending rhythms. When the environ- ment exhibits temporal (i.e., autocorrelational) structure, attending rhythms become entrained to that structure through period and phase correction and cause the allocation of attention to points in time defined by the phase relationship between the endogenous and exogenous (i.e., environmental) rhythms. Attention is modeled in www.elsevier.com/locate/ynimg NeuroImage 40 (2008) 1798 – 1806 ⁎ Corresponding author. E-mail address: [email protected] (T. Martin). Available online on ScienceDirect (www.sciencedirect.com). 1053-8119/$ - see front matter © 2008 Elsevier Inc. All rights reserved. doi:10.1016/j.neuroimage.2008.01.024
-
Upload
tim-martin -
Category
Documents
-
view
213 -
download
1
Transcript of Interval timers and coupled oscillators both mediate the effect of temporally structured cueing
www.elsevier.com/locate/ynimg
NeuroImage 40 (2008) 1798–1806Interval timers and coupled oscillators both mediate the effect oftemporally structured cueing
Tim Martin,a,⁎ Jon M. Houck,b Dubravko Kičić,c and Claudia D. Tescheb
aDepartment of Ophthalmology and Center for Visual Science, University of Rochester, Rochester, NY, USAbDepartment of Psychology, University of New Mexico, Albuquerque, NM, USAcBioMag Laboratory, Engineering Center, Helsinki University Central Hospital, Helsinki, Finland
Received 29 June 2007; revised 18 November 2007; accepted 18 January 2008Available online 31 January 2008
When observers are presented with targets in the context of temporalstructure, performance is modulated by that structure. Interval timingmechanisms and coupled oscillators are two popular classes of modelthat attempt to explain how temporal structure modulates attention andmotor performance to bring about the behavioral costs and benefits oftemporal structure. In this experiment, participants made speededchoice reactions to targets following a series of visual warning stimuli.The warning stimuli afforded prediction of target onset time. Brainactivity related to temporally focused attention and motor preparationwas measured usingmagnetoencephalography. Parietal, cerebellar, andsomatomotor activity was found to be associated with response latencyand the performance benefit of the cued relative to uncued targets.Parietal activitywas consistent with an interval timingmechanism,whilesomatomotor activity was more consistent with a coupled oscillatormechanism. Cerebellar activity had features consistent with bothmechanisms. To our knowledge, this is the first evidence that bothprocesses occur simultaneously.© 2008 Elsevier Inc. All rights reserved.
Precise spatiotemporal performance is required by many com-mon tasks, including most sports, listening to or playing music, anddancing. Appropriate behaviors must be executed at the right timeand place. Two classes of theories for the temporal component ofperformance on such tasks are stochastic clock theories (Gibbon,1977) and coupled oscillator theories (Haken et al., 1985; Largeand Jones, 1999). In the experiment reported below, observers werepresented with an isochronous countdown to a target that required aspeeded choice response. Brain activity was measured with magnet-oencephalography (MEG). Sources were observed in occipitalcortex, medial posterior parietal cortex (MPC), medial cerebellum,and somatomotor cortex. Slow-wave activity consistent with sto-
⁎ Corresponding author.E-mail address: [email protected] (T. Martin).Available online on ScienceDirect (www.sciencedirect.com).
1053-8119/$ - see front matter © 2008 Elsevier Inc. All rights reserved.doi:10.1016/j.neuroimage.2008.01.024
chastic clock process was observed in parietal cortex and cerebel-lum. Cerebellar and somatomotor activity at the stimulus frequencypredicted the behavioral benefit conferred by the countdown, con-sistent with a coupled oscillator mechanism.
One prominent stochastic clock model is the Scalar ExpectancyTheory (SET; Gibbon, 1977; Gibbon and Church, 1990). Accord-ing to SET, an internal pulse generator is connected to an accu-mulator by a gate. When a stimulus signals the beginning of a to-be-timed interval, the gate closes, allowing pulses from the gene-rator to pass to the accumulator. The stimulus signaling the end ofthe interval causes the gate to open, and the accumulation of pulsesstops. The result in the accumulator can be passed on to long-termmemory (LTM), where it becomes part of the LTM representationof previously encoded intervals. The accumulator result can also bepassed on to a comparator, which also receives a signal from theLTM representation of the interval. These two representations, thecurrent accumulator count and the LTM representation, can then becompared for the purpose of directing behavior and making deci-sions. Although there are many other stochastic timing models, thebasic mechanisms of SET are typical.
In contrast to stochastic clock theories of interval timing, cou-pled oscillator theories propose that temporal patterns are encodedin the period and phase of oscillatory activity. According to thistype of account, oscillatory activity should entrain to the frequencyof a rhythmic stimulus train. A good example of a well-specifiedcoupled oscillator model is that of Large and Jones (1999) based onDynamic Attending Theory (DAT; Jones, 1976; Jones and Boltz,1989), a theory of how attention changes through time as a func-tion of the temporal structure of stimulation. DAT proposes thatendogenous oscillations termed attending rhythms are perceptuallycoupled to the environment. This coupling allows the environmentto exert an influence on attending rhythms. When the environ-ment exhibits temporal (i.e., autocorrelational) structure, attendingrhythms become entrained to that structure through period andphase correction and cause the allocation of attention to points intime defined by the phase relationship between the endogenous andexogenous (i.e., environmental) rhythms. Attention is modeled in

1799T. Martin et al. / NeuroImage 40 (2008) 1798–1806
this theory as a pulse of “energy”, with a variable rise time, peakamplitude and decay time that together define its focus.
Behavioral tests of DAT have focused primarily on measuresof temporal information processing (Jones and Boltz, 1989; Jones andYee, 1997; Large and Jones, 1999; Klein and Jones, 1996), invitingcomparisons with interval timing theories (Grondin, 2001). Martinand colleagues (2005) used chronometric measures of attention todemonstrate that interval timing theories could not account forreaction time (RT)modulations as well as DATcould. However, whena formalmodel of DAT (Large and Jones, 1999) and an interval timingmodelwere directly compared on single-trial data in 8 participants, thepredictions of both models were independently related to RT for twoparticipants, indicating that both interval timing and entrainment mayoccur simultaneously, at least in some individuals.
Stochastic clock theories and DAT are both proposed in thepsychological domain. There are no unique biological adaptationsof these theories. However, additional assertions relating the pro-posed psychological processes to observable biological processescan be tested. To do so, we used a variant of the warning stimulus(WS) paradigm (Klemmer, 1956) in the visual modality. On eachtarget trial, a target requiring a speeded choice reaction was pre-sented. This target was preceded by 0, 2, or 3 WSs, correspondingto 0, 1, or 2 equally spaced intervals. We term these conditions theuncued, 2-WS and 3-WS conditions, respectively. The WSs actedas a countdown to the target. In addition, catch trials were pre-sented in which observers saw three WSs but no target.
Temporal patterns within the stochastic clock framework areencoded as accumulated pulses of activity. An incrementing levelof activity in a population of neurons after presentation of a WSwould be evidence for a possible neural instantiation of this type ofcode. The contingent negative variation (CNV; Walter et al., 1964)and its magnetic counterpart, the contingent magnetic variation(CMV; Elbert et al., 1994), are examples of electrophysiologicalmarkers of interval timing. The CNV is a gradual increase in scalppotential negativity in the foreperiod between a cue and target.Components of the CNV have been found to correlate with timeperception and timing performance in several experimental para-digms (Macar and Vidal, 2003; Macar and Vitton, 1982; Ruchkinet al., 1977). For example, the peak of the CNV has been found tocorrespond to the standard interval in a temporal magnitude com-parison task (Macar and Vidal, 2003).
Fig. 1. Illustrations of theoretical predictions. (A) Schematic illustration of theoreticlimbing activity increments with each pulse of the clock. Units are arbitrary. (Binterval between a warning stimulus and target. (C) A sine wave undergoing phase cto those used in the 3-WS condition. The corresponding phases are in parentheses
The CNV, as recorded with scalp electroencephalographic ar-rays, is typically quantified by the amplitude difference betweenconditions over some epoch (Miniussi et al., 1999), peak amplitudeor peak latency within some time window (Macar and Vidal, 2003),or mean waveform amplitudes in early and late epochs of the timedinterval (Gibbons and Rammsayer, 2004). These measures may notbe optimal in the context of stochastic clock theories of timing sincethe expectation is that accumulator activity will increase in ampli-tude over time rather than be sustained at a constant value. Analternative characterization of slow-wave activity that has provenuseful in timing studies is the linear slope of thewaveform over someepoch (Dale et al., 2001; Pfeuty et al., 2003; Reutimann et al., 2004).In the present study, we regressed waveforms on time in the intervalimmediately preceding the onset of the target and used the standard-ized slope to characterize the rate of change in slow-wave activity(see Fig. 1, panels A and B).
For DAT, the endogenous rhythm and the process by which itbecomes entrained are unobservable behaviorally, but it may bepossible to observe the dynamics predicted by the theory if arelationship between the psychological mechanism and brain acti-vity is specified. There are many possible relationships betweenbrain activity and the coupled oscillator mechanism of DAT. Sny-der and Large (2005), for example, observed that induced, but notevoked, gamma-band activity was associated with the onset oftones and persisted when tones were omitted. They interpreted thisas evidence for the dynamic allocation of attention. However, with-out a more specific relationship between gamma-band activity andoscillations near the stimulus frequency (around 3 Hz in the Snyder& Large paradigm) that are asserted by DAT, it is not clear what therelationship is between the psychological oscillations and the ob-served brain activity. For example, the attending rhythm of DATmight correspond to fluctuations in gamma-band power, coherencebetween sources in the gamma-band, complexity of gamma-bandactivity, or some other metric of gamma-band activity.
The present study examines a different hypothesis relating brainactivity to an endogenous oscillatory process. Specifically, we equatethe attending rhythms to literal oscillations of population averageaction potential firing rates (and perhaps degree of synchrony) nearthe stimulus frequency. The firing rates of individual cells wouldlikely be much faster than the stimulus frequency, but the populationaverage itself may fluctuate at slower rates over which observers can
cal activity of the clock/counter mechanism of a stochastic clock model. The) Schematic illustration of a contingent negative variation occurring in theorrection. E1=Epoch 1, E2=Epoch 2, E3=Epoch 3. The epochs correspondafter the epoch label. The corresponding unperturbed phase would be −90°.

1800 T. Martin et al. / NeuroImage 40 (2008) 1798–1806
entrain (i.e., 0.5–4 Hz). At the systems level observable with MEG,these periodic fluctuations in firing rate would be observable asfluctuations in the dendritic currents of the neuronal populationsefferent to the entraining populations. From the proposition of phasecorrection, it follows that the phase at the input frequency shouldchange systematically with eachWS (see Fig. 1, panel C). The effectsof this change would likely be averaged out of evoked responseaverages because with random ITI, the phase relative to the firststimulus is random on each trial. However, from the proposition thatphase correction is functional, it follows that the phase of activity atthe stimulus frequency should correlate with the behavioral benefitconferred by the countdown.
The predictions from stochastic clock and coupled oscillatormodels are not specific to any brain region and may not be the resultof processing in a particular region; rather, they may be emergentfrom the interaction between spatially separate neuronal popula-tions. Nevertheless, candidate locations may be suggested based onthe timing and attention literature. Parietal lobe, cerebellum, andsomatomotor cortex are three such locations. Within each of thesebroad regions, the exact locations of activity differ widely betweenstudies, depending upon the nature of the task and the measurement(i.e., imaging modality, lesion location, species).
The parietal lobe has been implicated repeatedly in the attention(Posner et al., 1982; Hopfinger et al., 2000), timing (Harringtonet al., 1998; Leon and Shadlen, 2003), the temporal allocation ofattention (Coull and Nobre, 1998), and the CNV (Gomez et al.,2004; Nagai et al., 2004). The cerebellum is also a likely candidate,as it has been implicated in timing (Ivry and Keele, 1989; Mangelset al., 1998), attention (Allen et al., 1997; Courchesne and Allen,1997), anticipation (Tesche and Karhu, 2000), and CNV (Nagaiet al., 2004). According to one popular model of cerebellar function(Ito, 1984), the cerebellumTs role is to predict the consequences ofaction then compare feedback about an actionTs consequences tothe prediction and generate corrective signals to modulate ongoingmotor activity. Therefore, one role of cerebellum in temporally al-located attention may be to correct the activity of other cortical areasbased on discrepancies between a predicted and observed interval oftime.
A somatomotor source would also be expected since a responseis required on each trial. Because the response is the result of achoice that is unknown until target onset, it cannot be differentiallyprepared prior to target onset, so modulation of this source mightreflect non-specific response preparation. Another possible causeof motor cortex modulation is visual stimulation (Nikulin et al.,2003).
These considerations lead to the following hypotheses:
Hypothesis 1. Slow-wave coding. If duration is coded by theslope of slow-wave activity, the slope will predict the degree ofbehavioral benefit that participants derive from a countdown. Thishypothesis assumes that participants use an interval timing code todirect their attention in time. This hypothesis is illustrated in Fig.1, panels A and B.
Hypothesis 2. Phase correction. If a coupled oscillation of actionpotential rate mediates the benefit of a countdown on choicereactions through the mechanism of phase correction, the phaseof activity at the stimulus frequency will correlate with thebenefit of a countdown, particularly the phase at the time oftarget onset.
Materials and methods
Participants
Three females and six males participated. Three participantswere authors of this paper, while the remaining participants werevolunteers from the participant pool at the BioMag laboratory,Helsinki University Central Hospital, Helsinki, Finland. The meanage was 29.3 years (range 23–41 years). Two were left-handed. Allreported normal or corrected-to-normal visual acuity.
Procedure
All procedures were carried out in accordance with the Decla-ration of Helsinki and were approved by the Institutional ReviewBoards of the University of New Mexico and Helsinki UniversityCentral Hospital.
MEG measurements were carried out in a magnetically shield-ed room (ETS-Lindgren Euroshield Oy, Eura, Finland) usinga 306-channel whole-head magnetometer (Elekta Neuromag Oy,Finland). Data were sampled at 600 Hz with a pass-band filter of0.3–200Hz. Head position was determined using a Polhemus deviceto record the position of coils affixed to each participantTs head andreferenced to nasion and periauricular points for coregistration withparticipantsT structural MR images.
Participants were informed that on each trial except catch trials,they would see 0, 2, or 3 WSs followed by either a red or a greencircle. They were to press the right button if the circle was red, theleft if it was green. Both speed and accuracy were emphasized.Participants were allowed to respond with the hand of their choice.One of the left-handed participants responded with the left hand.As described below, data were combined at the level of sourcewaveform estimates, not sensors, so that this participantTs somato-motor source activity from the right hemisphere was combinedwith responses from other participantsT left somatomotor cortex.
Stimuli were white, red, or green circles presented centrally andsubtended approximately 1° of visual angle. The inter-trial intervalvaried randomly (uniform distribution) from 2 to 3 s in 100-ms steps.The inter-onset interval was always 500 ms, corresponding to astimulus frequency of 2 Hz. Fifty catch trials and 100 uncued, 2-WSand 3-WS trials were presented to each participant in random order.
Data analysis
RTs were analyzed using a multivariate approach repeated-measures ANOVA. The benefit of the countdown was defined asthe difference between the uncued RT and RT after a countdown,and was calculated for the 2-WS and 3-WS conditions, and thedifference between 2 and 3 WS in conferring a benefit was testedwith a paired-samples t-test.
The raw MEG data were visually inspected for bad channelsand epochs with large artifacts. Stimulus-locked averages for eachcondition were computed off-line, using an epoch from 100 msbefore the first stimulus onset to 800 ms after the last stimulusonset. Error trials and epochs in the raw data with large artifactswere excluded from the averaging. Averages were normalized bysubtracting the mean of a baseline epoch beginning 100 ms prior tothe first stimulus and ending with stimulus onset, and low-passfiltered at 45 Hz, width 5 Hz. Ambient noise, blink, and heartsignals were removed using signal–space projection (Uusitalo andIlmoniemi, 1997). The averages were visually inspected for any
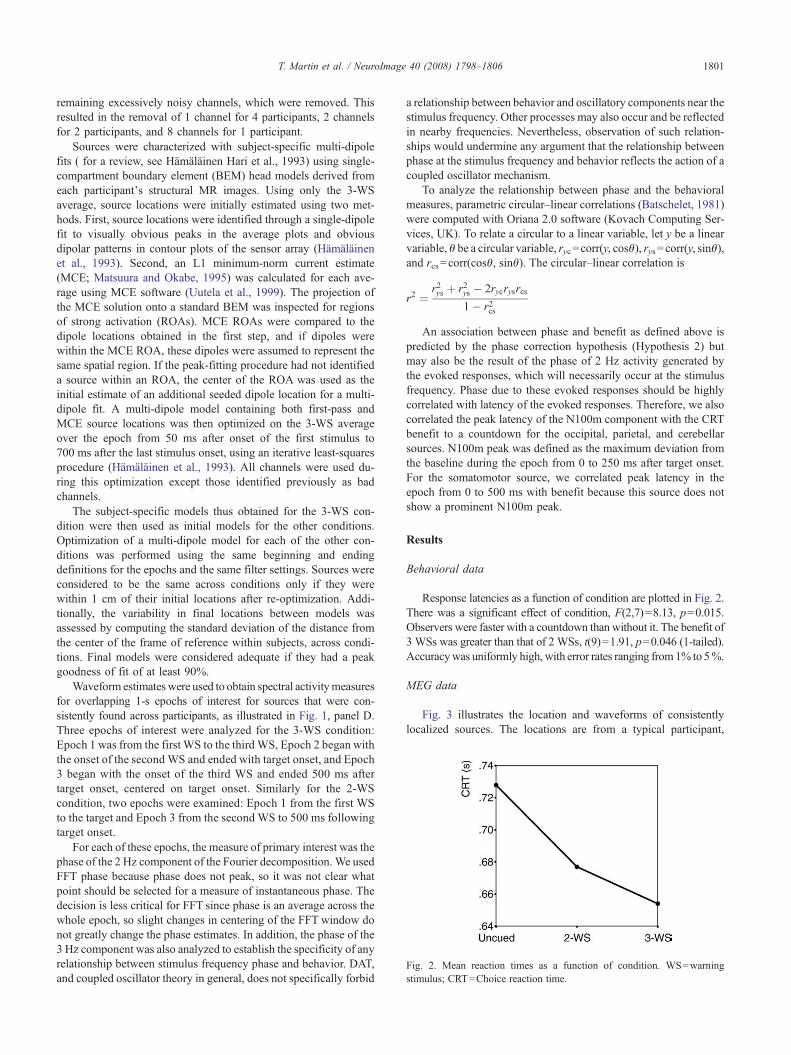
Fig. 2. Mean reaction times as a function of condition. WS=warningstimulus; CRT=Choice reaction time.
1801T. Martin et al. / NeuroImage 40 (2008) 1798–1806
remaining excessively noisy channels, which were removed. Thisresulted in the removal of 1 channel for 4 participants, 2 channelsfor 2 participants, and 8 channels for 1 participant.
Sources were characterized with subject-specific multi-dipolefits ( for a review, see Hämäläinen Hari et al., 1993) using single-compartment boundary element (BEM) head models derived fromeach participantTs structural MR images. Using only the 3-WSaverage, source locations were initially estimated using two met-hods. First, source locations were identified through a single-dipolefit to visually obvious peaks in the average plots and obviousdipolar patterns in contour plots of the sensor array (Hämäläinenet al., 1993). Second, an L1 minimum-norm current estimate(MCE; Matsuura and Okabe, 1995) was calculated for each ave-rage using MCE software (Uutela et al., 1999). The projection ofthe MCE solution onto a standard BEM was inspected for regionsof strong activation (ROAs). MCE ROAs were compared to thedipole locations obtained in the first step, and if dipoles werewithin the MCE ROA, these dipoles were assumed to represent thesame spatial region. If the peak-fitting procedure had not identifieda source within an ROA, the center of the ROA was used as theinitial estimate of an additional seeded dipole location for a multi-dipole fit. A multi-dipole model containing both first-pass andMCE source locations was then optimized on the 3-WS averageover the epoch from 50 ms after onset of the first stimulus to700 ms after the last stimulus onset, using an iterative least-squaresprocedure (Hämäläinen et al., 1993). All channels were used du-ring this optimization except those identified previously as badchannels.
The subject-specific models thus obtained for the 3-WS con-dition were then used as initial models for the other conditions.Optimization of a multi-dipole model for each of the other con-ditions was performed using the same beginning and endingdefinitions for the epochs and the same filter settings. Sources wereconsidered to be the same across conditions only if they werewithin 1 cm of their initial locations after re-optimization. Addi-tionally, the variability in final locations between models wasassessed by computing the standard deviation of the distance fromthe center of the frame of reference within subjects, across condi-tions. Final models were considered adequate if they had a peakgoodness of fit of at least 90%.
Waveform estimateswere used to obtain spectral activitymeasuresfor overlapping 1-s epochs of interest for sources that were con-sistently found across participants, as illustrated in Fig. 1, panel D.Three epochs of interest were analyzed for the 3-WS condition:Epoch 1 was from the first WS to the third WS, Epoch 2 began withthe onset of the second WS and ended with target onset, and Epoch3 began with the onset of the third WS and ended 500 ms aftertarget onset, centered on target onset. Similarly for the 2-WScondition, two epochs were examined: Epoch 1 from the first WSto the target and Epoch 3 from the second WS to 500 ms followingtarget onset.
For each of these epochs, the measure of primary interest was thephase of the 2 Hz component of the Fourier decomposition. We usedFFT phase because phase does not peak, so it was not clear whatpoint should be selected for a measure of instantaneous phase. Thedecision is less critical for FFT since phase is an average across thewhole epoch, so slight changes in centering of the FFT window donot greatly change the phase estimates. In addition, the phase of the3 Hz component was also analyzed to establish the specificity of anyrelationship between stimulus frequency phase and behavior. DAT,and coupled oscillator theory in general, does not specifically forbid
a relationship between behavior and oscillatory components near thestimulus frequency. Other processes may also occur and be reflectedin nearby frequencies. Nevertheless, observation of such relation-ships would undermine any argument that the relationship betweenphase at the stimulus frequency and behavior reflects the action of acoupled oscillator mechanism.
To analyze the relationship between phase and the behavioralmeasures, parametric circular–linear correlations (Batschelet, 1981)were computed with Oriana 2.0 software (Kovach Computing Ser-vices, UK). To relate a circular to a linear variable, let y be a linearvariable, θ be a circular variable, ryc=corr(y, cosθ), rys=corr(y, sinθ),and rcs=corr(cosθ, sinθ). The circular–linear correlation is
r2 ¼ r2ys þ r2ys � 2rycrysrcs1� r2cs
An association between phase and benefit as defined above ispredicted by the phase correction hypothesis (Hypothesis 2) butmay also be the result of the phase of 2 Hz activity generated bythe evoked responses, which will necessarily occur at the stimulusfrequency. Phase due to these evoked responses should be highlycorrelated with latency of the evoked responses. Therefore, we alsocorrelated the peak latency of the N100m component with the CRTbenefit to a countdown for the occipital, parietal, and cerebellarsources. N100m peak was defined as the maximum deviation fromthe baseline during the epoch from 0 to 250 ms after target onset.For the somatomotor source, we correlated peak latency in theepoch from 0 to 500 ms with benefit because this source does notshow a prominent N100m peak.
Results
Behavioral data
Response latencies as a function of condition are plotted in Fig. 2.There was a significant effect of condition, F(2,7)=8.13, p=0.015.Observers were faster with a countdown than without it. The benefit of3 WSs was greater than that of 2 WSs, t(9)=1.91, p=0.046 (1-tailed).Accuracywas uniformly high,with error rates ranging from1% to5%.
MEG data
Fig. 3 illustrates the location and waveforms of consistentlylocalized sources. The locations are from a typical participant,
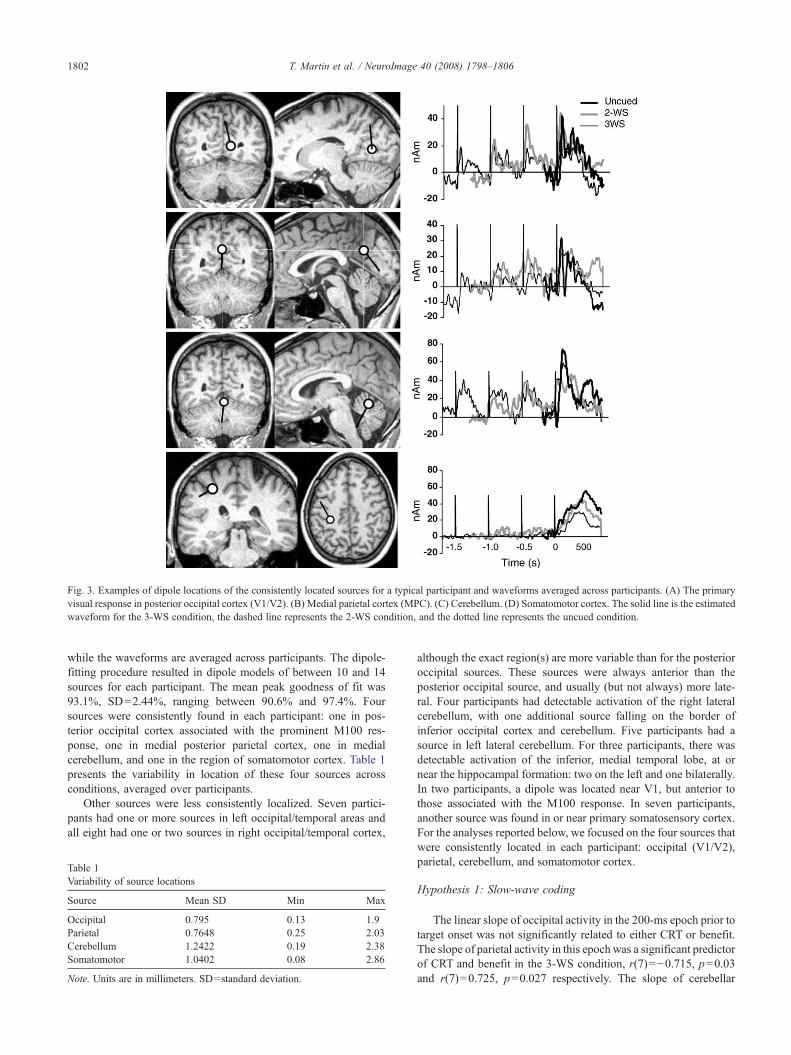
Fig. 3. Examples of dipole locations of the consistently located sources for a typical participant and waveforms averaged across participants. (A) The primaryvisual response in posterior occipital cortex (V1/V2). (B) Medial parietal cortex (MPC). (C) Cerebellum. (D) Somatomotor cortex. The solid line is the estimatedwaveform for the 3-WS condition, the dashed line represents the 2-WS condition, and the dotted line represents the uncued condition.
1802 T. Martin et al. / NeuroImage 40 (2008) 1798–1806
while the waveforms are averaged across participants. The dipole-fitting procedure resulted in dipole models of between 10 and 14sources for each participant. The mean peak goodness of fit was93.1%, SD=2.44%, ranging between 90.6% and 97.4%. Foursources were consistently found in each participant: one in pos-terior occipital cortex associated with the prominent M100 res-ponse, one in medial posterior parietal cortex, one in medialcerebellum, and one in the region of somatomotor cortex. Table 1presents the variability in location of these four sources acrossconditions, averaged over participants.
Other sources were less consistently localized. Seven partici-pants had one or more sources in left occipital/temporal areas andall eight had one or two sources in right occipital/temporal cortex,
Table 1Variability of source locations
Source Mean SD Min Max
Occipital 0.795 0.13 1.9Parietal 0.7648 0.25 2.03Cerebellum 1.2422 0.19 2.38Somatomotor 1.0402 0.08 2.86
Note. Units are in millimeters. SD=standard deviation.
although the exact region(s) are more variable than for the posterioroccipital sources. These sources were always anterior than theposterior occipital source, and usually (but not always) more late-ral. Four participants had detectable activation of the right lateralcerebellum, with one additional source falling on the border ofinferior occipital cortex and cerebellum. Five participants had asource in left lateral cerebellum. For three participants, there wasdetectable activation of the inferior, medial temporal lobe, at ornear the hippocampal formation: two on the left and one bilaterally.In two participants, a dipole was located near V1, but anterior tothose associated with the M100 response. In seven participants,another source was found in or near primary somatosensory cortex.For the analyses reported below, we focused on the four sources thatwere consistently located in each participant: occipital (V1/V2),parietal, cerebellum, and somatomotor cortex.
Hypothesis 1: Slow-wave coding
The linear slope of occipital activity in the 200-ms epoch prior totarget onset was not significantly related to either CRT or benefit.The slope of parietal activity in this epoch was a significant predictorof CRT and benefit in the 3-WS condition, r(7)=−0.715, p=0.03and r(7)=0.725, p=0.027 respectively. The slope of cerebellar

1803T. Martin et al. / NeuroImage 40 (2008) 1798–1806
activity was a significant predictor of both CRT (r(7)=−0.753,p=0.019) and benefit (r(7)=0.679, p=0.044) in the 2-WS con-dition. The slope of somatomotor activity in this epoch did notpredict CRT or benefit in any condition.
Hypothesis 2: Phase correction
Circular–linear correlations between behavioral benefit and phaseof the 2-Hz and the 3-Hz components are presented in Table 2. For the2-Hz activity, the phases of the occipital and parietal sources were notsignificantly related to benefit for any epoch. For the 2-WS condition,the phases of both cerebellar and somatomotor 2 Hz activity weresignificant predictors of benefit. In the 3-WS condition, the phase ofcerebellar activity in all three epochswas significantly associated withbenefit, while for the somatomotor source phase in Epochs 1 and 3predicted benefit. The relationship between phase and benefit did notgeneralize to the 3-Hz component, with the lone exception of theoccipital 3 Hz activity in Epoch 2 in the 3-WS condition.
The correlation between N100m peak latency and benefit wasnot statistically significant for any source or condition. For theoccipital source, correlations were 0.13 and −0.48 for the 2-WSand 3-WS conditions, respectively. For the parietal source, thesecorrelations were −0.07 and −0.1 for the 2-WS and 3-WS condi-tions, respectively. For the cerebellum, these correlations were 0.12and −0.38 for the 2-WS and 3-WS conditions, respectively. For thesomatomotor source, peak latency over the epoch from 0 to 500 msafter target onset was 0.186 and 0.49 for the 2-WS and 3-WSconditions, respectively.
Discussion
There was evidence for the operation of both a stochastic clockmechanism and a coupled oscillator mechanism. The slopes ofactivity from MPC and cerebellum were associated with the beha-vioral benefit of temporally structured cueing, while the phases ofcerebellar and somatomotor activity at the stimulus frequency werealso associated with the benefit. This is the first demonstration ofbrain activity consistent with both mechanisms.
The slow-wave encoding hypothesis was supported by activity inparietal cortex and cerebellum. The positive correlations betweenslope and benefit indicate that higher slopes resulted in greaterbenefit to choice reaction time. Rao et al. (2001) found activation in
Table 2Circular–linear correlations between benefit and phase
Condition Source 2-Hz Epoch
1 2
2 WS Occipital 0.4592 WS Parietal 0.5732 WS Cerebellum 0.5172 WS Somatomotor 0.4423 WS Occipital 0.652 0.6113 WS Parietal 0.333 0.0723 WS Cerebellum 0.802⁎ 0.765⁎
3 WS Somatomotor 0.774⁎ 0.33
Note. Epoch 1 is from −1500 to −500 ms, corresponding to the onset of the first WS0 ms. The beginning of this epoch corresponds to the onset of the second WS in thonset in both conditions. The third epoch is from −500 to 500 ms, centered on th⁎pb0.05.⁎⁎pb0.01.
parietal cortex and cerebellar vermis (as well as several otherlocations) in an interval comparison task using event-related fMRI,but in their paradigm, the cerebellar activation was not prominentuntil late in the trial while the parietal cortex was active earlier. Inaddition, they pointed out that activation in their task came fromcerebellar vermis, while neuropsychological studies indicated a rolefor lateral cerebellum in timing deficits (Ivry et al., 1988). Rao et al.(2001) argued that activation patterns observed in their data impli-cated parietal cortex in timing and cerebellum in a more general rolesuch as monitoring and adjusting cortical activity (cf. Ito, 1984). Thesource observed in the present study may reflect activity from cere-bellar vermis or deep nuclei. Our results suggest that, in this paradigm,the cerebellum and parietal cortex are performing a timing-relatedfunction.
The phase correction hypothesis was well supported by activityin both cerebellum and somatomotor cortex. The phase of 2 Hzactivity from both of these sources centered on the target predictedbenefit in both the 2-WS and 3-WS conditions. This relationshipbetween phase and benefit did not generalize to the 3 Hz com-ponent of activity for these sources, a finding that increases ourconfidence that this relationship between phase and behaviorreflects something specific to the stimulus frequency, rather than amore general phenomenon.
The relationship between phase and benefit was predicted byasserting that an oscillatory process like that specified by DAT isrealized in the brain by a wave of action potential rates averagedover one or more populations of neurons that entrains to stimulussequences through phase correction. It is possible that the phase ofactivity due to the evoked responses, which would necessarily alsobe at 2 Hz, correlates with the benefit to a countdown for reasonsother than phase correction of a coupled oscillator. The phase ofevoked response activity covaries with the latency of the evokedresponse components. That is, as the latency of evoked responseschanges, so does the phase of the spectral power associated withthe evoked response. In fact, with a theoretical-evoked responsethat has no variability with respect to the stimulus, this associationis perfect, so that the phase has no information beyond that of thelatency of evoked components. Therefore, if the observed asso-ciation between phase and benefit were due only to evoked res-ponses at the stimulus frequency, then we would expect a similarcorrelation to hold between evoked response latency and benefit.No such correlation was found with N100m latency in this study
3-Hz Epoch
3 1 2 3
0.363 0.543 0.4070.528 0.631 0.4820.769⁎ 0.294 0.3670.698⁎ 0.463 0.4490.497 0.568 0.826⁎⁎ 0.3730.11 0.402 0.405 0.2890.882⁎⁎ 0.331 0.592 0.3260.682⁎ 0.172 0.579 0.384
to the onset of the thirdWS in the 3-WS condition. Epoch 2 is from −1000 toe 3-WS condition, the first WS in the 2-WS condition, and ends with targete onset of the target.
1804 T. Martin et al. / NeuroImage 40 (2008) 1798–1806
nor in other studies in our laboratory using a similar paradigm inthe auditory modality (Martin et al. 2002, 2006). We conclude thatphase correction plays a role in mediating the behavioral benefit oftemporally structured cueing.
DAT is ostensibly an attentional theory and a benefit to choicereaction time is typically considered a cognitive effect. Nevertheless,the observed phase correction, together with the evidence of intervaltiming activity in parietal cortex, suggests that coupled oscillationmay be a characteristic of the motor system. Nikulin et al. (2003)found that the motor cortical response to transcranial magneticstimulation (TMS) was reduced within 150ms after presentation of avisual stimulus. They argued that this suggests increased excitatoryactivity as a result of the visual stimulation, possibly via a pathwayfrom retina to motor cortex via the mesencaphalic reticular form-ation (Leichnetz, 1986; Nakagawa et al., 1998). If so, this pathwaymight be a candidate substrate for the effect of visual temporalstructure on motor cortex observed here.
The dynamics of the activity in cerebellum were associated withmarkers of both interval timing and coupled oscillation. This mayreflect its proposed role in generating corrective signals to other corticalareas in response to discrepancies between predicted and obtainedinput (Ito, 1984). If the cerebellum plays a role in correcting the timingof motor outputs, the presence of both an interval time code and phasecodemay serve as the interface between a timing system and the motorsystem. The timing system itselfmay be localized to parietal cortex, butmore likely the parietal cortex is just one part of a distributed networkthat generates interval codes (Meck, 1996; Buhusi and Meck, 2005).
Although both the parietal cortex and cerebellum have beenimplicated repeatedly in attention and timing, the location of activitywithin these broad regions appears to depend on the task, species, andtype of investigation (imaging, electrophysiology, lesion, etc.). Gomezet al. (2004) used a Posner type cueing paradigm and measured theCMV with MEG. They found sources in superior temporal gyrus,posterior parietal, posterior cingulate, and primary motor cortex.Mathiak et al. (2004) identified right lateral cerebellum and bilateralintraparietal sulcus (among other regions) as contributing to temporalprocessing using categorization (short vs. long intervals) andcomparison (shorter or longer than standard) tasks and fMRI. Raoet al. (2001) used a slightly different interval comparison task and fMRIbut found activation of cerebellar vermis, intraparietal sulcus, angulargyrus, superior parietal lobule, and precuneus associatedwith timing vs.a control condition. Coull and Nobre (1998) combined temporal andspatial orienting in a factorial design and used both PET and fMRI tomeasure brain activity. They found the left intraparietal sulcus and theleft cerebellummore active for temporal than spatial attention. Rao et al.(1997) used a synchronized tapping/unpaced continuation task withfMRI and found activation of right cerebellum (among other regions)associated with both paced tapping and continuation. In the currentexperiment, the parietal source tended to be located posteriorly, infe-riorly, and medially, near the occipito-parietal sulcus. The commoncerebellar source was located medially, in the general area of thecerebellar source reported by Rao et al. (2001). This signal componentmay reflect activity fromvermis or a deep nucleus such as the dentate. Ifdeep nuclei activation is reflected in this component, then it would alsocapture important aspects of lateral cerebellar processes that send theirsignals to other brain areas through these nuclei.
Limitations and future research
Although we have interpreted our results as consistent withparallel operations of a stochastic timing mechanism and a coupled
oscillator, other interpretations are possible. In particular, the slowwave that we observed might be related to an attentional processindependent of timing (Golob et al., 2002; Gomez et al., 2003).Alternatively, the slope of the slow wave might be related to theattentional pulse of DAT, in which case a unitary account ofbehavioral benefit in our paradigm would be possible. The currentparadigm cannot rule out these possibilities. However, the inter-pretation of the climbing activity as reflecting the attentional pulsedoes not apply to most studies of timing, which do not include atemporally structured signal that a coupled oscillator could entrainto, but instead rely on symbolic cueing of temporal relations (i.e.,Coull and Nobre, 1998). Likewise, the attention-only interpretationof the climbing activity, while possible in our paradigm, does notseem likely in light of the fact that non-temporal attentional allo-cation would be expected to peak well before a potential targetonset and remain sustained for some time (Shih and Sperling,2002).
The work reported here focused on oscillations at the stimulusfrequency, but endogenous brain waves, particularly in the gammaband, have also been implicated in timing (Snyder and Large, 2005),anticipation (Tesche and Karhu, 2000), attention (Singer and Gray,1995), and speeded reactions (Andino et al., 2005). The bridginghypotheses necessary to relate an oscillatory process far from therange of entrainment to the concept of attending rhythms are muchmore involved than those explored here. For instance, althoughgamma-band oscillations could not themselves be isomorphic to anattending rhythm, their power fluctuations or within-populationsynchrony in the gamma band over time could be (i.e., an oscillationof an oscillation). Alternatively, perhaps the attending rhythm isisomorphic to the degree of synchrony between populations in thegamma band. The detailed development of such bridging hypoth-eses will likely be valuable to future research.
Currently, there is some debate about whether there is a singletiming system that operates across all intervals that can be suc-cessfully perceived and reproduced (Fortin and Couture, 2002;Gibbon, 1977) or two or more timing systems that operate at dif-ferent time scales or in different perceptual modalities (Buhusi andMeck, 2005; Getty, 1975; Grondin, 2001; Poppel, 1997). Thecurrent experiment used only a single rate (2 Hz) and so may notgeneralize to longer or shorter intervals. It remains for future re-search to explore the limits of both slow-wave activity and phase inexplaining the effect of temporal structure at different rates.
Conclusions
We presented temporally structured cues in the form of iso-chronous visual countdowns and observed brain activity for allsubjects in occipital, parietal, cerebellar, and somatomotor cortex.Activity in parietal cortex and cerebellum was consistent with astochastic clock mechanism, in that the slope of slow-wave activityimmediately prior to target onset was significantly correlated withthe benefit of cueing. Activity from the same cerebellar source andanother source in somatomotor cortex was consistent with a cou-pled oscillator mechanism, in that the phase of activity at thestimulus frequency was also correlated with the behavioral benefit.The results indicate that both an accumulation code and phase codeare used by the brain to mediate cognition and behavior in responseto external temporal structure. This may either reflect two systemsthat operate together or highlight the need for a new account oftiming and attentional dynamics that accommodates both phaseand accumulator codes.
1805T. Martin et al. / NeuroImage 40 (2008) 1798–1806
References
Allen, G., Buxton, R.B., Wong, E.C., Courchesne, E., 1997. Attentionalactivation of the cerebellum independent of motor involvement. Science275, 1940–1943.
Andino, S.L.G., Michel, C.M., Thut, G., Landis, T., de Peralta, R.G., 2005.Prediction of response speed by anticipatory high-frequency (gammaband) oscillations in the human brain. Hum. Brain Mapp. 24, 50–58.
Batschelet, E., 1981. Circular statistics in biology. Academic Press, London.Buhusi, C.V., Meck, W.H., 2005. What makes us tick? Functional and neural
mechanisms of interval timing. Nat. Rev. Neurosci. 6, 755–765.Coull, J.T., Nobre, A.C., 1998. Where and when to pay attention: The neural
systems for directing attention to spatial locations and to time intervals asrevealed by both PET and fMRI. J. Neurosci. 18, 7426–7435.
Courchesne, E., Allen, G., 1997. Prediction and preparation, fundamentalfunctions of the cerebellum. Learn. Mem. 4, 1–35.
Dale, C.L., Gratton, G., Gibbon, J., 2001. Event-related potentials isolate themotor component in a tapping task. NeuroReport 12, 3015–3018.
Elbert, T., Rockstroh, B., Hampson, S., Pantev, C., Hoke,M., 1994. Themagneticcounterpart of the contingent negative variation. Electroencephalogr. Clin.Neurophysiol. 92, 262–272.
Fortin, C., Couture, E., 2002. Short-term memory and time estimation:Beyond the 2-second “critical” value. Can. J. Exp. Psychol. 56, 120–127.
Getty, D.J., 1975. Discrimination of short temporal intervals: A comparisonof two models. Percept. Psychophys. 18, 1–8.
Gibbon, J., 1977. Scalar Expectancy Theory and Weber's law in animaltiming. Psychol. Rev. 84, 279–325.
Gibbon, J., Church, R.M., 1990. Representation of time. Cognition 37,23–54.
Gibbons, H., Rammsayer, T.H., 2004. Current-source density analysis of slowbrain potentials during time estimation. Psychophysiology 41, 861–874.
Golob, E.J., Pratt, H., Starr, A., 2002. Preparatory slow potentials and event-related potentials in an auditory cued attention task. Clin. Neurophysiol.113, 1544–1557.
Gomez, C.M., Marco, J., Grau, C., 2003. Preparatory visuo-motor corticalnetwork of the contingent negative variation estimated by current den-sity. NeuroImage 20, 216–224.
Gomez, C.M., Fernandez, A., Maestu, F., Amo, C., Gonzalez-Rosa, J.J.,Vaquero, E., Ortiz, T., 2004. Task-specific sensory and motor pre-paratory activation revealed by contingent negative variation. Cogn.Brain Res. 21, 59–68.
Grondin, S., 2001. From physical time to the first and second moments ofpsychological time. Psychol. Bull. 127, 22–44.
Haken, H., Kelso, J.A.S., Bunz, H., 1985. A theoretical model of phasetransitions in human movements. Biol. Cybern. 51, 347–356.
Hämäläinen, M., Hari, R., Ilmoniemi, R.J., Knuutila, J., Lounasmaa, O.V.,1993. Megnetoencephalography—theory, instrumentation, and applica-tions to noninvasive studies of the working human brain. Rev. Mod.Phys. 65, 413–497.
Harrington, D.L., Haaland, K.Y., Knight, R.T., 1998. Cortical networksunderlying mechanisms of time perception. J. Neurosci. 18, 1085–1095.
Hopfinger, J.B., Buonocore, M.H., Mangun, G.R., 2000. The neural mech-anisms of top-down attentional control. Nat. Neurosci. 3, 284–291.
Ito, M., 1984. The cerebellum and neural control. Raven Press, New York,pp. 338–339.
Ivry, R.B., Keele, S.W., 1989. Timing functions of the cerebellum. J. Cogn.Neurosci. 1, 136–152.
Ivry, R.B., Keele, S.W., Diener, H.C., 1988. Dissociation of the lateral andmedial cerebellum in movement timing and movement execution. Exp.Brain Res. 73, 167–180.
Jones, M.R., 1976. Time, our lost dimension: Toward a new theory of per-ception, attention, and memory. Psychol. Rev. 83, 323–335.
Jones, M.R., Boltz, M., 1989. Dynamic attending and responses to time.Psychol. Rev. 96, 459–491.
Jones, M.R., Yee, W., 1997. Sensitivity to time change: The role of contextand skill. J. Exp. Psychol.: Hum. Percept. Perform. 23, 693–709.
Klein, J.M., Jones, M.R., 1996. Effects of attentional set and rhythmiccomplexity on attending. Percept. Psychophys. 58, 34–46.
Klemmer, E.T., 1956. Time uncertainty in simple reaction time. J. Exp.Psychol. 51, 179–184.
Large, E.W., Jones, M.R., 1999. The dynamics of attending: How peopletrack time-varying events. Psychol. Rev. 106, 119–159.
Leichnetz, G.R., 1986. Afferent and efferent connections of the dorsolateralprecentral gyrus (area 4, hand/arm region) in the macaque monkey, withcomparisons to area 8. J Comp. Neurol. 254, 460–492.
Leon, M.I., Shadlen, M.N., 2003. Representation of time by neurons in theposterior parietal cortex of the macaque. Neuron 38, 317–327.
Macar, F., Vidal, F., 2003. The CNV peak: An index of decision making andtemporal memory. Psychophysiology 40, 950–954.
Macar, F., Vitton, N., 1982. An early resolution of the contingent negativevariation (CNV) in time discrimination. Electroencephalogr. Clin.Neurophysiol. 54, 426–435.
Mangels, J.A., Ivry, R.B., Shimizu, N., 1998. Dissociable contributions ofthe prefrontal and neocerebellar cortex to time perception. Cogn. BrainRes. 7, 15–39.
Martin, T., Bish, J.P., Houck, J., Ilmoneimi, R.J., Tesche, C.D., 2002.Entrainment decreases peak amplitude, but increases autocorrelation, inthe auditory evoked response to target tones. In: Nowak, H., Haueisen,J., Geisler, F., Huonker, R. (Eds.), Proceedings of the 13th InternationalConference on Biomagnetism. Verlag, Berlin.
Martin, T., Egly, R., Houck, J., Pearson Bish, J., Berrera, B., Lee, D., Tesche,C.D., 2005. Chronometric Evidence for Entrained Attention. Percept.Psychophys. 67, 168–184.
Martin, T., Houck, J.M., Bish, J.P., Kičić, D., Woodruff, C.C., Moses, S.N.,Lee, D.L., Tesche, C.D., 2006. MEG reveals different contributions ofmotor cortex and cerebellum to simple reaction time following tem-porally structured cues. Hum. Brain Mapp. 27, 552–561.
Mathiak, K., Hertrich, I., Grodd, W., Ackermann, H., 2004. Discriminat-ion of temporal information at the cerebellum: functional magneticresonance imaging on nonverbal auditory memory. NeuroImage 21,154–162.
Matsuura, K., Okabe, U., 1995. Selective minimum-norm solution ofthe biomagnetic inverse problem. IEEE Trans. Biomed. Eng. 42,608–615.
Meck, W.H., 1996. Neuropharmacology of timing and time perception.Cogn. Brain Res. 3, 227–242.
Miniussi, C., Wilding, E.L., Coull, J.T., Nobre, A.C., 1999. Orientingattention in the time domain: Modulation of brain potentials. Brain 122,1507–1518.
Nagai, Y., Critchley, H.D., Featherstone, E., Fenwick, P.B.C., Trible, M.R., Dolan, R.J., 2004. Brain activity relating to the contingentnegative variation: an fMRI investigation. NeuroImage 21,1232–1241.
Nakagawa, S., Mizuma, M., Kuchiiwa, S., 1998. The retinal projections tothe ventral and dorsal divisions of the medial terminal nucleus andmesencephalic reticular formation in the Japanese monkey (Macacafuscata): A reinvestigation with cholera toxin B subunit as an ante-rograde tracer. Brain Res. 809, 198–203.
Nikulin, V.V., Kicic, D., Kahkonen, S., Ilmoniemi, R.J., 2003. Modulationof electroencephalographic responses to transcranial magnetic stimula-tion: Evidence for changes in cortical excitability related to movement.Eur. J. Neurosci. 18, 1206–1212.
Pfeuty, M., Ragot, R., Pouthas, V., 2003. Processes involved in tempoperception: A CNV analysis. Psychophysiology 40, 69–76.
Poppel, E., 1997. A hierarchical model of temporal perception. TrendsCogn. Sci. 1, 56–61.
Posner, M.I., Cohen, Y., Rafal, R.D., 1982. Neural systems control of spatialorienting. Philos. Trans. R. Soc. Lond., B Biol. Sci. 298, 187–198.
Rao, S.M., Harrington, D.L., Haaland, K.Y., Bobholz, J.A., Cox, R.W.,Binder, J.R., 1997. Distributed neural systems underlying the timing ofmovements. J. Neurosci. 17, 5528–5535.
Rao, S.M., Mayer, A.R., Harrington, D.L., 2001. The evolution of brainactivation during temporal processing. Nat. Neurosci. 4, 317–323.

1806 T. Martin et al. / NeuroImage 40 (2008) 1798–1806
Reutimann, J., Yakovlev, V., Fusi, S., Senn, W., 2004. Climbing neuronalactivity as an event-based cortical representation of time. J. Neurosci. 24,3295–3303.
Ruchkin, D.S., McCalley, M.G., Glaser, E.M., 1977. Event related potentialsand time estimation. Psychophysiology 14, 451–455.
Shih, S., Sperling, G., 2002. Measuring and modeling the trajectory of visualspatial attention. Psychol. Rev. 109, 260–305.
Singer, W., Gray, C.M., 1995. Visual feature integration and the temporalcorrelation hypothesis. Annu. Rev. Neurosci. 18, 555–586.
Snyder, J.S., Large, E.W., 2005. Gamma-band activity reflects the metricstructure of rhythmic tone sequences. Cogn. Brain Res. 24, 117–126.
Tesche, C.D., Karhu, J.J.T., 2000. Anticipatory cerebellar responses duringsomatosensory omission in man. Hum. Brain Mapp. 9, 119–142.
Uusitalo, M.A., Ilmoniemi, R.J., 1997. Signal–space projection method forseparating MEG or EEG into components. Med. Biol. Eng. Comput. 35,135–140.
Uutela, K., Hämäläinen, M., Somersalo, E., 1999. Visualization of magnet-oencephalographic data using minimum current estimates. NeuroImage10, 173–180.
Walter, W.G., Cooper, R., Aldridge, V.J., McCallum, W.C., Winter, A.L.,1964. Contingent negative variation: An electric sign of sensorimotorassociation and expectancy in the human brain. Nature 203, 380–384.