Intersection Safety Evaluation: InSAT...
69
Intersection Safety Evaluation: InSAT Guidebook Prepared for: National Cooperative Highway Research Program Transportation Research Board of The National Academies Project 07-18: Crash Experience Warrant for Traffic Signals J. Bonneson and K. Laustsen Kittelson & Associates, Inc. Portland, Oregon Submitted June 2014
Transcript of Intersection Safety Evaluation: InSAT...

Intersection Safety Evaluation: InSAT Guidebook
Prepared for: National Cooperative Highway Research Program
Transportation Research Board of
The National Academies
Project 07-18:
Crash Experience Warrant for Traffic Signals
J. Bonneson and K. Laustsen Kittelson & Associates, Inc.
Portland, Oregon
Submitted June 2014

Intersection Safety Evaluation: InSAT Guidebook i
ACKNOWLEDGMENT OF SPONSORSHIP
This work was sponsored by the American Association of State Highway and Transportation Officials, in cooperation with the Federal Highway Administration, and was conducted in the National Cooperative Highway Research Program which is administered by the Transportation Research Board of the National Academies.
DISCLAIMER
The opinions and conclusions expressed or implied in this document are those of the research agency. They are not necessarily those of the Transportation Research Board, the National Academies, or the program sponsors.

Intersection Safety Evaluation: InSAT Guidebook ii
ACKNOWLEDGMENTS
The research reported herein was performed under NCHRP Project 07-18 by Kittelson & Associates, Inc. Dr. James Bonneson served as the Principal Investigator for the project and supervised the research. Dr. Bonneson was joined in the research by Ms. Kelly Laustsen, Mr. Lee Rodegerdts, and Mr. Scott Beaird. They are all affiliated with Kittelson & Associates, Inc.
The authors acknowledge the support and guidance provided by the Project Panel:
• Mr. Frank Tramontozzi (chair) City of Quincy, Massachusetts
• Mr. David Backstedt Louisiana DOT
• Mr. Timothy Barnett Alabama DOT
• Mr. George Butzer Consultant
• Mr. Rich Cunard TRB Liaison Representative
• Mr. B. Ray Derr NCHRP
• Mr. Bruce Friedman FHWA Liaison Representative
• Dr. Kohinoor Kar Arizona DOT
• Mr. Ken Kobetsky Consultant
• Dr. David Noyce University of Wisconsin
• Mr. Robert Peterson California DOT
• Ms. Ida van Schalkwyk Washington DOT

Intersection Safety Evaluation: InSAT Guidebook iii
Table of Contents List of Figures ............................................................................................................................. v
List of Tables ............................................................................................................................. vi
Chapter 1. Introduction ............................................................................................................... 1
Overview ................................................................................................................................ 1
Terminology............................................................................................................................ 2
Getting Started ....................................................................................................................... 3
Chapter 2. Evaluation Process ..................................................................................................10
Analysis Steps .......................................................................................................................10
Input Data Requirements .......................................................................................................13
Site Data Entry ......................................................................................................................15
Results Review and Interpretation .........................................................................................19
Chapter 3. Intersection Safety Evaluation Procedure ................................................................24
Procedure Overview ..............................................................................................................24
Procedure Scope ...................................................................................................................25
Procedure Steps ....................................................................................................................26
Chapter 4. References ..............................................................................................................29
Appendix A. Model Coefficients, Distributions, and Calibration Factors .....................................30
Predictive Models ..................................................................................................................30
Crash Frequency Distribution ................................................................................................31
Crash Cost Distribution ..........................................................................................................32
Special Treatment Crash Modification Factors ......................................................................33
Calibration Factors ................................................................................................................33
Appendix B. Empirical Bayes Method .......................................................................................38
EB Method Application Criteria ..............................................................................................38
Variations of the EB Method ..................................................................................................39
Crash Assignment to Sites ....................................................................................................39
Intersection Safety Evaluation: InSAT Guidebook iv
Appendix C. Sample Application ...............................................................................................41
Install Signal Alternative ........................................................................................................42
Install Beacons Alternative ....................................................................................................47
Results ..................................................................................................................................50
Appendix D. Case Studies ........................................................................................................52
Case Study 1 – Intersection of Main Street and Bishop Road ................................................54
Case Study 2 – Intersection of US 34 and South Street ........................................................57

Intersection Safety Evaluation: InSAT Guidebook v
List of Figures
Figure 1. Main Worksheet .......................................................................................................... 6
Figure 2. Input Worksheet .......................................................................................................... 7
Figure 3. Input Worksheet–Traffic Data .....................................................................................18
Figure 4. Input Worksheet–Crash Data .....................................................................................19
Figure 5. Output Summary Worksheet ......................................................................................20
Figure 6. Output Details Worksheet–Crash Modification Factors ..............................................22
Figure 7. Output Details Worksheet–Average Crash Frequency ...............................................22
Figure 8. Output Details Worksheet–Crash Distribution ............................................................23
Figure 9. Output Details Worksheet–Traffic Data ......................................................................23
Figure 10. Default SPF Coefficients and Calibration Factors .....................................................31
Figure 11. Default Crash Distribution by Time Period ................................................................32
Figure 12. Default Crash Cost Distribution ................................................................................32
Figure 13. Definition of Roadway Segments and Intersections ..................................................40
Figure 14. Existing Intersection Geometry .................................................................................41
Figure 15. Main Worksheet – General Information and Crash Data Description ........................42
Figure 16. Input Worksheet – Basic Intersection Data, Alignment Data, and Traffic Control Data .................................................................................................................................................43
Figure 17. Input Worksheet – Cross Section Data and Other Data ............................................43
Figure 18. Input Worksheet – Traffic Data .................................................................................44
Figure 19. Input Worksheet – Crash Data .................................................................................45
Figure 20. Output Summary Worksheet – Install Signal ............................................................46
Figure 21. Output Details – Property-Damage-Only Crash Frequency ......................................47
Figure 22. Input Worksheet – Install Beacon .............................................................................48
Figure 23. Calibration Factors Worksheet – Supplemental CMFs .............................................49
Figure 24. Output Summary Worksheet – Install Beacons ........................................................50

Intersection Safety Evaluation: InSAT Guidebook vi
Figure 25. Condition Diagram – Main Street and Bishop Road ..................................................54
Figure 26. Collision Diagram – Main Street and Bishop Road ...................................................56
Figure 27. Condition Diagram – US 34 and South Street ..........................................................58
Figure 28. Collision Diagram – US 34 and South Street ............................................................60
List of Tables
Table 1. Estimate of Pedestrian Volume for Urban Signalized Intersections .............................15
Table 2. Scope Elements for the Safety Evaluation Procedure .................................................26
Table 3. Data Needs for Calibration of Predictive Models .........................................................36
Table 4. CMFs for Sample Application ......................................................................................48
Table 5. Sample Application Results .........................................................................................51
Table 6. (Table 4C-2) Reported Crash Value for Use with Criterion B of Warrant 7 Based on One-Year Crash History ............................................................................................................53
Table 7. (Table 4C-3) Reported Crash Value for Use with Criterion B of Warrant 7 Based on Three-Year Crash History .........................................................................................................53
Table 8. Reported Crashes by Severity and Type – Main Street and Bishop Road ...................55
Table 9. InSAT Application Results – Main Street and Bishop Road .........................................57
Table 10. Traffic Volumes – US 34 and South Street ................................................................58
Table 11. Reported Crashes by Severity and Type – US 34 and South Street ..........................59
Table 12. InSAT Application Results – US 34 and South Street ................................................61

Intersection Safety Evaluation: InSAT Guidebook 1
Chapter 1. Introduction
This guidebook describes the use of a procedure for evaluating the safety of alternative intersection configurations and traffic control types. It includes guidance for conducting the evaluation and guidance for the use of the Intersection Safety Analysis Tool (InSAT). This tool can be used to automate the calculations associated with the evaluation and is available on the TRB website (www.trb.org). The equations used in InSAT are implemented in a Microsoft® Excel™ workbook as software (using the Visual Basic for Applications programming language).
The user manual consists of three main chapters and four appendices. The first chapter provides an introduction to InSAT and describes the typical steps involved in using the InSAT software. The second chapter describes the information needed for an InSAT evaluation. It also reviews the performance measures predicted by InSAT. The third chapter provides guidance for evaluating intersection safety using InSAT. The appendices provide local-calibration information, a sample application, and case-study applications of the engineering study process.
OVERVIEW InSAT provides information about the relationship between intersection geometric design features and safety. It is based on research that quantified the relationship between various design elements (e.g., lane width) or design components (e.g., left-turn bay) and expected average crash frequency. The information provided in this guidebook and in InSAT is intended to help engineers make informed judgments about the safety performance of design alternatives.
InSAT is specifically developed to support the evaluation of a change in traffic control type (e.g., conversion from stop to signal control) at the intersection. However, it can also be used to evaluate the safety effect of alternative geometric design elements and traffic control features.
InSAT automates a safety prediction method that includes several predictive models. The procedure used to develop InSAT is documented by Bonneson et al. (1). The method used in InSAT follows that described in Part C of the (2). InSAT (and this manual) was developed based on the assumption that the analyst has a working knowledge of the methods in Part C.
Evaluation Scope InSAT is intended to be used to evaluate intersection safety. The intersection can be located in an urban, suburban, or rural area. It has stop control on the minor road or traffic signal control.
The default coefficients for the predictive models in InSAT are taken from the Highway Safety Manual. They limit InSAT to specific combinations of intersection legs and major-road lanes, and at intersections where the roads serve two-way traffic. If the intersection is located in an urban or suburban area, then InSAT can be used to evaluate intersections with three or four legs. If it is in a rural area, then InSAT can be used to evaluate intersections with four legs.
InSAT has been developed to accept model coefficients for other combinations of legs and lanes. Entering these coefficients in InSAT will expand its scope to include a wider range of legs and lanes. The analyst can also enter coefficients in InSAT to support the evaluation of one-way streets. The analyst will need to obtain these coefficients from the analysis of crash data for the desired intersection combinations.
InSAT can be used to evaluate the safety effect of installing or removing a traffic control signal.

Intersection Safety Evaluation: InSAT Guidebook 2
InSAT cannot be used to evaluate road segments. If a road segment needs to be evaluated, then one of the following Part C chapters in the Highway Safety Manual should be used for this purpose (as determined by the area type and major-road cross section).
• Chapter 10 - Predictive Method for Rural Two-Lane Roads.
• Chapter 11 - Predictive Method for Rural Multilane Highways.
• Chapter 12 - Predictive Method for Urban and Suburban Arterials.
Limitations of the Predictive Methods InSAT incorporates the safety prediction methods that were developed for the Highway Safety Manual. Specifically, it incorporates the intersection-based method from each of the three Part C chapters. As a result, InSAT shares the limitations stated in the Highway Safety Manual for each of these methods.
Software Limits InSAT can accommodate data for one intersection. The analyst can optionally provide crash data for this intersection.
InSAT is developed to support the evaluation of a change in traffic control type (e.g., conversion from stop to signal control) at the intersection in one application of the software. If a given project includes the consideration of alternatives that do not include a change in traffic control type, then the analyst will need to evaluate each alternative using a separate application of the software. If desired, the workbook can be electronically duplicated (i.e., copied and renamed) to save the evaluation of each alternative.
InSAT can accommodate a crash period that is 1 to 5 years in duration. It can accommodate an evaluation period that is 1 to 24 years in duration. The terms “crash period” and “evaluation period” are defined in the next section.
TERMINOLOGY This section defines the terms used in this manual.
Area Type Classifying an area as urban, suburban, or rural is subject to the roadway characteristics, surrounding population, and surrounding land uses, and is at the analyst’s discretion. The definition of “urban” and “rural” areas is based on Federal Highway Administration (FHWA) guidelines which classify “urban” areas as places inside urban boundaries where the population is greater than 5,000 persons. “Rural” areas are defined as places outside urban areas where the population is less than 5,000 persons. The term “suburban” is used herein to refer to outlying portions of an urban area. The area type designation in InSAT does not distinguish between urban and suburban portions of a developed area.
Empirical Bayes Method The predictive methods in InSAT include models that are used to estimate the predicted average crash frequency for an intersection. If crash data are available and the analyst desires to use these data, the model prediction can be combined with crash data for the intersection to obtain a more reliable estimate. The empirical Bayes (EB) Method is used as the basis for combining the model prediction and the observed crash data. Criteria are provided in Appendix B for determining the applicability of the EB Method. The development of the EB Method is documented by Hauer (3).

Intersection Safety Evaluation: InSAT Guidebook 3
Predictive Method A predictive method consists of one or more predictive models, guidance for acquiring the model input data, and a step-by-step procedure for using the models to quantify the safety performance of an intersection.
Predictive Model A predictive model consists of a safety performance function (SPF), crash modification factors (CMFs), and a calibration factor. It is used to compute the predicted average crash frequency for an intersection. The predicted quantity can describe crash frequency in total, or by crash type or severity.
Time Periods Three time periods are defined to describe the safety evaluation. The “study period” is defined as the consecutive years for which an estimate of the average crash frequency is desired. The “crash period” is defined as the consecutive years for which observed crash data are available. The “evaluation period” is defined as the combined set of years represented by the study period and crash period. Every year in the evaluation period is evaluated using the predictive method. All periods are measured in years.
If the EB Method is not used, then the study period is the same as the evaluation period.
If the EB Method is used and the crash period is not fully included in the study period, then the predictive models need to be applied to the study years plus each year of the crash period not represented in the study period. In this situation, the evaluation period includes the study period and any additional years represented by the crash data but not in the study period. For example, let the study period be defined as the years 2013, 2014, and 2015. If crash data are available for 2011, 2012, and 2013, then the evaluation period is 2011, 2012, 2013, 2014, and 2015.
The study period can represent either a past time period or a future time period. Whether the predictive method is used for a past or future period depends upon the purpose of the study.
GETTING STARTED This section describes the basic interactions needed to complete an evaluation using the InSAT software. It consists of the following five subsections.
• Enabling Macros: guidance for setting spreadsheet security to enable macros.
• Navigation: guidance for selecting and using the worksheets.
• Entering Data: guidance for entering data in a worksheet.
• Reviewing Results: guidance for reviewing, saving, and printing results.
• Modifying Calibration Factors and Distributions: guidance for calibrating InSAT to local conditions.
Enabling Macros The InSAT software contains computer code written in the Visual Basic for Applications programming language is referred to as “macro” code in Excel ®. This macro code must be enabled when first loading InSAT into Excel. This subsection describes a technique for enabling macros. The technique varies depending on whether Excel 2003 or Excel 2010 is used (Excel 2007 is similar to Excel 2010).

Intersection Safety Evaluation: InSAT Guidebook 4
Enabling Macros in Excel 2003 The following instruction sequence enables macros for Excel 2003. Open the Excel software. From the main screen, click on Tools and then Options. In the Options panel, click on Security, and then click Macro Security. In the Security panel, click on Security Level, and then click the radio button adjacent to Medium (the button will show a black circle). Finally, click Ok to exit the Security Level panel and click Ok to exit the Options panel. This setting should only need to be set once. It will remain effective until this process is repeated and a new security level is selected.
Every time InSAT is opened in Excel, the pop-up box shown to the right will be displayed. The analyst should click on Enable Macros. InSAT will finish loading and will function as intended.
Enabling Macros in Excel 2010 The following instruction sequence enables macros for Excel 2010. Open the Excel software. From the main screen, click on File, and then Options. A panel will be displayed. In this panel, click on Trust Center, and then click on Trust Center Settings to bring up the Trust Center panel. In this panel, click on Macro Settings and then click the radio button adjacent to “Disable all macros with notification” (the button will show a black circle). Finally, click Ok to exit the Trust Center panel and click Ok to exit the Excel Options panel. This setting should only need to be set once. It will remain effective until this process is repeated and a new security level is selected.
Intersection Safety Evaluation: InSAT Guidebook 5
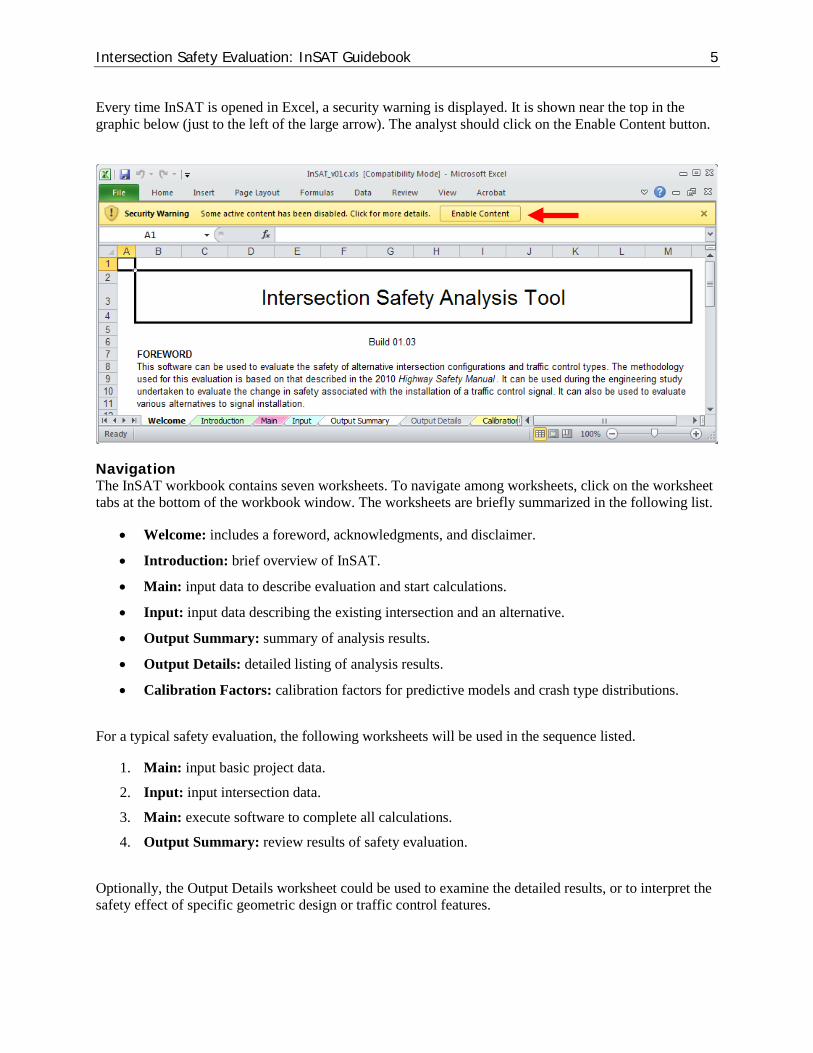
Every time InSAT is opened in Excel, a security warning is displayed. It is shown near the top in the graphic below (just to the left of the large arrow). The analyst should click on the Enable Content button.
Navigation The InSAT workbook contains seven worksheets. To navigate among worksheets, click on the worksheet tabs at the bottom of the workbook window. The worksheets are briefly summarized in the following list.
• Welcome: includes a foreword, acknowledgments, and disclaimer.
• Introduction: brief overview of InSAT.
• Main: input data to describe evaluation and start calculations.
• Input: input data describing the existing intersection and an alternative.
• Output Summary: summary of analysis results.
• Output Details: detailed listing of analysis results.
• Calibration Factors: calibration factors for predictive models and crash type distributions.
For a typical safety evaluation, the following worksheets will be used in the sequence listed.
1. Main: input basic project data.
2. Input: input intersection data.
3. Main: execute software to complete all calculations.
4. Output Summary: review results of safety evaluation.
Optionally, the Output Details worksheet could be used to examine the detailed results, or to interpret the safety effect of specific geometric design or traffic control features.
Intersection Safety Evaluation: InSAT Guidebook 6
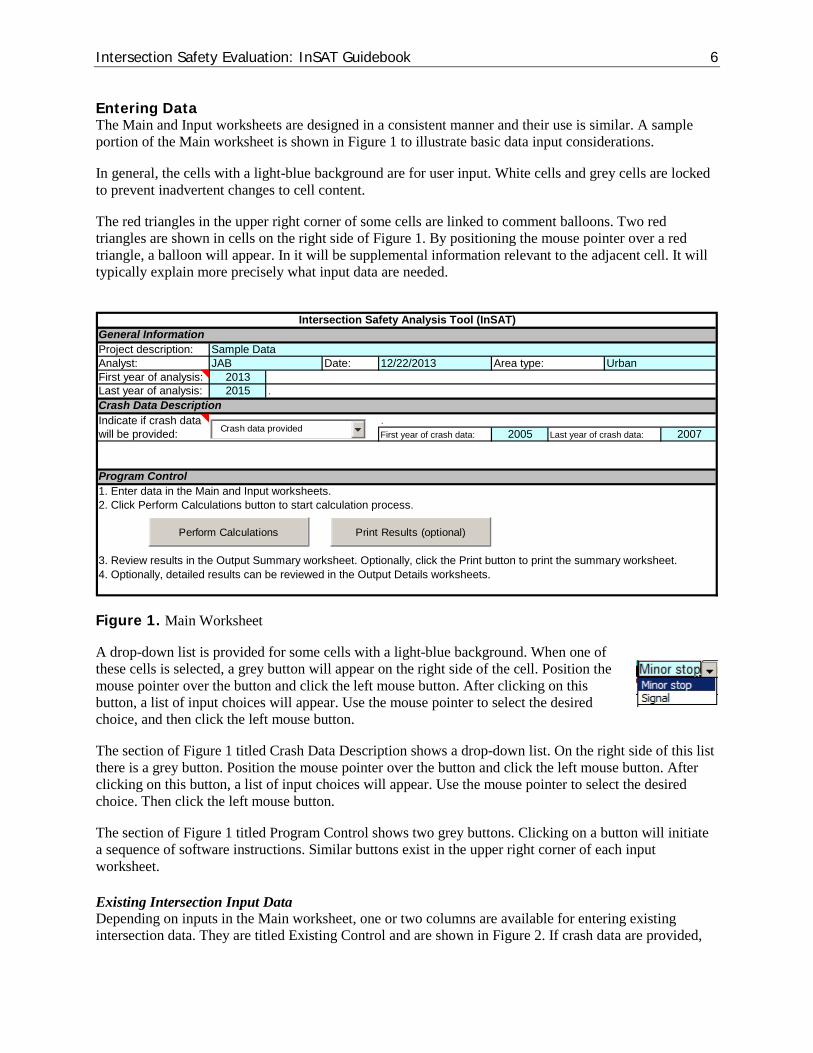
Entering Data The Main and Input worksheets are designed in a consistent manner and their use is similar. A sample portion of the Main worksheet is shown in Figure 1 to illustrate basic data input considerations.
In general, the cells with a light-blue background are for user input. White cells and grey cells are locked to prevent inadvertent changes to cell content.
The red triangles in the upper right corner of some cells are linked to comment balloons. Two red triangles are shown in cells on the right side of Figure 1. By positioning the mouse pointer over a red triangle, a balloon will appear. In it will be supplemental information relevant to the adjacent cell. It will typically explain more precisely what input data are needed.
General InformationProject description:Analyst: Date: Area type:First year of analysis: 2013Last year of analysis: 2015 .Crash Data DescriptionIndicate if crash data .will be provided: First year of crash data: 2005 Last year of crash data: 2007
Program Control1. Enter data in the Main and Input worksheets.2. Click Perform Calculations button to start calculation process.
3. Review results in the Output Summary worksheet. Optionally, click the Print button to print the summary worksheet.4. Optionally, detailed results can be reviewed in the Output Details worksheets.
Intersection Safety Analysis Tool (InSAT)
Sample DataJAB 12/22/2013 Urban
Crash data provided
Perform Calculations Print Results (optional)
Figure 1. Main Worksheet
A drop-down list is provided for some cells with a light-blue background. When one of these cells is selected, a grey button will appear on the right side of the cell. Position the mouse pointer over the button and click the left mouse button. After clicking on this button, a list of input choices will appear. Use the mouse pointer to select the desired choice, and then click the left mouse button.
The section of Figure 1 titled Crash Data Description shows a drop-down list. On the right side of this list there is a grey button. Position the mouse pointer over the button and click the left mouse button. After clicking on this button, a list of input choices will appear. Use the mouse pointer to select the desired choice. Then click the left mouse button.
The section of Figure 1 titled Program Control shows two grey buttons. Clicking on a button will initiate a sequence of software instructions. Similar buttons exist in the upper right corner of each input worksheet.
Existing Intersection Input Data Depending on inputs in the Main worksheet, one or two columns are available for entering existing intersection data. They are titled Existing Control and are shown in Figure 2. If crash data are provided,

Intersection Safety Evaluation: InSAT Guidebook 7
then two data entry columns will be provided to describe the existing intersection in the Input worksheet. The first column corresponds to input data for the crash period. The second column corresponds to input data for the study period. If crash data are not provided, then only one column will be provided for the existing intersection. It will correspond to data for the study period. Figure 2 illustrates the case where two columns are provided for the existing intersection.
Input WorksheetExisting Control Proposed Control
(View results in Column K) (View results in Advisory Messages)Basic Intersection DataNumber of intersection legs: 4 4 4Intersection description: general description text desIntersection traffic control type: Minor stop Minor stop SignalMajor road lanes serving through vehicles: 4 4 4
Alignment DataIntersection skew angle, degrees: 1 1 1Cross Section DataLeft-Turn Lane or BayMajor road Number of approaches with a left-turn lane or bay: 0 1 1Other DataIs intersection lighting present? Yes Yes YesNumber of bus stops within 1,000 ft of the center of the intersection: 1 1 1
Crash Period Study Period Study Period
Clear Echo Input Values Check Input Values
Figure 2. Input Worksheet
If two columns are shown for the existing intersection, then the input cells in the columns headed Study Period will have an equation that sets the study period value equal to the crash period value, for a common row. This equation is provided as a convenience to the analyst because it is likely that the site’s geometric design and traffic control features have not changed between the crash period and the study period. Thus, the analyst can enter the value for the crash period and it will be repeated for the study period. If a feature has changed in the time that has elapsed from the crash period to the study period, then the appropriate value should be entered in each column (thus, eliminating the equation in the study period column).
As discussed in Appendix B, the EB Method requires that the intersection has not undergone fundamental changes in character between the crash period and study period. Those variables considered to be fundamental to an intersection’s character have an input cell with a white background in the study period column (indicating that the cell is locked to prevent a change in value between the two periods).
If there is a change in one or more features at the existing intersection between the crash period and the study period, then the analyst should enter the appropriate data in the row corresponding to that feature. For example, the existing intersection is shown in Figure 2 to have lighting present. A “Yes” is entered in the cell associated with the row titled “Is intersection lighting present?” and the column headed Crash Period. The default equation in the Study Period column replicates the “Yes” entry automatically.
Continuing the example, the existing intersection is shown to have no left-turn bays during the crash period. However, one left-turn bay is present during the study period. In this instance, bay presence is unique to each time period and must be separately entered in the corresponding columns. The default equation is deleted and the correct value (i.e., “1”) is entered directly in the Study Period column.

Intersection Safety Evaluation: InSAT Guidebook 8
Input Data for Alternatives Analysis If the analyst desires to evaluate the safety effect of a change in traffic control type, then the column titled Proposed Control is used to describe the proposed intersection with the new type of traffic control. The input cells in this column are used to describe the geometric design elements and traffic control features of the proposed intersection. These elements and features may also change in conjunction with the installation of the proposed traffic control. For example, it is possible that an intersection that is proposed to have a signal installed may also be proposed to have left-turn bays installed. The input cells for the Proposed Control column should reflect both of these changes.
InSAT can also be used to evaluate changes to the geometry or traffic control at the existing intersection that do not include a change in traffic control type. If the analyst desires to evaluate the safety effect of these changes, then the Study Period column (for Existing Control) must be used to evaluate each alternative separately. This will require separate “runs” using InSAT, where the results of each “run” are recorded by the analyst and compared.
Clearing Input Data The Input worksheet has a software routine that will clear all existing data in that worksheet. This routine is initiated by clicking on the Clear button in the upper left corner of the worksheet. This button is shown in Figure 2. After the button is activated, a message box appears to confirm the request to clear all data. If No is clicked, then control is returned to the input worksheet. If Yes is clicked, then the data in all input cells are cleared.
Reviewing Results This subsection provides guidance for reviewing, saving, and printing results in InSAT. The results of an evaluation are available in the two output worksheets. The detailed output is available in the Output Worksheet. These results are aggregated and summarized in the Output Summary worksheet.
The data entered into InSAT can be saved by saving the entire workbook. The File, Save As menu sequence should be selected, and a new file name entered when prompted (i.e., avoid overwriting the original InSAT workbook).
The Print Results button in the Main worksheet is shown in Figure 1. Clicking on this button enables a software routine that prints the evaluation results in the Output Summary worksheet. After clicking this button, a print review screen is presented. The screen will show a one-page printout of the results. If the information shown is acceptable, then press the Print button at the top of the window to submit the image to the printer. Note that the printer must be turned on prior to clicking the Print button.
If the information shown in the one-page printout is not acceptable, then click on the Close button at the top of the window to return to the Main worksheet.
Modifying Calibration Factors and Distributions The predictive models in InSAT have each been developed with data from specific jurisdictions and time periods. Calibration to local conditions will account for any differences between these conditions and those present at the sites being evaluated.
A calibration factor is applied to each predictive model. It is important that each model be calibrated for application in the jurisdiction in which the sites being evaluated are located. A procedure for calibrating these models is described in Appendix A.

Intersection Safety Evaluation: InSAT Guidebook 9
InSAT includes a distribution of crashes by time period (i.e., nighttime, daytime). This distribution is used to estimate the CMF for lighting presence. Separate distributions are provided for each combination of area type, intersection legs, and major-road through lanes.
The crash time period distribution can vary from jurisdiction to jurisdiction for the same reasons noted previously for predictive models. However, satisfactory results can be obtained with the distributions provided with InSAT. Providing locally-derived values for this distribution is encouraged, but considered to be optional. Guidance for replacing the distribution values with local values is described in Appendix A.

Intersection Safety Evaluation: InSAT Guidebook 10
Chapter 2. Evaluation Process
This chapter describes the activities undertaken during an intersection safety evaluation. The first section describes the sequence of activities in the order they are conducted. These activities are outlined as a series of analysis steps. The other sections provide the detailed procedures and information needed to implement one of the analysis steps in InSAT.
At the conclusion of the evaluation process, an estimate of the average crash frequency is obtained for the existing and proposed alternative intersection. The estimate is provided as a total that includes all severities and crash types. An estimate is also provided for each severity level and selected crash types.
Through repetition of this process for different design alternatives, information is obtained about the safety implications of the alternatives.
ANALYSIS STEPS This section outlines the steps involved in a safety evaluation using InSAT. The steps are considered to be the routine steps that are used each time a safety evaluation is undertaken. It is assumed that the models and distributions have been calibrated for application to sites in the local jurisdiction.
The analysis steps are identified in the following list.
1. Define Project Limits.
2. Define Study Period.
3. Acquire Traffic Volume and Observed Crash Data.
4. Acquire Geometric Design and Traffic Control Data.
5. Define Alternatives.
6. Assign Observed Crashes.
7. Initiate Calculations and Review Results.
Additional information about each step is provided in the following subsections.
Step 1―Define Project Limits The project limits are defined in this step. They define the physical extent of the entity being evaluated and typically encircle the intersection of interest. The project limits should be the same for the existing intersection and all alternatives being considered.
The project limits around the intersection should include the intersection conflict area, and extend back on each intersecting roadway a distance sufficient to include all intersection-related crashes. Of note in this regard are crashes associated with vehicles that are changing speed or lanes as they approach the intersection in response to is traffic control devices or lane assignments.
Step 2―Define Study Period The study period is defined in this step. It represents the consecutive years for which the results of the safety evaluation will apply. If observed crash data are available for the project, then the most recent
Intersection Safety Evaluation: InSAT Guidebook 11
years for which they are available define the crash period. The evaluation period includes the years represented in the study period and the crash period combined.
The study period depends upon the purpose of the study. The study period may be:
• A past period for:
o An existing intersection. If observed crash data are available, the study period is the period of time for which the observed crash data are available and for which (during that period) the intersection geometric design features, traffic control features, and traffic volumes are known.
o An existing intersection for which alternative geometric design or traffic control features are proposed (for near-term conditions) and intersection traffic volumes are known.
• A future period for:
o An existing intersection for a future period where forecast traffic volumes are available.
o An existing intersection for which alternative geometric design or traffic control features are proposed and forecast traffic volumes are available.
o A new intersection that does not currently exist but is proposed for construction and for which forecast traffic volumes are available.
Step 3―Acquire Traffic Volume and Observed Crash Data Traffic volume data are acquired in this step. Also, a decision is made whether the EB Method will be applied. If it will be applied, then it must also be decided whether the site-specific or project-level EB Method will be applied. If the EB Method will be applied, then the observed crash data are also acquired in this step.
Acquiring Traffic Volume Data The traffic volume data is represented by annual average daily traffic (AADT) volume data. The AADT volumes are needed for each year of the evaluation period.
For a past period, the AADT volume may be determined by using automated recorder data, or estimated by a sample survey. For a future period, the AADT volume may be a forecast estimate based on appropriate land use planning and traffic volume forecasting models.
At least one AADT value for vehicular traffic is needed for each intersecting roadway. Also, at least one AADT value for pedestrian traffic is needed for the intersection. This latter value represents the sum of daily pedestrian volumes crossing all intersection legs.
In many cases, it is expected that AADT data will not be available for all years of the evaluation period. In that case, an estimate of AADT volume for each missing year is computed in InSAT using the following rules.
• If AADT volume is available for only a single year, that same volume is assumed to apply to all years of the evaluation period.
• If two or more years of AADT data are available, the AADT volumes for intervening years are computed by interpolation.

Intersection Safety Evaluation: InSAT Guidebook 12
• The AADT volumes for years before the first year for which data are available are assumed to be
equal to the AADT volume for that first year.
• The AADT volumes for years after the last year for which data are available are assumed to be equal to the AADT volume for that last year.
Acquiring Observed Crash Data The EB Method can be used to obtain a more reliable estimate of the expected average crash frequency for the existing intersection. The EB Method is applicable when crash data are available for the intersection. Crash data may be obtained directly from the jurisdiction’s crash report system. At least two years of crash data are desirable to apply the EB Method. The EB Method (and criteria to determine whether the EB Method is applicable) is presented in Appendix B.
Step 4―Acquire Geometric Design and Traffic Control Data The data needed to apply the predictive models are acquired in this step. These data represent the geometric design features, traffic control features, and traffic demand characteristics that have been found to have some relationship to safety. They are needed for the study period and, if applicable, the crash period.
The specific data elements needed are described in the section titled Input Data Requirements. The means by which they are entered into InSAT is described in the section titled Site Data Entry.
Step 5―Define Alternatives The geometric design features, traffic control features, and traffic demand characteristics associated with the proposed alternative are acquired in this step. These data are needed for the study period. The data elements needed are described in the section titled Input Data Requirements.
Step 6―Assign Observed Crashes If it was decided in Step 3 to use the EB Method, then the crash data acquired in Step 3 are assigned to the intersection. The criteria for determining whether an observed crash is intersection-related are presented in Appendix B. If the EB Method is not used, then proceed to Step 7.
Step 7―Initiate Calculations and Review Results This step implements the safety evaluation procedure described in Chapter 3. The Perform Calculations button in the Main worksheet is selected to initiate the calculation sequence. This button is shown in Figure 1.
The calculations proceed automatically on a year-by-year basis. A predictive model is used to compute the predicted average crash frequency for each year.
If observed crash data are not available, then the EB Method is not used. In this case, the estimate of expected average crash frequency is limited to the predicted average crash frequency from a predictive model. If the EB Method is used, then the expected average crash frequency is equal to the estimate obtained from the EB Method.
The estimates of average crash frequency are summed for all years to obtain an estimate of the average number of crashes for the existing and proposed intersection during the study period.
The review of results is focused on whether there is a significant change in intersection safety due to signal installation. One element of this review is to determine if there is a significant change in crash

Intersection Safety Evaluation: InSAT Guidebook 13
frequency. The process for making this determination is described as “Step 4” of the safety evaluation procedure described in Chapter 3.
A second element of this review is to determine if there is a net safety benefit associated with the signal installation. The process for making this determination is described as “Step 5” in Chapter 3. If either change is determined to be significant, then the signal installation is determined to have made a change in overall intersection safety.
Additional information about the performance measures predicted by InSAT is provided in the section titled Results Review and Interpretation.
INPUT DATA REQUIREMENTS The input data needed for the predictive models are identified in this section. These data represent the geometric design features, traffic control features, and traffic demand characteristics that have been found to have some relationship to safety. They are identified by bullet in this section, and are listed in Table 3 of Appendix A.
Data describing the following geometric design elements, traffic control features, and traffic characteristics are needed to use the predictive models. The items that are underlined are required. Those that are not underlined are desirable and, if available, can improve the reliability of the results.
• Number of intersection legs.
• Number of through lanes on the major road. Number of lanes serving traffic traveling through the intersection on the major road. This variable includes only lanes that continue through the intersection. Count the lanes along the crosswalk (or the logical location of the crosswalk if it is not marked).
• Intersection skew angle (stop control on the minor road). Skew angle equals 90 minus the intersection angle (in degrees). The intersection angle is the acute angle between the major-road centerline and the minor-road centerline. This information is needed only for intersections with stop control on the minor road.
• Red-light camera presence (signal control). Indicate “Yes” if red-light violations are enforced using automated equipment. This information is needed only for urban signalized intersections.
• Number of approaches with right-turn-on-red prohibited (signal control). This information is needed only for signalized intersections.
• Left-turn operational mode (signal control). This mode is provided for each intersection approach. It can be specified as permissive, protected-permissive, or protected. A designation of “permissive” implies a left-turn phase is not present. A designation of “protected-permissive” or “protected” implies the presence of a left-turn phase. This information is needed only for signalized intersections.
• Number of lanes crossed by a pedestrian (signal control). The maximum number of traffic lanes that a pedestrian must cross in any crossing maneuver at the intersection. Both through and turning lanes that are crossed by a pedestrian along the crossing path are considered. If the crossing path is broken by an island that provides a suitable refuge for the pedestrian so that the crossing may be accomplished in tow (or more) stages, then the number of lanes crossed in each stage is considered separately. To be considered as a suitable refuge, an island must be raised or depressed; a flush or painted island is not treated as a refuge for this application. This information is needed only for signalized intersections.

Intersection Safety Evaluation: InSAT Guidebook 14
• Presence of a left-turn lane (or bay). This presence is provided for each intersection approach. A
lane (or bay) is considered to be present when it is for the exclusive use of a turn movement and is of adequate length. A left-turn lane is of adequate length if turning vehicles decelerate and store in it without impeding the flow of through traffic.
• Presence of a right-turn lane (or bay). This presence is provided for each intersection approach. A lane (or bay) is considered to be present when it is for the exclusive use of a turn movement and is of adequate length. A right-turn lane is of adequate length if turning vehicles decelerate in it without impeding the flow of through traffic.
• Presence of intersection lighting.
• Number of bus stops within 1,000 feet of the intersection (signal control). Multiple bus stops at the same intersection (i.e., bus stops in different intersection quadrants or located some distance apart along the same intersection leg) are counted separately. Bus stops located at adjacent intersections would also be counted as long as any portion of the bus stop is located within 1,000 feet of the intersection begin evaluated. This information is needed only for signalized intersections.
• Presence of a public school with 1,000 feet of the intersection (signal control). A school may be counted if any portion of the school grounds is within 1,000 feet of the intersection. This information is needed only for signalized intersections.
• Number of alcohol sales establishments within 1,000 feet of the intersection (signal control). Any alcohol sales establishment wholly or partly within 1,000 feet of the intersection may be counted. An alcohol sales establishment includes liquor stores, bars, restaurants, convenience stores, or grocery stores. Alcohol sales establishments are counted if they are on any intersection leg, or even on another street, as long as they are within 1,000 feet of the intersection being evaluated. This information is needed only for signalized intersections.
• AADT volume for pedestrians (signal control). This volume represents the sum of daily pedestrian volumes crossing all intersection legs. Only pedestrian crossing maneuvers immediately adjacent to the intersection (e.g., at a marked crosswalk or along the extended path of any sidewalk present) are considered in determining the pedestrian volumes. This information is needed only for signalized intersections. Default values are provided in Table 1.
• AADT volume for vehicles on the major road and the minor road.

Intersection Safety Evaluation: InSAT Guidebook 15
Table 1. Estimate of Pedestrian Volume for Urban Signalized Intersections General Level of Pedestrian
Activity Estimate of AADT Volume for Pedestrians (peds/day)
Three-Leg Intersection Four-Leg Intersection
High 1,700 3,200
Medium-high 750 1,500
Medium 400 700
Medium-low 120 240
Low 20 50
Source: Chapter 12 of the Highway Safety Manual (2).
SITE DATA ENTRY This section describes the data entry process. InSAT provides two worksheets to facilitate data entry. They are identified in the following list.
• Main: input data to describe evaluation and start calculations.
• Input: input data describing the existing intersection and an alternative.
The analyst should confirm that he or she has enabled macro operation in the spreadsheet before starting the data entry process. The procedure for enabling macros is described in the section titled Getting Started.
Data Entry Basics The analyst enters information in the Input worksheet that describes the geometric design features, traffic control features, or traffic volume characteristics for the existing and proposed intersection. These data are entered for the study period and, if applicable, the crash period.
The worksheet cells are used for data entry. Some cells accept numeric data, which can be typed in directly using the keyboard. Some cells provide a drop-down list of text choices. In this case, the analyst should use the mouse pointer to select the applicable choice.
If a numeric entry is not within an allowed range, or if it does not match one of the drop-down list of text choices, then a message box is displayed indicating “Out of Range!” The analyst can click Retry and re-enter the data, or click Cancel and return to the cell’s previous content.
With a couple of exceptions, data must be entered in every cell highlighted with a light-blue background. One exception is AADT data. InSAT highlights one cell with a light-blue background for every year in the evaluation period. AADT volume is required for one of these highlighted cells (i.e., for one year in the evaluation period), but it is optional for the other years. If the volume for a year is missing, then InSAT will estimate it using the rules described in the section titled Step 3―Acquire Traffic Volume and Observed Crash Data.
Some data elements apply only when used with other data elements. InSAT monitors each data element that is entered and dynamically highlights all other applicable data entry cells using a light-blue

Intersection Safety Evaluation: InSAT Guidebook 16
background. Similarly, it dynamically changes the cell background to white for any data elements that are not applicable. For example, if the Traffic Control Type is entered as “Signal”, then the cell associated with Skew Angle is changed to a white background. This change is made by InSAT because skew angle is not applicable to the predictive model for signalized intersections.
Any data that is entered in a cell that subsequently is changed to a white background (due to changes in other cells) will be ignored by InSAT.
Data entry in a worksheet should proceed from top to bottom to take full advantage of InSAT’s ability to highlight applicable data entry cells. That is, data entry should proceed in the direction of increasing row number. Entry in the top-down direction is not a requirement. The only consequence of entering data in a different order is that some data may be entered that is ultimately not needed for a specific site.
Main Worksheet The information and data entered in the Main worksheet is universal to the project. This worksheet is shown in Figure 1. The input data elements are described in the following paragraphs.
General Information The Project Description data entry field is used to describe the project being evaluated. This entry is not used by the predictive method. It is repeated in the Output Summary. It is an optional data entry field that will accept any desired combination of numeric and character data.
The Analyst data entry field is used to identify the person conducting the evaluation. This entry is not used by the predictive method. It is repeated in the Output Summary. It is an optional data entry field that will accept any desired combination of numeric and character data.
The Date data entry field is used to indicate the date of the evaluation (or any other date meaningful to the analyst). An equation in the cell will display the current date. It can be deleted or overwritten by the analyst. This entry is not used by the predictive method. It is repeated in the Output Summary. It is an optional data entry field that will accept any desired combination of numeric and character data.
The Area Type data entry field is used to indicate whether the project is in an urban or rural area. Only two entries will be accepted: “Urban” and “Rural.” “Urban” is entered if the area type is considered suburban. This entry is used by several SPFs and CMFs in the predictive method. It is repeated in the Output Summary. It is a required data entry field.
The First Year of Analysis and Last Year of Analysis data entry fields are used to define the first year and last year of the study period (inclusive). These data are used in the predictive method. They are repeated in the Output Summary. They are required data entry fields.
Crash Data Description The drop-down box is used to indicate whether the EB Method will be used in the evaluation of the existing intersection. This decision is made in Step 3, as described in the section titled Analysis Steps. The following two choices are offered in the drop-down box to facilitate this entry.
• No crash data.
• Crash data provided.
The first choice is selected if the EB Method will not be applied. The second choice is selected if the EB Method will be applied.

Intersection Safety Evaluation: InSAT Guidebook 17
If the second choice is selected, then the First Year of Crash Data and the Last Year of Crash Data fields are highlighted with a light-blue background and data must be provided. These data define the first year and last year of the crash period (inclusive). These data are used with the EB Method in the predictive method. They are repeated in the Output Summary. They are required data entry cells.
Input Worksheets This section focuses on the Input worksheet. Details related to some data elements in this worksheet are provided in a pop-up comment balloon. Where available, one comment is located on the worksheet row associated with the data element. It is identified by a red triangle (as shown in Figure 1).
The Input worksheet is organized to list the data elements from top to bottom along the left side of the worksheet. The adjacent columns are used to represent the existing and proposed intersection. This arrangement is shown in Figure 2.
The Input worksheet has a button titled Echo Input Values. This button is located in the upper left corner of the worksheet. Its use is optional. If used, it initiates a software routine that reads the entered data and writes it to an unused area of the worksheet. The location of the “echoed” data is identified by the text just below the button. This routine allows the analyst to confirm that InSAT is correctly reading the entered data.
The Input worksheet has a button titled Check Input Values. This button is located in the upper left corner of the worksheet. Its use is encouraged. When used, it initiates a software routine that reads the entered data and checks it for consistency with other entered data for a common site. If any discrepancies are found, a brief message is written in an unused area of the worksheet. When the routine is finished, the active window is relocated to this area so the analyst can determine if any errors exist and their possible cause. The location of these messages is also identified by the text just below the button. This routine allows the analyst to confirm that the entered data is correct before performing any calculations.
The Input worksheet organizes the data elements in similar categories. A blank row is used to identify category headings in InSAT. This row has a light grey background. All related data elements are listed under the heading. These categories are identified in the following list.
• Basic Intersection Data.
• Alignment Data.
• Traffic Control Data.
• Cross Section Data.
• Other Data.
• Traffic Data.
• Crash Data.
Data elements in each category of the preceding list are described in the section titled Input Data Requirements. Data entry considerations for several of these categories are described in the following subsections.

Intersection Safety Evaluation: InSAT Guidebook 18
Basic Intersection Data The default coefficients provided in the Calibration Factors worksheet all InSAT to be used to evaluate many types of intersections. However, coefficients for some intersection types were not available at the time InSAT was created. InSAT was developed to provide analysts with the option of entering the coefficients for these intersection types when they become available. The intersections not addressed for Version 1 of InSAT include: intersections formed by two one-way streets, rural signalized intersections with three legs, and urban intersections with six lanes on the through street.
Other Data The Other Data section of the Input worksheet allows the analyst to specify up to two special treatments. The CMF values for these two special treatments can then be included in the safety evaluation. The analyst will need to provide the CMF values for these treatments. They are entered in the Calibration Factors worksheet. Appendix A provides additional discussion on the proper specification and use of CMFs for special treatments.
Traffic Data The Traffic Data section is shown in Figure 3. The AADT data are entered in this section. As noted previously, the AADT data entry cells are unusual because they have a light-blue background but some cells can be left blank. AADT data must be provided for at least one cell with a light-blue background for the existing intersection and the proposed intersection. If the AADT volume for a year is missing, then InSAT will estimate it using the rules described in the section titled Step 3―Acquire Traffic Volume and Observed Crash Data.
In Figure 3, the cells with light-blue background coincide with the years 2005 to 2007 and 2013 to 2015. The first set of blue cells represent the crash period. The second set of cells represent the study period. These years were specified in the Main worksheet, as shown in Figure 1.
Input WorksheetExisting Control Proposed Control
(View results in Column K) (View results in Advisory Messages)Traffic Data YearMajor-Road Data 2005 15000Annual average daily traffic (AADTmajor) by year, veh/d: 2006 (enter data only for those years for which 2007 16000 it is available, leave other years blank) 2008
2009201020112012201320142015
Crash Period Study Period Study Period
15000
16000
Clear Echo Input Values Check Input Values
Figure 3. Input Worksheet–Traffic Data
Figure 3 shows that the data entry cells for both the crash period and the study period are in a common (i.e., merged) column for the existing intersection. These data entry cells apply to both periods. This approach to AADT data entry is intended to simplify the entry of AADT data.
Crash Data The Crash Data section of the Input worksheet is shown in Figure 4. This section is used if crash data are available and the analyst desires to use the EB Method to obtain a more reliable estimate of the expected average crash frequency. The observed crash counts are entered in this section. Data are entered for all

Intersection Safety Evaluation: InSAT Guidebook 19
data entry cells with a light-blue background. These cells are in the column headed Crash Period and represent data that correspond to the crash period.
The data entry cells shown in Figure 4 correspond to fatal-and-injury crashes associated with angle and rear-end crashes. Additional data entry cells are provided for fatal-and-injury crashes associated with other crash types, but are not shown in the figure. Additional data entry cells are provided for property-damage-only crashes, but are not shown in the figure. The values entered in this section must represent the crash counts for each site reported during the calendar year indicated.
Input WorksheetExisting Control Proposed Control
(View results in Column K) (View results in Advisory Messages)Crash DataCount of Fatal-and-Injury (FI) Crashes by Year
Angle crashes 2005 02006 22007 120082009
Rear-end crashes 2005 02006 12007 020082009
Other crashes 2005 12006 22007 320082009
Crash Period Study Period Study Period
Clear Echo Input Values Check Input Values
Figure 4. Input Worksheet–Crash Data
RESULTS REVIEW AND INTERPRETATION This section describes the output data provided by InSAT. These data are provided in the two worksheets identified in the following list.
• Output Summary.
• Output Details.
The output data provided in the Output Summary worksheet will provide the information needed for most safety evaluations. Optionally, the analyst can review the detailed results of the analysis in the Output Details worksheets. The information in these worksheets is described in the following subsections.
Output Summary The Perform Calculations button in the Main worksheet is used to initiate the calculations associated with the predictive methods in InSAT. The calculations will take a few seconds to complete. When they are completed, the analyst can view the results in the Output Summary worksheet. An example of this worksheet is shown in Figure 5.
The results of the analysis are shown in four sections in the output summary. The data in each section correspond to the study period. Estimates associated with the crash period are not shown unless the crash period is within the study period.

Intersection Safety Evaluation: InSAT Guidebook 20
General InformationProject description:Analyst: Date: Area type:First year of analysis: 2013Last year of analysis: 2015Crash Data DescriptionCrash data available? Yes First year of crash data: 2005 Last year of crash data: 2007Estimated Crash StatisticsCrashes During the Study Period see note:
Angle Rear-end Other Total Angle Rear-end Other TotalMinor stop FI 1.7 0.6 4.2 6.5 0.8 0.4 1.6 1.9
PDO 2.4 1.4 6.7 10.5 1.1 0.8 2.2 2.6Total 4.0 2.0 10.9 16.9 1.4 0.9 2.7 3.2
Signal FI 0.6 0.8 0.9 2.4 0.6 0.6 1.1 1.4PDO 0.9 1.8 1.3 4.0 1.0 1.7 2.7 3.3Total 1.5 2.6 2.2 6.3 1.2 1.8 2.9 3.6
Change in control FI -1.0 0.2 -3.2 -4.1 1.00 0.23 1.66 1.76type: PDO -1.5 0.4 -5.4 -6.5 0.99 0.22 1.57 1.55
Total -2.5 0.6 -8.7 -10.6 1.38 0.29 2.18 2.21Severity Index Analysis see note:
Angle Rear-end Other Total Angle Rear-end Other TotalMinor stop 153 53 519 724 69 25 183 197Signal 48 57 141 246 39 34 136 146Change in control type -105 4 -378 -479 1.33 0.10 1.66 1.95Crashes by Control Type, Severity, and Year
ChangeFI PDO Total FI PDO Total Total
Estimated number of crashes 2013 2.2 3.5 5.6 0.8 1.3 2.1 -3.5during the Study Period, 2014 2.2 3.5 5.6 0.8 1.3 2.1 -3.5crashes: 2015 2.2 3.5 5.6 0.8 1.3 2.1 -3.5
Total: 6.5 10.5 16.9 2.4 4.0 6.3 -10.6
Output Summary
Sample DataJAB 12/22/2013 Urban
Number of Crashes Standard Deviation, crashes
Average Severity Index Standard Deviation
SeverityControl Type
Control Type
Year SignalMinor Road Stop
Figure 5. Output Summary Worksheet
The first section is titled Crash During the Study Period. This section lists the estimated average number of crashes for the existing and proposed intersections during the study period. It also lists the distribution of this total by crash type, control type, and crash severity categories. This section also lists the change in the estimated average number of crashes that would be realized following implementation of the proposed alternatives. The change in crash frequency associated with the change in traffic control type is also shown. It is calculated as “Change = Proposed control type – Existing control type.” A negative change corresponds to a reduction in crashes. This change is used in “Step 4” of the safety evaluation procedure (described in Chapter 3) to determine if overall intersection safety is improved.

Intersection Safety Evaluation: InSAT Guidebook 21
The right side of the first section lists the standard deviation of the estimated average number of crashes during the study period. This statistic is used to estimate the standardized change in crashes. This estimate is shown in the cells with the green background. If the standardized change in crashes exceeds 1.64, then the change is considered statistically significant (at a 0.10 level of significance).
The second section is titled Severity Index Analysis. This section computes a severity index for each combination of crash type, control type, and severity categories. It represents a single-valued indication of overall intersection safety, which reflects both the frequency and relative severity of different crash types in terms of crash cost. The last row of this section indicates the change in severity index associated with the signal installation. This change is used in “Step 5” of the safety evaluation procedure (described in Chapter 3) to determine if overall intersection safety is improved.
The standard deviation of the index values are shown on the right side of this section. The cells with the green background indicate the standardized change in index value associated with implementation of the proposed alternatives.
If either the change in crash frequency or severity index is determined to be significant, then the signal installation is determined to have made a change in overall intersection safety.
The third section is titled Crashes by Control Type, Severity, and Year. This section lists the estimated number of crashes (in total and by severity) for each year in the study period. InSAT can evaluate up to 24 consecutive years. The three years for which data are shown in Figure 5 correspond to the study period.
Detailed Output Worksheets The data in the detailed output worksheets are divided into the following sections.
• Crash Modification Factors.
• Average Crash Frequency.
o Fatal-and-Injury (FI) Crash Frequency.
o Property-Damage-Only (PDO) Crash Frequency.
o Crash Distribution.
• Intermediate Results.
• Traffic Data.
A portion of the Crash Modification Factors section is shown in Figure 6. Listed first are the CMFs that are used with the model that predicts fatal-and-injury (FI) crash frequency. Thereafter, the CMFs that are used with the model that predicts PDO crash frequency are listed.
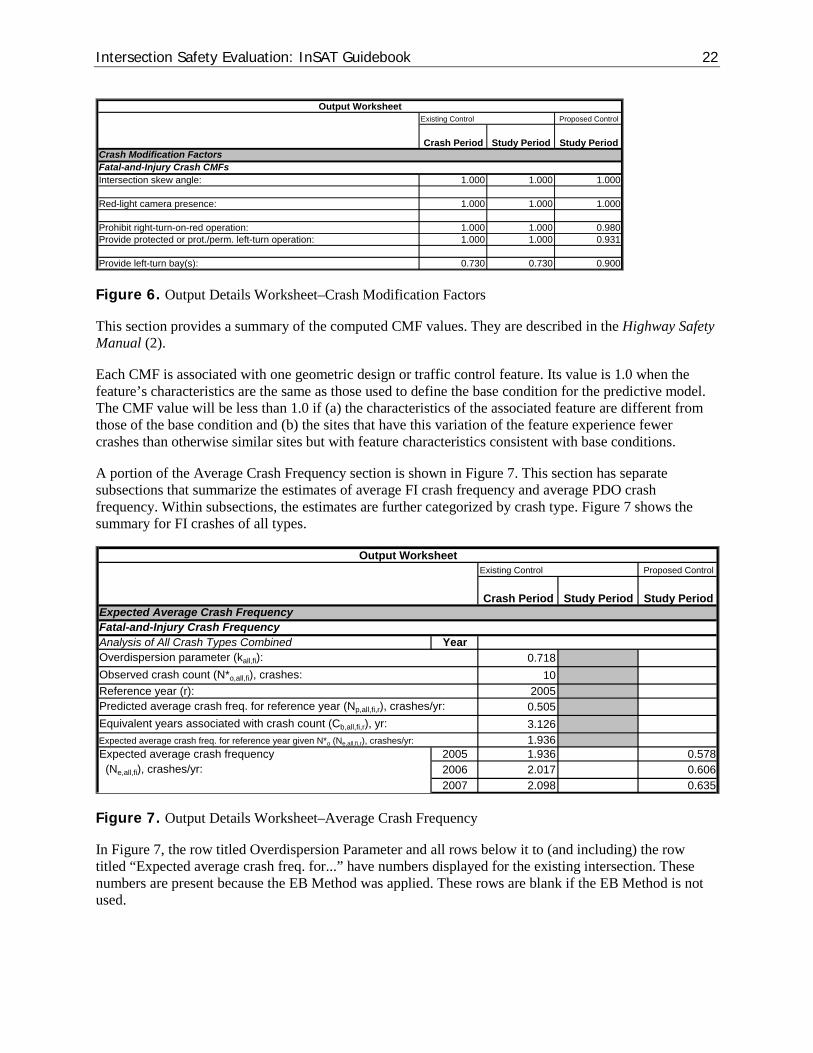
Intersection Safety Evaluation: InSAT Guidebook 22
Output Worksheet
Existing Control Proposed Control
Crash Modification FactorsFatal-and-Injury Crash CMFsIntersection skew angle: 1.000 1.000 1.000
Red-light camera presence: 1.000 1.000 1.000
Prohibit right-turn-on-red operation: 1.000 1.000 0.980Provide protected or prot./perm. left-turn operation: 1.000 1.000 0.931
Provide left-turn bay(s): 0.730 0.730 0.900
Study PeriodCrash Period Study Period
Figure 6. Output Details Worksheet–Crash Modification Factors
This section provides a summary of the computed CMF values. They are described in the Highway Safety Manual (2).
Each CMF is associated with one geometric design or traffic control feature. Its value is 1.0 when the feature’s characteristics are the same as those used to define the base condition for the predictive model. The CMF value will be less than 1.0 if (a) the characteristics of the associated feature are different from those of the base condition and (b) the sites that have this variation of the feature experience fewer crashes than otherwise similar sites but with feature characteristics consistent with base conditions.
A portion of the Average Crash Frequency section is shown in Figure 7. This section has separate subsections that summarize the estimates of average FI crash frequency and average PDO crash frequency. Within subsections, the estimates are further categorized by crash type. Figure 7 shows the summary for FI crashes of all types.
Output WorksheetExisting Control Proposed Control
Expected Average Crash FrequencyFatal-and-Injury Crash FrequencyAnalysis of All Crash Types Combined YearOverdispersion parameter (kall,fi): 0.718Observed crash count (N*o,all,fi), crashes: 10Reference year (r): 2005Predicted average crash freq. for reference year (Np,all,fi,r), crashes/yr: 0.505Equivalent years associated with crash count (Cb,all,fi,r), yr: 3.126Expected average crash freq. for reference year given N*o (Ne,all,fi,r), crashes/yr: 1.936Expected average crash frequency 2005 1.936 0.578 (Ne,all,fi), crashes/yr: (Np,all,fi), crashes/yr: 2006 2.017 0.606
2007 2.098 0.635
Study PeriodCrash Period Study Period
Figure 7. Output Details Worksheet–Average Crash Frequency
In Figure 7, the row titled Overdispersion Parameter and all rows below it to (and including) the row titled “Expected average crash freq. for...” have numbers displayed for the existing intersection. These numbers are present because the EB Method was applied. These rows are blank if the EB Method is not used.

Intersection Safety Evaluation: InSAT Guidebook 23
The last three rows in Figure 7 show the expected average crash frequency for each year if the EB Method is used. They show the predicted average crash frequency for each year if the EB Method is not used.
Only three years are shown in the figure; however, rows are provided in the worksheet to report estimates for 21 additional years. The three years for which estimates are shown in the figure correspond to the crash period. Estimates for the study period (i.e., 2013, to 2015) are not shown in the figure but were computed and provided in the worksheet.
A portion of the Crash Distribution section is shown in Figure 8. It is at the end of the Average Crash Frequency section. The distribution lists the average number of crashes by crash type. The estimates shown represent the sum for all years in the study period.
Output WorksheetExisting Control Proposed Control
Crash Distribution (during Study Period)Fatal-and-injury crash frequency Angle (N*e,ang,fi), crashes: 1.658 0.626
Rear-end (N*e,r-e,fi), crashes: 0.637 0.812Other (N*e,other,fi), crashes: 4.172 0.922Total (N*e,all,fi), crashes: 6.467 2.360
Property-damage-only crash freq. Angle (N*e,ang,pdo), crashes: 2.376 0.897Rear-end (N*e,r-e,pdo), crashes: 1.364 1.775Other (N*e,other,pdo), crashes: 6.715 1.283Total (N*e,all,pdo), crashes: 10.455 3.955
Total crash frequency (N*e,all,as), crashes: 16.922 6.315
Study PeriodCrash Period Study Period
Figure 8. Output Details Worksheet–Crash Distribution
A portion of the Traffic Data section is shown in Figure 9. It indicates the AADT value used in the computations for each year of the evaluation period. If an AADT value is entered (in the Input worksheet) for every year, then the values shown in this section will match those entered. However, if values are entered for only some of the years, then values for the other years will be estimated using the rules described in the section titled Step 3―Acquire Traffic Volume and Observed Crash Data. In this case, the values shown in this section are based on the AADTs shown in Figure 3 and the stated rules.
Output WorksheetExisting Control Proposed Control
Traffic Data YearMajor-Road Data 2005 15000 15000Annual average daily traffic (AADT) volume by year, veh/d: 2006 15500 15500
2007 16000 160002008 16000 160002009 16000 160002010 16000 160002011 16000 160002012 16000 160002013 16000 160002014 16000 160002015 16000 160002016 16000 16000
Study PeriodCrash Period Study Period
Figure 9. Output Details Worksheet–Traffic Data

Intersection Safety Evaluation: InSAT Guidebook 24
Chapter 3. Intersection Safety Evaluation Procedure
This chapter describes a procedure for intersection safety evaluation. The first section provides an overview of the safety evaluation procedure. The second section describes the procedure’s scope in terms of the geometric design elements and crash categories for which it is most applicable. The third section outlines the steps included in the procedure. The InSAT software tool was developed to automate the calculations associated with this procedure. A sample application of this procedure is provided in Appendix C.
PROCEDURE OVERVIEW The safety evaluation procedure is intended to provide: (1) an estimate of the safety of an existing two-way stop-controlled intersection, and (2) an estimate of the safety of this intersection if a traffic control signal were installed. By comparing these two estimates, some insight is obtained about the effect of the signal installation on traffic safety.
Safety Estimation The predictive methods in the Highway Safety Manual were used as the basis for the safety evaluation procedure (2). These methods can be used to estimate the average crash frequency of the intersection as one measure of traffic safety. Specific estimates can be obtained for a wide range of configurations, crash severity categories, and crash type categories. Each predictive method includes safety performance functions (SPFs) and crash modification factors (CMFs). The CMFs can be used to refine the estimate based on consideration of geometric elements and traffic control features that have a quantified effect on safety.
A second measure of traffic safety is road-user crash cost. This cost is computed by summing the product of average crash frequency and average cost per crash for each crash type and severity category. In this regard, it is recognized that a location with several severe crashes is considered less safe than a location with an equal number of crashes but none of which are severe.
Crash Categories Several safety performance measures are obtained through application of the procedure. Specifically, estimates of average crash frequency are obtained for two crash severity categories and three crash type categories. The severity categories are defined to include fatal-and-injury (FI) and property-damage-only (PDO) crashes. Injury crashes include all crashes with an incapacitating injury, non-incapacitating injury, or possible injury. This sensitivity to crash severity recognizes that a traffic control signal installation can cause a shift in the crash severity distribution (i.e., an increase in the percentage of PDO crashes). The need for this sensitivity was identified in the survey of practitioners and in discussions with the NCUTCD Signals Technical Committee.
The crash type categories typically influenced by signal installation include angle crashes and rear-end crashes. All other crash types are considered to be “other crashes.” This category includes all intersection-related crashes that are not angle or rear-end crashes. These crashes can be categorized as single-vehicle crashes or multiple-vehicle crashes. Single-vehicle crashes can involve a vehicle and a pedestrian, or a vehicle and a bicyclist. Angle crashes involve all crashes that occur at an angle and involve one or more vehicles on the major road and one or more vehicles on the minor road.

Intersection Safety Evaluation: InSAT Guidebook 25
The procedure’s sensitivity to crash type category recognizes that a traffic control signal installation can cause a shift in the crash type distribution. This tendency is acknowledged in the Manual on Uniform Traffic Control Devices (MUTCD), which indicates that only some crash types are susceptible to correction by signal installation (7). Angle crashes and rear-end crashes are the most common crash types to show a change in distribution proportions with the installation of a signal.
The proportion of left-turn-opposed crashes may also change if a left-turn phase is included in the signal installation. However, left-turn-opposed crashes tend to be reported differently among agencies, and are difficult for enforcement officers to identify in the field. Also, the Highway Safety Manual predictive methods do not specifically address left-turn-opposed crashes. For these reasons, the procedure does not explicitly address left-turn-opposed crashes.
Crash Severity Index The procedure uses a crash severity index as one safety performance measure. This index is based on a road-user crash cost estimate. The consideration of crash cost recognizes (1) that signal installation tends to influence the crash type and crash severity distributions, and (2) there are significant differences in severity associated with typical rear-end and angle crashes.
The conversion of crash frequency to annual crash cost is a rational and effective method for comprehensively assessing the effect of signal installation on safety. With this approach, the estimated crash frequency associated with each crash-type-and-severity category for the two-way stop-controlled intersection is converted into an annual crash cost. The estimated crash frequency for the proposed signalized intersection is converted in a similar manner. The difference in the annual crash costs for the existing and proposed intersections represents a single-valued indication of the change in safety associated with the signal installation.
The conversion of crash frequency into cost has some negative perception issues because it monetizes the value of human life. Nevertheless, it has been a viable basis for making investment decisions, and it is often an important component of engineering alternative analysis. Moreover, when it is used solely to provide a single-valued indication of a change in safety, the computed cost can be converted into a severity index value by dividing the cost by a constant and dropping the units of dollars from the resultant quantity. This unit-less severity index provides the same relative information as crash cost but without conveying the value placed on life and limb.
After conversion to signal control, an intersection can have an average crash frequency that is larger than that of the stop-controlled intersection prior to conversion, even with no change in traffic volume. This result can occur when the increase rear-end crashes exceeds the decrease in angle crashes associated with signal installation. However, the converted intersection may still be associated with a lower annual crash cost because rear-end crashes tend to have a lower severity and cost than angle crashes. In this regard, the conversion to signal control is still considered to have improved the safety of the intersection.
PROCEDURE SCOPE The safety evaluation procedure was developed to have a broad scope in terms of the types of intersection configurations that can be evaluated and the types of crashes considered. A broad scope was needed to ensure that the proposed crash experience warrant is applicable to most intersections. Table 2 identifies the scope elements.

Intersection Safety Evaluation: InSAT Guidebook 26
Table 2. Scope Elements for the Safety Evaluation Procedure
Element Conditions
Control types Two-way stop control converted to signal control
Area type Urban, rural
Major road through lanes 2, 4
Intersection legs (and travel directions) 3, 4 (each leg serves two-way traffic)
Crash severity categories Fatal and injury (FI), property damage only (PDO)
Crash type categories Angle, rear-end, other
Several of the scope elements are dictated by the capabilities of the Highway Safety Manual predictive methods. Notably, the number of through lanes on the major road is currently limited to a maximum of four by the Highway Safety Manual.
The geometry of the intersections considered is limited to three- and four-leg intersections where each intersection leg serves two-way traffic. This limitation is dictated by the Highway Safety Manual. It is primarily a concern for streets in downtown areas and at freeway interchanges. Intersections in these areas often include one or more legs that have one-way traffic flow. These configurations have a unique set of conflicting movements and conflict points that justify the development of separate SPFs (and possibly complete predictive methods).
The InSAT software tool has been developed to accept model coefficients for other combinations of legs and lanes. Entering these coefficients in InSAT will expand its scope to include a wider range of legs and lanes. The analyst can also enter coefficients in InSAT to support the evaluation of one-way streets. The analyst will need to obtain these coefficients from the analysis of crash data for the desired intersection combinations.
PROCEDURE STEPS The safety evaluation procedure consists of five steps. They are described in the following paragraphs.
Step 1. Assemble Input Data and Models. Determine whether the input data are available. These data are described in the Input Data Requirements section in Chapter 2. They are also listed in Table 3 of Appendix A.
Step 2. Estimate the Average Crash Frequency for the Existing Intersection. Use the SPFs and CMFs corresponding to the existing intersection to compute the predicted average crash frequency for the average stop-controlled intersection that is otherwise similar to the existing intersection. If crash data are provided, use the SPFs and CMFs with the EB Method (described in Appendix B) to compute the expected average crash frequency for the existing intersection.
One estimate of the average crash frequency (and its variance) is obtained for each of the following categories: FI angle crashes, FI rear-end crashes, FI other crashes, PDO angle crashes, PDO rear-end

Intersection Safety Evaluation: InSAT Guidebook 27
crashes, and PDO other crashes. Add all of these values to obtain an estimate of the total average crash frequency.
Compute the crash severity index for the existing intersection using the average crash frequency estimates and their corresponding crash costs. One index estimate (and its variance) is obtained for each of the aforementioned six categories. Add all of these values to obtain an estimate of the total severity index.
The InSAT software tool was developed to automate the calculations associated with this step.
Step 3. Estimate the Average Crash Frequency for the Intersection if a Signal was Installed. Use the SPFs and CMFs corresponding to the signalized intersection to compute the predicted average crash frequency for the average signalized intersection that is otherwise similar to the existing intersection.
One estimate of the average crash frequency (and its variance) is obtained for each of the following categories: FI angle crashes, FI rear-end crashes, FI other crashes, PDO angle crashes, PDO rear-end crashes, and PDO other crashes. Add all of these values to obtain an estimate of the total average crash frequency.
Compute the crash severity index for the signalized intersection using the average crash frequency estimates and their corresponding crash costs. One index estimate (and its variance) is obtained for each of the aforementioned six categories. Add all of these values to obtain an estimate of the total severity index.
The InSAT software tool was developed to automate the calculations associated with this step.
Step 4. Determine if there is a Significant Change in Crash Frequency due to Signal Installation. Using the total average crash frequency estimates from Steps 2 and 3, compute the change in total average crash frequency (i.e., average crash frequency change = estimated crash frequency from Step 3 – estimated crash frequency from Step 2). Compute the variance of the change in total average crash frequency (i.e., variance of change = variance from Step 3 + variance from Step 2).
Compare the change in total average crash frequency with the variance of this change to determine if the result is significantly significant. The statistical significance of the change in average crash frequency is determined by dividing it by the square root of the corresponding variance. The hypothesis in this test is that there is no change in safety. Hence, it is a two-tail test such that the absolute value of the computed ratio would need to exceed 1.64 (corresponding to a 0.10 significance level) to reject the hypothesis.
If there is a statistically significant change in the total average crash frequency, then the signal installation is very likely to have an effect on traffic safety. If the computed change is negative, then the signal installation is likely to improve safety. If the computed change is positive, then the signal installation is likely to degrade safety.
Note that if additional years of crash data are used with the EB method in Step 2, then the variance of the expected average crash frequency may be reduced, and a statistically significant result may be obtained.
The InSAT software tool was developed to automate the calculations associated with this step.
Step 5. Determine if there is a Net Safety Benefit Associated with the Signal Installation. The total severity indices from Steps 2 and 3 are used in this step to determine if there is a net safety benefit associated with the signal indication.

Intersection Safety Evaluation: InSAT Guidebook 28
Using the total severity index estimates from Steps 2 and 3, compute the change in the total severity index (i.e., index change = index from Step 3 – index from Step 2). Compute the variance of the total severity index change (i.e., variance of change = variance from Step 3 + variance from Step 2).
Compare the index change with the variance of this change to determine if the result is significantly significant. The statistical significance of the index change is determined by dividing it by the square root of the corresponding variance. The hypothesis in this test is that there is no change in safety. Hence, it is a two-tail test such that the absolute value of the computed ratio would need to exceed 1.64 (corresponding to a 0.10 significance level) to reject the hypothesis.
If there is a statistically significant change in the total severity index, then the signal installation is very likely to have an effect on traffic safety. If the computed index change is negative, then the signal installation is likely to provide a net safety benefit. If the computed index is positive, then the signal installation is likely to cause a net safety dis-benefit.
The InSAT software tool was developed to automate the calculations associated with this step.
If neither the change in total average crash frequency nor the change in total severity index is statistically significant, then the safety effect of signalization is not known with sufficient degree of certainty to be the sole basis for the decision to install a signal. In this case, other factors and signal impacts (e.g., operations) will need to be evaluated to determine if signal installation is justified.
Intersection Safety Evaluation: InSAT Guidebook 29
Chapter 4. References
(1) Bonneson, J., K. Laustsen, L. Rodegerdts, and S. Beaird. Crash Experience Warrant for Traffic Signals. Final Report. NCHRP Project 07-18. TRB, National Academies of Science, Washington, D.C., April 2014.
(2) Highway Safety Manual, 1st Edition. American Association of State Highway and Transportation Officials, Washington, D.C., 2010.
(3) Hauer, E. Observational Before-After Studies in Road Safety. Pergamon Press, Elsevier Ltd., Oxford, United Kingdom, 1997.
(4) Council, F., E. Zaloshnja, T. Miller, and B. Persaud. Crash Cost Estimates by Maximum Police-Reported Injury Severity within Selected Crash Geometries. Report FHWA-HRT-05-051. Federal Highway Administration, Washington, D.C., 2005.
(5) Traffic Control Devices Handbook. J. Pline, Ed. Institute of Transportation Engineers, Washington, D.C., 2001.
(6) Srinivasan, R.., D. Carter, K. Eccles, B. Persaud, N. Lefler, C. Lyon, and R. Amjadi. Safety Evaluation of Flashing Beacons at STOP-Controlled Intersections. Report No. FHWA-HRT-08-044. Federal Highway Administration, U.S. Department of Transportation, Washington, D.C., 2008.
(7) Manual on Uniform Traffic Control Devices. Federal Highway Administration, U.S. Department of Transportation, Washington, D.C., 2009.
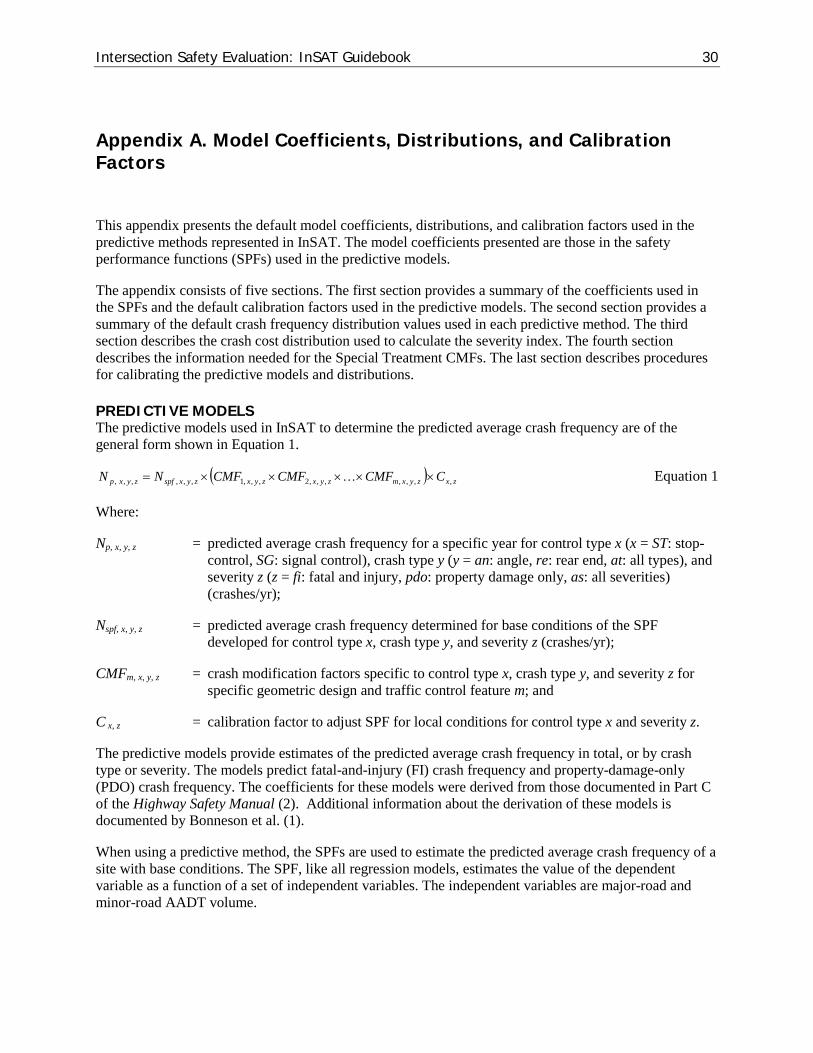
Intersection Safety Evaluation: InSAT Guidebook 30
Appendix A. Model Coefficients, Distributions, and Calibration Factors
This appendix presents the default model coefficients, distributions, and calibration factors used in the predictive methods represented in InSAT. The model coefficients presented are those in the safety performance functions (SPFs) used in the predictive models.
The appendix consists of five sections. The first section provides a summary of the coefficients used in the SPFs and the default calibration factors used in the predictive models. The second section provides a summary of the default crash frequency distribution values used in each predictive method. The third section describes the crash cost distribution used to calculate the severity index. The fourth section describes the information needed for the Special Treatment CMFs. The last section describes procedures for calibrating the predictive models and distributions.
PREDICTIVE MODELS The predictive models used in InSAT to determine the predicted average crash frequency are of the general form shown in Equation 1.
( ) zxzyxmzyxzyxzyxspfzyxp CCMFCMFCMFNN ,,,,,,,2,,,1,,,,,, ×××××=
Where:
Np, x, y, z = predicted average crash frequency for a specific year for control type x (x = ST: stop-control, SG: signal control), crash type y (y = an: angle, re: rear end, at: all types), and severity z (z = fi: fatal and injury, pdo: property damage only, as: all severities) (crashes/yr);
Nspf, x, y, z = predicted average crash frequency determined for base conditions of the SPF developed for control type x, crash type y, and severity z (crashes/yr);
CMFm, x, y, z = crash modification factors specific to control type x, crash type y, and severity z for specific geometric design and traffic control feature m; and
C x, z = calibration factor to adjust SPF for local conditions for control type x and severity z.
The predictive models provide estimates of the predicted average crash frequency in total, or by crash type or severity. The models predict fatal-and-injury (FI) crash frequency and property-damage-only (PDO) crash frequency. The coefficients for these models were derived from those documented in Part C of the Highway Safety Manual (2). Additional information about the derivation of these models is documented by Bonneson et al. (1).
When using a predictive method, the SPFs are used to estimate the predicted average crash frequency of a site with base conditions. The SPF, like all regression models, estimates the value of the dependent variable as a function of a set of independent variables. The independent variables are major-road and minor-road AADT volume.
Equation 1

Intersection Safety Evaluation: InSAT Guidebook 31
The range of AADT volumes for which the SPFs in InSAT are applicable is documented in Part C of the Highway Safety Manual (2). Application of the SPFs to intersections with AADT volumes substantially outside these ranges may not provide reliable results.
The SPFs for crashes at intersections are presented using the following equation.
( )]ln[]ln[exp,,, inormmajorzyxspf AADTcAADTcbaN ×+××+=
Where:
AADTmajor = AADT volume for the major road (both directions combined) (veh/day);
AADTminor = AADT volume for the minor road (both directions combined) (veh/day); and
a, b, c = regression coefficients.
The coefficients for each SPF are listed in the Calibration Factors worksheet. A portion of this worksheet is shown in Figure 10. The coefficients for 6 SPFs are shown. They apply to the SPFs for rural FI crashes at minor-road stop-controlled intersections in rural areas. Equation 2 is replicated in the heading of this figure to confirm the SPF model structure and the representation of each coefficient in the SPF.
Fatal-and-Injury Crash Frequency Models Model: exp(a + b ln[AADT major ] + c ln[AADT minor ]) Fc C
Rural 3 Minor road stop 2 All types -10.739 0.790 0.490 0.531 1.00(two-way Angle -12.030 0.790 0.490 1.377 1.00roads) Rear-end -12.087 0.790 0.490 0.927 1.00
4 All types -12.664 1.107 0.272 0.569 1.00Angle -13.661 1.107 0.272 1.163 1.00Rear-end -14.062 1.107 0.272 0.782 1.00
SPF Coefficients and Calibration Factors
a b c Overdisp. (k )Crash Type Calib.
Factor (C )Area Type Legs Control Type Major-Road
Through Lanes
Figure 10. Default SPF Coefficients and Calibration Factors
Figure 10 shows only a few of the SPF coefficients identified in the Calibration Factors worksheet. The following list identifies all of the SPF combinations for intersections included in the Calibration Factors worksheet. Default coefficient values are provided in InSAT for 84 SPFs that are represented by these combinations.
• Severity: fatal-and-injury, property-damage-only.
• Area type: rural, urban.
• Number of intersection legs: 3, 4.
• Control type: minor-road stop, signalized.
• Major-road through lanes: 2, 4.
Default coefficients are also provided for two SPFs for predicting pedestrian crashes at urban signalized intersections.
CRASH FREQUENCY DISTRIBUTION Default distributions of crash frequency by time period (i.e., nighttime, daytime) are included in InSAT. This distribution is used to estimate the CMF for lighting presence. Separate distributions are provided for
Equation 2

Intersection Safety Evaluation: InSAT Guidebook 32
each combination of area type, intersection legs, and major-road through lanes. The values for this distribution were obtained from Part C of the Highway Safety Manual (2).
The crash distributions by time period are listed in the Calibration Factors worksheet. This distribution is shown in Figure 11. Separate distributions are provided for rural and urban sites; however, the figure only shows those values for rural areas. Cells for which values are not shown are not needed for Version 1 of the InSAT software because CMFs for lighting presence are only available for the combinations shown.
Note: data for the blank yellow cells are not used in this version of the software (i.e., these data do not need to be provided).
FI PDO FI PDORural 3 2 Occur at night 0.260 0.260
(2-way rd) 4 Occur at night 0.276 0.2764 2 Occur at night 0.286 0.286 0.244 0.244
(2-way rd) 4 Occur at night 0.273 0.273Urban 4 1 Occur at night
(one-way 2 Occur at nightstreets) 3 Occur at night
3 2 Occur at night 0.235 0.235 0.238 0.238(two-way 4 Occur at night 0.235 0.235 0.238 0.238streets) 6 Occur at night
4 2 Occur at night 0.235 0.235 0.229 0.229(two-way 4 Occur at night 0.235 0.235 0.229 0.229streets) 6 Occur at night
Crash Distribution Proportions
Area Type Legs Major-Road
Through Lanes Crash Type CategoryProportion of Crashes by Control Type and Severity Level
Signal Minor Road Stop
Figure 11. Default Crash Distribution by Time Period
CRASH COST DISTRIBUTION The severity index reported in InSAT represents a single-valued indication of overall intersection safety which reflects both the frequency and relative severity of different crash types in terms of crash cost. The costs used to compute the index are based on estimates developed by Council et al. (4). This report identifies crash costs for several crash types and severities, including FI angle, FI rear-end, PDO angle, PDO rear-end, and FI vehicle-pedestrian crashes. These costs are listed in Figure 12.
FI PDO FI PDO50 mi/h or more Angle (crossing paths) 126,878 8,544 199,788 5,444
Rear-end 52,276 5,901 34,563 3,788Other 164,041 5,337 201,282 5,795Vehicle-pedestrian 183,461 183,461
45 mi/h or less Angle (crossing paths) 64,468 8,673 80,956 7,910Rear-end 44,687 11,463 56,093 12,295Other 121,665 5,641 113,088 5,583Vehicle-pedestrian 169,090 169,090
Crash Cost Index
Crash Type CategoryCrash Cost by Control Type and Severity LevelSignal Minor Road StopSpeed Limit, mi/h
Figure 12. Default Crash Cost Distribution
The cost for the “Other” crash category includes the cost of vehicle-animal, fixed-object, parked-vehicle, rollover, sideswipe, and head-on crashes. This cost was computed as a weighted average of the crash cost for each crash type, where the weight used was the proportion of crashes associated with the specified crash type. Typical proportions for these other crash types are provided in the crash type distributions in the Highway Safety Manual Part C chapters (2).
The magnitude of the costs in Figure 12 are likely to increase over time, but it is the relative difference among crash types and severity categories that will have the strongest influence on whether the change in

Intersection Safety Evaluation: InSAT Guidebook 33
index value is statistically significant. For this reason, updating these costs is not required unless the distribution of costs among crash types and severity categories is known to have changed.
SPECIAL TREATMENT CRASH MODIFICATION FACTORS InSAT allows the use of analyst-provided CMFs. These factors must be provided by the analyst, and entered in the Calibration Factors worksheet. Factor values can be provided for one or two treatments.
The supplemental CMF values are applied by InSAT to the predicted crash frequency for the entire intersection (even though the treatment may be applied to just one or two intersection legs). Therefore, the values entered values must be verified by the analyst to be applicable to the adjustment of predicted “intersection crashes,” as opposed to crashes predicted for a specific intersection leg or road.
In general, the analyst will need to use his/her judgment when, for a given treatment, there is not a known CMF value for each of the crash severity and type combinations identified in the Calibration Factors worksheet. If a treatment is not expected to have an effect on a specific crash type, then the corresponding CMF can be estimated as 1.0. If a CMF is known for “all types and severities” and it is believed to equally influence all types and severities, then the all-crash CMF value can be entered for each crash-type-and-severity-specific CMF value.
The analyst must verify that the supplemental CMFs entered in InSAT correspond to treatments that are not already represented by the base conditions of the predictive models used in InSAT. The base conditions for the models in InSAT (for which default coefficients are provided) are described in Part C of the Highway Safety Manual (2).
CALIBRATION FACTORS The predictive models in InSAT were developed from the models described in Part C of the Highway Safety Manual (2). The Highway Safety Manual models were developed from the most complete and consistent data sets available. However, the general level of crash frequencies may vary substantially from one jurisdiction to another for a variety of reasons including climate, driver populations, animal populations, crash reporting thresholds, and crash reporting system procedures. Therefore, for these predictive models to provide results that are meaningful and accurate for each jurisdiction, it is important that they be calibrated for application in the jurisdiction in which they are applied.
The default regression coefficients used in InSAT have been determined through extensive research. Modification of these coefficients is not recommended.
A procedure for determining the local calibration factor for each predictive model is presented in the next subsection. A procedure for deriving jurisdiction-specific distribution values is presented in the second subsection.
Predictive Model Calibration Procedure The calibration procedure is used to derive the value of the local calibration factor that is included in each predictive model. A calibration factor represents the ratio of the total observed number of crashes for a selected set of sites to the total predicted number of crashes for the same sites, during the same time period, using the applicable predictive model. Thus, the nominal value of the calibration factor is 1.00 when the observed and predicted number of crashes happens to be equal. When there are more crashes observed than are predicted by the predictive model, the computed calibration factor will be greater than 1.00. When there are fewer crashes observed than are predicted by the predictive model, the computed calibration factor will be less than 1.00.

Intersection Safety Evaluation: InSAT Guidebook 34
It is recommended that new values of the calibration factors be derived at least every two to three years, and some analysts may prefer to develop calibration factors on an annual basis. The calibration factor for the most recent available period is to be used for all assessments of proposed future projects.
If the procedure described in the next subsection is used to calibrate default distribution, then the locally-calibrated values should be used in the calibration process described in this subsection.
Step 1—Identify the predictive models to be calibrated. Calibration is performed separately for logical groups of the predictive models in InSAT. These groups are established to balance the effort required for local calibration with the improved reliability of the predicted values. The following list identifies the combinations of crash frequency and traffic control type used to form the predictive model groups for which a calibration factor can be provided:
• Fatal-and-injury crashes for intersections with stop control on the minor road.
• Fatal-and-injury crashes for intersections with signal control.
• Property-damage-only crashes for intersections with stop control on the minor road.
• Property-damage-only crashes for intersections with signal control.
Also established in this step is the calibration period. A calibration period longer than three years is not recommended because the average crash frequency is likely to change over time. The calibration period should have a duration that is a multiple of 12 months to avoid seasonal effects. For ease of application, it is recommended that the calibration periods consist of one, two, or three full calendar years. It is recommended to use the same calibration period for all sites, but exceptions may be made where necessary.
Step 2—Select sites for calibration of the predictive model. Calibration sites are selected during this step. One set of calibration sites is assembled for each predictive model group identified in Step 1. A given site may be included in more than one set provided that all sites in the set are consistent with the group’s calibration factor characteristics (as identified in Step 1). It is desirable that these sites be reasonably representative of the range of site characteristics to which the predictive model group will be applied. However, no formal stratification by traffic volume or other site characteristics is needed in selecting the calibration sites. As such, the sites can be selected in a manner to make the data collection needed for Step 3 as efficient as practical.
Each calibration site should be selected without regard to the number of crashes reported during the calibration period. In other words, calibration sites should not be selected to intentionally limit the calibration database to include only sites with either high or low crash frequencies. Where practical, this may be accomplished by selecting calibration sites randomly from a larger set of candidate sites.
The desirable minimum sample size for the calibration database for one model group is 30 to 50 sites.
For large jurisdictions, such as entire states, with a variety of topographical and climate conditions, it may be desirable to assemble a separate set of calibration sites representing two or three different conditions. In this manner, separate calibration factors are developed for each specific terrain type or geographical region for a given predictive model group. For example, a state with distinct plains and mountain regions (or with distinct dry and wet regions), might choose to develop separate calibration factors for those regions. Where separate calibration factors are developed by terrain type or region, this needs to be done consistently for all predictive model groups applicable to those regions.
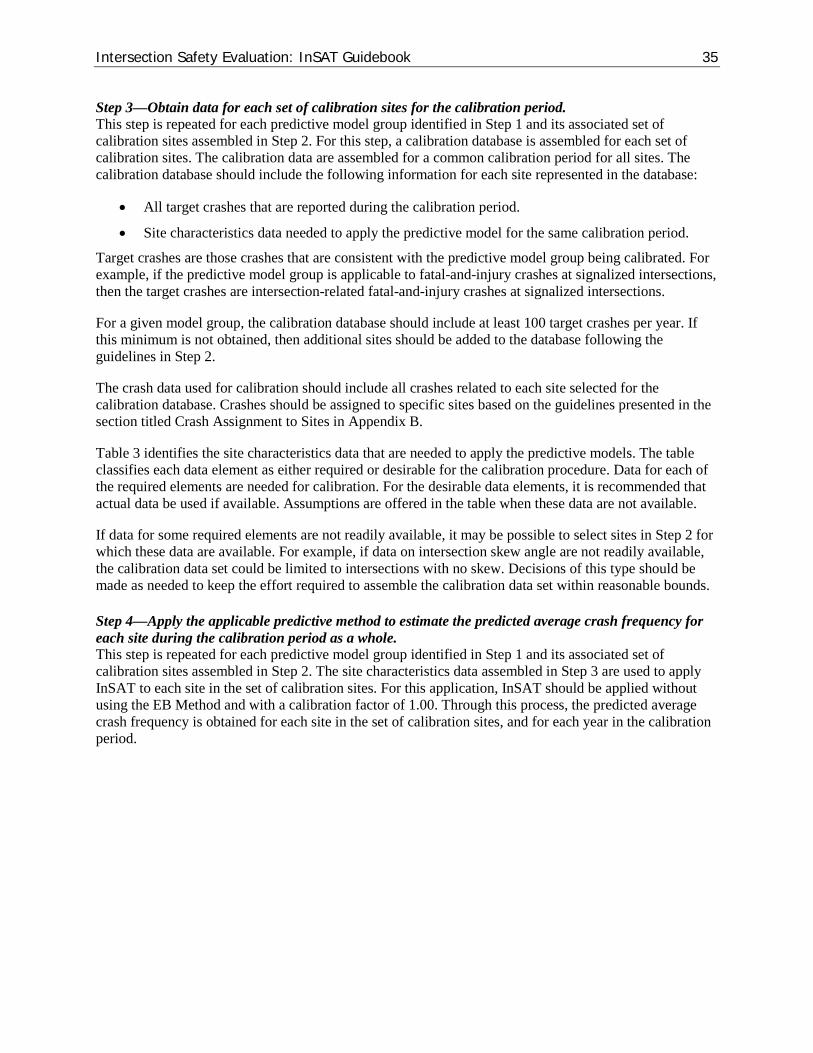
Intersection Safety Evaluation: InSAT Guidebook 35
Step 3—Obtain data for each set of calibration sites for the calibration period. This step is repeated for each predictive model group identified in Step 1 and its associated set of calibration sites assembled in Step 2. For this step, a calibration database is assembled for each set of calibration sites. The calibration data are assembled for a common calibration period for all sites. The calibration database should include the following information for each site represented in the database:
• All target crashes that are reported during the calibration period.
• Site characteristics data needed to apply the predictive model for the same calibration period.
Target crashes are those crashes that are consistent with the predictive model group being calibrated. For example, if the predictive model group is applicable to fatal-and-injury crashes at signalized intersections, then the target crashes are intersection-related fatal-and-injury crashes at signalized intersections.
For a given model group, the calibration database should include at least 100 target crashes per year. If this minimum is not obtained, then additional sites should be added to the database following the guidelines in Step 2.
The crash data used for calibration should include all crashes related to each site selected for the calibration database. Crashes should be assigned to specific sites based on the guidelines presented in the section titled Crash Assignment to Sites in Appendix B.
Table 3 identifies the site characteristics data that are needed to apply the predictive models. The table classifies each data element as either required or desirable for the calibration procedure. Data for each of the required elements are needed for calibration. For the desirable data elements, it is recommended that actual data be used if available. Assumptions are offered in the table when these data are not available.
If data for some required elements are not readily available, it may be possible to select sites in Step 2 for which these data are available. For example, if data on intersection skew angle are not readily available, the calibration data set could be limited to intersections with no skew. Decisions of this type should be made as needed to keep the effort required to assemble the calibration data set within reasonable bounds.
Step 4—Apply the applicable predictive method to estimate the predicted average crash frequency for each site during the calibration period as a whole. This step is repeated for each predictive model group identified in Step 1 and its associated set of calibration sites assembled in Step 2. The site characteristics data assembled in Step 3 are used to apply InSAT to each site in the set of calibration sites. For this application, InSAT should be applied without using the EB Method and with a calibration factor of 1.00. Through this process, the predicted average crash frequency is obtained for each site in the set of calibration sites, and for each year in the calibration period.
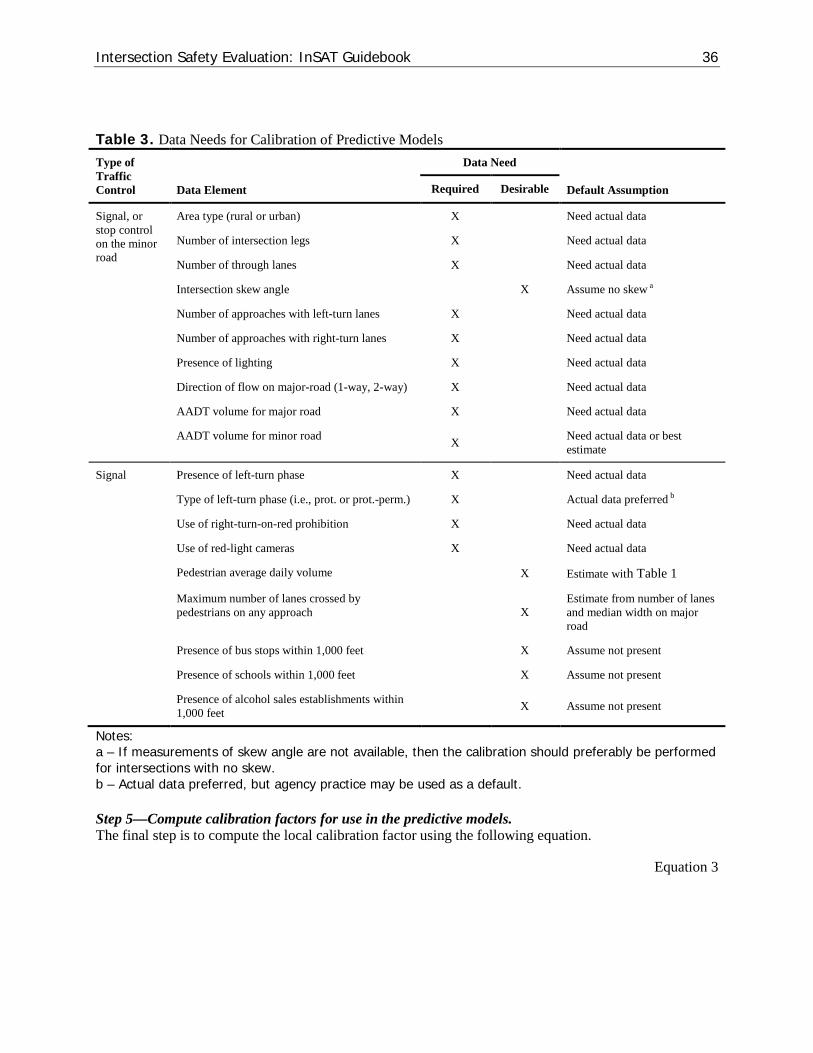
Intersection Safety Evaluation: InSAT Guidebook 36
Table 3. Data Needs for Calibration of Predictive Models Type of Traffic Control Data Element
Data Need
Default Assumption Required Desirable
Signal, or stop control on the minor road
Area type (rural or urban) X Need actual data
Number of intersection legs X Need actual data
Number of through lanes X Need actual data
Intersection skew angle X Assume no skew a
Number of approaches with left-turn lanes X Need actual data
Number of approaches with right-turn lanes X Need actual data
Presence of lighting X Need actual data
Direction of flow on major-road (1-way, 2-way) X Need actual data
AADT volume for major road X Need actual data
AADT volume for minor road X Need actual data or best estimate
Signal Presence of left-turn phase X Need actual data
Type of left-turn phase (i.e., prot. or prot.-perm.) X Actual data preferred b
Use of right-turn-on-red prohibition X Need actual data
Use of red-light cameras X Need actual data
Pedestrian average daily volume X Estimate with Table 1
Maximum number of lanes crossed by pedestrians on any approach X
Estimate from number of lanes and median width on major road
Presence of bus stops within 1,000 feet X Assume not present
Presence of schools within 1,000 feet X Assume not present
Presence of alcohol sales establishments within 1,000 feet X Assume not present
Notes: a – If measurements of skew angle are not available, then the calibration should preferably be performed for intersections with no skew. b – Actual data preferred, but agency practice may be used as a default.
Step 5—Compute calibration factors for use in the predictive models. The final step is to compute the local calibration factor using the following equation.
Equation 3

Intersection Safety Evaluation: InSAT Guidebook 37
∑∑
∑∑
==
===c
c
n
jjzixp
sitesall
i
n
jjzixo
sitesall
izx
N
NC
1,),(,
1
1,),(,
1,
Where:
C x z = calibration factor to adjust SPF for local conditions for control type x (x = ST: stop-control, SG: signal control) and severity z (z = fi: fatal and injury, pdo: property damage only, as: all severities);
No, x(i), z, j = observed crash frequency for site i and year j (includes control type x(i) for severity z) (crashes/yr);
Np, x(i), z, j = predicted average crash frequency for site i and year j (includes control type x(i) for severity z) (crashes/yr); and
nc = number of years in the crash period (yr).
The computation is performed separately for each predictive model group identified in Step 1. The computed calibration factor is rounded to two decimal places for application in InSAT.
Distribution Value Replacement Procedure Figure 11 identifies the default distribution of crash frequency by time period that is used in InSAT. The default distribution values provided in this table were developed from the most complete and consistent databases available. If desired, these default values may be replaced with locally-derived values. This replacement is optional, but it may yield more reliable results. The distribution is located in the Calibration Factors worksheet.
Any replacement values derived with the procedures presented in this section should be incorporated in the predictive models before the calibration described in the previous section is performed.
The default distribution is categorized by two crash severity levels (i.e., fatal-and-injury, property-damage-only), two area types (i.e., rural, urban), number of intersection legs, and number of major-road through lanes. As a result, any one distribution represents a joint distribution of these variables. Each combination of given area type, number of intersection legs, and number of through lanes defines one distribution for which calibration data are needed. Sufficient data for calibrating one distribution requires a set of sites that have collectively experienced at least 200 crashes during a recent one- to three-year period.
The 200 crashes represented in the distribution must match the description of the distribution, as identified in Figure 11. For example, if the distribution of crashes for rural, three-leg intersections with two through lanes crashes is being calibrated, then 200 crashes at rural, three-leg intersections with two through lanes must be represented in the calibration data.

Intersection Safety Evaluation: InSAT Guidebook 38
Appendix B. Empirical Bayes Method
The empirical Bayes (EB) Method is used to combine the estimate from a predictive model with observed crash data to obtain a more reliable estimate of the expected average crash frequency. The development of the EB Method described in this appendix is documented by Hauer (3). It is implemented in InSAT when the analyst provides the necessary crash data and indicates its availability in the Main worksheet.
The EB Method improves the reliability of the estimate of expected average crash frequency by pooling the estimate from a predictive model with the subject site’s observed crash data. The model estimate describes the safety of the typical site with attributes matching those of the subject site. However, it has some level of statistical uncertainty due to unexplained differences among the set of similar sites used to calibrate the predictive model. Similarly, an average crash frequency computed from crash data has uncertainty because of the random variability inherent to crash data. The EB Method produces an estimate of the expected average crash frequency that combines the model prediction and the site-specific crash data in proportion to the level of certainty that can be attached to each.
This appendix consists of three sections. The first section describes criteria for determining whether the analyst should apply the EB Method to evaluate a particular project or site. The second section describes the EB Method. The third section describes a procedure for assigning crashes to individual sites.
EB METHOD APPLICATION CRITERIA The applicability of the EB Method to a particular project depends on the type of analysis being performed and the type of future project work that is anticipated. If the analysis is being performed to evaluate the safety of an existing project, then the EB Method should be applied.
If a future project is being planned, then the nature of that future project should be considered in deciding whether to apply the EB Method. Specifically, the EB Method should be applied for the analyses involving the following future project types.
• Projects in which the roadway cross section is modified but the basic number of through lanes remains the same. This could include projects for which lanes or shoulders were widened or the roadside was improved.
• Projects in which minor changes in alignment are made, such as flattening individual horizontal curves, while leaving most of the alignment intact.
• Any combination of the above improvements.
The EB Method is not applicable to the following types of improvements.
• Projects in which a new alignment is developed for a substantial proportion of the project length.
• Intersections at which the basic number of intersection legs is changed as part of a project.
The reason that the EB Method is not used for the two improvement types in the previous list is that the observed crash data for a previous time period is not necessarily indicative of the crash experience that is likely to occur after a major geometric improvement.

Intersection Safety Evaluation: InSAT Guidebook 39
The methods used in InSAT are developed specifically to support the evaluation of an existing intersection and an alternative for this intersection where a change in traffic control type is proposed (e.g., install signal). The EB Method is used to evaluate the existing intersection. In contrast, the EB Method is not used to evaluate the proposed alternative because the crash experience of the existing intersection is not indicative of the crash experience that is likely to occur at the intersection after the change in traffic control type.
If alternative improvements are being evaluated for a given project and the EB Method is being considered, then the EB Method will need to be consistently applied to the existing intersection for all alternatives being evaluated. This approach recognizes that there is typically a small difference in the results obtained from the predictive method when it is used with and without the EB Method. If the EB Method is not applied consistently, such differences will likely introduce a small bias in the comparison of expected crash frequency among alternatives.
In addition to the above criteria, InSAT requires that the crash record system include information that can be used to categorize crashes as fatal-or-injury or as PDO. If this requirement is met, then the EB Method can be used.
VARIATIONS OF THE EB METHOD If the EB Method is determined to be applicable to a given project, then it should be determined whether observed crash data are available directly from the jurisdiction’s crash record system, or indirectly from another source. At least two years of observed crash data are desirable to apply the EB Method.
Two variations of the EB Method are available. They are the site-specific EB Method and the project-level EB Method. The site-specific EB Method is used in InSAT because the analysis is focused on one intersection. The project-level EB Method is used for large projects that include several road segments, and possibly the intersections along these segments. Additional information about this method is provided in Part C of the Highway Safety Manual (2).
CRASH ASSIGNMENT TO SITES The predictive methods in InSAT have been developed to estimate the expected average crash frequency for intersections. To be consistent with this model basis, observed crashes must be differentiated and assigned as either intersection-related crashes or segment-related crashes.
General Guidance for Assigning Crashes to Segments and Intersections Intersection crashes include crashes that occur at an intersection (i.e., within the curb limits) and crashes that occur on the intersection legs and are intersection related. All crashes that are not classified as intersection or intersection-related crashes are considered to be segment-related crashes.
Figure 13 illustrates the method used to assign crashes to segments or intersections. As shown, all crashes that occur within the curb line limits of an intersection (i.e., Region A) are assigned to that intersection.
Crashes that occur outside the curb line limits of an intersection (i.e., Region B) are assigned to either the segment on which they occur or an intersection, depending on their characteristics. Region B represents the roadway between two intersections. Crashes that are classified on the crash report as intersection-related or have characteristics consistent with an intersection-related crash are assigned to the intersection to which they are related; such crashes would include rear-end crashes related to queues on an intersection approach. Crashes that occur between intersections and are not related to an intersection are assigned to the roadway segment on which they occur.
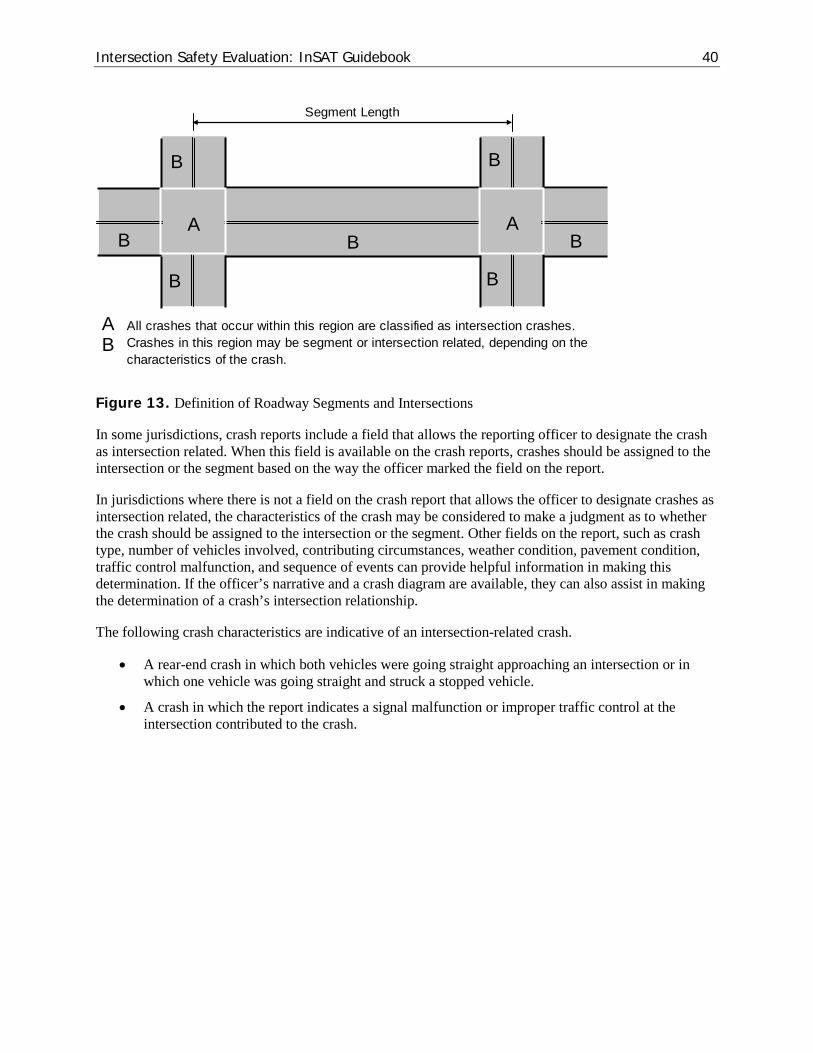
Intersection Safety Evaluation: InSAT Guidebook 40
Segment Length
All crashes that occur within this region are classified as intersection crashes.Crashes in this region may be segment or intersection related, depending on the characteristics of the crash.
BA
A AB
B
B
B
B
B B
Figure 13. Definition of Roadway Segments and Intersections
In some jurisdictions, crash reports include a field that allows the reporting officer to designate the crash as intersection related. When this field is available on the crash reports, crashes should be assigned to the intersection or the segment based on the way the officer marked the field on the report.
In jurisdictions where there is not a field on the crash report that allows the officer to designate crashes as intersection related, the characteristics of the crash may be considered to make a judgment as to whether the crash should be assigned to the intersection or the segment. Other fields on the report, such as crash type, number of vehicles involved, contributing circumstances, weather condition, pavement condition, traffic control malfunction, and sequence of events can provide helpful information in making this determination. If the officer’s narrative and a crash diagram are available, they can also assist in making the determination of a crash’s intersection relationship.
The following crash characteristics are indicative of an intersection-related crash.
• A rear-end crash in which both vehicles were going straight approaching an intersection or in which one vehicle was going straight and struck a stopped vehicle.
• A crash in which the report indicates a signal malfunction or improper traffic control at the intersection contributed to the crash.

Intersection Safety Evaluation: InSAT Guidebook 41
Appendix C. Sample Application
This appendix provides a sample application of the safety evaluation procedure using InSAT. The sample application is intended to illustrate how to use InSAT to evaluate a typical intersection. This application illustrates how the InSAT tool can be used to evaluate the safety of a rural intersection with two-way stop control (TWSC).
The subject intersection has been identified as having some potential safety issues. An initial evaluation indicates that it satisfies the MUTCD’s Crash Experience Warrant (7). As a result, one alternative that is being considered is conversion to signal control. A second alternative being considered is to retain the existing control and add flashing beacons. Installing flashing beacons at the intersection is one of the alternatives to installing a traffic signal recommended in the Traffic Control Devices Handbook (5).
The intersection is a four-legged, rural intersection with stop control on the minor-road approaches, as shown in Figure 14. The major road has two through lanes, a 14-foot median, and turn bays for the left-turn and right-turn movements. The minor road has two through lanes, no median, and no turn bays. The two intersecting roadways have a 20 degree skew angle.
Figure 14. Existing Intersection Geometry
Crash data are available for the intersection from the years 2006 through 2010. Annual average daily traffic (AADT) volume data are available for years 2006 and 2008. The major-road AADT for 2006 and 2008 is 9,000 and 10,000 veh/d, respectively. The minor-road AADT for 2006 and 2008 is 1,000 and 1,200 veh/d, respectively. The AADT on the major road is expected to increase to 12,000 veh/d by 2015. Similarly, the AADT on the minor road is expected to increase to 1,400 veh/d by 2015.

Intersection Safety Evaluation: InSAT Guidebook 42
INSTALL SIGNAL ALTERNATIVE This section describes the data entry for the subject intersection. It also describes the data entry for the intersection after a proposed traffic control signal is installed.
Input Data The Main worksheet is initially used to describe the intersection setting and crash data availability. The data entry cells in the sections titled General Information and Crash Data Description are shown in Figure 15. As indicated in the figure, the area type is rural, the analysis period includes the years 2013 to 2015, and crash data are provided for the years 2006 through 2010.
General InformationProject description:Analyst: Date: Area type:First year of analysis: 2013Last year of analysis: 2015 .Crash Data DescriptionIndicate if crash data .will be provided: First year of crash data: 2006 Last year of crash data: 2010
Program Control1. Enter data in the Main and Input worksheets.2. Click Perform Calculations button to start calculation process.
3. Review results in the Output Summary worksheet. Optionally, click the Print button to print the summary worksheet.4. Optionally, detailed results can be reviewed in the Output Details worksheets.
Intersection Safety Analysis Tool (InSAT)
Safey evaluation of rural intersectionKML 12/26/2013 Rural
Crash data provided
Perform Calculations Print Results (optional)
Figure 15. Main Worksheet – General Information and Crash Data Description
The Input worksheet is used to describe the intersection geometry and traffic control data. The data entry cells in the sections titled Basic Intersection Data, Alignment Data, and Traffic Control Data are shown in Figure 16. The first data entry column describes the existing intersection during the years associated with the crash data. The second column describes the intersection as it is envisioned to operate during the study period. The third column describes intersection with the proposed traffic control signal (i.e., the “install signal” alternative) during the study period.
The existing intersection had four legs during the years associated with the crash period. It is expected to retain four legs during the study period. After the proposed signal installed, the intersection will also have four legs. Two lanes served through vehicles on each road during the crash period, one lane for each travel direction. No changes are envisioned to the number of lanes for the study period. The intersection skew angle has been 20 degrees since 2005. It is not expected to change for the study period.
The cells in the Traffic Control Data section have a white background which indicates that these input data are not used for the evaluation of four-leg rural intersections. This condition stems from InSAT’s use of the predictive models in the Highway Safety Manual (2). The Highway Safety Manual models for four-leg rural intersections do not include crash modification factors that are associated with these input data. A similar treatment is applied to other data input cells (i.e., they have white background) when they are not used by the Highway Safety Manual model that applies to the subject intersection.

Intersection Safety Evaluation: InSAT Guidebook 43
Input Worksheet
Existing Control Proposed Control
(View results in Column K) (View results in Advisory Messages)Basic Intersection DataNumber of intersection legs: 4 4 4Intersection description:Intersection traffic control type: Minor stop Minor stop SignalMajor road lanes serving through vehicles: 2 2 2
Alignment DataIntersection skew angle, degrees: 20 20 1
Traffic Control DataRed-light camera presence No No No
Right-Turn-on-Red OperationMajor road Number of approaches with right-turn-on-red prohibited? 0 0 0Minor road Number of approaches with right-turn-on-red prohibited? 1 1 1Left-Turn Operational ModeMajor road Type of control on one intersection approach: Permissive Permissive PermissiveMajor road Type of control on the other intersection approach: Prot.-Perm. Prot.-Perm. Prot.-Perm.Minor road Type of control on one intersection approach: Protected Protected ProtectedMinor road Type of control on the other intersection approach: Permissive Permissive Permissive
Crash Period Study Period Study Period
Clear Echo Input Values Check Input Values
Figure 16. Input Worksheet – Basic Intersection Data, Alignment Data, and Traffic Control Data
The data entry cells in the section titled Cross Section Data and Other Data are shown in Figure 17. There are left-turn bays and right-turn bays on both major approaches for the crash period and the study period. There are no turn bays on the minor road approaches for the crash period or the study period. Intersection lighting was present during the crash period. It will be retained for the study period.
Input WorksheetExisting Control Proposed Control
(View results in Column K) (View results in Advisory Messages)Cross Section DataMaximum number of lanes crossed by a pedestrian: 1 1 1
Left-Turn Lane or BayMajor road Number of approaches with a left-turn lane or bay: 2 2 2Minor road Number of approaches with a left-turn lane or bay: 0 0 0Right-Turn Lane or BayMajor road Number of approaches with a right-turn lane or bay: 2 2 2Minor road Number of approaches with a right-turn lane or bay: 0 0 0Other DataIs intersection lighting present? Yes Yes YesNumber of bus stops within 1,000 ft of the center of the intersection: 1 1 1Is a public school within 1,000 ft of center of the intersection? Yes Yes YesNumber of alcohol sales establishments within 1,000 ft of the intersection: 3 3 3
Analyst-Specified CMF for Special Treatment 1Is treatment (Add flashing beacon) present? No No NoAnalyst-Specified CMF for Special Treatment 2Is treatment (enter name of treatment here) present? No No No
Crash Period Study Period Study Period
Clear Echo Input Values Check Input Values
Figure 17. Input Worksheet – Cross Section Data and Other Data
The data entry cells on the Input worksheet in the section titled Traffic Data are shown in Figure 18. AADT volume data are available for both the major road and minor road for the years 2006, 2008, and 2015. AADT volumes for those years where data are not available are left blank. InSAT will compute traffic volumes for the years without data using the rules described in Step 3 of the section titled Analysis Steps in Chapter 2.
Intersection Safety Evaluation: InSAT Guidebook 44
Input Worksheet
Existing Proposed
(View results in Column K) (View results in Advisory Messages)Traffic Data YearMajor-Road Data 2006 9000Annual average daily traffic (AADTmajor) by year, veh/d: 2007 (enter data only for those years for which 2008 10000 it is available, leave other years blank) 2009
201020112012201320142015 120002016
Minor-Road Data 2006 1000Annual average daily traffic (AADTminor) by year, veh/d: 2007 (enter data only for those years for which 2008 1200 it is available, leave other years blank) 2009
201020112012201320142015 14002016
1400
9000
10000
1200
1000
12000
Crash Period
Study Period
Study Period
Clear Echo Input Values Check Input Values
Figure 18. Input Worksheet – Traffic Data
The data entry cells in the section titled Crash Data are shown in Figure 19. These data represent the count of crashes related to the intersection between the years 2006 and 2010 (i.e., the crash period). They are categorized by crash severity and type. They include any vehicle-pedestrian crashes and vehicle-bicycle crashes that occurred during the crash period. Angle crashes include all crashes that occur at an angle and involve one or more vehicles on the major road and one or more vehicles on the minor road. The “Other” crash category includes all crashes not considered to be an angle or rear-end crash.

Intersection Safety Evaluation: InSAT Guidebook 45
Input Worksheet
Existing Proposed
(View results in Column K) (View results in Advisory Messages)Crash DataCount of Fatal-and-Injury (FI) Crashes by Year
Angle crashes 2006 32007 22008 12009 32010 2
Rear-end crashes 2006 02007 12008 02009 02010 1
Other crashes 2006 12007 22008 32009 22010 1
Count of Property-Damage-Only (PDO) Crashes by YearAngle crashes 2006 2
2007 22008 12009 22010 1
Rear-end crashes 2006 12007 02008 12009 12010 2
Other crashes 2006 22007 32008 42009 12010 1
Crash Period
Study Period
Study Period
Clear Echo Input Values Check Input Values
Figure 19. Input Worksheet – Crash Data
Output Summary The Estimated Crash Statistics output cells are shown in Figure 20. Note that the unused rows are omitted from the figure. These statistics can be used to determine whether there is a significant change in safety associated with the “install signal” alternative. Steps 4 and 5 of the safety evaluation procedure in Chapter 3 are used to guide this determination.
Step 4 of the procedure is used to determine if there is a significant change in crash frequency due to signal installation. The rows under the Crashes During the Study Period heading provide the information needed to make this determination. The statistics in this section correspond to the three-year study period, so they represent estimates of the “average crash frequency per three years.” Of interest are the following two statistics: (1) the average crash frequency per three years for the intersection (with stop control on the minor road) and (2) the average crash frequency per three years for this same intersection if a traffic control signal was installed. Figure 20 indicates that the intersection is associated with an average of 18.4 crashes/3 years. In contrast, if this intersection were signalized, then it is likely to average 11.5 crashes/3 years. These results suggest that signal installation would be associated with a reduction of 6.9 crashes/3 years.

Intersection Safety Evaluation: InSAT Guidebook 46
Figure 20 also indicates that the standard deviation of the two estimates is 2.5 and 2.8 crashes/3 years, respectively. The standard deviation of the crash reduction of 6.9 crashes/3 years is computed as 3.8 crashes/3 years (= [2.5 2 + 2.8 2]0.5). The ratio of the reduction and its standard deviation is shown in Figure 20 as 1.83 (= 6.9 / 3.8). This ratio exceeds 1.64 which suggests that there is sufficient evidence to conclude that signal installation will likely reduce the intersection’s average crash frequency.
Step 5 of the procedure is used to determine if there is a net safety benefit associated with the signal installation. The rows under the Severity Index Analysis heading provide the information needed to make this determination. Of interest are the following two statistics: (1) the severity index for the intersection (with stop control on the minor road) and (2) the severity index for this same intersection if a traffic control signal was installed. Figure 20 indicates that the intersection is associated with an index of 1,564. In contrast, if this intersection were signalized, then it would have an index of 464. These results suggest that signal installation would be associated with a reduction in the index value of 1,100.
General InformationProject description:Analyst: Date: Area type:First year of analysis: 2013Last year of analysis: 2015Crash Data DescriptionCrash data available? Yes First year of crash data: 2006 Last year of crash data: 2010Estimated Crash StatisticsCrashes During the Study Period see note:
Angle Rear-end Other Total Angle Rear-end Other TotalMinor stop FI 3.2 0.6 4.2 8.0 0.8 0.2 1.3 1.6
PDO 2.8 1.4 6.2 10.4 0.9 0.5 1.7 2.0Total 6.0 2.0 10.4 18.4 1.2 0.5 2.1 2.5
Signal FI 1.3 1.6 1.0 3.9 0.4 0.4 1.1 1.2PDO 1.8 3.3 2.4 7.6 0.5 0.8 2.3 2.5Total 3.1 4.9 3.4 11.5 0.7 0.9 2.6 2.8
Change in control FI -1.9 1.0 -3.2 -4.1 2.04 2.21 1.87 2.05type: PDO -1.0 1.9 -3.8 -2.8 0.94 2.03 1.31 0.88
Total -2.9 2.9 -6.9 -6.9 2.08 2.80 2.07 1.83Severity Index Analysis see note:
Angle Rear-end Other Total Angle Rear-end Other TotalMinor stop 662 25 878 1564 169 7 261 311Signal 182 102 180 464 53 22 179 188Change in control type -480 77 -698 -1100 2.71 3.33 2.21 3.03Crashes by Control Type, Severity, and Year
ChangeFI PDO Total FI PDO Total Total
Estimated number of crashes 2013 2.6 3.4 6.0 1.3 2.5 3.8 -2.2during the Study Period, 2014 2.7 3.5 6.1 1.3 2.5 3.8 -2.3crashes: 2015 2.7 3.6 6.3 1.3 2.6 3.9 -2.4
Total: 8.0 10.4 18.4 3.9 7.6 11.5 -6.9
Year SignalMinor Road Stop
SeverityControl Type
Control Type
Number of Crashes Standard Deviation, crashes
Average Severity Index Standard Deviation
Output Summary
Safey evaluation of rural intersectionKML 12/27/2013 Rural
Figure 20. Output Summary Worksheet – Install Signal
The standard deviation of the severity index estimates is also provided, as is the standardized change in index value. The ratio of the index value to its standard deviation is 3.03. This ratio exceeds 1.64 which suggests that there is sufficient evidence to conclude that signal installation will likely provide a net safety benefit.
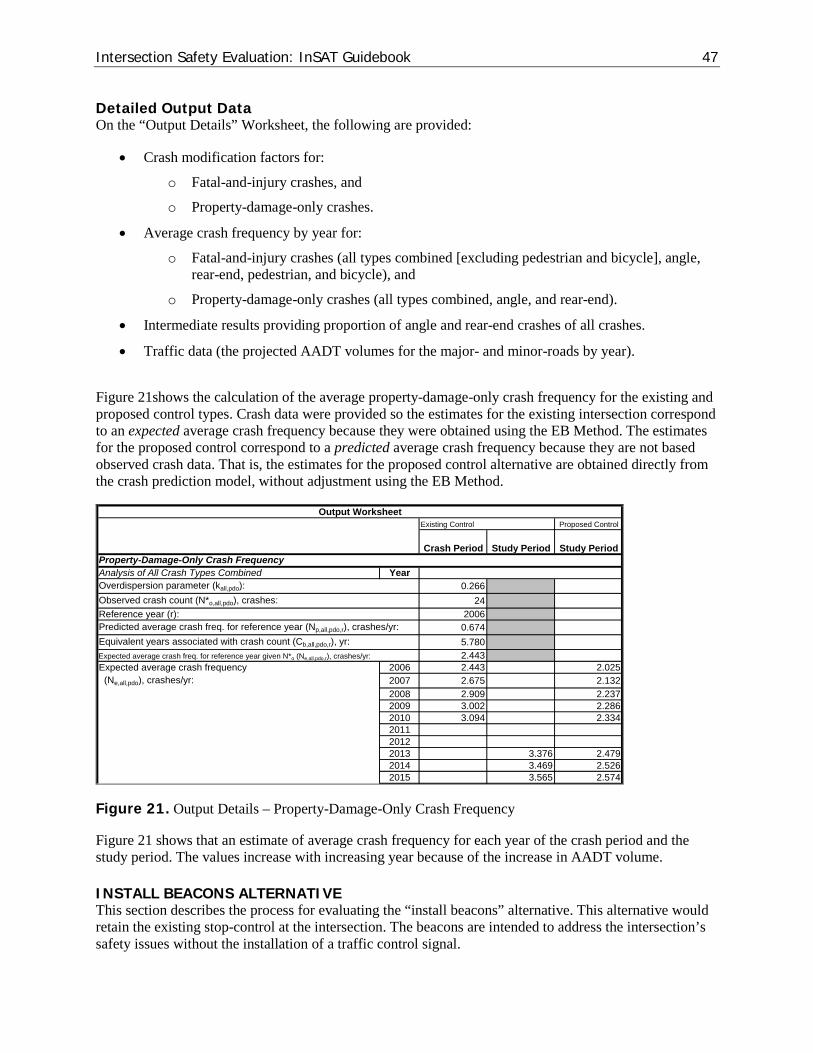
Intersection Safety Evaluation: InSAT Guidebook 47
Detailed Output Data On the “Output Details” Worksheet, the following are provided:
• Crash modification factors for:
o Fatal-and-injury crashes, and
o Property-damage-only crashes.
• Average crash frequency by year for:
o Fatal-and-injury crashes (all types combined [excluding pedestrian and bicycle], angle, rear-end, pedestrian, and bicycle), and
o Property-damage-only crashes (all types combined, angle, and rear-end).
• Intermediate results providing proportion of angle and rear-end crashes of all crashes.
• Traffic data (the projected AADT volumes for the major- and minor-roads by year).
Figure 21shows the calculation of the average property-damage-only crash frequency for the existing and proposed control types. Crash data were provided so the estimates for the existing intersection correspond to an expected average crash frequency because they were obtained using the EB Method. The estimates for the proposed control correspond to a predicted average crash frequency because they are not based observed crash data. That is, the estimates for the proposed control alternative are obtained directly from the crash prediction model, without adjustment using the EB Method.
Output WorksheetExisting Control Proposed Control
Property-Damage-Only Crash FrequencyAnalysis of All Crash Types Combined YearOverdispersion parameter (kall,pdo): 0.266Observed crash count (N*o,all,pdo), crashes: 24Reference year (r): 2006Predicted average crash freq. for reference year (Np,all,pdo,r), crashes/yr: 0.674Equivalent years associated with crash count (Cb,all,pdo,r), yr: 5.780Expected average crash freq. for reference year given N*o (Ne,all,pdo,r), crashes/yr: 2.443Expected average crash frequency 2006 2.443 2.025 (Ne,all,pdo), crashes/yr: (Np,all,pdo), crashes/yr: 2007 2.675 2.132
2008 2.909 2.2372009 3.002 2.2862010 3.094 2.334201120122013 3.376 2.4792014 3.469 2.5262015 3.565 2.574
Study PeriodCrash Period Study Period
Figure 21. Output Details – Property-Damage-Only Crash Frequency
Figure 21 shows that an estimate of average crash frequency for each year of the crash period and the study period. The values increase with increasing year because of the increase in AADT volume.
INSTALL BEACONS ALTERNATIVE This section describes the process for evaluating the “install beacons” alternative. This alternative would retain the existing stop-control at the intersection. The beacons are intended to address the intersection’s safety issues without the installation of a traffic control signal.

Intersection Safety Evaluation: InSAT Guidebook 48
Input Data With a couple of exceptions, the input data for the beacon alternative is the same as that for the signal alternative. The exceptions are described in this section.
One exception is that the presence of the flashing beacon has to be identified using the Input worksheet. This entry is shown in Figure 22. It is in the Other Data section of the worksheet, and is associated with Special Treatment 1. A “Yes” is entered in the Study Period column, of the columns titled “Existing Control.” “No” is retained for the Crash Period column because the observed crash data correspond to the existing intersection without beacons present.
Input WorksheetExisting Control Proposed Control
(View results in Column K) (View results in Advisory Messages)Other DataIs intersection lighting present? Yes Yes YesNumber of bus stops within 1,000 ft of the center of the intersection: 1 1 1Is a public school within 1,000 ft of center of the intersection? Yes Yes YesNumber of alcohol sales establishments within 1,000 ft of the intersection: 3 3 3
Analyst-Specified CMF for Special Treatment 1Is treatment (Add flashing beacon) present? No Yes NoAnalyst-Specified CMF for Special Treatment 2Is treatment (enter name of treatment here) present? No No No
Crash Period Study Period Study Period
Clear Echo Input Values Check Input Values
Figure 22. Input Worksheet – Install Beacon
No change is made to the Proposed Control column. Entries in the Proposed Control column are not changed for the evaluation of the beacon alternative. More generally, the entries in the Proposed Control column are not used for any alternative that excludes a change in traffic control type. In other words, the change-in-control-type alternative is evaluated using the Proposed Control column. All other alternatives are evaluated using the Study Period column under the Existing Control columns.
This alternative evaluation takes advantage of the InSAT feature that allows the analyst to specify a special treatment CMF. The analyst must provide these CMF values, and verify that they are consistent with the base conditions of the predictive models. Appendix A provides additional discussion on the proper specification and use of CMFs for special treatments.
The CMFs for “add flashing beacons” at a rural 4-legged, stop-controlled intersection were obtained from a report by Srinivasan et al. (6). They are shown in Table 4.
Table 4. CMFs for Sample Application
CMF Crash Type Crash Severity Area Type Reference
0.87 Angle All Rural Srinivasan et al. (6)
0.92 Rear End All All Srinivasan et al. (6)
0.95 All All All Srinivasan et al. (6)
CMF values for Special Treatments are entered in the Calibration Factors worksheet in the section titled Supplemental CMFs (i.e., in row 193). Some of the data entry cells in this section are shown in Figure 23. Note that calibration factors are only entered for the rural, 4-legged, stop-controlled intersection.

Intersection Safety Evaluation: InSAT Guidebook 49
The CMF values reported by Srinivasan et al. were not specific to crash severity, so it was rationalized that reported CMF values were equally applicable to the fatal-and-injury and property-damage-only crash categories.
Adjustment for special treatment 1 Rural 3 Minor road stop Fatal and injury All types 1.000Name: Add flashing beacon (two-way Angle 1.000
roads) Rear-end 1.000Property-damage-only All types 1.000
Angle 1.000Rear-end 1.000
Signal Fatal and injury All types 1.000Angle 1.000Rear-end 1.000
Property-damage-only All types 1.000Angle 1.000Rear-end 1.000
4 Minor road stop Fatal and injury All types 0.950(two-way Angle 0.870
roads) Rear-end 0.920Property-damage-only All types 0.950
Angle 0.870Rear-end 0.920
Supplemental CMFs
CMF Description Area Type Legs Control Type Crash Severity Crash Type CMF
Value
Figure 23. Calibration Factors Worksheet – Supplemental CMFs
Output Summary The Estimated Crash Statistics output cells are shown in Figure 24. The safety of the intersection with beacons installed is indicated in the cells associated with “Minor stop” control type. Note that the rows corresponding to the proposed signal control are unchanged, as intended.
Figure 24 indicates that the “install beacons” alternative is associated with an average of 17.5 crashes/3 years, with a standard deviation of 2.4 crashes/3 years. This value corresponds to 18.4 crashes/3 years for the existing intersection without beacons (standard deviation of 2.5 crashes/3 years), as shown in Figure 20. These results suggest that beacon installation would be associated with a reduction of 0.9 crashes/3 years.
The standard deviation of the crash reduction of 0.9 crashes/3 years is computed as 3.5 crashes/3 years (= [2.5 2 + 2.4 2]0.5). The ratio of the reduction and its standard deviation is computed as 0.26 (= 0.9 / 3.5). This ratio does not exceed 1.64 which suggests that there is not sufficient evidence to conclude that beacon installation will likely reduce the intersection’s average crash frequency.
Figure 24 indicates that the “install beacons” alternative is associated with an index of 1,490, with a standard deviation of 295. Figure 20 indicates that the existing intersection without beacons has an index value of 1,564, with a standard deviation of 311. These results suggest that beacon installation would be associated with a reduction in the index value of 74.
The standard deviation of the index reduction of 74 is computed as 428 (= [311 2 + 295 2]0.5). The ratio of the reduction and its standard deviation is computed as 0.17 (= 74 / 428). This ratio does not exceed 1.64 which suggests that there is not sufficient evidence to conclude that beacon installation will likely provide a net safety benefit.
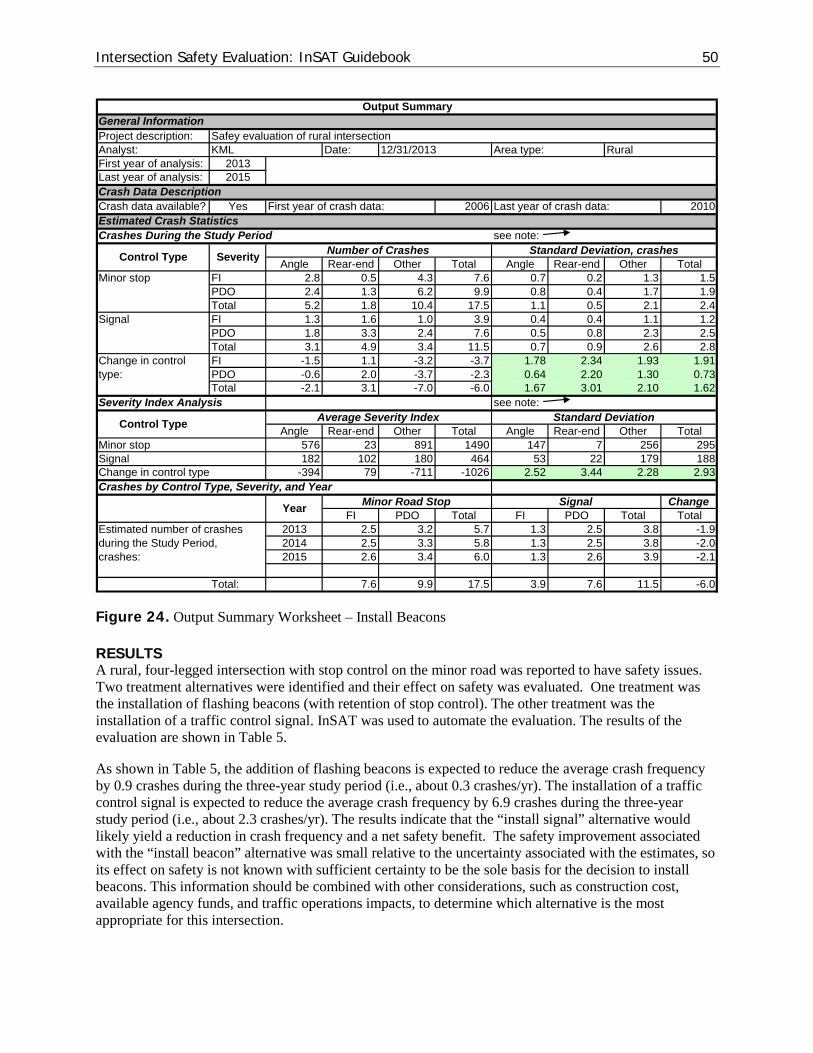
Intersection Safety Evaluation: InSAT Guidebook 50
General InformationProject description:Analyst: Date: Area type:First year of analysis: 2013Last year of analysis: 2015Crash Data DescriptionCrash data available? Yes First year of crash data: 2006 Last year of crash data: 2010Estimated Crash StatisticsCrashes During the Study Period see note:
Angle Rear-end Other Total Angle Rear-end Other TotalMinor stop FI 2.8 0.5 4.3 7.6 0.7 0.2 1.3 1.5
PDO 2.4 1.3 6.2 9.9 0.8 0.4 1.7 1.9Total 5.2 1.8 10.4 17.5 1.1 0.5 2.1 2.4
Signal FI 1.3 1.6 1.0 3.9 0.4 0.4 1.1 1.2PDO 1.8 3.3 2.4 7.6 0.5 0.8 2.3 2.5Total 3.1 4.9 3.4 11.5 0.7 0.9 2.6 2.8
Change in control FI -1.5 1.1 -3.2 -3.7 1.78 2.34 1.93 1.91type: PDO -0.6 2.0 -3.7 -2.3 0.64 2.20 1.30 0.73
Total -2.1 3.1 -7.0 -6.0 1.67 3.01 2.10 1.62Severity Index Analysis see note:
Angle Rear-end Other Total Angle Rear-end Other TotalMinor stop 576 23 891 1490 147 7 256 295Signal 182 102 180 464 53 22 179 188Change in control type -394 79 -711 -1026 2.52 3.44 2.28 2.93Crashes by Control Type, Severity, and Year
ChangeFI PDO Total FI PDO Total Total
Estimated number of crashes 2013 2.5 3.2 5.7 1.3 2.5 3.8 -1.9during the Study Period, 2014 2.5 3.3 5.8 1.3 2.5 3.8 -2.0crashes: 2015 2.6 3.4 6.0 1.3 2.6 3.9 -2.1
Total: 7.6 9.9 17.5 3.9 7.6 11.5 -6.0
Output Summary
Safey evaluation of rural intersectionKML 12/31/2013 Rural
Number of Crashes Standard Deviation, crashes
Average Severity Index Standard Deviation
SeverityControl Type
Control Type
Year SignalMinor Road Stop
Figure 24. Output Summary Worksheet – Install Beacons
RESULTS A rural, four-legged intersection with stop control on the minor road was reported to have safety issues. Two treatment alternatives were identified and their effect on safety was evaluated. One treatment was the installation of flashing beacons (with retention of stop control). The other treatment was the installation of a traffic control signal. InSAT was used to automate the evaluation. The results of the evaluation are shown in Table 5.
As shown in Table 5, the addition of flashing beacons is expected to reduce the average crash frequency by 0.9 crashes during the three-year study period (i.e., about 0.3 crashes/yr). The installation of a traffic control signal is expected to reduce the average crash frequency by 6.9 crashes during the three-year study period (i.e., about 2.3 crashes/yr). The results indicate that the “install signal” alternative would likely yield a reduction in crash frequency and a net safety benefit. The safety improvement associated with the “install beacon” alternative was small relative to the uncertainty associated with the estimates, so its effect on safety is not known with sufficient certainty to be the sole basis for the decision to install beacons. This information should be combined with other considerations, such as construction cost, available agency funds, and traffic operations impacts, to determine which alternative is the most appropriate for this intersection.

Intersection Safety Evaluation: InSAT Guidebook 51
Table 5. Sample Application Results
Alternative Average Crash
Frequency/3 years
Change in Average Crash Frequency/3 years1
(ratio) Severity
Index
Change in Severity Index1
(ratio)
Retain stop control (base) 18.4 1,564
Retain stop control, add flashing beacon 17.5 -0.9 (0.26) 1,490 -74 (0.17)
Convert to signal control 11.5 -6.9 (1.83) 464 -1,100 (3.03)
Note: 1 – Change is the difference between a given alternative and the base alternative. Ratio is the absolute value of the change divided by its standard deviation; values in excess of 1.64 indicate a likely change in safety.

Intersection Safety Evaluation: InSAT Guidebook 52
Appendix D. Case Studies
The case studies in this chapter illustrate an application of the engineering study process recommended in the MUTCD (7) for evaluating an intersection being considered for signal installation. One objective of these case studies is to demonstrate the use of the crash experience warrant. A second objective is to demonstrate the use of the safety evaluation procedure described in Chapter 3. In each case study, the warrant is found to be met, so the safety evaluation procedure is used in a subsequent step of the engineering study process to evaluate overall intersection safety.
A proposed crash experience warrant is used in the case studies, instead of the existing Crash Experience Warrant in the MUTCD (7). The development of the proposed crash experience warrant is documented in the report by Bonneson et al. (1). This warrant is recommended for inclusion in a future edition of the MUTCD. The proposed warrant retains Criterion A and C of the existing Crash Experience Warrant in the MUTCD, but it replaces Criterion B with the following text.
“B. One of the following conditions apply to the reported crash history (where each reported crash considered is related to the intersection and apparently exceeds the applicable requirements for a reportable crash):
a. The number of reported angle crashes and pedestrian crashes within a one-year period equals or exceeds the threshold number in Table 4C-2 for total angle crashes and pedestrian crashes (all severities); or
b. The number of reported fatal-and-injury angle crashes and pedestrian crashes within a one-year period equals or exceeds the threshold number in Table 4C-2 for total fatal-and-injury angle crashes and pedestrian crashes ; or
c. The number of reported angle crashes and pedestrian crashes within a three-year period equals or exceeds the threshold number in Table 4C-3 for total angle crashes and pedestrian crashes (all severities); or
d. The number of reported fatal-and-injury angle crashes and pedestrian crashes within a three-year period equals or exceeds the threshold number in Table 4C-3 for total fatal-and-injury angle crashes and pedestrian crashes.”
Table 4C-2 and Table 4C-3 are repeated herein as Table 6 and Table 7, respectively. These tables are referenced in the subsequent sections of this chapter to illustrate their use in the engineering study process.

Intersection Safety Evaluation: InSAT Guidebook 53
Table 6. (Table 4C-2) Reported Crash Value for Use with Criterion B of Warrant 7 Based on One-Year Crash History
Area Type
Number of Through Lanes on Each
Approach
Minimum Number of Reported Crashes in One-Year Period
Total of Angle Crashes and Pedestrian Crashes (all severities) b
Total of Fatal-and-Injury Angle Crashes and Pedestrian Crashes b
Major Minor Four Legs Three Legs Four Legs Three Legs Urban 1 1 5 4 3 3 2+ 1 5 4 3 3 2+ 2+ 5 4 3 3 1 2+ 5 4 3 3 Rurala 1 1 4 3 3 3 2+ 1 10 9 6 6 2+ 2+ 10 9 6 6 1 2+ 4 3 3 3 Notes: a – “Rural” values apply to intersections where the major-road speed exceeds 40 mi/h or intersections located in an isolated community with a population of less than 10,000. b – Angle crashes include all crashes that occur at an angle and involve one or more vehicles on the major road and one or more vehicles on the minor road.
Table 7. (Table 4C-3) Reported Crash Value for Use with Criterion B of Warrant 7 Based on Three-Year Crash History
Area Type
Number of Through Lanes on Each
Approach
Minimum Number of Reported Crashes in Three-Year Period
Total of Angle Crashes and Pedestrian Crashes (all severities) b
Total of Fatal-and-Injury Angle Crashes and Pedestrian Crashes b
Major Minor Four Legs Three Legs Four Legs Three Legs Urban 1 1 6 5 4 4 2+ 1 6 5 4 4 2+ 2+ 6 5 4 4 1 2+ 6 5 4 4 Rurala 1 1 6 5 4 4 2+ 1 16 13 9 9 2+ 2+ 16 13 9 9 1 2+ 6 5 4 4 Notes: a – “Rural” values apply to intersections where the major-road speed exceeds 40 mi/h or intersections located in an isolated community with a population of less than 10,000. b – Angle crashes include all crashes that occur at an angle and involve one or more vehicles on the major road and one or more vehicles on the minor road.
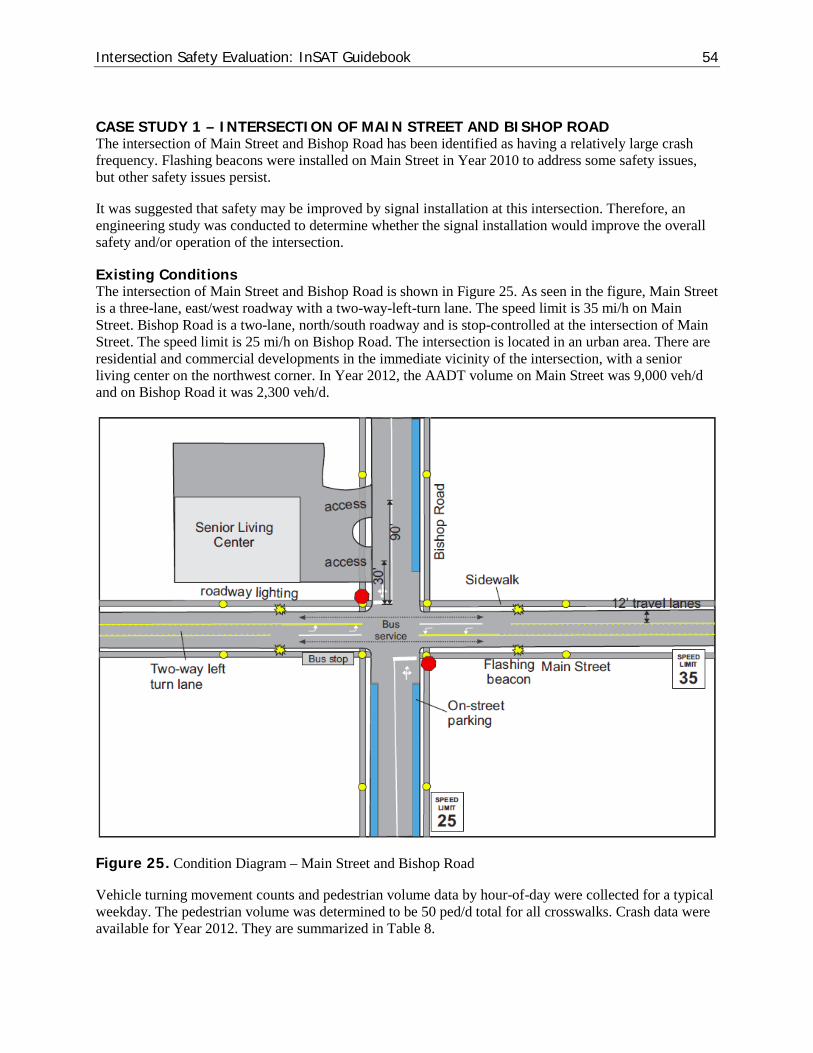
Intersection Safety Evaluation: InSAT Guidebook 54
CASE STUDY 1 – INTERSECTION OF MAIN STREET AND BISHOP ROAD The intersection of Main Street and Bishop Road has been identified as having a relatively large crash frequency. Flashing beacons were installed on Main Street in Year 2010 to address some safety issues, but other safety issues persist.
It was suggested that safety may be improved by signal installation at this intersection. Therefore, an engineering study was conducted to determine whether the signal installation would improve the overall safety and/or operation of the intersection.
Existing Conditions The intersection of Main Street and Bishop Road is shown in Figure 25. As seen in the figure, Main Street is a three-lane, east/west roadway with a two-way-left-turn lane. The speed limit is 35 mi/h on Main Street. Bishop Road is a two-lane, north/south roadway and is stop-controlled at the intersection of Main Street. The speed limit is 25 mi/h on Bishop Road. The intersection is located in an urban area. There are residential and commercial developments in the immediate vicinity of the intersection, with a senior living center on the northwest corner. In Year 2012, the AADT volume on Main Street was 9,000 veh/d and on Bishop Road it was 2,300 veh/d.
Figure 25. Condition Diagram – Main Street and Bishop Road
Vehicle turning movement counts and pedestrian volume data by hour-of-day were collected for a typical weekday. The pedestrian volume was determined to be 50 ped/d total for all crosswalks. Crash data were available for Year 2012. They are summarized in Table 8.

Intersection Safety Evaluation: InSAT Guidebook 55
Table 8. Reported Crashes by Severity and Type – Main Street and Bishop Road
Crash Severity Crash Type Crash Count 1/2012-12/2012
Fatal and Injury Angle a 2 Rear-end 1
Pedestrian b 1 Other 0
Property damage only
Angle a 2 Rear-end 1
Pedestrian b 1 Other 2
Total Angle a 4 Rear-end 2
Pedestrian b 2 Other 2
Notes: a – Angle crashes include all crashes that occur at an angle and involve one or more vehicles on the major road and one or more vehicles on the minor road. b – Pedestrian crashes include all crashes that occur at an angle and involve a vehicle and one or more pedestrians crossing at the intersection.
Alternative Identification A traffic control signal was identified as a potential treatment to address safety issues at the intersection of Main Street and Bishop Road. The existing lane configuration would be maintained, as well as the existing intersection lighting. The proposed signal would have protected left-turn operation on Main Street and permissive left-turn operation on Bishop Road.
Engineering Study
Step 1 – Warrant Evaluation The crash experience warrant was evaluated for the intersection of Main Street and Bishop Road. Criterion A and C were checked and satisfied. To evaluate Criterion B, the crash history at the intersection was compared to the applicable table for the proposed crash experience warrant. Table 6 (i.e., Table 4C-2) is appropriate when there is a one-year crash history available. For urban intersections with one through lane on each intersection approach and four legs, the table indicates threshold values of 5 angle-and-pedestrian crashes (all severities) and 3 fatal-and-injury angle-and-pedestrian crashes.
Based on the crash data provided in Table 8, a total of 6 angle-and-pedestrian crashes of all severities were observed at the intersection during a one-year period. Three of these crashes were associated with a fatality or injury. The 6 angle-and-pedestrian crashes exceed the threshold of 5, so Criterion B is satisfied. The 3 fatal-and-injury crashes equals the threshold of 3, so Criterion B is satisfied a second time. Therefore, all three criterion of the warrant are satisfied and the crash experience warrant is met.
Step 2 – Site Examination A site visit was undertaken during the evening peak traffic period. A condition diagram was prepared based on guidance in Section 4C.01 of the MUTCD. It is shown in Figure 25.

Intersection Safety Evaluation: InSAT Guidebook 56
There is transit service along Main Street with a stop on the southwest corner of the intersection. On-street parking is permitted on Bishop Road. There are sidewalks and narrow planting strips on all sides of the intersection. There are signalized intersections on Main Street approximately 1,000 feet east and 2,000 feet west of Bishop Road. No issues with sight distance were noted in the field.
A collision diagram, shown in Figure 26, was prepared to show the crash experience by type, location, direction of movement, severity, time of day, and weather. As seen in the figure, the most prevalent crash type is the “angle” crash involving vehicles turning left from northbound Bishop Road. This suggests that vehicles may have a difficult time either finding safe gaps in which to complete their turn or in estimating the speed of approaching traffic. During the site visit, a near-miss was observed between a northbound left-turning vehicle and an eastbound through vehicle. The officer crash reports were acquired and examined for any further insight into the crash history.
Figure 26. Collision Diagram – Main Street and Bishop Road
Step 3 – Evaluation of Change in Overall Safety The InSAT spreadsheet tool was used to quantify the expected change in overall intersection safety associated with the installation of a traffic signal. InSAT uses the predictive methods in Part C of the Highway Safety Manual to estimate the average crash frequency associated with the existing intersection and with the intersection after a signal is installed.
The crash period used for the evaluation was Year 2012, which is consistent with the time period for the crash history used in the warrant evaluation. The study period was selected as Year 2015 to coincide with the anticipated first year of signal operation. The projected AADT volumes for Year 2015 were estimated

Intersection Safety Evaluation: InSAT Guidebook 57
to be 9,300 veh/d on Main Street and 2,450 veh/d on Bishop Road. The projected AADT volume was assumed to not change with the installation of a signal.
The results of the evaluation are shown in Table 9. As shown in this table, the installation of a traffic control signal is expected to reduce the average crash frequency by 1.96 crashes per year. The ratio associated with this reduction is 1.67. Because this value exceeds 1.64, it is likely that the signal installation will reduce crash frequency at the intersection. These results suggest that signalizing the intersection would likely yield an improvement in safety performance.
Table 9. InSAT Application Results – Main Street and Bishop Road
Alternative Average Crash Frequency/ year
Change in Average Crash Frequency/ year1
(ratio) Severity Index
Change in Severity Index1
(ratio)
Retain stop control (base) 3.24 125
Convert to signal control 1.28 -1.96 (1.67) 44 -81 (1.40)
Note: 1 – Change is the difference between a given alternative and the base alternative. Ratio is the absolute value of the change divided by its standard deviation; values in excess of 1.64 indicate a likely change in safety.
Step 4 – Evaluation of Change in Operations A complete engineering study also includes consideration of the operational impacts of the proposed signal at Main Street and Bishop Road. As part of this evaluation, the Highway Capacity Manual methodology was used to assess intersection operations with a traffic control signal. The findings indicated no adverse operational impacts with signal installation. The details of the operational evaluation are not included in this case study discussion because they are external to its objective of demonstrating the application of the proposed crash experience warrant and safety evaluation procedure.
Alternative Selection Based on the findings from the engineering study, including the warrant evaluation, site examination, evaluation of change in overall safety, and evaluation of change in operations, a traffic control signal is recommended for installation at the intersection of Main Street and Bishop Road. The intersection should retain the existing lane configuration (or include additional lanes). It should also retain the existing intersection lighting. The signal should have protected left-turn operation on Main Street and permissive left-turn operation on Bishop Road.
CASE STUDY 2 – INTERSECTION OF US 34 AND SOUTH STREET The intersection of US 34 and South Street has been identified as having a relatively large crash frequency. A right-turn bay was installed on US 34 in Year 2008 to address some safety issues, but other safety issues persist.
It was suggested that safety may be improved by signal installation at this intersection. Therefore, an engineering study was conducted to determine whether the signal installation would improve the overall safety and/or operation of the intersection.
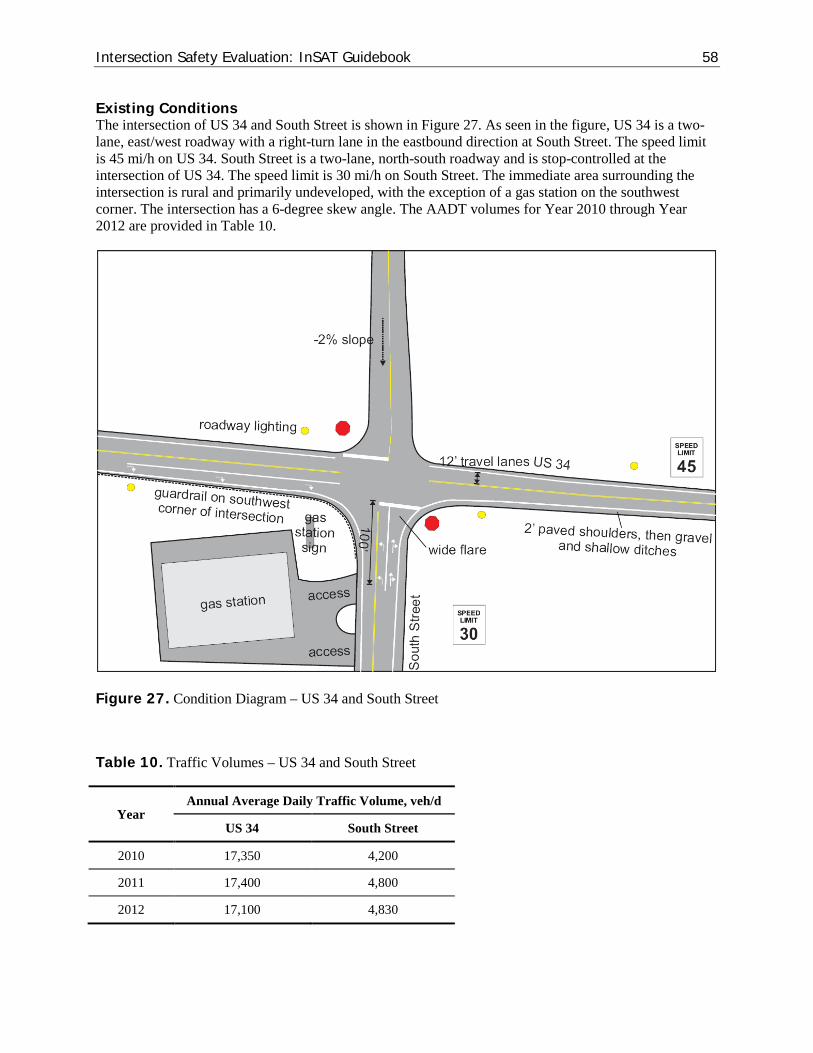
Intersection Safety Evaluation: InSAT Guidebook 58
Existing Conditions The intersection of US 34 and South Street is shown in Figure 27. As seen in the figure, US 34 is a two-lane, east/west roadway with a right-turn lane in the eastbound direction at South Street. The speed limit is 45 mi/h on US 34. South Street is a two-lane, north-south roadway and is stop-controlled at the intersection of US 34. The speed limit is 30 mi/h on South Street. The immediate area surrounding the intersection is rural and primarily undeveloped, with the exception of a gas station on the southwest corner. The intersection has a 6-degree skew angle. The AADT volumes for Year 2010 through Year 2012 are provided in Table 10.
Figure 27. Condition Diagram – US 34 and South Street
Table 10. Traffic Volumes – US 34 and South Street
Year Annual Average Daily Traffic Volume, veh/d
US 34 South Street
2010 17,350 4,200
2011 17,400 4,800
2012 17,100 4,830
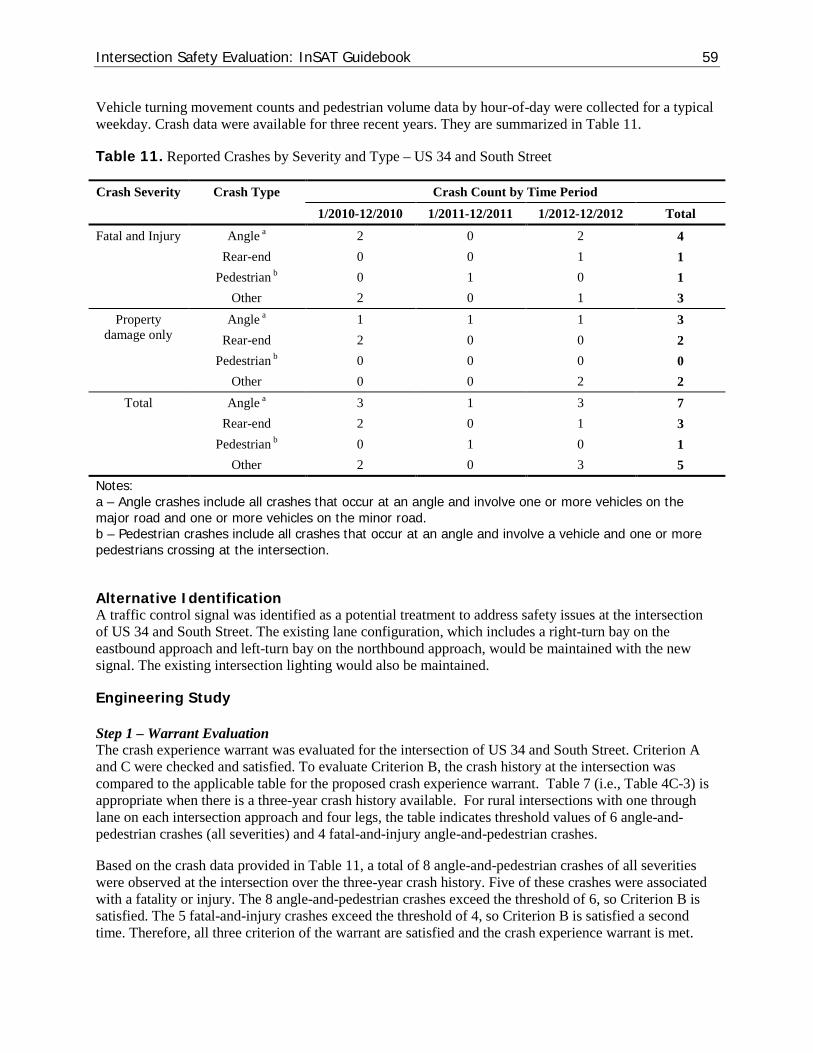
Intersection Safety Evaluation: InSAT Guidebook 59
Vehicle turning movement counts and pedestrian volume data by hour-of-day were collected for a typical weekday. Crash data were available for three recent years. They are summarized in Table 11.
Table 11. Reported Crashes by Severity and Type – US 34 and South Street
Crash Severity Crash Type Crash Count by Time Period 1/2010-12/2010 1/2011-12/2011 1/2012-12/2012 Total
Fatal and Injury Angle a 2 0 2 4 Rear-end 0 0 1 1
Pedestrian b 0 1 0 1 Other 2 0 1 3
Property damage only
Angle a 1 1 1 3 Rear-end 2 0 0 2
Pedestrian b 0 0 0 0 Other 0 0 2 2
Total Angle a 3 1 3 7 Rear-end 2 0 1 3
Pedestrian b 0 1 0 1 Other 2 0 3 5
Notes: a – Angle crashes include all crashes that occur at an angle and involve one or more vehicles on the major road and one or more vehicles on the minor road. b – Pedestrian crashes include all crashes that occur at an angle and involve a vehicle and one or more pedestrians crossing at the intersection.
Alternative Identification A traffic control signal was identified as a potential treatment to address safety issues at the intersection of US 34 and South Street. The existing lane configuration, which includes a right-turn bay on the eastbound approach and left-turn bay on the northbound approach, would be maintained with the new signal. The existing intersection lighting would also be maintained.
Engineering Study
Step 1 – Warrant Evaluation The crash experience warrant was evaluated for the intersection of US 34 and South Street. Criterion A and C were checked and satisfied. To evaluate Criterion B, the crash history at the intersection was compared to the applicable table for the proposed crash experience warrant. Table 7 (i.e., Table 4C-3) is appropriate when there is a three-year crash history available. For rural intersections with one through lane on each intersection approach and four legs, the table indicates threshold values of 6 angle-and-pedestrian crashes (all severities) and 4 fatal-and-injury angle-and-pedestrian crashes.
Based on the crash data provided in Table 11, a total of 8 angle-and-pedestrian crashes of all severities were observed at the intersection over the three-year crash history. Five of these crashes were associated with a fatality or injury. The 8 angle-and-pedestrian crashes exceed the threshold of 6, so Criterion B is satisfied. The 5 fatal-and-injury crashes exceed the threshold of 4, so Criterion B is satisfied a second time. Therefore, all three criterion of the warrant are satisfied and the crash experience warrant is met.

Intersection Safety Evaluation: InSAT Guidebook 60
Step 2 – Site Examination A site visit was undertaken during the evening peak traffic period. A condition diagram was prepared based on guidance in Section 4C.01 of the MUTCD and is shown in Figure 27.
There is no transit service or on-street parking in the vicinity of the intersection. There are no signalized intersections within 2 miles. As noted in Figure 27, there is roadway lighting along US 34 and narrow paved shoulders. There is guardrail along the south side of US 34 (west of South Street) due to the presence of a relatively steep side slope. No issues with sight distance were noted in the field. Queues of a few cars were consistently waiting to make a left-turn from northbound South Street on to US 34.
A collision diagram, shown in Figure 28, was prepared to show the crash experience by type, location, direction of movement, severity, time of day, and weather. As seen in the figure, the most prevalent crash type is the “angle” crash involving vehicles turning left from US 34. In addition, two rear-end crashes were recorded on eastbound US 34. The officer crash reports were acquired and examined for any further insights in to the crash history. The crash data was also assessed by year to identify any patterns in the crash history.
Figure 28. Collision Diagram – US 34 and South Street
Step 3 – Evaluation of Change in Overall Safety The InSAT spreadsheet tool was used to quantify the expected change in overall intersection safety associated with the installation of a traffic signal. InSAT uses the predictive methods in Part C of the Highway Safety Manual to estimate the average crash frequency associated with the existing intersection and with the intersection after a signal is installed.
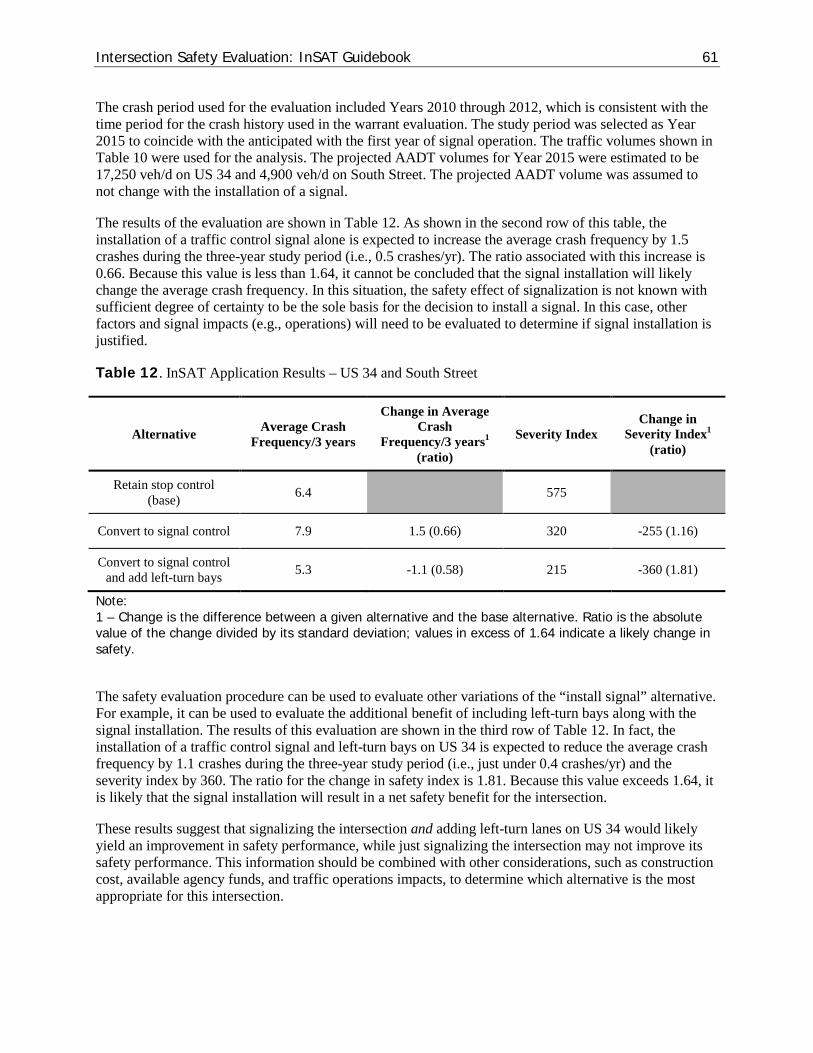
Intersection Safety Evaluation: InSAT Guidebook 61
The crash period used for the evaluation included Years 2010 through 2012, which is consistent with the time period for the crash history used in the warrant evaluation. The study period was selected as Year 2015 to coincide with the anticipated with the first year of signal operation. The traffic volumes shown in Table 10 were used for the analysis. The projected AADT volumes for Year 2015 were estimated to be 17,250 veh/d on US 34 and 4,900 veh/d on South Street. The projected AADT volume was assumed to not change with the installation of a signal.
The results of the evaluation are shown in Table 12. As shown in the second row of this table, the installation of a traffic control signal alone is expected to increase the average crash frequency by 1.5 crashes during the three-year study period (i.e., 0.5 crashes/yr). The ratio associated with this increase is 0.66. Because this value is less than 1.64, it cannot be concluded that the signal installation will likely change the average crash frequency. In this situation, the safety effect of signalization is not known with sufficient degree of certainty to be the sole basis for the decision to install a signal. In this case, other factors and signal impacts (e.g., operations) will need to be evaluated to determine if signal installation is justified.
Table 12. InSAT Application Results – US 34 and South Street
Alternative Average Crash Frequency/3 years
Change in Average Crash
Frequency/3 years1 (ratio)
Severity Index Change in
Severity Index1 (ratio)
Retain stop control (base) 6.4 575
Convert to signal control 7.9 1.5 (0.66) 320 -255 (1.16)
Convert to signal control and add left-turn bays 5.3 -1.1 (0.58) 215 -360 (1.81)
Note: 1 – Change is the difference between a given alternative and the base alternative. Ratio is the absolute value of the change divided by its standard deviation; values in excess of 1.64 indicate a likely change in safety.
The safety evaluation procedure can be used to evaluate other variations of the “install signal” alternative. For example, it can be used to evaluate the additional benefit of including left-turn bays along with the signal installation. The results of this evaluation are shown in the third row of Table 12. In fact, the installation of a traffic control signal and left-turn bays on US 34 is expected to reduce the average crash frequency by 1.1 crashes during the three-year study period (i.e., just under 0.4 crashes/yr) and the severity index by 360. The ratio for the change in safety index is 1.81. Because this value exceeds 1.64, it is likely that the signal installation will result in a net safety benefit for the intersection.
These results suggest that signalizing the intersection and adding left-turn lanes on US 34 would likely yield an improvement in safety performance, while just signalizing the intersection may not improve its safety performance. This information should be combined with other considerations, such as construction cost, available agency funds, and traffic operations impacts, to determine which alternative is the most appropriate for this intersection.

Intersection Safety Evaluation: InSAT Guidebook 62
Step 4 – Evaluation of Change in Operations A complete engineering study also includes consideration of the operational impacts of the proposed signal at US 34 and South Street. As part of this evaluation, the Highway Capacity Manual methodology was used to assess intersection operations with a traffic control signal and the left-turn bays on US 34. The findings indicated no adverse operational impacts with signal installation and operational benefits with the addition of the left-turn bays. The details of the operational evaluation are not included in this case study discussion because they are external to its objective of demonstrating the application of the proposed crash experience warrant and safety evaluation procedure.
Alternative Selection Based on the findings from the engineering study, including the warrant evaluation, site examination, evaluation of change in overall safety, and evaluation of change in operations, a traffic control signal is recommended at the intersection of US 34 and South Street. The intersection should retain the existing lane configuration, with the exception of adding a left-turn bay on each of the US 34 approaches to the intersection. It should also retain the existing intersection lighting.