United States v. Chrysler: The Conflict between Fair Warning and ...

Intersection Conflict Warning System Human Factors: Final ReportPUBLICATION NO. FHWA-HRT-16-061 NOVEMBER 2016
Research, Development, and TechnologyTurner-Fairbank Highway Research Center6300 Georgetown PikeMcLean, VA 22101-2296

FOREWORD
Intersection conflict warning systems (ICWSs) have been implemented across several States to warn drivers on the through lanes of the presence of traffic at stop-controlled cross streets and to warn drivers at stop-controlled approaches of the presence of traffic on the through lanes. Before-after studies have shown crash reductions ranging from 3.5 to more than 19 percent at installation sites at rural two-way stop-controlled intersections. However, there has been a lack of standardization of the wording placed on the ICWS message signs and the placement of the signs. This study was performed to provide empirical evidence to support standardization of ICWS messaging and sign placement. Data were obtained from 189 licensed drivers in a four-part laboratory study. The wordings that best conveyed the intent of the ICWSs’ message and were most preferred by the participants were “CROSS TRAFFIC AHEAD” on the major approach and “CROSS TRAFFIC” or “EXPECT CROSS TRAFFIC” on the minor, stop-controlled approach. This report should be of interest to State and local transportation agencies concerned with rural intersections, high-speed rural roadways, and intersections with visual obstructions to cross traffic.
Monique R. Evans Director, Office of Safety Research and Development
Notice This document is disseminated under the sponsorship of the U.S. Department of Transportation in the interest of information exchange. The U.S. Government assumes no liability for the use of the information contained in this document.
The U.S. Government does not endorse products or manufacturers. Trademarks or manufacturers’ names appear in this report only because they are considered essential to the objective of the document.
Quality Assurance Statement The Federal Highway Administration (FHWA) provides high-quality information to serve Government, industry, and the public in a manner that promotes public understanding. Standards and policies are used to ensure and maximize the quality, objectivity, utility, and integrity of its information. FHWA periodically reviews quality issues and adjusts its programs and processes to ensure continuous quality improvement.

TECHNICAL REPORT DOCUMENTATION PAGE 1. Report No. FHWA-HRT-16-061
2. Government Accession No.
3. Recipient’s Catalog No.
4. Title and Subtitle Intersection Conflict Warning System Human Factors: Final Report
5. Report Date November 2016 6. Performing Organization Code:
7. Author(s) Vaughan W. Inman and Steven Jackson
8. Performing Organization Report No.
9. Performing Organization Name and Address Leidos, Inc. 6300 Georgetown Pike McLean, VA 22101-2296
10. Work Unit No. 11. Contract or Grant No. DTFH61-13-D-00024
12. Sponsoring Agency Name and Address Federal Highway Administration 6300 Georgetown Pike McLean, VA 22101-2296
13. Type of Report and Period Covered 14. Sponsoring Agency Code HRDS-30
15. Supplementary Notes The Government’s Task Manager was Jim Shurbutt, and the Contract Officer’s Representative was David Yang. 16. Abstract Intersection conflict warning systems (ICWSs) are used to warn drivers on the through road of the presence of traffic at stop-controlled cross streets and to warn drivers at stop-controlled approaches of the presence of traffic on the through lanes. ICWSs have been shown to reduce crashes at rural two-way stop-controlled intersections; however, there is no standard wording for ICWS messages and no standard for the placement of these signs on the stop-controlled approaches. This study was performed to provide empirical evidence to support standardization of ICWS messaging and sign placement. Data were obtained from 189 licensed drivers in a 4-part laboratory study. In part 1, participants were shown video animations of approaches with ICWS signs, and comprehension of the signs was assessed. In part 2, participants indicated their level of agreement with 21 statements concerning various aspects of ICWS messages. These ratings were used to assess participants’ mental model of ICWS messaging. Three dimensions of this model were identified. From most influential to least influential, these dimensions were comprehension, safety, and affinity or likeability. In part 3, participants rated the wording of ICWS messaging alternatives. The preferred wording included the words “CROSS TRAFFIC.” On the major road, “CROSS TRAFFIC AHEAD” was preferred. For the stop-controlled minor road, “CROSS TRAFFIC” or “EXPECT CROSS TRAFFIC” options were preferred, depending on whether the “WHEN FLASHING” placard accompanied the sign. Part 4 explored how comprehension varied between when the ICWS beacons were active and inactive, when the “WHEN FLASHING” placard was present or absent, and whether blank-out signs improved comprehension over static signs. A worrisome 28 percent of participants agreed that inactive ICWS beacons meant that it was not necessary to watch for cross traffic. Blank-out signs did not improve comprehension, and blank-out signs were often misinterpreted when blank. The “WHEN FLASHING” placard did not greatly affect comprehension. 17. Key Words Intersection conflict warning system, ICWS, sign comprehension, sign placement, driver preferences
18. Distribution Statement No restrictions. This document is available through the National Technical Information Service, Springfield, VA 22161. http://www.ntis.gov
19. Security Classif. (of this report) Unclassified
20. Security Classif. (of this page) Unclassified
21. No. of Pages 53
22. Price N/A
Form DOT F 1700.7 (8-72) Reproduction of completed page authorized.

ii
SI* (MODERN METRIC) CONVERSION FACTORS APPROXIMATE CONVERSIONS TO SI UNITS
Symbol When You Know Multiply By To Find Symbol LENGTH
in inches 25.4 millimeters mm ft feet 0.305 meters m yd yards 0.914 meters m mi miles 1.61 kilometers km
AREA in2 square inches 645.2 square millimeters mm2
ft2 square feet 0.093 square meters m2
yd2 square yard 0.836 square meters m2
ac acres 0.405 hectares ha mi2 square miles 2.59 square kilometers km2
VOLUME fl oz fluid ounces 29.57 milliliters mL gal gallons 3.785 liters L ft3 cubic feet 0.028 cubic meters m3
yd3 cubic yards 0.765 cubic meters m3
NOTE: volumes greater than 1000 L shall be shown in m3
MASS oz ounces 28.35 grams glb pounds 0.454 kilograms kgT short tons (2000 lb) 0.907 megagrams (or "metric ton") Mg (or "t")
TEMPERATURE (exact degrees) oF Fahrenheit 5 (F-32)/9 Celsius oC
or (F-32)/1.8 ILLUMINATION
fc foot-candles 10.76 lux lx fl foot-Lamberts 3.426 candela/m2 cd/m2
FORCE and PRESSURE or STRESS lbf poundforce 4.45 newtons N lbf/in2 poundforce per square inch 6.89 kilopascals kPa
APPROXIMATE CONVERSIONS FROM SI UNITS Symbol When You Know Multiply By To Find Symbol
LENGTHmm millimeters 0.039 inches in m meters 3.28 feet ft m meters 1.09 yards yd km kilometers 0.621 miles mi
AREA mm2 square millimeters 0.0016 square inches in2
m2 square meters 10.764 square feet ft2
m2 square meters 1.195 square yards yd2
ha hectares 2.47 acres ac km2 square kilometers 0.386 square miles mi2
VOLUME mL milliliters 0.034 fluid ounces fl oz L liters 0.264 gallons gal m3 cubic meters 35.314 cubic feet ft3
m3 cubic meters 1.307 cubic yards yd3
MASS g grams 0.035 ounces ozkg kilograms 2.202 pounds lbMg (or "t") megagrams (or "metric ton") 1.103 short tons (2000 lb) T
TEMPERATURE (exact degrees) oC Celsius 1.8C+32 Fahrenheit oF
ILLUMINATION lx lux 0.0929 foot-candles fc cd/m2 candela/m2 0.2919 foot-Lamberts fl
FORCE and PRESSURE or STRESS N newtons 0.225 poundforce lbf kPa kilopascals 0.145 poundforce per square inch lbf/in2
*SI is the symbol for th International System of Units. Appropriate rounding should be made to comply with Section 4 of ASTM E380. e(Revised March 2003)

iii
TABLE OF CONTENTS
CHAPTER 1. OBJECTIVE ......................................................................................................... 1
CHAPTER 2. BACKGROUND ................................................................................................... 3 THE CRASH PROBLEM ........................................................................................................ 3
CHAPTER 3. METHOD ............................................................................................................ 11 PART 1: WHAT WOULD YOU DO AND WHAT DOES THE SIGN MEAN? ............. 12 PART 2: ICWS SIGN PERCEPTIONS ............................................................................... 17 PART 3: PREFERENCE RANKING ................................................................................... 20 PART 4: COMPREHENSION .............................................................................................. 21 PARTICIPANTS .................................................................................................................... 26
CHAPTER 4. RESULTS ............................................................................................................ 27 PART 1 ..................................................................................................................................... 27
Effect of “WHEN FLASHING” Placard on Warning Comprehension and Stated Behavior .......................................................................................................................... 27
Effect of Blank-Out Versus Static Sign on Comprehension and Stated Behavior ............... 28 Effect of Sign Placement on Comprehension and Stated Behavior ...................................... 29
PART 2 ..................................................................................................................................... 29 PART 3 ..................................................................................................................................... 33
Condorcet Method ................................................................................................................ 33 Borda Method ....................................................................................................................... 34 General Linear Model Method .............................................................................................. 34 Ranking Results .................................................................................................................... 34 Participants’ Explanations for Their Rankings ..................................................................... 35
PART 4 ..................................................................................................................................... 36 Interpretation of “WHEN FLASHING” Placard When the Beacons Were On .................... 36 Interpretation of the “WHEN FLASHING” Placard When the Beacons Were Off ............. 37 Interpretation of Blank-Out Signs ......................................................................................... 37
CHAPTER 5. DISCUSSION ..................................................................................................... 39
CHAPTER 6. RECOMMENDATIONS ................................................................................... 41
REFERENCES ............................................................................................................................ 45

iv
LIST OF FIGURES
Figure 1. Graph. The number of crashes at each of 1,306 intersections shown as a function of AADT ....................................................................................................................................4
Figure 2. Illustration. ICWS warning installation at stop sign at intersection with four-lane divided highway .......................................................................................................................10
Figure 3. Screenshot. Blank-out sign with “WHEN FLASHING” placard along two-lane approach to a stop-controlled cross street ................................................................................15
Figure 4. Screenshot. ICWS signs on four-lane divided highway approach .................................15 Figure 5. Screenshot. ICWS sign on four-lane undivided highway approach ...............................16 Figure 6. Screenshot. ICWS warning at intersection with two-lane highway ...............................16 Figure 7. Screenshot. ICWS warning at stop-controlled intersection with four-lane
undivided highway ...................................................................................................................17 Figure 8. Screenshot. ICWS at stop-controlled approach to four-lane divided highway ..............17 Figure 9. Screenshot. Explanation of ICWS sign on minor road approach ...................................18 Figure 10. Screenshot. Example of screen used for obtaining agreement ratings .........................19 Figure 11. Screenshot. Example of rating screen for nine alternative minor road warnings .........20 Figure 12. Screenshot. Example of screen shown while participants were asked to explain
their preferences .......................................................................................................................21 Figure 13. Screenshot. Screen examining comprehension of ICWS signs with placard when
the beacons are flashing ...........................................................................................................22 Figure 14. Screenshot. Screen examining comprehension of ICWS signs with placard when
the beacons are not flashing .....................................................................................................22 Figure 15. Screenshot. Screen examining whether driver would check for traffic when
beacons are not flashing ...........................................................................................................22 Figure 16. Screenshot. Screen used to explain why blank-out signs are used ...............................23 Figure 17. Screenshot. Screen used to assess comprehension of blank-out message when
beacons are active ....................................................................................................................23 Figure 18. Screenshot. Screen used to assess blank-out sign understanding when the
beacons are not active ..............................................................................................................24 Figure 19. Screenshot. Screen used to asses blank-out sign understanding when the sign is
blank .........................................................................................................................................24 Figure 20. Screenshot. Screen used to assess interpretation of a blank-out sign when the
sign is on but the beacons are not active ..................................................................................24 Figure 21. Screenshot. Second screen used to assess interpretation of a blank-out sign
when the sign is on but the beacons are not active ..................................................................25 Figure 22. Screenshot. Exemplar from video showing the ICWS sign placement across
from the stop and yield lines ....................................................................................................25 Figure 23. Screenshot. Exemplar from video showing the ICWS sign placements up stream
on the cross road ......................................................................................................................26 Figure 24. Screenshot. Screen from which participants indicated which sign placement
they thought would be most effective ......................................................................................26 Figure 25. Scatter plot. Comprehension and safety factors ...........................................................32 Figure 26. Scatter plot. Safety and affinity factors ........................................................................33 Figure 27. Photo. Sign accompanied by the statement “When the beacons aren’t flashing, it
is not necessary to look for approaching traffic” .....................................................................37

v
Figure 28. Illustration. Recommended ICWS signing for minor road approaches to two major roads...............................................................................................................................41
Figure 29. Illustration. Recommended ICWS signing for minor road approaches to four-lane divided highways..............................................................................................................42

vi
LIST OF TABLES
Table 1. Reported frequency of driver injuries ................................................................................4 Table 2. Reported frequency of crashes by crash type ....................................................................5 Table 3. Crash frequency of 1,306 stop-controlled intersections on California State
highways in 2010 .......................................................................................................................5 Table 4. ICWS treatment crash reduction factors from Empirical Bayes analysis of
67 North Carolina intersections .................................................................................................8 Table 5. ELCSI PFS Empirical Bayes results as a function of crash type for ICWS
treatments at intersections of two-lane stop-controlled roads with two-lane through highways ..................................................................................................................................10
Table 6. ELCSI PFS Empirical Bayes results as a function of crash type for ICWS treatments at intersections of two-lane stop-controlled roads with four-lane through highways ..................................................................................................................................10
Table 7. Video animation content ..................................................................................................13 Table 8. Percent of correct responses to “What does the warning sign mean?” as a function
of presence or absence of a “WHEN FLASHING” placard ....................................................27 Table 9. Percent of correct responses to “What would you do in response to the warning
sign?” as a function of the presence or absence of a “WHEN FLASHING” placard .............28 Table 10. Percent of correct responses to “What does the warning sign mean?” as a
function of sign type ................................................................................................................28 Table 11. Percent of correct responses to “What would you do in response to the warning
sign?” as a function of sign type ..............................................................................................29 Table 12. Percent of correct responses to “What does the warning sign mean?”
(comprehension) and “What would you do in response to the warning sign?” (reaction) as a function of sign location ...................................................................................................29
Table 13. Perception ratings for individual statements ..................................................................30 Table 14. Factor loadings for three-factor solution .......................................................................31 Table 15. Correlations between factors .........................................................................................31 Table 16. Condorcet results for minor road messages accompanied by the “WHEN
FLASHING” placard ...............................................................................................................34 Table 17. Top three messages using three methods of analyzing the rank data ............................35 Table 18. Five most frequent explanations for major road ranking choices ..................................36 Table 19. Five most frequent explanations for message minor road ranking choices ...................36

vii
LIST OF ABBREVIATIONS
AADT average annual daily traffic CMF crash modification factor ELCSI Evaluation of Low Cost Safety Improvement FHWA Federal Highway Administration ICWS intersection conflict warning system LCD liquid crystal display MUTCD Manual on Uniform Traffic Control Devices PFS Pooled Fund Study

1
CHAPTER 1. OBJECTIVE
The overall objective of the Intersection Conflict Warning Systems (ICWSs) Human Factors Research project is to provide recommendations regarding the potential standardization of the content and placement of activated conflict warning signs at rural stop-controlled intersections. The project focuses on warning systems for the intersection of rural two-lane stop-controlled minor roads with the following types of roads:
• Two-lane through roads. • Multilane undivided through roads. • Multilane divided highways.
The project provides treatment recommendations for the through road and minor (stop-controlled) road.
The purpose of the ICWS is to provide warnings to drivers at or approaching a rural intersection of the presence of potentially conflicting vehicles on the intersecting roadway. The components of the system are a sensor to detect the presence of the potentially conflicting vehicle and a warning sign with beacons that flash when activated by the sensor. The warning signs are typically yellow diamonds, although rectangular yellow and blank-out signs (i.e., light-emitting-diode-based signs with yellow lettering that are blank when the power is out) are sometimes used.
On the through road, the warning signs are most often placed upstream of the intersection at the location where an intersection-ahead warning sign (e.g., W2-1) would normally be located.(1) Rectangular overhead signs with beacons at the intersection itself have also been used.
On the minor road, the warning signs may be located across the roadway from the stop line or along the side of the major road with the face of the sign facing the driver when viewed from the stop line. The latter implementation is intended to warn drivers who are already looking in the direction of the potential conflict; the former option is intended to alert drivers who may not have looked for or seen potential conflicts.

3
CHAPTER 2. BACKGROUND
THE CRASH PROBLEM
The extent of the collision problem at rural stop-controlled intersections is difficult to quantify because many States do not inventory intersections or intersection stop controls. Nonetheless, there is evidence of a safety problem at some of these intersections. For instance, in 2009, there were 2,436 people killed in crashes at stop-controlled intersections.(2) The vast majority of these stop-controlled intersection fatalities (96 percent in a “typical state”) occur at rural intersections where speeds are typically greater than 45 mi/h.(2) The most frequent crash type at stop-controlled intersections is an angle crash, where the vehicle with the stop control enters the intersection and is struck by a through vehicle.
These crashes are not evenly distributed across intersections. A Federal Highway Administration (FHWA) Office of Safety report on data from a “typical state” showed that 2 percent of rural stop-controlled intersections account for 12 percent of all crashes and that 50 percent of intersections of that type account for 83 percent of all crashes.(2)
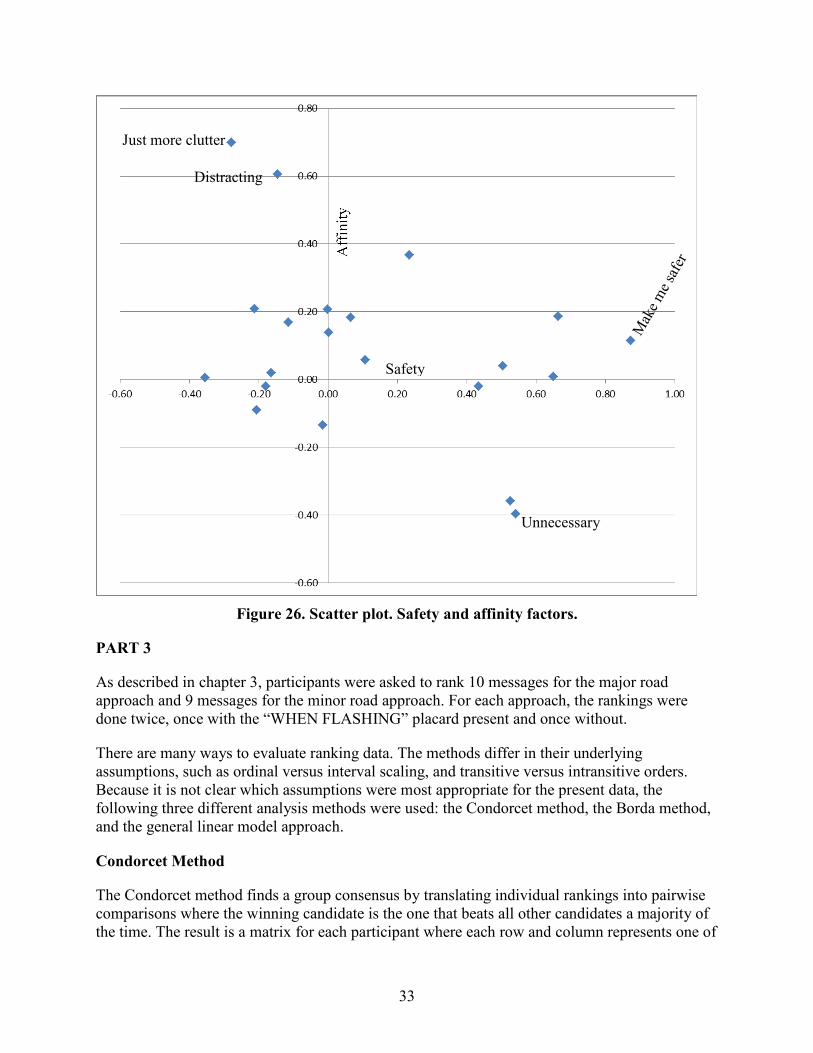
To further explore the crash and fatality problem at rural stop-controlled intersections, the Highway Safety Information System database was used to quantify crashes at rural stop-controlled intersections in California.(3) The data used were from 2010, the latest year for which data were available at the time. The California data were limited to intersections on State highways. The query was limited to four-leg intersections of two-lane roads where the minor road is stop-controlled. The minimum damage reporting requirement in California is $500. This search yielded data for 1,306 intersections and 937 crashes. Figure 1 shows the average number of crashes per intersection as a function of average annual daily traffic (AADT). The error bars in the figure show the 95-percent confidence limits for the means assuming a negative binomial error distribution. The confidence limits suggest that although the amount of traffic is related to the number of crashes (r = 0.45, p < 0.001), there are probably other factors involved.

4
Figure 1. Graph. The number of crashes at each of 1,306 intersections shown as a function
of AADT.
Of the 937 crashes represented in figure 1, complete data on crash type and driver injuries were available for 771 crashes. Table 1 characterizes the extent of driver injuries. A total of 19 percent of the crashes resulted in visible or more serious injuries to a driver, and 6 percent resulted in severe or fatal driver injuries. For the same 771 crashes, the type of collision is shown in table 2. Almost half of the crashes were classified as broadside, which is the type of crash ICWSs are intended to reduce. Some of the other crash types might also be mitigated by ICWSs when those crashes result from drivers’ attempts to avoid broadside collisions.
Table 1. Reported frequency of driver injuries.
Driver Injury Extent Number of Drivers No injury 442 Complaint-pain 180 Visible injury 101 Severe injury 34 Killed 14 Total 771

5
Table 2. Reported frequency of crashes by crash type.
Type of Collision Number of Crashes Broadside 322 Rear end 205 Hit object 87 Side swipe 78 Head on 31 Overturned 24 Other 16 Auto-pedestrian 8 Total 771
It has been suggested that ICWSs may be an appropriate crash mitigation strategy for the most problematic stop-controlled intersections. If the 2010 California data are representative, then only a small number of intersections might need ICWS treatment because only a few intersections are responsible for most of the crashes. Table 3, which includes all 1,306 intersections from the California query, shows the percentage of intersections as a function of the number of crashes they experienced. As can be seen in the table, 7.6 percent of the intersections had three or more crashes and accounted for 46.6 percent of all crashes.
Table 3. Crash frequency of 1,306 stop-controlled intersections on California State highways in 2010.
Number of Crashes
Number of Intersections
Percent of Intersections
Cumulative Percent of Total Crashes
0 819 62.7 100.0 1 276 21.1 100.0 2 112 8.6 70.5 3 41 3.1 46.6 4 26 2.0 33.5 5 12 0.9 22.4 6 8 0.6 16.0 7 3 0.2 10.9 8 5 0.4 8.6 9 2 0.2 4.4 10 1 0.1 2.5 11 0 0.0 1.4 12 0 0.0 1.4 13 1 0.1 1.4
The ENTERPRISE Pooled Fund Study (PFS) undertook a project to collect information and assemble guidance on the use of ICWSs at stop-controlled intersections.(4) The following three activated warning concepts were suggested:

6
• Warn drivers on the through approach to an intersection where vehicles have been detected on the stop-controlled minor road approach and that may be entering or crossing the highway.
• Warn drivers at the stop-controlled minor road approach to an intersection where vehicles are about to arrive on the through road.
• Warn drivers on both the minor and major road approaches of vehicles on the other approach.
The ENTERPRISE PFS concluded that ICWSs are effective mitigation strategies for intersections that either have a demonstrated high incidence of crashes or that have characteristics (such as limited sight distance) that place them at higher risk for crashes involving vehicles whose drivers are unaware of the presence of a potentially conflicting vehicle.(4)
The ENTERPRISE PFS elicited input from its members, other States that have deployed ICWS, the National Committee on Uniform Traffic Control Devices, the American Association of State Highway and Transportation Officials, and the National Association of County Engineers.(4) In addition to several interim products, the PFS produced the following two final reports: Design and Evaluation Guidance for Intersection Conflict Warning Systems (ICWS) and System Requirements for Intersection Conflict Warning Systems (ICWS).(5,6)
The design and evaluation guidance final report describes the following four ICWS conceptual designs:(5)
• Minor road warnings at the intersection of two two-lane roads.
• Minor road warnings at the intersection of a two-lane minor road with a multilane divided highway.
• Two-lane or multilane major road warnings at the intersection with stop-controlled two-lane roads.
• Combined major and minor road ICWSs.
The most complete ICWS safety evaluation for which a final report is available was conducted by the North Carolina Department of Transportation.(7) That evaluation included 74 rural stop-controlled intersections, each of which was paired with 5 similar reference or control intersections that did not receive ICWS treatments. The evaluation employed the Empirical Bayes method for computing predicted crash rates with and without the treatment. The results were computed for (1) all crashes within 150 ft of an intersection, (2) injury crashes, (3) severe (killed or disabled) injury crashes, and (4) frontal impact crashes. All treatment intersections had at least 1 year of posttreatment data; most had more than that. All intersections had at least 3 years of pretreatment data. Where more than 3 years of after data were available, the same number of before and after years were used. Use of the Empirical Bayes method to adjust for possible regression to the mean was vital in this study because the treatment sites were selected at least in part because of their below average safety performance.

7
All of the treatment sites employed loop detector sensors. The location of the detectors upstream of the minor road or in relation to the stop line on the minor road varied greatly between sites; the sample size, though impressive, was not large enough to analyze the effects of detector placement, particularly because sensor placement can be influenced by unique characteristics of individual treatment sites.
Treatment sites were grouped into the following four categories:
• Category 1: Sites with an overhead sign and flasher assembly placed at the intersection to warn drivers on the major (through) road of the presence of vehicles that might be entering from the stop-controlled road.
• Category 2: Sites with an overhead sign and flasher assembly placed at the intersection to provide drivers on the minor (stop-controlled) road with a warning of the approach of potentially conflicting traffic on the major road.
• Category 3: Sites with post-mounted signs and flashing beacons located 350 to 975 ft in advance of the intersection to warn drivers on the major (through) road of the presence of vehicles that might be entering from the stop-controlled road.
• Category 4: Sites that combine the treatments in categories 1 and 3 (i.e., both overhead assemblies and advance warnings directed to drivers on the major road).
The wording on signs varied across sites. Because of sample size considerations, the wording on signs was not evaluated. The North Carolina findings are summarized in table 4.

8
Table 4. ICWS treatment crash reduction factors from Empirical Bayes analysis of 67 North Carolina intersections.
Crash Category Treatment
Type Percent Crash
Reduction Factor Standard Deviation Significance
Total All sites 6.8 4.3 p < 0.05 Total 1 -9.1 9.4 p < 0.05 Total 2 3.5 8.1 p < 0.05 Total 3 19.3 6.7 p < 0.05 Total 4 25.1 12.0 Side impact angle All sites 3.2 5.0 p < 0.05 Side impact angle 1 -9.6 10.5 p < 0.05 Side impact angle 2 -4.3 9.7 p < 0.05 Side impact angle 3 17.3 7.6 p < 0.05 Side impact angle 4 20.3 14.4 Injury All sites 6.4 5.5 p < 0.05 Injury 1 5.0 10.4 p < 0.05 Injury 2 2.4 10.5 p < 0.05 Injury 3 11.0 9.0 p < 0.05 Injury 4 13.0 18.7 Severe injury All sites 16.4 15.9 Severe injury 1 31.1 24.2 p < 0.05 Severe injury 2 14.1 28.2 Severe injury 3 6.8 27.9 Severe injury 4 75.8 21.2
Note: Blank cells indicate results not statistically significant.
Overall, the Simpson and Troy study yielded a small but statistically significant reduction in crashes of 6.8 percent.(7) However, the estimated crash reduction factors varied by type of ICWS treatment. Overhead warnings at the intersection itself and intended for drivers on the major road resulted in a statistically reliable increase of 9.1 percent in the crash estimate, whereas warnings to drivers on the major road given in advance of the intersection on roadside mounted ICWSs resulted in a substantial estimated crash reduction of 19.3 percent. The combination of the advance and overhead ICWS on the major road yielded an even greater crash reduction estimate than for the advance sign alone. However, the number of intersections with the combined treatment was small, and the crash reduction estimate in that case was not statistically significant. Further complicating the evaluation of the overhead mounted ICWS was the fact that while the data suggested a reliable increase in all crashes with this treatment, estimates for severe and fatal injury crashes showed substantial reductions.
The Simpson and Troy study yielded a significant reduction in the estimated percent of crashes as a result of installing ICWS warnings on the stop-controlled (minor) road.(7) The overall estimated crash reduction with this treatment was 3.5 percent; however, the estimated reduction in severe injury crashes was more substantial (14.1 percent) but not statistically reliable.
From a low-cost safety improvement perspective, the North Carolina study suggests that advance ICWS warnings on the major road will provide the greatest safety benefit.(7) The data also

9
suggest that treating all legs of an intersection and reinforcing advance warnings with a warning at the intersection may yield additional crash reduction benefit over and above the benefit of the major road advance warning.
A more extensive Empirical Bayes evaluation of ICWS was conducted for the Evaluation of Low Cost Safety Improvement (ELCSI) PFS.(8) That study included 51 intersections that were included in the North Carolina study as well as data from 14 treated intersections in Missouri and 13 treated intersections in Minnesota.(8,7) The results for two-lane by two-lane intersections are summarized in table 5. The results for two-lane by four-lane intersections are summarized in table 6. A further breakdown of the results suggests that the ICWS treatments are more effective on the major (through) road than on the minor (stop-controlled) road and more effective at intersections with lighting than without lighting. On the major road, post-mounted signs tended to be more effective than overhead signs. It should be noted that the treatments varied greatly both within and between States. In Missouri, the minor road signs were placed on the side of the major road but facing the driver at the stop sign on the minor road. An example of this approach is shown in figure 2. In Minnesota, the minor road warnings at four-lane divided highways were sometimes placed on the far side of the divided highway rather than in the median or overhead. In other cases, the minor road warning was placed upstream of the stop sign. Thus, although it appears that the minor road warnings of the detection of cross traffic on the major road were of limited or no benefit, this finding could be the result of factors that were not considered in the study such as legibility distance or intersection skew angles. The crash reduction benefit of warning major road drivers of the presence of vehicles at cross streets is clear. A crash reduction benefit for warning drivers on the minor road of the approach of major road traffic has yet to be demonstrated.

10
Table 5. ELCSI PFS Empirical Bayes results as a function of crash type for ICWS treatments at intersections of two-lane stop-controlled roads with two-lane
through highways.
Statistic Fatal and
Injury Right Angle
Rear End Night
All Crashes
Empirical Bayes predicted crashes without treatment
516 522 101 129 913
Observed number of crashes with treatment
362 420 43 116 670
Crash modification factor (CMF) 0.70 0.80 0.43 0.90 0.73 Standard error of CMF 0.05 0.05 0.07 0.10 0.04
Table 6. ELCSI PFS Empirical Bayes results as a function of crash type for ICWS treatments at intersections of two-lane stop-controlled roads with four-lane
through highways.
Statistic Fatal and
Injury Right Angle
Rear End Night
All Crashes
Empirical Bayes predicted crashes without treatment
264 296 33 86 465
Observed number of crashes with treatment
212 252 33 53 385
CMF 0.80 0.85 0.97 0.61 0.83 Standard error of CMF 0.07 0.08 0.22 0.11 0.06
Figure 2. Illustration. ICWS warning installation at stop sign at intersection with four-lane
divided highway.

11
CHAPTER 3. METHOD
The current study was conducted to provide empirical support for recommending standard wording of ICWS signs and provide guidance on the placement of warnings on the minor road approaches. The study consisted of four parts.
In the first part, each participant viewed six animations of approaches to intersections with ICWSs. After each video, they were shown still images of the ICWS sign in the video and asked the following two questions: (1) “Please tell us what you would do in response to the sign(s) with the flashing yellow lights” and (2) “What does the warning sign mean?”
In the second part, participants were told the purpose of a particular ICWS sign and then asked to agree or disagree with statements about that sign. Each statement was rated on a seven-point scale where a rating of 1 represented “strongly agree” and a rating of 7 represented “strongly disagree.”
In the third part, participants were asked to rank alternative messages that might be displayed on the sign from the best to the least desirable. There were 9 alternative wordings for the minor approach and 10 alternative wordings for the major road approach. Each set of rankings was done twice, once with the “WHEN FLASHING” placard present and once without. After each of the four ranking exercises, participants were asked to explain what factors influenced their rankings.
In the fourth part, participants were shown images of signs or pairs of signs and asked to agree or disagree with statements concerning the meaning of the flashing beacons or the various states of the blank-out signs.
In all four parts, the stimuli were presented on a 60-inch color liquid crystal display (LCD) screen with a resolution of 1,920 horizontal by 1,080 vertical pixels. Participants were seated about 8 ft from the screen. A table with a large mouse pad and mouse were positioned in front of the participants’ chairs. Participants used a mouse to make rating and ranking responses. A research assistant transcribed verbal responses. The transcriptions were displayed on the LCD screen, and participants were asked to verify transcription accuracy. The room was dimly lit to minimize reflections on the LCD screen.
All of the signs used in this study were developed with SignCAD® software.(9) This software ensured that all the signs were compliant with the Manual on Uniform Traffic Control Devices (MUTCD) except where noted.(1) In scaling signs to the specified dimensions for a given viewing distance, the animation software used for this study can result in legibility distances that are less than would typically be experienced in the real world. To overcome this limitation, all diamond signs used in the videos were scaled to 60 inches per side. In addition, for most of the signs, FHWA E modified font was used instead of the FHWA C font that would normally be used on diamond-shaped warning signs.(10) Otherwise, the spacing of letters and words complied with the MUTCD.(1)
Upon arrival at the laboratory, participants reviewed and signed a record of informed consent, presented their valid driver’s licenses, and completed a vision test using a Bailey Lovie eye

12
chart. After these preliminaries, they were seated in front of the LCD screen and completed the four parts of the experiment. The four parts were always administered in the same order as enumerated in the following sections.
PART 1: WHAT WOULD YOU DO AND WHAT DOES THE SIGN MEAN?
Three of the six videos featured ICWS signs on the through road approach to a stop-controlled intersection, and the remaining three featured ICWS signs for the stop-controlled approach. For each of the three through and stop-controlled approaches, one had a two-lane through road, one had a four-lane undivided through road, and one had a four-lane divided through road. Given that there were 18 different word messages to be evaluated, two different sign locations on the minor road, and warnings with and without a “WHEN FLASHING” placard, only a limited number of options could be displayed in 6 videos. To partially address this limitation, there were 12 videos, with the same 6 scenarios (3 minor road approaches and 3 major road approaches) with different combinations of wordings, placards, and static versus blank-out signs on the 2 sets of 6 videos. To further mitigate the limitation of only 12 unique videos, 6 different orders of video scenarios were used.
All of the videos were created with Autodesk InfraWorks® 360. This software enables users to download roadway alignments, elevation data, and other infrastructure information for many geographic locations. From this information, visualizations of various roadway design proposals can be created. For this study, data for the following three intersections were downloaded:
• Buffalo Shoals Road and Shuford Road in Lincolnton, NC (a two-lane by two-lane intersection).
• Richland Highway and Ervintown Road in Richlands, NC (a four-lane undivided by two-lane intersection).
• U.S. 151 and Old Dubuque in Anamosa, IA (a four-lane divided by two-lane intersection).
The Buffalo Shoals/Shuford and U.S. 151/Old Dubuque intersections were selected because they had existing ICWS treatments. Videos were created for each of the four approach legs of the three intersections, and different ICWS sign/placard treatments were modeled on each approach.
The content of the six video animations shown to each of six groups of participants is described in table 7.

13
Table 7. Video animation content.
Approach Road
Approach Direction
Major Road Message Placard
Road Class
Blank-Out
Sign Location
Group 1 Richland North 4 L U Entering vehicles No Major No Right Ervintown North 4 L U Approaching traffic Yes Minor Yes Across Old Dubuque East 4 L D Watch for approaching traffic No Minor No Missouri Shuford South 2 L Cross traffic No Minor Yes Across U.S. 151 North 4 L D Watch for entering vehicles Yes Major No Right|Left Buffalo Shoals South 2 L Crossing vehicle Yes Major No Right
Group 2 Richland East 4 L U Expect entering traffic No Major No Right Buffalo Shoals North 2 L Crossing vehicle Yes Major No Right US 151 South 4 L D Traffic entering No Major No Right|Left Shufford North 2 L Approaching vehicle Yes Minor No Across Old Dubuque West 4 L D Traffic approaching when flashing Yes Minor No Missouri Ervintown South 4 L U Expect cross traffic No Minor Yes Missouri
Group 3 Buffalo Shoals North 2 L Crossing vehicle Yes Major No Right Richland North 4 L U Entering vehicle No Major No Right U.S. 151 South 4 L D Traffic entering No Major No Right|Left Shuford South 2 L Cross traffic No Minor Yes Across Old Dubuque West 4 L D Traffic approaching when flashing Yes Minor No Missouri Ervintown North 4 L U Approaching traffic Yes Minor Yes Across
Group 4 Shuford North 2 L Approaching vehicle Yes Minor No Across Old Dubuque East 4 L D Watch for approaching traffic No Minor No Missouri Ervintown South 4 L U Expect cross traffic No Minor Yes Missouri U.S. 151 North 4 L D Watch for entering vehicles Yes Major No Right|Left Buffalo Shoals South 2 L Crossing vehicle Yes Major No Right Richland East 4 L U Expect entering traffic No Major No Right

14
Approach Road
Approach Direction
Major Road Message Placard
Road Class
Blank-Out
Sign Location
Group 5 Old Dubuque West 4 L D Traffic approaching when flashing Yes Minor No Missouri Shuford South 2 L Cross traffic No Minor Yes Across Richland East 4 L U Expect entering traffic No Major No Right U.S. 151 South 4 L D Traffic entering No Major No Right|Left Ervintown North 4 L U Approaching traffic Yes Minor Yes Across Buffalo Shoals North 2 L Crossing vehicle Yes Major No Right
Group 6 Old Dubuque East 4 L D Watch for approaching traffic No Minor No Missouri Shuford North 2 L Approaching vehicle Yes Minor No Across Ervintown South 4 L U Expect cross traffic No Minor Yes Missouri Buffalo Shoals South 2 L Crossing vehicle Yes Major No Right Richland North 4 L U Entering vehicle No Major No Right U.S. 151 North 4 L D Watch for entering vehicles Yes Major No Right|Left
2 L = Two-lane. 4 L D = Four-lane divided. 4 L U = Four-lane undivided.

15
A screenshot from one of the two approaches on a two-lane through road to a two-lane stop-controlled intersection is shown in figure 3. A screenshot of one of two approaches on a four-lane divided highway to a two-lane stop-controlled intersection is shown in figure 4. One of two approaches on a four-lane undivided highway to a two-lane stop-controlled intersection is shown in figure 5. One of two stop-controlled intersections with a two-lane through road is shown in figure 6. One of two stop-controlled intersections with a four-lane undivided highway is shown in figure 7. One of two stop-controlled intersections with a four-lane divided highway is shown in figure 8.
Figure 3. Screenshot. Blank-out sign with “WHEN FLASHING” placard along two-lane
approach to a stop-controlled cross street.
Figure 4. Screenshot. ICWS signs on four-lane divided highway approach.

16
Figure 5. Screenshot. ICWS sign on four-lane undivided highway approach.
Figure 6. Screenshot. ICWS warning at intersection with two-lane highway.

17
Figure 7. Screenshot. ICWS warning at stop-controlled intersection with four-lane
undivided highway.
Figure 8. Screenshot. ICWS at stop-controlled approach to four-lane divided highway.
PART 2: ICWS SIGN PERCEPTIONS
In an effort to assess perceptions and attitudes regarding ICWS, participants were presented with 21 statements concerning an ICWS sign and asked to agree or disagree with the statement using a 7-point scale. Before providing these ratings, the participant was given a brief explanation of the sign used in connection with each of the statements. There were two explanations. The minor road explanation is shown in figure 9, and the explanation for the major road warning signs was “This sign is used on a major road to alert drivers that a vehicle has been detected that is about to

18
enter the highway from a cross street.” For any particular participant, the same warning sign message was shown next to each of the 21 statements. Different messages were each of six participant groups. The minor road messages were as follows:
• “ENTERING VEHICLES.” • “EXPECT ENTERING TRAFFIC.” • “CROSSING VEHICLE.”
The major road messages were as follows:
• “APPROACHING VEHICLE.” • “TRAFFIC APPROACHING WHEN FLASHING.” • “WATCH FOR APPROACHING TRAFFIC.”
Figure 9. Screenshot. Explanation of ICWS sign on minor road approach.
None of the signs shown in this part were accompanied by a “WHEN FLASHING” placard. There were 6 different orders for the 21 statements that were evenly distributed across participants.
Figure 10 shows an example of how the statements were presented. Participants made their ratings by using a mouse to click on one of the seven numbers on the left half of the screen. The statements were as follows:
• We need signs like this. • This warning will make some drivers overconfident. • All drivers should understand this warning. • It would be hard to use the information this sign provides. • This warning may be confusing to some people. • This sign is just more clutter on the highway. • Signs like this are distracting. • This warning would make me a safer driver. • This warning will prevent crashes. • This warning would be unreliable. • This sign would get my attention.

19
• This warning is too complicated. • This warning is totally unnecessary. • I would trust this warning. • Other drivers will ignore this sign. • If this sign is NOT flashing, I do NOT need to watch for traffic. • I don’t know how I should respond to this warning. • I would ignore this warning. • This sign does NOT provide enough information. • This warning is easy to understand. • When this sign is flashing, I need to be more alert for danger.
Figure 10. Screenshot. Example of screen used for obtaining agreement ratings.
The statements were organized around a few themes so that a factor analysis of the ratings could potentially reveal something about the mental model participants had of the ICWS. These themes were as follows:
• Does the sign command respect? • Is the sign understandable? • Is the sign viewed as safety related? • Will the sign capture attention? • Is the sign trustworthy?
A balance was sought between questions concerning how the participant would react (e.g., I would trust this warning) and how the participant thought other drivers would react (e.g., other drivers will ignore this sign). A balance was also sought in questions with a positive valance (e.g., we need signs like this) and a negative valance (e.g., signs like this are distracting).

20
PART 3: PREFERENCE RANKING
In this portion of the experiment, participants were asked to rank the alternative wordings on ICWS signs from most preferred to least preferred. There were 9 alternative wordings for the minor road approaches and 10 alternative wordings for the major road approaches. The ranking was preceded by one of the signs and an explanation of the purpose of the sign (the same explanations as provided in part 2). The rankings were performed four times for each approach (major and minor) and with and without the “WHEN FLASHING” placard. Alternatives that included “when flashing” on the diamond sign were always displayed without the placard.
Figure 11 provides an example of the display used to elicit the rankings. A letter was displayed beneath images of signs with each wording. Above the images, on the left side of the screen, were tiles that each had a letter of the alphabet. Participants were asked to use a mouse to drag the tiles from the left side of the screen to the right side and order the letters from top to bottom according to their preference. The initial order of letter tiles was randomized for each participant. Six different orders of the signs, evenly distributed across participants, were displayed across the bottom of the screen.
Figure 11. Screenshot. Example of rating screen for nine alternative minor road warnings.
The wording choices for minor roads were as follows:
• “EXPECT CROSS TRAFFIC.” • “APPROACHING TRAFFIC.” • “ENTERING TRAFFIC.” • “TRAFFIC APPROACHING WHEN FLASHING.” • “APPROACHING VEHICLE.” • “VEHICLES APPROACHING.”

21
• “WATCH FOR APPROACHING TRAFFIC.” • “CROSS TRAFFIC.” • “WATCH FOR APPROACHING VEHICLES.”
The wording choices for major roads were:
• “EXPECT ENTERING TRAFFIC.” • “CROSSING TRAFFIC.” • “TRAFFIC ENTERING WHEN FLASHING.” • “ENTERING VEHICLES.” • “TRAFFIC ENTERING.” • “VEHICLE CROSSING.” • “WATCH FOR ENTERING VEHICLE.” • “WATCH FOR ENTERING TRAFFIC.” • “CROSSING VEHICLE.” • “CROSS TRAFFIC AHEAD.”
Immediately after each ranking exercise, participants were asked to explain why they ranked the signs the way they did. Their verbal responses were transcribed by the researcher. An example of the screen displayed while participants explained their preferences is shown in figure 12.
Figure 12. Screenshot. Example of screen shown while participants were asked to explain
their preferences.
PART 4: COMPREHENSION
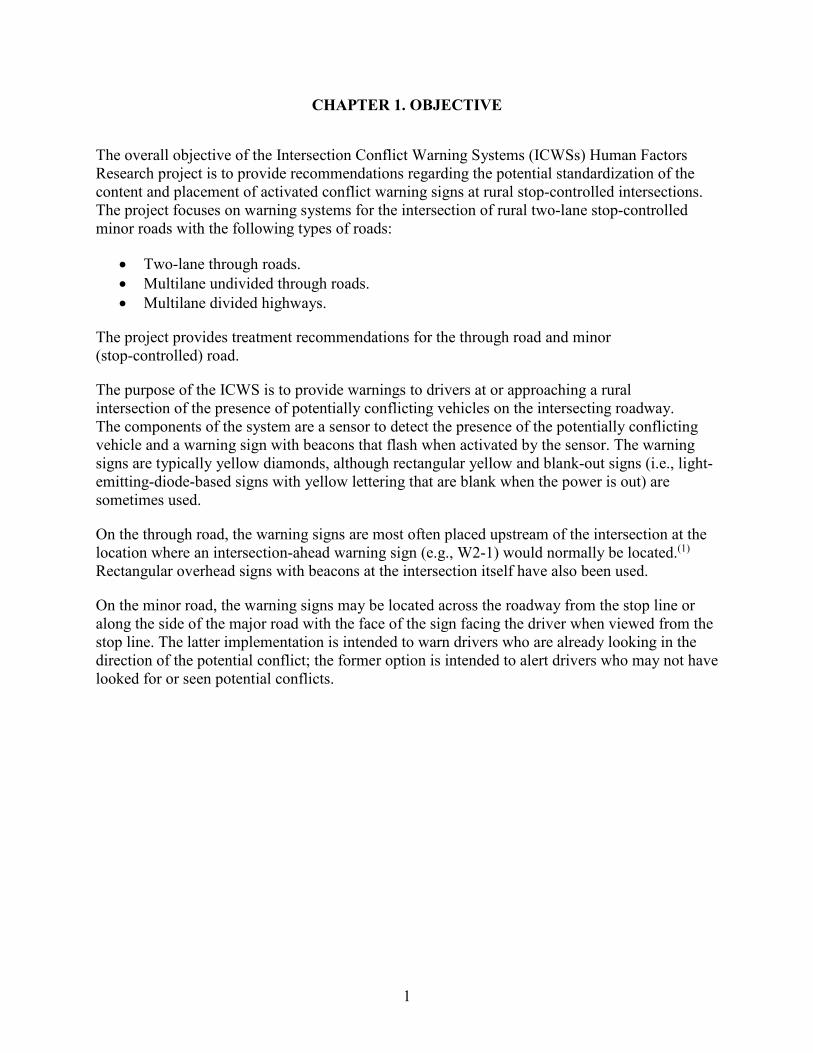
Some agencies use the “WHEN FLASHING” (W16-13) placard with ICWS signs while others do not.(1) The placard is intended to indicate the immediacy of the warning when the beacons are flashing. However, some agencies are concerned that motorists might interpret the signs to mean that no hazard is present when the beacons are not flashing. One goal of the questions in this section was to provide an estimate of how participants interpret the presence or absence of the “WHEN FLASHING” placard. The questions addressing this issue are shown in figure 13 through figure 15.

22
Figure 13. Screenshot. Screen examining comprehension of ICWS signs with placard when
the beacons are flashing.
Figure 14. Screenshot. Screen examining comprehension of ICWS signs with placard when
the beacons are not flashing.
Figure 15. Screenshot. Screen examining whether driver would check for traffic when
beacons are not flashing.

23
Some agencies use blank-out signs for ICWS signage. The main intent of using a blank-out sign is to display no message at all when the beacons cannot function, such as during a power outage. Another goal of this part of the study was to provide an estimate of how the participants interpret ICWS blank-out signs when they are blank. Figure 16 through figure 21 show the screens used to assess comprehension of blank-out ICWS signs.
Figure 16. Screenshot. Screen used to explain why blank-out signs are used.
Figure 17. Screenshot. Screen used to assess comprehension of blank-out message when
beacons are active.

24
Figure 18. Screenshot. Screen used to assess blank-out sign understanding when the
beacons are not active.
Figure 19. Screenshot. Screen used to asses blank-out sign understanding when the sign
is blank.
Figure 20. Screenshot. Screen used to assess interpretation of a blank-out sign when the
sign is on but the beacons are not active.
25
Figure 21. Screenshot. Second screen used to assess interpretation of a blank-out sign when
the sign is on but the beacons are not active.
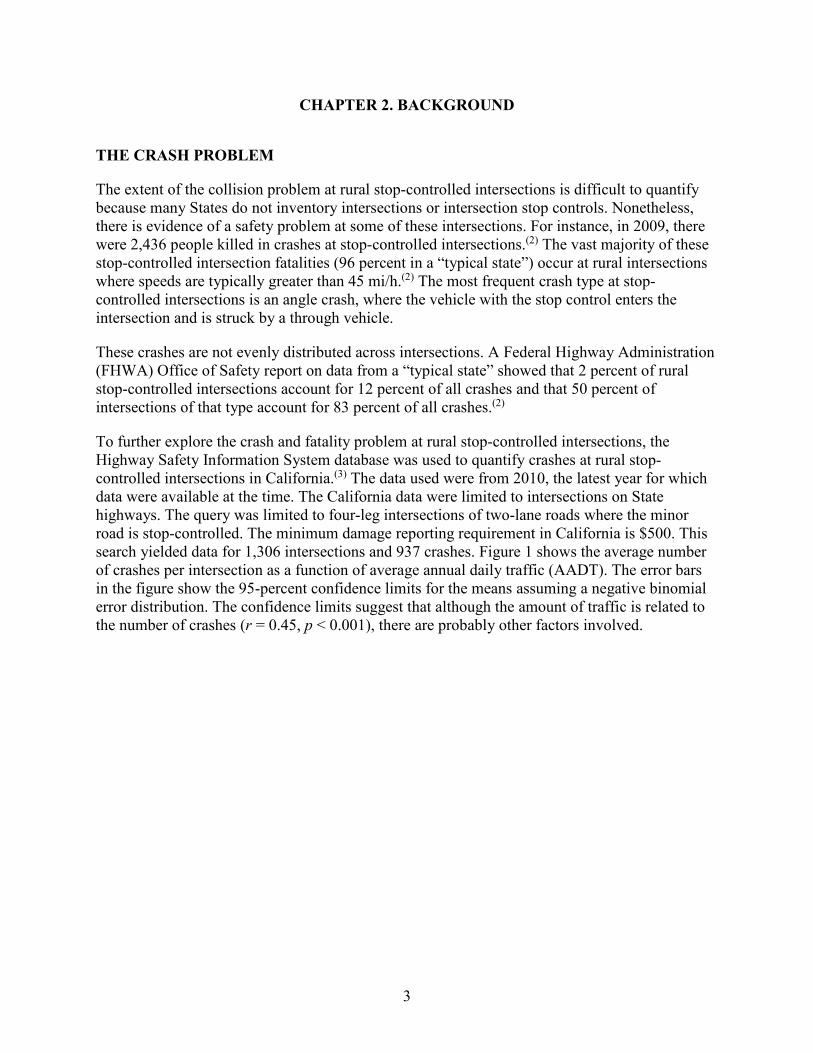
The final question in this section was intended to obtain a preference for the location of ICWS warning signs for minor road drivers at four-lane divided highways. This question asked whether the warning would be most effective if the signs were placed in a location close to where the approaching vehicles were located or directly across from the driver when looking forward at the stop sign. All of the participants had previously seen video animations that used both placement locations. Before asking which location they thought would be more effective, participants were shown short video clips with exemplars of each placement. Figure 22 shows the placement across from the stop line. Figure 23 shows the upstream placement. Figure 24 shows the screen that participants used to indicate their preference among the two setups.
Figure 22. Screenshot. Exemplar from video showing the ICWS sign placement across from
the stop and yield lines.

26
Figure 23. Screenshot. Exemplar from video showing the ICWS sign placements up stream
on the cross road.
Figure 24. Screenshot. Screen from which participants indicated which sign placement they
thought would be most effective.
PARTICIPANTS
Out of 189 participants, 96 participants were over 46 years old. Among the older participants, 48 were male, and 48 were female. Among the younger participants, 47 were male, and 46 were female. All participants possessed a valid driver’s license and had a visual acuity of 20/40 or better. All participants resided in the Washington, DC, metropolitan area, mostly in Northern Virginia. The mean age of male participants was 47 years old (range 19 to 78 years old), and the mean age of female participants was 45 years old (range 18 to 79 years old). All participants completed an informed consent form prior to beginning. The choice of age 46 as the criterion for splitting young from old age groups was somewhat arbitrary but still based on the fact that the median age database from which participants were recruited was 46 years old.

27
CHAPTER 4. RESULTS
PART 1
After each of six videos, participants were asked the following two questions: “What would you do in response to the warning sign(s)?” and “What do the warning sign(s) mean?” The researchers typed the participants’ verbal responses, (displayed on the same screen as the videos) and asked the participants to verify that the transcribed response was correct.
During data reduction, the responses to the two questions were classified by the analysts as correct or incorrect, and the open-ended responses were reduced to up to three categories that best reflected the response. On the minor road, responses such as “I would slow down” were scored as incorrect. It may be that many participants did not stop for stop signs because many of those who said they would slow down then gave a correct interpretation of what the sign meant. This was reflected in the overall findings where the correct meaning was given around 86 percent of the time, whereas the correct action was described far less often. Some responses were scored as incorrect because the participants did not answer the question but rather editorialized about the signs being unnecessary or duplicative and then, even upon further prompting, would go no further.
Another challenge in interpreting the data from part 1 is that with six videos, it was not possible to conduct a factorial analysis to examine sign placement effects, placard use, and blank-out versus static warning signs. For this reason, those three factors were analyzed individually, and possible interactions (e.g., placard on blank-out compared with placard on static) were not examined.
The statistical analyses reported in this section were performed using generalized estimating equation models with binomial response distributions and logit link functions.
Effect of “WHEN FLASHING” Placard on Warning Comprehension and Stated Behavior
Comprehension of the conflict warning signs was not affected by the presence or absence of the “WHEN FLASHING” placard ( 2 (1) = 0.0, p = 1.0). The number of responses judged correct as a function of placard presence is shown in table 8.
Table 8. Percent of correct responses to “What does the warning sign mean?” as a function of presence or absence of a “WHEN FLASHING” placard.
“WHEN FLASHING” Placard
Percent Correct
Absent 86.4 Present 86.4
Although 86.4 percent of responses were judged correct when asked what the sign(s) meant, the percentage of correct responses to the “what would you do” question was lower (73.4 percent) both with and without the placard. Again, the presence or absence of the “WHEN FLASHING” placard did not have a significant effect ( 2 (1) = 0.0, p > 1.0). Table 9 shows the number of
χ
χ

28
correct and incorrect responses to the question “What would you do in response to the warning signs?”
Table 9. Percent of correct responses to “What would you do in response to the warning sign?” as a function of the presence or absence of a “WHEN FLASHING” placard.
“WHEN FLASHING” Placard
Percent Correct
Absent 73.4 Present 73.4
The most frequent incorrect reactions were ignoring the sign and making irrelevant comments (e.g., “sign is unnecessary”).
The comprehension of the signs with and without the “WHEN FLASHING” placard did not vary as a function of either major or minor approach ( 2
(1) = 1.3, p = 0.2) or as a function of road type on the major road (i.e., two-lane, four-lane undivided, or 4-lane divided) ( 2
(2) = 1.3, p = 0.5). The stated response to the “WHEN FLASHING” placard did not interact with approach type ( 2
(1) = 0.43, p = 0.5) or major road type ( 2 (2) = 2.9, p = 0.3).
In summary, no evidence was found that the presence or absence of the “WHEN FLASHING” placard affected either driver understanding of the ICWS meaning or what drivers say they would do in response to the ICWS signs.
Effect of Blank-Out Versus Static Sign on Comprehension and Stated Behavior
Comprehension of the meaning of the warning signs was not affected by whether the warning was depicted on a standard sign or a blank-out sign ( 2 (1) = 0.01, p = 0.9). The percentage of correct responses as to the meaning of the warnings as a function of sign type is shown in table 10.
Table 10. Percent of correct responses to “What does the warning sign mean?” as a function of sign type.
Sign Type Percent Correct Static 86.5 Blank-out 86.2
What participants said they would do in response to the signs varied significantly as a function of sign type. As can be seen in table 11, participants were more likely to indicate a correct action in response to the static signs than the blank-out signs ( 2 (1) = 6.3, p < 0.05). Whether this small difference is of practical importance is dubious because the proportion of irrelevant responses was substantially greater with the blank-out sign (7 percent with blank-out versus 3.5 percent with static), and correct identification of meaning was not significantly different.
χ χ
χ χ
χ
χ

29
Table 11. Percent of correct responses to “What would you do in response to the warning sign?” as a function of sign type.
Sign Type Percent Correct Static 75.3 Blank-out 67.5
In summary, static and blank-out signs were found to be about equally effective in terms of comprehension, but static signs were more likely to result in a correct action.
Effect of Sign Placement on Comprehension and Stated Behavior
The location of the minor-road conflict significantly affected both comprehension ( 2 (1) = 5.6, p < 0.02) and what drivers said they would do in response ( 2 (2) = 15.5, p < 0.001). The percentage of correct comprehension and reaction responses are shown in table 12.
Table 12. Percent of correct responses to “What does the warning sign mean?” (comprehension) and “What would you do in response to the warning sign?” (reaction) as a
function of sign location.
Sign Location Percent Correct Comprehension
Percent Correct Reaction
Across 87.3 73.5 Upstream 80.3 58.8
In summary, location mattered. When the minor road ICWS sign faced the drivers as they approached the stop sign, both comprehension and response were better than when they needed to look in the direction of the approaching traffic to see the sign.
PART 2
The perception rating results are shown in table 13. Complete data were available for 187 participants. Recall that not all participants saw the same messages; there were six different signs. Multivariate analysis of variance with statement rating (where 1 represented “strongly agree” and 7 represented “strongly disagree”) as the dependent measure and the six signs as the independent variable suggested that there was no effect of different signs on agreement with the statements F (105, 792) = 1.0, p > 0.05, where the F statistic is an approximation from Wilks’ Lambda.
χ χ

30
Table 13. Perception ratings for individual statements.
Statement Number Statement Mean
Standard Error
95-Percent Confidence Interval Lower Bound
Upper Bound
1 This warning is too complicated. 5.41 0.12 5.18 5.64 2 Signs like this are distracting. 5.12 0.12 4.90 5.35 3 This sign would get my attention. 1.89 0.07 1.74 2.03 4 When this sign is flashing, I need to be more alert
for danger. 1.75 0.08 1.60 1.90
5 This warning is totally unnecessary. 5.50 0.11 5.27 5.72 6 I would ignore this warning. 5.99 0.09 5.80 6.17 7 This sign is just more clutter on the highway. 5.08 0.13 4.83 5.33 8 We need signs like this. 2.65 0.11 2.42 2.87 9 Other drivers will ignore this sign. 3.88 0.11 3.66 4.09 10 This warning is easy to understand. 2.45 0.12 2.22 2.67 11 All drivers should understand this warning. 2.37 0.12 2.14 2.60 12 This warning may be confusing to some people. 3.83 0.13 3.57 4.09 13 I don’t know how I should respond to this
warning. 5.60 0.11 5.39 5.81
14 This warning will prevent crashes. 2.87 0.11 2.66 3.08 15 This warning would make me a safer driver. 2.63 0.10 2.44 2.82 16 This warning will make some drivers
overconfident. 4.10 0.11 3.87 4.32
17 If this sign is NOT flashing, I do NOT need to watch for traffic.
5.06 0.14 4.78 5.34
18 I would trust this warning. 2.63 0.11 2.42 2.84 19 This warning would be unreliable. 4.77 0.12 4.54 5.01 20 This sign does NOT provide enough information. 4.71 0.14 4.45 4.98 21 It would be hard to use the information this sign
provides. 5.30 0.12 5.07 5.53
Given that there was no reason to suspect an effect of the six sign messages seen by different groups of participants, the 187 ratings on 21 statements were submitted to a maximum likelihood factor analysis. To minimize the number of factors with negative loadings, the polarity of the ratings was changed for statements 5, 10, and 11 by subtracting the original ratings from 8.
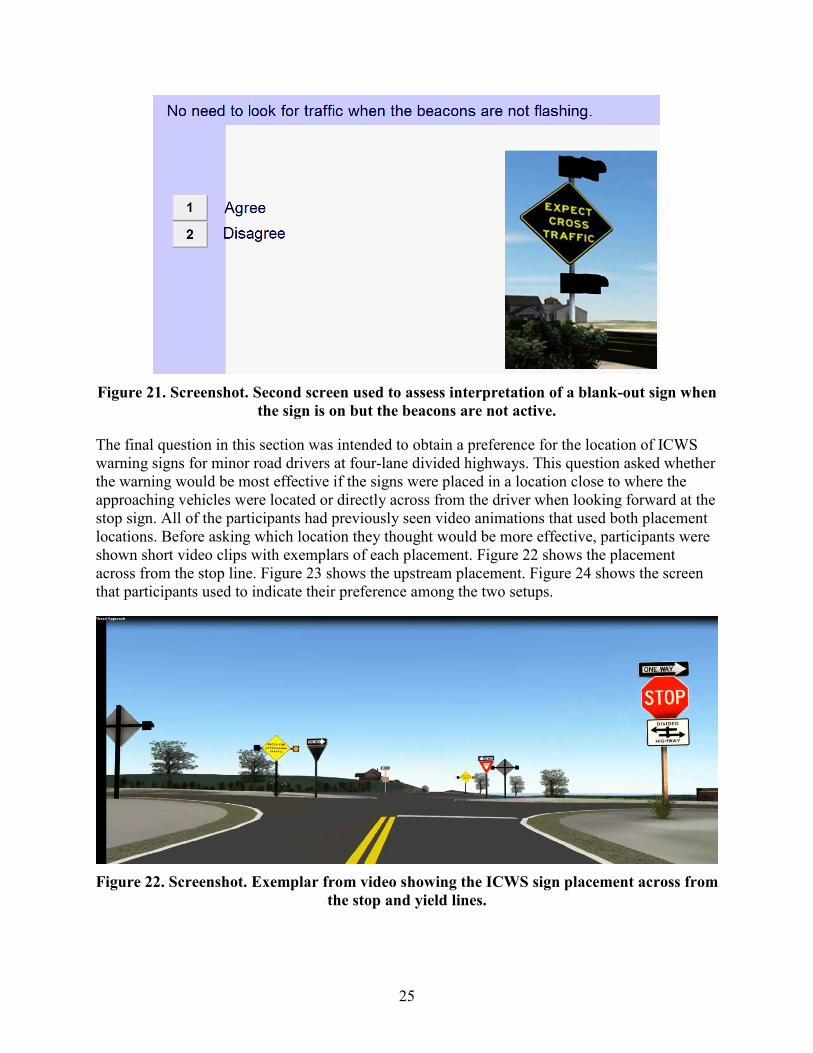
The promax rotated factor pattern that resulted from the factor analysis is shown in table 14. The promax rotation allows factors to be correlated. The three-factor correlation matrix is shown in table 15. The three factors accounted for 74, 19, and 7 percent of the variance in the ratings, respectively. The first factor appeared to be associated with how well the messages were understood and was labeled “comprehension.” The second factor appeared to be related to safety. The third factor appeared to be related to feelings of how necessary or distracting the signs might be and was labelled “affinity.” This analysis suggests that when thinking about the warning sign

31
messages, the participants first considered how understandable the signs were, then the safety implications of the signs, and finally how likeable or pleasing the messages were.
Table 14. Factor loadings for three-factor solution.
Statement Comprehension Safety Affinity This warning is easy to understand. 0.79 0.00 0.14 All drivers should understand this warning. 0.67 -0.02 -0.13 This warning may be confusing to some people. 0.64 0.11 0.06 This warning is too complicated. 0.63 0.06 0.18 This sign does NOT provide enough information. 0.61 -0.21 -0.09 I don’t know how I should respond to this warning. 0.58 0.00 0.21 It would be hard to use the information this sign provides.
0.56 -0.12 0.17
This warning would be unreliable. 0.45 -0.35 0.01 This warning would make me a safer driver. -0.05 0.87 0.11 This warning will prevent crashes. -0.12 0.66 0.19 When this sign is flashing, I need to be more alert for danger.
0.25 0.65 0.01
This warning is totally unnecessary. -0.01 0.54 -0.40 We need signs like this. -0.01 0.52 -0.36 This sign would get my attention. -0.17 0.50 0.04 I would trust this warning. -0.24 0.43 -0.02 If this sign is NOT flashing, I do NOT need to watch for traffic.
0.13 0.23 0.37
Signs like this are distracting. 0.11 -0.15 0.61 This warning will make some drivers overconfident. 0.16 -0.16 0.02 Other drivers will ignore this sign. 0.18 -0.18 -0.02 I would ignore this warning. 0.12 -0.21 0.21 This sign is just more clutter on the highway. -0.11 -0.28 0.70
Note: The criterion used for determining that a variable loaded on a factor was 0.40. Loadings whose absolute value exceeded 0.40 are indicated by bold type.
Table 15. Correlations between factors.
Factor Name Comprehension Safety Affinity Comprehension 1.00 0.18 0.31 Safety 0.18 1.00 0.48 Affinity 0.31 0.48 1.00
Figure 25 shows the factor pattern loadings for the comprehension and safety factors plotted on orthogonal axes and does not represent the 0.18 correlation between these factors.

32
Figure 25. Scatter plot. Comprehension and safety factors.
Figure 26 shows the factor pattern loadings for the safety and affinity factors on orthogonal axes and does not represent the 0.48 correlation between these factors.
Comprehension
33
Figure 26. Scatter plot. Safety and affinity factors.
PART 3
As described in chapter 3, participants were asked to rank 10 messages for the major road approach and 9 messages for the minor road approach. For each approach, the rankings were done twice, once with the “WHEN FLASHING” placard present and once without.
There are many ways to evaluate ranking data. The methods differ in their underlying assumptions, such as ordinal versus interval scaling, and transitive versus intransitive orders. Because it is not clear which assumptions were most appropriate for the present data, the following three different analysis methods were used: the Condorcet method, the Borda method, and the general linear model approach.
Condorcet Method
The Condorcet method finds a group consensus by translating individual rankings into pairwise comparisons where the winning candidate is the one that beats all other candidates a majority of the time. The result is a matrix for each participant where each row and column represents one of
Safety
Just more clutter
Distracting
Unnecessary

34
the signs. The matrices of all participants were added together, and the sign with the highest row total became the winner. Table 16 shows the Condorcet results for the minor road messages when the “WHEN FLASHING” placard was present.
Table 16. Condorcet results for minor road messages accompanied by the “WHEN FLASHING” placard.
Message
App
roac
hing
Tra
ffic
App
roac
hing
Veh
icle
Cro
ss T
raffi
c
Ent
erin
g T
raffi
c
Exp
ect C
ross
Tra
ffic
Tra
ffic
App
roac
hing
Whe
n Fl
ashi
ng
Veh
icle
s App
roac
hing
Wat
ch fo
r A
ppro
achi
ng T
raffi
c
Wat
ch fo
r A
ppro
achi
ng V
ehic
les
Tot
al
Ran
k
Approaching Traffic 0 117 76 92 79 126 115 104 103 812 3 Approaching Vehicle 70 0 72 84 65 125 89 93 88 686 9 Cross Traffic 111 115 0 113 100 119 110 105 105 878 1 Entering Traffic 95 103 74 0 87 114 102 92 97 764 4 Expect Cross Traffic 108 122 87 100 0 122 114 106 112 871 2 Traffic Approaching When Flashing 61 62 68 73 65 0 58 63 54 504 10 Vehicles Approaching 72 98 77 85 73 129 0 91 94 719 8 Watch For Approaching Traffic 83 94 82 95 81 124 96 0 90 745 6 Watch For Approaching Vehicles 84 99 82 90 75 133 93 97 0 753 5
Borda Method
The Borda method assigns point values inversely related to rank order (i.e., the top-ranked sign gets the most points). The winning sign is the one with the most points when summed across all participants.
General Linear Model Method
This method estimates means and standard deviations for each sign’s ranking. It assumes a normal distribution of means and homogeneity of variance. This method enables an estimate of which differences between signs are statistically reliable if the assumptions of the model are met.
Ranking Results
Table 17 shows the top three messages by each method of analysis for each of the ranking scenarios.

35
Table 17. Top three messages using three methods of analyzing the rank data.
Situation Rank Condorcet Method Borda Method General Linear Model Method
On minor road with “WHEN FLASHING” placard
1 Cross traffic Cross traffic Cross traffic 2 Expect cross traffic Expect cross traffic Expect cross traffic 3 Entering traffic Approaching traffic Approaching traffic
On minor road with no placard
1 Expect cross traffic Expect cross traffic Expect cross traffic 2 Traffic approaching
when flashing Traffic approaching when flashing
Traffic approaching when flashing
3 Cross traffic Cross traffic Cross traffic On major road with “WHEN FLASHING” placard
1 Cross traffic ahead Cross traffic ahead Cross traffic ahead 2 Crossing traffic Crossing traffic Crossing traffic 3 Vehicle crossing Vehicle crossing Vehicle crossing
On major with no placard
1 Cross traffic ahead Cross traffic ahead Cross traffic ahead 2 Vehicle crossing Vehicle crossing Vehicle crossing 3 Crossing traffic Crossing traffic Crossing traffic
For the minor road approach with a “WHEN FLASHING” placard, the top two message choices were the same for all three methods of analysis. “CROSS TRAFFIC” was the preferred choice with “EXPECT CROSS TRAFFIC” as the runner up. The top two preferred messages were changed when the “WHEN FLASHING” placard was not present. With no placard, the top minor road choice was “EXPECT CROSS TRAFFIC.” The runner up was “TRAFFIC APPROACHING WHEN FLASHING.” With no placard, “CROSS TRAFFIC” was the third most preferred choice.
On the major road, “CROSS TRAFFIC AHEAD” was the top choice regardless of analysis method and whether or not a “WHEN FLASHING” placard was present. “CROSSING TRAFFIC” was the runner up choice. “CROSSING TRAFFIC” and “VEHICLE CROSSING” exchanged second and third places depending on whether the placard was present.
Participants’ Explanations for Their Rankings
After ranking a set of alternative messages, participants were asked to indicate why they ranked the signs the way they did. After all participants had completed the study, analysts reduced the participants’ open-ended responses to a limited number of categories intended to capture the essence of the explanations. Each participant’s responses were reduced to 21 response architypes, with each participant having up to 3 categorized explanations.
The top five categorized explanations for the major road rankings are shown in table 18. The two most frequent comments indicated that the reason “CROSS TRAFFIC” and “EXPECT CROSS TRAFFIC” were favored was that the letters were large, which was possible because the messages were short, which allowed for the use of larger letters. The explanation “wordy signs more clear” refers to a preference for the message “TRAFFIC APPROACHING WHEN

36
FLASHING” which, in the absence of a placard, was judged more complete and clear by many participants and was also favored by those participants who do not like placards.
Table 18. Five most frequent explanations for major road ranking choices.
Explanation No Placard
“WHEN FLASHING”
Placard Big bold letters 35 34 Like CROSS best 20 13 Short messages 56 61 TRAFFIC better than VEHICLES 15 20 Wordy signs more clear 25 16
Note: Bold text indicates the explanation with the highest results.
The explanations for the minor road approach ratings were similar to those for the major road. These are shown in table 19.
Table 19. Five most frequent explanations for message minor road ranking choices.
Explanation No Placard
“WHEN FLASHING”
Placard Big bold letters 43 43 Like CROSS best 7 10 Short messages 43 42 TRAFFIC better than VEHICLES 13 14 Wordy signs more clear 15 10
Note: Bold text indicates the explanation with the highest results.
PART 4
Interpretation of “WHEN FLASHING” Placard When the Beacons Were On
The first question in part 4 asked participants to agree or disagree with the statement that the two signs shown in figure 13 meant the same thing. The majority of participants (70 percent) agreed that the signs did mean the same thing. Because participants were not asked to explain their responses in part 4, it is not clear how the 30 percent who thought the signs did not mean the same thing interpreted the signs. From responses in part 1, it is likely that some participants thought that the sign without the placard always flashed, whereas the sign with the placard indicated that there actually was an entering vehicle.
If there was a “WHEN FLASHING” placard, the preferred wording for the minor approach ICWS was “CROSS TRAFFIC.” When there was no placard, there was a slight preference for “EXPECT CROSS TRAFFIC.” However, more than a few participants commented that “you should always expect cross traffic.” If “EXPECT” was used with “CROSS TRAFFIC,” it should only be when there was no placard.

37
Although some participants preferred having “WHEN FLASHING” on the diamond sign, this necessarily resulted in lettering that was smaller, which made the signs hard to read from a distance and took longer to comprehend when it became readable. For instance, on a 48-inch diamond sign, “CROSS TRAFFIC” can be applied with 8-inch FHWA Type C lettering, whereas “WATCH FOR ENTERING VEHICLE WHEN FLASHING” limits the size of the letters to 4 inches.
Interpretation of the “WHEN FLASHING” Placard When the Beacons Were Off
The second question in part 4 asked participants to agree or disagree with the statement that when not flashing, the two signs shown in figure 14 meant the same thing. Participants were nearly evenly split on this: 53 percent agreed that the signs mean the same thing, and 47 percent disagreed. In part 3, many participants indicated that the placard clarified the meaning of the signs and inferred that cross traffic was not present when the beacons were not on. Without the placard, those subjects often suggested that it was unclear what they should do in response to the message.
The third question in part 4 (see figure 27) asked participants to agree or disagree with the statement that “when the beacons aren’t flashing, it is not necessary to look for approaching traffic.” This statement drew agreement from 28 percent of the participants.
Figure 27. Photo. Sign accompanied by the statement “When the beacons aren’t flashing, it
is not necessary to look for approaching traffic.”
Interpretation of Blank-Out Signs
A series of five questions in part 4 were intended to clarify how participants interpreted blank-out signs in their various blank-out states. The first statement in the blank-out series, “Cross traffic is present,” was accompanied by a picture of a blank-out sign with the beacons on and the message “EXPECT CROSS TRAFFIC.” The majority of participants (89 percent) agreed with this statement. The second statement in the blank-out series was accompanied by the same sign as the first question except that the beacons were off. The statement with this picture, “Cross traffic is not present,” was agreed with by 30 percent of the participants.
The third statement in this series, “Today, there is no traffic approaching,” showed a blank blank-out sign (see figure 19). A surprising 73 percent of participants agreed with the statement that asserted the blank sign meant there was no traffic approaching. This was despite fact that
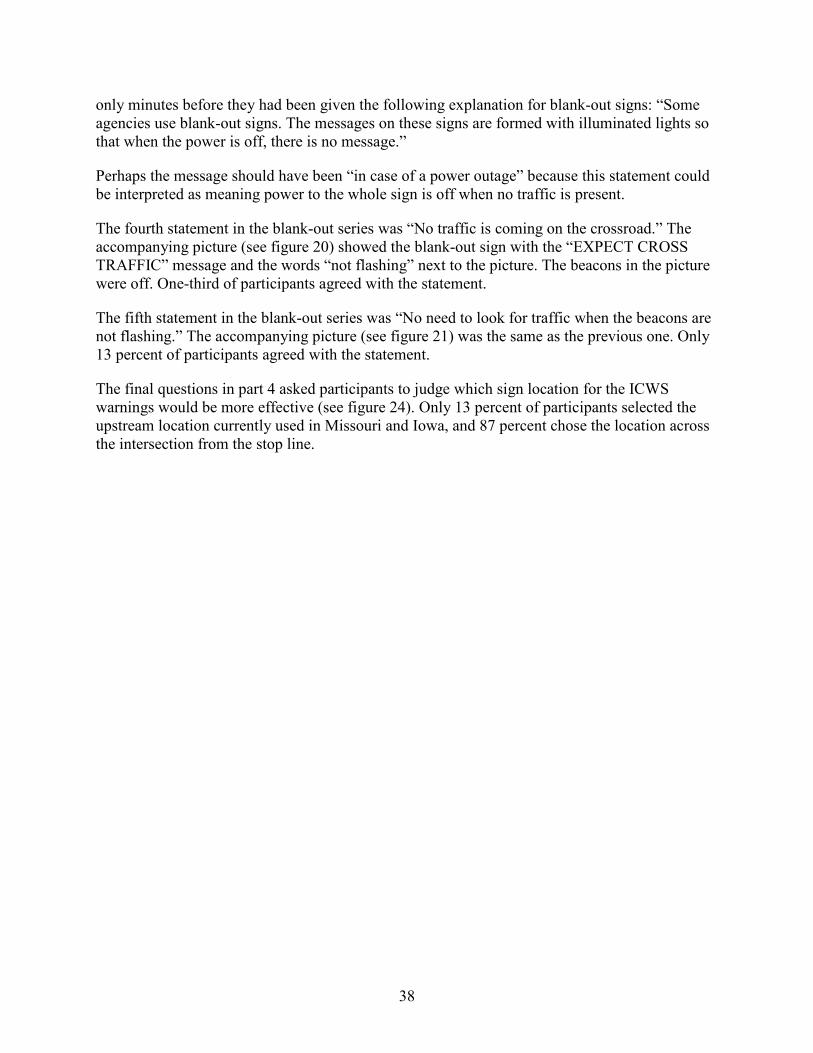
38
only minutes before they had been given the following explanation for blank-out signs: “Some agencies use blank-out signs. The messages on these signs are formed with illuminated lights so that when the power is off, there is no message.”
Perhaps the message should have been “in case of a power outage” because this statement could be interpreted as meaning power to the whole sign is off when no traffic is present.
The fourth statement in the blank-out series was “No traffic is coming on the crossroad.” The accompanying picture (see figure 20) showed the blank-out sign with the “EXPECT CROSS TRAFFIC” message and the words “not flashing” next to the picture. The beacons in the picture were off. One-third of participants agreed with the statement.
The fifth statement in the blank-out series was “No need to look for traffic when the beacons are not flashing.” The accompanying picture (see figure 21) was the same as the previous one. Only 13 percent of participants agreed with the statement.
The final questions in part 4 asked participants to judge which sign location for the ICWS warnings would be more effective (see figure 24). Only 13 percent of participants selected the upstream location currently used in Missouri and Iowa, and 87 percent chose the location across the intersection from the stop line.
39
CHAPTER 5. DISCUSSION
In terms of sign comprehension, it did not seem to matter whether the “WHEN FLASHING” placard was present or not. Comprehension was similarly unaffected by whether the conflict warning was on a static yellow-diamond or on a dynamic blank-out sign. It was believed that blank-out signs would prevent drivers from misinterpreting non-flashing beacons (due to power failure) as the absence of conflicts. Present findings seem to contradict this belief; 73 percent of participants believed the blank blank-out signs meant that conflicting traffic was not present (see part 4 in chapter 4) despite being presented moments prior with a statement explaining that blank blank-out signs indicated a power failure.
A large subset of participants in this study did not comprehend the ICWS warning signs on the minor road approaches when the signs were placed to their left and right (directions where drivers must look to detect oncoming crossroad traffic). More than a few participants commented that those signs were facing in the wrong direction or “not for me.” A total of 77 percent of participants gave correct responses when asked what they would do in response to the minor road signs when those signs were directly ahead of them when stopped at the stop line. In this study, “directly ahead” was always on the far left corner of the intersection or on the left side of the median opening. It was assumed that placing the sign on the right corner, the right side of the median opening, or even overhead would be equally effective, but this assumption was not tested.
Participants overwhelmingly preferred signs with large letters, which was possible only on signs with short messages. In the laboratory, as in the real world, legibility was a function of font size. Although a number of participants preferred the syntactically more complete messages as their top choice, those same participants also identified the larger type signs as their next most preferred message. Overall, “CROSS TRAFFIC,” “EXPECT CROSS TRAFFIC,” and “CROSS TRAFFIC AHEAD” were preferred over all other ICWS message choices. All three of these messages fit on the diamond-shaped signs with the largest font used in this study. The larger font allowed a greater legibility distance and would also be expected to yield slightly shorter reading times, although reading time was not assessed in this study.


41
CHAPTER 6. RECOMMENDATIONS
On minor roads, ICWS signs should carry the message “CROSS TRAFFIC.” “EXPECT CROSS TRAFFIC” is an acceptable option if the “WHEN FLASHING” placard is not present. “CROSS TRAFFIC AHEAD” is the recommended message for major road ICWS. The recommended ICWS signing for minor road approaches to two-lane main roads is depicted in figure 28. The recommended ICWS signing for minor road approaches to four-lane divided highways is depicted in figure 29. Additional required signs, such as one-way and do not enter, have been omitted from figure 29 in order to simplify this document.
Figure 28. Illustration. Recommended ICWS signing for minor road approaches to
two major roads.

42
Figure 29. Illustration. Recommended ICWS signing for minor road approaches to four-
lane divided highways.
Minor road intersections with four-lane undivided highways should be signed in a manner consistent with that for intersections with two-lane main roads. For divided highway intersections with narrow medians, engineering judgment should be used in the decision to locate the minor road warnings on the median, overhead, or on the far side of the intersection.
This study did not address sign location on the major road. The results of the Simpson and Troy study suggest that overhead signs at the intersection may not be effective.(7) Therefore, placing the major road warnings adjacent to upstream shoulders is recommended. In the present study, the activated sign stimuli were placed downstream from a conventional intersection-ahead symbol sign (MUTCD, W2-1) about halfway between the symbol sign and the minor road intersection.(1) Whether both the standard intersection warning and the activated sign are needed was not addressed. The activated sign placement should probably be consistent with the guidance in table 2C-4 of the MUTCD for intersection warning signs.(1)
About 70 percent of participants interpreted the active ICWS signs as meaning the same thing with or without the “WHEN FLASHING” placard. Some drivers (up to 50 percent based on the results of this study) interpreted the signs as meaning there was no cross traffic when the ICWS beacons were not flashing. The finding that 28 percent of participants felt that the inactive sign indicated that they did not need to check for cross traffic is of concern. The presence of the “WHEN FLASHING” placard did not seem to be the source of this misunderstanding. Because the ICWS signs were activated, and the intent of the “WHEN FLASHING” placard was to emphasize that point, it is recommended that the placard be used. Education or public outreach may be used to counter the unintended and dangerous conclusion that caution is not necessary

43
when the beacons are inactive. As more than a few participants said, “You should always expect cross traffic.” The activated signs are intended to inform drivers of cross traffic that they might otherwise not detect because of either sight restrictions or perceptual error. The intent is not to inform drivers that they do not need to stop for stop signs or attend to hazards at intersections. A frequent comment in part 1 of this experiment was that the extra caution was needed when the beacons were flashing—this is indeed the logic behind sensor-triggered warnings, and any outreach should emphasize this concept.
The meaning and rationale of blank-out signs for the ICWS application is not easily communicated to drivers. Static signs should be expected to be as effective as blank-out signs at a much lower cost for installation and maintenance. Blank-out signs are not recommended for ICWS applications. Drivers’ misinterpretations of static signs in the event of power failure or sensor malfunction may be addressed with education and outreach.
Recommendations on beacon placement are beyond the scope of this research. However, the MUTCD guidance on beacon placement should be adequate.(1) Where two beacons are used, either to the sides of the warning signs or above and below, alternating beacons should be used to provide greater conspicuity and reduce the possibility of comfort or disability glare.
All of the ICWS sign alternatives shown to participants in this study were diamond shaped. Given the messages recommended here, diamond-shaped signs should be sufficient for all ICWS applications. However, rectangular warning signs with the same messages should be equally effective as diamond-shaped signs.


45
REFERENCES
1. Federal Highway Administration. (2009). Manual on Uniform Traffic Control Devices for Streets and Highways: 2009 Edition, Federal Highway Administration, Washington, DC, obtained from: http://mutcd.fhwa.dot.gov/pdfs/2009/mutcd2009edition.pdf, last accessed June 17, 2014.
2. Bryer, T.E. (2011). Stop-Controlled Intersection Safety: Through Route Activated Warning Systems, Report No. FHWA-SA-11-015, Federal Highway Administration, Washington, DC.
3. Federal Highway Administration. (2014). HSIS: Highway Safety Information System, Federal Highway Administration, Washington, DC, obtained from: www.HSISinfo.org, last accessed August 5, 2014.
4. The ENTERPRISE Program. (2014). ICWS-Coordination and Systems Engineering, ENTERPRISE, Roseville, MN, obtained from: http://www.enterprise.prog.org/projects_ completed.html, last accessed July 24, 2014.
5. Crowson, G. and Jackels, J. (2011). Design and Evaluation Guidance for Intersection Conflict Warning Systems (ICWS), ENTERPRISE Pooled Fund Study (TPF-5(231)), ENTERPRISE, Lansing, MI.
6. Crowson, G. and Jackels, J. (2013). System Requirements for Intersection Conflict Warning Systems (ICWS), ENTERPRISE Pooled Fund Study (TPF-5(231)), ENTERPRISE, Lansing MI.
7. Simpson, C.L. and Troy, S.A. (2013). “Safety Effectiveness of ‘Vehicle Entering When Flashing’ Signs: Evaluation of 74 Stop-Controlled Intersections in North Carolina,” Transportation Research Record: Journal of the Transportation Research Board 2384, Transportation Research Board, Washington, DC, pp 1–9.
8. ENTERPRISE Pooled Fund Study. (2015). FHWA Development of Crash Modification Factors (Dcmf) Safety Evaluation of ICWS. Webinar, April 23, 2015, obtained from: http://enterprise.prog.org/Projects/2013/icws_phase3.html, last accessed August 3, 2016.
9. SignCAD® Systems. (2015), Products, Minnetonka, MN, obtained from: http://www.signcad.com/products.php, last accessed December 10, 2015.
10. Federal Highway Administration. (2004). Standard Highway Signs, Federal Highway Administration, Washington, DC, obtained from: http://mutcd.fhwa.dot.gov/ser-shs_millennium_eng.htm, last accessed July 12, 2011.

HRDS-30/11-16(WEB)E