Interrelations between surface, boundary layer, and ... · Network PolandAOD -NET ( , supplement...
38
1 Interrelations between surface, boundary layer, and columnar aerosol properties over a continental urban site Dongxiang Wang 1 , Dominika Szczepanik 1 , Iwona S. Stachlewska 1 1 University of Warsaw, Faculty of Physics, Institute of Geophysics, Warsaw, 02-093, Poland Correspondence to: Iwona S. Stachlewska ( [email protected]) 5 Abstract. PollyXT Raman Polarization Lidar observations were performed at the Remote Sensing laboratory in Warsaw (52.2109°N, 20.9826°E), Poland, in the framework of the European Aerosol Research Lidar Network (EARLINET) and the Aerosols, Clouds and Trace gases Research Infrastructure (ACTRIS). Data collected in July, August and September of 2013, 2015 and 2016 were analysed using the classical Raman approach. In total 202 sets of profiles of the particle extinction and backscatter coefficient, and linear particle depolarization ratio at 355 nm and 532 nm were derived for statistical 10 investigations (EARLINET/ACTRIS Data Base). The main analysis was focused on intensive optical properties obtained within aerosol boundary layer (ABL). The interrelationships of different optical properties inside ABL are discussed for different periods: entire day, nocturnal time and sunrise/sunset time. In addition, the lidar derived boundary layer optical properties were compared with the columnar daytime aerosol properties derived from radiometer (MFR-7, PolandAOD- NET) and photometer (C318, AERONET). Relationships of these and surface in-situ measurements of particulate matter 15 with an aerodynamic diameter < 10μm (PM 10 ) and < 2.5μm (PM 2.5 ) (WIOŚ Network) are investigated. Within boundary layer, the lidar derived optical properties (entire day, 202 sets) revealed the mean aerosol optical depth (AOD ABL ) of 0.27±0.17 at 355 nm and 0.15±0.10 at 532 nm; the mean Ångström exponent (ÅE ABL ) of 1.65±0.45; the mean lidar ratio (LR ABL ) of 49 ±16 sr at 355 nm and 41±15 sr at 532 nm; the mean linear particle depolarization ratio (PLDR ABL ) of 0.02±0.01 at 355 nm and 0.05±0.02 at 532 nm, the mean water vapour mixing ratio (WVMR ABL ) of 8.16±2.40 g/kg. Aerosol 20 composition within ABL was assessed based on the derived properties interpreted with respect to values reported in literature and backward trajectories; it consisted either of pure urban anthropogenic pollution aerosols (~60%), its mixtures with biomass burning aerosols (< 12%), pollen (< 8%) or marine particles (< 6%). No significant contribution of mineral dust in boundary layer was found. In summer and early-autumn in Warsaw, the lidar derived aerosol boundary layer height (ABLH) and the columnar radiometer/photometer AOD CL show negative correlations (-0.6 to -0.7), attributed to likely 25 influence of smoke, pollution and dust suspended in aerosol layers in the free troposphere, while the ABLH and the lidar derived AOD ABL exhibit positive correlation ( ~ 0.6), attributed in majority cases to local anthropogenic pollution. LR ABL and surface fine to coarse mass ratio (FCMR) presents weak positive-correlation (~ 0.4) at nocturnal time, due to the higher(lower) occurrence of fine(coarse) particles at night. On the contrary, weak negative-correlation ( ~ -0.3) of LR ABL and FCMR are present in sunrise/sunset time, for inverse occurrence of fine and coarse particles. A negative-correlation of 30 Atmos. Chem. Phys. Discuss., https://doi.org/10.5194/acp-2018-1219 Manuscript under review for journal Atmos. Chem. Phys. Discussion started: 30 November 2018 c Author(s) 2018. CC BY 4.0 License.
Transcript of Interrelations between surface, boundary layer, and ... · Network PolandAOD -NET ( , supplement...

1
Interrelations between surface, boundary layer, and columnar
aerosol properties over a continental urban site
Dongxiang Wang1, Dominika Szczepanik
1, Iwona S. Stachlewska
1
1University of Warsaw, Faculty of Physics, Institute of Geophysics, Warsaw, 02-093, Poland
Correspondence to: Iwona S. Stachlewska ( [email protected]) 5
Abstract. PollyXT Raman Polarization Lidar observations were performed at the Remote Sensing laboratory in Warsaw
(52.2109°N, 20.9826°E), Poland, in the framework of the European Aerosol Research Lidar Network (EARLINET) and the
Aerosols, Clouds and Trace gases Research Infrastructure (ACTRIS). Data collected in July, August and September of 2013,
2015 and 2016 were analysed using the classical Raman approach. In total 202 sets of profiles of the particle extinction and
backscatter coefficient, and linear particle depolarization ratio at 355 nm and 532 nm were derived for statistical 10
investigations (EARLINET/ACTRIS Data Base). The main analysis was focused on intensive optical properties obtained
within aerosol boundary layer (ABL). The interrelationships of different optical properties inside ABL are discussed for
different periods: entire day, nocturnal time and sunrise/sunset time. In addition, the lidar derived boundary layer optical
properties were compared with the columnar daytime aerosol properties derived from radiometer (MFR-7, PolandAOD-
NET) and photometer (C318, AERONET). Relationships of these and surface in-situ measurements of particulate matter 15
with an aerodynamic diameter < 10μm (PM10) and < 2.5μm (PM2.5) (WIOŚ Network) are investigated. Within boundary
layer, the lidar derived optical properties (entire day, 202 sets) revealed the mean aerosol optical depth (AODABL) of
0.27±0.17 at 355 nm and 0.15±0.10 at 532 nm; the mean Ångström exponent (ÅEABL) of 1.65±0.45; the mean lidar ratio
(LRABL) of 49 ±16 sr at 355 nm and 41±15 sr at 532 nm; the mean linear particle depolarization ratio (PLDRABL) of
0.02±0.01 at 355 nm and 0.05±0.02 at 532 nm, the mean water vapour mixing ratio (WVMRABL) of 8.16±2.40 g/kg. Aerosol 20
composition within ABL was assessed based on the derived properties interpreted with respect to values reported in
literature and backward trajectories; it consisted either of pure urban anthropogenic pollution aerosols (~60%), its mixtures
with biomass burning aerosols (< 12%), pollen (< 8%) or marine particles (< 6%). No significant contribution of mineral
dust in boundary layer was found. In summer and early-autumn in Warsaw, the lidar derived aerosol boundary layer height
(ABLH) and the columnar radiometer/photometer AODCL show negative correlations (-0.6 to -0.7), attributed to likely 25
influence of smoke, pollution and dust suspended in aerosol layers in the free troposphere, while the ABLH and the lidar
derived AODABL exhibit positive correlation ( ~ 0.6), attributed in majority cases to local anthropogenic pollution. LRABL and
surface fine to coarse mass ratio (FCMR) presents weak positive-correlation (~ 0.4) at nocturnal time, due to the
higher(lower) occurrence of fine(coarse) particles at night. On the contrary, weak negative-correlation ( ~ -0.3) of LRABL and
FCMR are present in sunrise/sunset time, for inverse occurrence of fine and coarse particles. A negative-correlation of 30
Atmos. Chem. Phys. Discuss., https://doi.org/10.5194/acp-2018-1219Manuscript under review for journal Atmos. Chem. Phys.Discussion started: 30 November 2018c© Author(s) 2018. CC BY 4.0 License.

2
PLDRABL and FCMR (~ -0.4 at 355nm, -0.6 to -0.7 at 532nm) for all time period and no relation between PLDRABL and
ÅEABL (~0.05) was found. Relation of AODABL and PM10 reveals positive correlation (0.4 355; 0.5 532) for sunrise/sunset
time, but no significant correlations found for AODABL and PM2.5 (0.26 at 355; 0.16 at 532 nm). In general, a positive
correlation of AODABL and LRABL (stronger pronounced at 355nm) and a negative correlation ÅEABL and LRABL (stronger
pronounced at 532nm) is observed. The ÅECL values stay roughly between 1.0 and 2.0, while the ÅEABL values range from 5
0.1 to 2.5, indicating a variety of particle sizes occurring inside ABL during summer and early-autumn period in Warsaw.
Keywords: lidar; aerosol boundary layer; aerosol optical properties; particulate matter
1 Introduction
Atmospheric aerosols play a significant role in local and global climate and weather change. Aerosols affect the earth
radiative budget, as they interact with the incoming solar short-wave radiation and the outgoing terrestrial long-wave 10
radiation. Depending on the aerosol type, they can scatter or absorb the radiation, thus causing warming or cooling the
atmosphere locally, at the surface and at the top of atmosphere (Kaufman et al. 2002). The variety of aerosol sources, those
of natural and anthropogenic origin, as well as the influence of diverse meteorological conditions on their characteristics and
transport, lead to aerosol contents strongly variable in the troposphere. Accordingly to the Inter-governmental Panel on
Climate Change (Stocker et al. 2013), the sparse and/or poorly-known information on aerosol temporal and spatial variability 15
causes high uncertainty in the assessment of their influence on the global radiation budget. To improve forecasts of global
climate change, it is essential to reduce these uncertainties. Aerosol properties are one of the important parameters in aerosol
studies, being useful for radiative transfer, environment and health studies. Aerosol optical properties, size and composition
are also important for aerosol-cloud-radiation interaction studies.
Air pollution is one of the major environmental issues in metropolitan areas due to its adverse effects on human health (Chen 20
et al. 2008, Lelieveld et al. 2015). Strong emissions, e.g., from traffic, industry or heating, can drastically decrease air
quality, particularly when the emitted pollutants are captured below an inversion and when meteorological conditions
prevent an exchange of polluted and clean air, as reported by Juda-Rezler et al. 2006. In Europe, surface particulate matter
with an aerodynamic diameter below 10μm (PM10) is one of the most serious air quality problems (De Leeuw et al. 2001).
As atmospheric aerosols also affect air quality, health and environment, joint studies of aerosol optical properties in 25
combination with PM can improve our knowledge on atmospheric environment.
The knowledge on boundary layer characteristics and its dynamics, both related to ambient meteorological conditions, is
helpful to model and predict mechanisms that matter in weather forecasting, air pollution and climate change studies
(Barlage et al. 2016). Therefore, it is meaningful to acquire the knowledge of the ABL top height distribution along with the
aerosol optical properties within the ABL. 30
Lidar techniques seem to be an optimal tool to provide height-resolved aerosol data products. Several lidar techniques are
suitable for aerosol studies and in the last ten years rapid progress in laser technology, measurement techniques, and data
Atmos. Chem. Phys. Discuss., https://doi.org/10.5194/acp-2018-1219Manuscript under review for journal Atmos. Chem. Phys.Discussion started: 30 November 2018c© Author(s) 2018. CC BY 4.0 License.

3
acquisition systems has contributed to a much wider use of these techniques also for aerosol monitoring, ranging from the
simple elastic backscatter lidar / ceilometer networks (Flentje et al. 2010) to the most advanced multi-wavelength Raman
lidar system networks (Baars et al. 2016). The European Aerosol Research Lidar Network (EARLINET;
https://www.earlinet.org) conducts lidar observations and provides relevant sets of lidar data products stored in a
comprehensive, quantitative, and statistically significant database for the aerosol distribution over Europe (Pappalardo et al. 5
2018). Quality assurance program (Freudenthaler et al. 2018) and lidar data evaluation algorithms (Böckmann et al 2004)
have been developed and assessed at each lidar station, as well as during the lidar intercomparison campaigns (e.g.
Wandinger et al. 2016) to meet accuracy standards desired in aerosol radiative forcing need. The unique data set of lidar
observations conducted over Europe allows for classification of the aerosol type (e.g. Papagiannopoulos et al. 2018) The
EARLINET network is an integral part of the Aerosols, Clouds and Trace gases Research Infrastructure (ACTRIS; 10
https://www.actris.eu) - a pan-European initiative consolidating actions amongst European partners producing high-quality
observations of aerosols, clouds and trace gases. As different atmospheric processes are increasingly in the focus of many
societal and environmental challenges, such as air quality, health, sustainability and climate change, ACTRIS initiatives aim
to contribute in the resolving of challenges by providing a platform for researchers to combine their efforts more effectively,
and by providing observational data of aerosols, clouds and trace gases openly to other external users. 15
The aerosol optical properties derived for boundary layer from lidar have been studied in a statistical approach at several
EARLINET sites in Europe (e.g. Mattis et al. 2004, Amiridis et al. 2005, Matthias et al. 2004, Sicard et al. 2011, Siomos et
al. 2018). However, studies regarding extensive Raman-lidar derived sets of optical properties, such as wavelength
dependent aerosol lidar ratios, optical depths, depolarization ratios, completed with Ångstrom exponent and water vapour
content, as compared and interpreted against surface particulate matter and columnar optical properties of are still rare and 20
based on a case study approach (Stachlewska et al. 2017b, 2018) .
In the framework of the EARLINET, extensive observations at a continental, urban site in Warsaw at the Remote Sensing
Laboratory (RS-Lab) of the Institute of Geophysics at Faculty of Physics at University of Warsaw have been performed
since July 2013. Within this paper the data products of this site published in the EARLINET/ACTRIS Data Base will be
utilized (Earlinet Publishing Group, 2018). 25
The paper deals with the aerosol optical properties derived within boundary layer from the complex Raman-polarization
lidar, obtained in atmospheric column by radiometer and sunphotometer, and with the particulate matter measurements at the
surface. Study is designed to investigate relationships between boundary layer, columnar aerosol optical properties, water
vapour and surface PMs, along with ABL height characteristics. In section 2, the instrumentation and datasets are described.
Section 3 presents methodology of boundary layer height derivation and the aerosol optical properties retrieval approaches. 30
Section 4 focuses on comparisons of different types of mean optical properties as derived within boundary layer and in the
atmospheric column, PMs and ABLHs. Conclusions are given in section 5.
Atmos. Chem. Phys. Discuss., https://doi.org/10.5194/acp-2018-1219Manuscript under review for journal Atmos. Chem. Phys.Discussion started: 30 November 2018c© Author(s) 2018. CC BY 4.0 License.

4
2 Instrumentation and data set
The PollyXT Raman polarization and water-vapor lidar (52.2109°N, 20.9826°E, 112 m a.s.l.) is located at the Remote
Sensing Laboratory (RS-Lab, https://www.igf.fuw.edu.pl/en/instruments) of the Institute of Geophysics at the Faculty of
Physics of the University of Warsaw, Poland. The RS-Lab conducts observations as a part of the European Aerosol Research
Lidar Network (EARLINET, www.earlinet.org , Pappalardo et al. 2014), it provides regular measurements within the 5
worldwide Polly.NET lidar network (www.polly.tropos.de , Baars et al. 2016) and within the National Aerosol Research
Network PolandAOD-NET (www.polandaod.pl , supplement material in Markowicz et al. 2016).
Since July 2013, Polly XT lidar performs quasi-continuous 24/7 observations. Powerful laser pulses (180, 110 and 60 mJ) at
1064, 532 and 355 nm are emitted co-axially and vertically, with a 20 Hz repetition frequency, into the atmosphere.
Detection is performed with a Newtonian telescope at 8-channels (so-called 2α + 3β + 2δ + WV), which enables 10
determination of the particle extinction coefficient profiles (α) at 532 nm and 355 nm, the particle backscatter coefficient
profiles (β) at 1064 nm, 532 nm and 355 nm, the particle linear depolarization ratio profiles (δ) at 532 and 355 nm, and water
vapour mixing ratio (WV). The signals at all channels are recorded up to 48 km with standard 7.5 m vertical resolution in
temporal steps of 30 s. Measured signals are affected by an incomplete geometrical overlap between the emitted laser beam
and the full field of view of the lidar telescope, and therefore the signals in the range below 400m altitude are rejected from 15
further evaluation. The incomplete overlap-range issue posed a first constrain on the selected dataset, i.e. constraining
analyses to summer and early-autumn data. The lidar is described in a great detail in Engelmann et al 2016.
Quality checked profiles of optical properties are stored in the EARLINET/ACTRIS Data Base (www.earlinet.org). The
statistical analysis covers profiles derived for EARLINET regular measurements (Mondays and Thursdays with ± 2 hours
from zenith and sunset) and for dedicated measurements (e.g. diurnal cycles, special alert events). From Warsaw site, only 20
cloud-screened profiles evaluated using the classical Raman-approach are feed into the Data Base. The profiles obtained for
lidar observations in July, August and September in the year of 2013, 2015 and 2016 were analysed (2014 was excluded
from analyses due to too sparse data availability). In total, 202 lidar profiles were collected for this study (denoted as
contributing to entire time), whereby 79 profiles were obtained for nocturnal time (23:00-03:00 UTC) and 74 profiles were
derived from dusk till sunrise (05:00-07:00 UTC) and sunset till down (18:00-20:00 UTC), here defined as the sunrise/sunset 25
or transition time. The precise sunrise and sunset times are available via www.timeanddate.com/sun/poland/warsaw. Note,
that only 49 profiles were available at daytime conditions (07:00-18:00 UTC), which was considered as too low number to
consider separately category of day time, i.e. these profiles join category entire time. However, comparisons of the optical
properties from lidar and photometer were done for a subset of the daytime profiles.
Multi-Filter Rotating Shadowband Radiometer (MFR-7; Yankee Environmental Systems) was used for continuous passive 30
measurements at the RS-Lab in the frame of the PolandAOD-NET network activities. The instrument operates at six narrow-
band channels (415, 500, 610, 675, 870 and 940 nm) and one broadband channel. It measures direct, diffuse and total solar
radiation from which the spectrally resolved aerosol optical depth is obtained. In-situ calibration using the classic Langley
Atmos. Chem. Phys. Discuss., https://doi.org/10.5194/acp-2018-1219Manuscript under review for journal Atmos. Chem. Phys.Discussion started: 30 November 2018c© Author(s) 2018. CC BY 4.0 License.

5
approach is applied on regular basis. Details on the instrument design and uncertainty analyses are reported in Harrison et al.
1994. Cloud-screened products used in this study are: AODCL(415) and AODCL(500) with uncertainty at the level of ±0.025.,
and ÅECL(415/500) with uncertainty at the level of ±0.04. There is a threshold on the values of AODCL <0.03, being excluded
from analyses.
Sunphotometer (CE318; CIMEL Electronique) was deployed for continuous observations at Polish Academy of Science 5
Observatory in Belsk, located 25 km south-west of the RS-Lab in Warsaw. Passive measurements of direct and diffuse solar
irradiance and sky radiance at the Earth’s surface at nine wavelengths in a spectral range from 340 nm to 1640 nm are used
for retrieval of AOD and ÅE. The data are calibrated once a year at PHOTONS/AERONET-EUROPE calibration centre
(http://loaphotons.univ-lille1.fr) and processed by the Aerosol Robotic Network (AERONET, http://aeronet.gsfc.nasa.gov,
Holben et al. 1998). Products used in this study: AERONET Level 2.0 cloud-screened AODCL(380) and AODCL(500) with 10
uncertainty at the level of ±0.01., and ÅECL(380/500) with uncertainty at the level of ±0.03. There is a threshold on the
values of AODCL <0.03, being excluded from analyses.
Particulate matter concentrations for particles with an aerodynamic diameter of less than 2.5µm and 10µm (denoted PM2.5
and PM10, respectively) were measured at the air-quality monitoring site of the Warsaw Regional Inspectorate of
Environmental Protection (WIOS) in Warsaw-Ursynow, located 7.5 km from the RS-Lab. The daily and hourly averaged 15
data are visualised via http://sojp.wios.warszawa.pl/raport-dobowy-i-roczny. The data measurements conducted at the
stations of State Environmental Monitoring are gathered in the Air-Quality database JPOAT 2,0 of the National Chief
Inspectorate for Environmental Protection (GIOS). This official, calibrated datasets of PM2.5 & PM10 are accessible via
http://powietrze.gios.gov.pl/pjp/archive.
The measurement uncertainty is below 30% for the hourly concentrations. Products used in this study: surface daily and 20
hourly mean particulate matter concentrations for PM2.5 and PM10, and the fine-to-coarse mass ratio (FCMR), defined as
PM2.5/(PM10-PM2.5) (Zawadzka et al. 2013). FCMR > 1.5 denotes fine particles domination (diameter < 2.5µm); FCMR <
0.5 means coarse particles domination (diameter between 2.5 µm to 10 µm). Values in the range of 0.5 < FCMR< 1.5
indicate that fine and coarse particles are distributed approximately equally.
Note that the radiometer MFR-7 derived AOD, the sunphotometer C813 derived AOD and the in-situ measured PM values 25
are averaged with corresponding time of the lidar-derived optical profiles available for given period for the Warsaw site in
the EARLINET/ACTRIS Data Base.
The temperature, pressure, relative humidity, wind speed and direction at the surface (p0, T0, RH0, V0, Vdir0), were measured
by the weather transmitter WXT510 (Vaisala) mounted on the roof platform of the RS-Lab at 21 m above the ground’s
surface. 30
The atmospheric pressure (p), temperature (T) and relative humidity (RH) profiles are obtained from the radiosonde RS92
(Vaisala) launched at two World Meteorological Organization sites located in Poland: WMO 12374 station in Legionowo
(52.40°N, 20.96°E, 96 m a.s.l., 25 km North of Warsaw) and WMO 12425 station in Wroclaw (51.78°N, 16.88°E, 122 m
a.s.l., 300 km South-West of Warsaw). The noon and midnight radiosounding profiles (launch at 11:15 / 23:15 UTC,
Atmos. Chem. Phys. Discuss., https://doi.org/10.5194/acp-2018-1219Manuscript under review for journal Atmos. Chem. Phys.Discussion started: 30 November 2018c© Author(s) 2018. CC BY 4.0 License.

6
duration of circa 1.5 h) were visualized and downloaded via the University of Wyoming Upper Air Data website
(weather.uwyo.edu/upperair/sounding.html).
3 Methodology of lidar products retrieval
The atmospheric boundary layer is regarded as the lowest layer of the troposphere, being directly influenced by the Earth’s
surface and reacting quickly to the surface forcing. The atmospheric boundary layer under well-mixed conditions in summer 5
and early-autumn can be characterized as a layer efficiently trapping aerosol particles in itself (as in comparison with winter
boundary layer) and therefore, it is expected to be in significant relation with the lidar derived aerosol boundary layer height
(ABLH). The latter is derived from the lidar elastic-scattering aerosol backscatter signal, relying on a higher aerosol load
within the boundary layer than in the free troposphere. Wang et al. 2018 demonstrated that for the PollyXT lidar data in
Warsaw ABLHs derived using the wavelet covariance transform method (WCT) give optimal results. The WCT calculations 10
are applied for ABLH estimations as in Wang et al. 2018, with slight modification of the methodology: i) the dilation of 30
range-bins is applied on signals averaged over 7.5 m and 30 min; and ii) the ABLH is derived at all three elastic wavelengths
(355, 532 and 1064 nm), and then averaged for a final result.
Lidar signals stored in the EARLINET/ACTRIS Data Base were evaluated using the classical Raman retrieval approach as
in Baars et al. 2016 and the ±45 calibration method as in Engelmann et al. 2016. The water vapour was obtained as in 15
Stachlewska et al. 2017a. For all analysed data products, low- and mid-altitude clouds are screened prior to the retrieval. The
profiles of the particle extinction and backscattering coefficients, and particle linear depolarization ratio were averaged over
30-60 min and smoothed with running mean over 49 range-bins (length of single range-bin is 7.5m). The profiles of the
water vapour mixing ratio were averaged over 30-60 min and 60 m with no smoothing applied. In lidar retrieval, the
atmospheric profiles of p, T, RH obtained by RS92 at Legionowo or Waroclaw (depending on the approaching direction of 20
the air-mass transport) were used.
After having determined ABLH, the mean values of different optical properties within the boundary layer are derived.
However, for the incomplete overlap region, special care of the data in lowermost altitude range have to be applied. The
lowest value of available particle extinction coefficient was assumed as representative down to the ground surface; this being
commonly accepted approach in lidar studies, e.g. Matthias et al. 2004. Therefore, the mean extinction coefficient of the 25
entire ABL is obtained by extrapolating the extinction profile with this value down to the ground. Similarly, the mean
backscattering coefficient and the particle depolarization ratio of ABL. The PLDR profiles can be derived almost to the
ground, however for the EARLINET/ACTRIS Data Base profiles are stored down to 400 m, so that extrapolation also here is
required. The water vapour mixing ratio profiles were also extrapolated from 100m down to the ground.
Additionally, within ABL, the vertical distribution of the lidar ratio (LRABL) was derived as a ratio of the aerosol extinction 30
to backscatter coefficient profiles at 355 and 532 nm, and then the mean LRABL are calculated. The vertical distribution of the
Ångström exponent ÅEABL(355/532) was computed by the means of using the profiles of aerosol extinction coefficient (not
Atmos. Chem. Phys. Discuss., https://doi.org/10.5194/acp-2018-1219Manuscript under review for journal Atmos. Chem. Phys.Discussion started: 30 November 2018c© Author(s) 2018. CC BY 4.0 License.
7
AOD!) at 355 and 532 nm, then mean ÅEABL is calculated. The aerosol optical depth (AODABL) has been calculated by
integrating the extrapolated aerosol extinction profile derived with the lidar at 355 and 532 nm. There is a threshold on the
values of AODABL(355) < 0.05 and AODABL(532) < 0.03, being excluded from analyses. Stachlewska et al. 2018 reported the
uncertainty of AODABL at 355 and 532 nm derived from the Raman extinction coefficient profiles < 20%, the uncertainty of
LRABL derived by extinction-to-backscattering coefficient ratios at 355 and 532 nm < 35%, and the uncertainty of PLDRABL 5
at 355 and 532 nm < 20% of derived value. The uncertainty of extinction-derived ÅEABL(355/532) is < 30% The uncertainty
of the ABLH retrieval from PollyXT lidar are of ±40 m (Wang et al. 2018).
Lidar ratio is used for aerosol type determination; roughly speaking, LR > 75sr indicate existence of particles related to
biomass burning, 40-50 sr mineral dust, 50-60 sr anthropogenic pollution, and 20-30 sr marine particles.
Particle linear depolarization ratio (PLDR) is used as an indicator of atmospheric anisotropy and tracer of non-spherical 10
particles; roughly speaking, low values of PLDR < 0.01 are regarded as due to spherical particles in the atmosphere (e.g.
pollution) and values of PLDR in the range of 0.2-0.35 are characteristic for pure dust. Polluted dust values are lower, down
to even 0.1. Values in range of 4-8 are regarded as for biomass burning aerosol), then for pollen ~0.1, and for pollution <0.2.
The Ångstrom exponent (ÅE) was used as an indicator of the size of atmospheric aerosols. Values of ÅE ≤ 1 indicate
particle size distributions dominated by the coarse-mode aerosols (radii ≥ 0.5 µm, here called large particles) that are 15
typically associated with dust and sea salt particles (Perrone et al. 2014). Values of ÅE ≥ 1.5 indicate size distributions
dominated by the fine-mode aerosols (radii < 0.5 µm, here called small particles) that are associated with urban pollution
(Perrone et al. 2014). Values within the range of 1< ÅE < 1.5 belong to accumulation-mode (here called medium-size
particles) and are associated with biomass burning aerosol Janicka et al. 2017. Use of the ÅE nomenclature of small,
medium, and large size particle is for clarity, as not to confuse them with the fine-to-coarse mass ratio (FCMR). 20
4 Results and discussion
Table 1 shows the mean extinction coefficient (α), backscatter coefficient (β), aerosol optical depth (AOD), lidar ratio (LR),
particle linear depolarization ratio (PLDR) and Ångström exponent (ÅE) derived at 355 and 532 nm channels within the
aerosol boundary layer (ABL) for the entire (ET), nocturnal (NT) and sunrise/sunset (TT) time during the selected
measurement period (July-September, 2013, 2015, and 2016). Different mechanisms govern the sunset and sunrise 25
conditions; the first driving development of convective boundary layer and the latter lessens convection and prone
stratification with residual layer. As the developed ABLH algorithm determines the aerosol boundary layer top as a well-
mixed layer, a nocturnal layer and/or a residual layer, for the sunrise/sunset time it is used for data interpretation. The mean
ABLH was of 1.65±0.43 km for this period. For comparison, Wang et al. 2018 demonstrated, based on the 10-years data set,
that the decadal mean ABLH in Warsaw exhibits a clearly higher value in summer than in other seasons, whereby the mean 30
summer ABLH was of 1.24±0.64 km in 2013, 1.80±0.60 km in 2015 and 1.57±0.67 km in 2016.
Atmos. Chem. Phys. Discuss., https://doi.org/10.5194/acp-2018-1219Manuscript under review for journal Atmos. Chem. Phys.Discussion started: 30 November 2018c© Author(s) 2018. CC BY 4.0 License.
8
The mean values of αABL, AODABL and LRABL calculated at the two wavelengths are similar in entire and nocturnal time,
while corresponding values in sunrise/sunset time are relatively higher than for the two other periods. This indicates that the
convective mixing and the change of atmospheric conditions impact light extinction on aerosol particles within the ABL. In
general, the mean ÅEABL was high, indicating small-size particles. In nocturnal period, ÅEABL values are higher than for the
other periods, indicating that even smaller particles occur at the nighttime during summer and early-autumn in Warsaw, 5
however this does not necessarily mean that pollution is intensifying at night, as it may be related to less intense traffic, lack
of photo-smog, and cooling at the ground surface at night.
The frequency distribution plots for the AODABL, LRABL, ÅEABL derived at 355 and 532 nm and the FCMR derived for PM2.5
and PM10 for the entire, nocturnal and sunrise/sunset times are shown in Figure 1. The mean AODABL mainly ranges from
0.1-0.3 at both wavelengths during three periods. Above 80% of occurrence is attributed to AODABL(355) in the range of 0.1-10
0.5 and AODABL(532) of below 0.3. The values of mean LRABL(355) and LRABL(532) mainly distribute from 30 to 70 sr,
which accounts for more than 75% of total data, whereby frequency distributions of both are very similar for the nocturnal
time. The majority of the ÅEABL(355/532) values are larger than 1.0 (more than 90% of total data), which indicates mid- and
small-size particles (≤ 500nm) within boundary layer. On the other hand, the FCMR values between 0.5 and 1.5 constitute
around 70% of total data, indicating a more-less equal distribution fine and coarse particles of a size between 2.5 and 10 µm 15
at the surface.
Amiridis et al. 2005, reported the 4-years mean AODABL of 0.44±0.16 at 355 nm, and the mean LRABL of 49±25 at 355 nm in
summer at Thessaloniki, Greece. According to Papayannis et al. 2008, this much higher value of AODABL(355) can be
attributed to a significantly stronger impact of the summertime Saharan dust events on Thessaloniki than on Warsaw. Sicard
et al. 2011, reported low AODABL of 0.07±0.02 at 532 nm in Northeastern Spain, and explained it by the influence of sea-20
breeze on Barcelona area. Mattis et al. 2004. reported for Leipzig the 3-years mean AODABL(355) of 0.38 and AODABL(532)
of 0.18, with the mean LRABL(355) of 58 sr and LRABL(532) of 53 sr, and the mean ÅEABL(355/532) of 1.4. However, the
ÅEABL was of 1.8-2.2 in the upper boundary layer during summer in Leipzig (Matthis et al. 2004), which is higher than
values derived in Warsaw, i.e. during summer slightly larger particles are observed in ABL in Warsaw as compared to
Leipzig. Matthias et al. 2004, derived for Raman lidar observations at 10 EARLINET stations: the lowest AODABL values in 25
the northwestern (Aberystwyth) and the highest values in the southeastern Europe (Athens), which was again attributed to
the impact of Saharan dust events on the aerosol distribution in Southern Europe.
Lidar ratio can be used for the aerosol type characterization. Alados-Arboledas et al. 2011, reported lidar ratios of fresh
biomass‐burning pollution plume were of 60–65sr at 355 nm and 532 nm at Granada. Müller et al. 2007, reported the lidar
ratios of 45-60 sr with a mean value of 53 sr at 532 nm, and the particle depolarization ratio <0.05 for Leipzig under local 30
and regional urban and anthropogenic haze conditions. Amiridis et al. 2005 reported for Tessaloniki, the continental aerosol
for 4-year mean lidar ratio of 40-47 sr at 355 nm and Giannakaki et al. 2010, the biomass burning aerosols for 7-year mean
lidar ratio of 70 sr at 355 nm. Optical properties of eight aerosol types were derived by Burton et al. 2012 , derived over
North America for the urban aerosol (lidar ratio at 532 nm of 53-70 sr with particle depolarization ratio of 0.03-0.07), and for
Atmos. Chem. Phys. Discuss., https://doi.org/10.5194/acp-2018-1219Manuscript under review for journal Atmos. Chem. Phys.Discussion started: 30 November 2018c© Author(s) 2018. CC BY 4.0 License.
9
the smoke particles (lidar ratio of 33-46 sr with particle depolarization ratio of 0.04-0.09). The LR of marine particles with
value of 20-26 sr at 532 nm was found in North Atlantic and Tropical Indian Ocean by Müller et al. 2007, and 25±4 sr at 532
nm in Hawaii by Masonis et al.2003. Dawson et al. 2015 presented the global mean lidar ratio for marine aerosols to be 26
sr, with a range from 22±7 to 32±17 sr, depending on variation of mean ocean surface wind speed. Haarig et al. 2017
reported for the marine particles the lidar ratios varying from 19-27 at 355 nm and 23-25 at 532 nm, and particle 5
depolarization ratio of 0.05-0.12 at 355 and 0.07-0.15 at 532 nm. In current study, for several cases LRABL in the range of 25-
30 sr at both wavelengths were obtained (Fig.1), which indicates possible mixing of marine particles into the ABL in
Warsaw during the analysed period.
Linear particle depolarization ratio is an indicator of non-spherical particles (Ansmann et al 2009, Sakai et al. 2010,
Gasteiger & Freudenthaler. 2014). Generally, the total depolarization ratio in dust episodes are reported above 0.2, while 10
anthropogenic pollution aerosols have a total depolarization ratio below 0.1 (Xie et al 2008, Nemuc et al. 2013). Heese et al.
2008 reported particle depolarization ratio for dust (~ 0.25) and biomass burning aerosol (< 0.1) over Sahel (West Africa).
The particle depolarization ratios of dust particles in the range of 0.1-0.25 were reported in Leipzig (Matthis et al. 2004) and
0.3-0.35 at Ouarzazate, Morocco (Freudenthaler et al. 2009). The particle depolarization ratios of urban haze and fire smoke
are reported of less than 0.05 at different sites (Müller et al. 2007). The particle linear depolarization ratio for marine aerosol 15
in the range from 0.01 to 0.03 was reported by Groβ et al. 2011. In the current study, the results of the obtained PLDRABL
(shown in Fig.1) are within the range of the listed above values characterizing different aerosol types. As PLDR is sensitive
to the size of the sensed non-spherical particles, in particular small-size particles (< 300 nm) sensed with twice larger
wavelength can be under detection limit, as seen in Fig.1. Although, the dust cases were detected in the free troposphere
during the given measurement period in Warsaw (e.g. Janicka et al. 2017), yet the derived PLDR values of entire observation 20
time are less than 0.1, which means that no cases of pure dust particles deposited nor advected into the ABL, however
polluted dust existence cannot be entirely excluded.
Overall, during period of July to September of 2013, 2015 and 2016 in Warsaw, the aerosol composition within the ABL
consisted mainly of urban and anthropogenic aerosols. It was assessed based on derived properties (ÅEABL, WVMRABL and
wavelength dependent LRABL and PLDRABL), as interpreted with respect to values reported in literature and with the 25
backward trajectories calculations (plots available via PolandAOD-NET website: www.polandaod.pl). Aerosol composition
consisted either of i) pure urban anthropogenic pollution of local origin or transported from Czech Rep. via Silesia or and
Germany (~60%), and with its mixtures with ii) grass and peatland biomass burning aerosols transported from Russia over
Ukraine and Belarus (< 12%), iii) pollen emissions of strictly local origin form the many semi-natural Warsaw’s parks (<
8%), iv) marine particles transport mainly from Arctic over Baltic Sea (< 6%). For remaining cases identification of aerosol 30
composition was regarded as due to a mixture of more that tow sub-component. No significant contribution of mineral dust
in boundary layer was found, although transport pathways from Sahara over Iberian Peninsula or via Italy were identified.
Figure 2 shows the daytime mean 30-60min average of the aerosol optical depth within aerosol boundary layer AODABL at
355 and 532 nm, calculated from the mean extinction coefficient profiles of EARLINET PollyXT lidar in Warsaw. For
Atmos. Chem. Phys. Discuss., https://doi.org/10.5194/acp-2018-1219Manuscript under review for journal Atmos. Chem. Phys.Discussion started: 30 November 2018c© Author(s) 2018. CC BY 4.0 License.

10
comparison, the columnar daytime mean 1h average (with threshold of at least 5 data points) of the AODCL at 380 and 500
nm determined from the AERONET C318 sun photometer observations in Belsk, as well as with the AODCL at 415 and 500
nm derived from the PolandAOD-NET MFR-7 radiometer measurements in Warsaw are plotted. Along with these three,
Figure 2 depicts also the ÅECL(380/500) computed from the AODCL of CIMEL, the ÅECL(415/500) obtained from the
AODCL of MFR-7, and extinction-derived ÅEABL(355/532) of PollyXT. All products presented in Figure 2 were derived for 5
period of July to September of 2013, 2015 and 2016, for these cases when all three instruments were conducting
observations at the same time (i.e. 33 cases).
In Table 2, the C318 derived mean AOD is of 0.44±0.18 at 380 nm and 0.30±0.13 at 500 nm, the MFR-7 derived mean AOD
is of 0.43±0.19 at 415 and 0.33±0.16 at 500 nm, and the PollyXT derived mean AODABL is of 0.16±0.09 at 355 and
0.09±0.06 at 532 nm, for the 33 comparison points, respectively (Table 2). The columnar AODCL values of the two 10
instruments are the same in the given uncertainty range, despite of the 25 km between the two sites! In general, it is expected
that always AODABL < AODCL (e.g. Sicard et al. 2011). For a rural site roughly 80% of AODCL can be assumed as a proxy
representative for AODABL, e.g. Szczepanik & Markowicz 2018, which is however, not necessarily a valid assumption for
the urban sites, e.g. Stachlewska et al. 2017, especially for conditions with high aerosol load in free troposphere, e.g. Janicka
et al. 2017. The obtained results of the mean values of the AODABL being 3-4 times lower than the mean values of AODCL, 15
indicate that the aerosol layers in the free troposphere in summer and early-autumn over Warsaw, are likely occurring
frequently and they significantly contribute to the sensed AODCL, which is very much in agreement with e.g. Markowicz et
al. 2016. This is why, for comparisons in Table.2 in brackets, also the mean values derived for cases of no long-range
transport in the free-troposphere, as given in EARLINET/ACTRIS Data Base (i.e. allocation to forest-fire, dust, etc.). Note
that for the lack of free troposphere aerosol transport the obtained 3 year mean values of summer/early-autumn AODABL of 20
0.2 at 355 nm and 0.1 at 532 nm are actually rather high values! For conditions with no aerosol layers in the free-troposphere
about the site, Szczepanik & Markowicz, 2018 proposed an approximation of boundary layer aerosol load for rural
mountainous site (Strzyzow, Poland) as being of AODABL (Strzyzow) ≈ 80%AODCL. Clearly this approximation for Warsaw
urban continental site would be rather of AODABL (Warsaw) ≈ 67% AODCL.
In a closer look in Figure 2, the lidar derived AODABL are of less than 0.05 on a few days, e.g. day 191, 9 July 2013), 25
although both corresponding values of passive derived AODCL are more than 0.38. This is not a mistake. On 9 July 2013, the
biomass burning aerosol from Canadian wildfires was detected by lidar in Warsaw, with an apparent optically thick aerosol
layer suspended in the lower troposphere just above the boundary layer top height, as reported by Janicka et al. 2017 and
Ortiz-Amezcua et al. 2017. Due to the low ABLH (< 1000 m) on this day, (not unusual under high pressure system over
Poland e.g. Janicka & Stachlewska, Stachlewska et al 2018, the optical depth contribution of aerosol smoke layer in the free 30
troposphere dominated over the optical depth contribution of the aerosol within boundary layer, which explains much higher
columnar than boundary layer AOD. Markowicz et al. 2016, reported existence of aerosol layers in free troposphere with
significant (up to 55%) contribution to the total optical depth, which is consistent with results obtained in the current paper.
Atmos. Chem. Phys. Discuss., https://doi.org/10.5194/acp-2018-1219Manuscript under review for journal Atmos. Chem. Phys.Discussion started: 30 November 2018c© Author(s) 2018. CC BY 4.0 License.

11
In general, the results in Fig.2 obtained for the ÅE being related to particle size, show that retrievals by all three instruments
have similar trend of variation with time. The ÅECL values stay roughly between 1.0 and 2.0, while the ÅEABL values range
from 0.1 to 2.5, indicating a variety of particle sizes occurring inside ABL during summer and early-autumn period in
Warsaw. In general, ÅEABL and ÅECL seem to be anti-correlated! The mean ÅECL values given in Table 2, are the same, in
the given variability range for all 33 cases, the differences being attributed also to different calculation wavelengths. The 5
values in brackets (no long-range transport of aerosols in free-troposphere, show even higher ÅEABL and ÅECL mean values –
indication for pollution constrained in boundary layer.
4.1 Relation of ABLH with optical properties and surface PM
The scatter plots of the mean AODCL and AODABL against ABLH for the 33 comparison cases of collocated in time
measurements conducted with the three instruments: C318, MFR-7 and PollyXT, are depicted in Figure 3. The AODCL and 10
ABLH shows negative correlation, while the AODABL and ABLH exhibits positive correlation; the latter, which is being in
accordance with correlation coefficient of 0.55 between AODABL and ABLH reported for Leipzig by Mattis et al. 2004 and
for Warsaw by Stachlewska et al. 2017. On the other hand, during stationary high pressure system conditions over Poland,
when there was no aerosol in free troposphere above Warsaw but it is injected into boundary layer, both AODCL and
AODABL can increase with increasing boundary layer height as e.g. on 24-29 August 2016 (Stachlewska et al. 2017b), even 15
more clearly observed during 10-16 September 2016 (Stachlewska et al. 2018).
The opposite trend in AODCL – ABLH and AODABL – ABLH, is expected to attribute to different type of aerosol load in
free-troposphere and/or boundary layer. When aerosol layer containing particles of dust, smoke, pollution or their mixtures is
suspended in the free troposphere, an increase of columnar AODCL values can be observed. Marinou et al. 2017 reported that
dust particles can be transported far away from their source of origin and are frequently observed over central and northern 20
Europe, with higher occurrences during summer. High occurrence of the dust particles over Warsaw in spring and summer
was also reported by Chilinski et al. 2016 and Janicka et al. 2017. Biomass burning particles and smoke layers were detected
over central Europe in summer of 2013 (Janicka et al. 2017, Ortiz-Amezcua et al. 2017, Trickl et al. 2015), of 2015
(Stachlewska et al. 2017b, Szkop & Pietruczuk 2017), and 2016 (Stachlewska et al 2018). The dust component and biomass
burning were detected and analysed by Siomos et al. 2017, 2018 in south Europe with a long record of 10 years lidar dataset. 25
The Canadian wildfire smoke detected in the troposphere and the stratosphere in summer 2017 over central Europe were
reported by Haaring et al 2018 and Ansmann et al. 2018.
The less sufficient growth of the ABLH, can be explained as partly due to the fact that the aerosol layers suspended free
troposphere will reduce the solar radiation reaching the surface and suppress the thermal turbulence, leading to lower
boundary layer height. Several studies reported decreasing boundary layer height during occurrence of dust episodes Peraz et 30
al. 2004, Alastuey et al. 2008, Pandolfi et al. 2013. Hence, for certain conditions the relationship of AODCL and ABLH can
be expected to exhibit negative correlation.
Atmos. Chem. Phys. Discuss., https://doi.org/10.5194/acp-2018-1219Manuscript under review for journal Atmos. Chem. Phys.Discussion started: 30 November 2018c© Author(s) 2018. CC BY 4.0 License.

12
The AODABL is an integral of the extinction coefficient within ABLH and the ABLH is a variable of AODABL, therefore
ABLH is not expected to be strongly related with the aerosol conditions above in the free troposphere. Aerosol optical depth
is unique parameter to determine the atmospheric aerosol load and the ABLH derived by lidar is relying on a higher aerosol
concentration within the boundary layer than in the free troposphere. Therefore, a positive-correlation of AODABL with
ABLH, just as observed in Figure 3 can be expected. Note, that although an intrusion of biomass burning smoke into the 5
ABL can contribute strongly to suppression of the growth of ABLH, as reported by Stachlewska et al. 2018, it still does not
result in negative correlation.
The relationship of lidar derived AODABL, ÅEABL and ABLH at different time-period of the day are depicted in Figure 4.
Since the AODABL is related to the ABLH, then there is more aerosol load within the ABL, as compared to the free
troposphere, and thus a positive-correlation of AOD and ABLH can be observed for the entire, nocturnal and sunrise/sunset 10
times. For the entire observation period, the correlation coefficient of the ABLH with the AODABL at 355 nm and 532 nm are
of 0.66 and 0.63. A relatively high correlation coefficient (0.73) with standard deviation of only 0.0004 between ABLH and
AODABL at both wavelengths occurred in the sunrise/sunset time, while their correlation coefficients are weaker (at both
wavelengths < 0.50) during the nocturnal time (residual layer effect), when aerosol load within ABL basically remain stable,
due to much weaker vertical mixing at night. 15
The mean ÅEABL is 1.65±0.45, indicating the domination of relatively small particles in the observation period. No obvious
relationship between ÅEABL and ABLH is obtained, however interestingly; a weak positive relation of them is captured in
nocturnal time. This suggests that small particles (ÅEABL > 1.5) dominated within ABL in/for an increasing nocturnal
boundary height. (more pollution emitted or less humidity) This may be partly attributed to higher number of PM2.5 emitted
during the nocturnal time (17.32±7.47 μg/m3), as compared to the other periods (15.45±7.83 μg/m
3 in the entire time and 20
15.07±8.81 μg/m3 in the transition time). Note that given standard deviations indicate high variability of the obtained values.
Figure 5 illustrates the relationship between the ABLH, PM and FCMR. When the ABLH grows, a declining trend of FCMR
can be observed, which is indicating an increase of coarse particles (number or/and size) at the surface with an ascending
ABLH. In cannot be excluded that, adiabatic effects have partly influence on the growth of particle size. Schäfer et al. 2006
found a high negative correlation between PM10 and ABLH in Hanover and Munich in winter. Rost et al. 2009 reported a 25
strong negative relationship between PM10 and ABLH in Stuttgart. Similarly, Du et al. 2013 find that PM2.5 and ABLH
exhibit negative correlation in Delhi and Xi’an. Geiß et al. 2017 reported that the link between the PM and ABLH can be
attributed to several different reasons, such as meteorological conditions, terrain, local particle sources and even to the
method of the ABLH retrieval itself. This was also confirmed for Warsaw by studies of long-range transported aerosol
injections into the boundary layer by Stachlewska et al. 2017b, 2018. However, in general, no pronounced relationship 30
between the PM and ABLH are expected for Warsaw, as in Zawadzka et al. 2013. Also in the current study, no significant
link between particulate matter (PM10 and PM2.5) and ABLH was found for Warsaw during summer and early-autumn
(Figure 5), which at least partly can attributed to relatively low records of PM emissions (hourly values < 40 µg/m3) and
relatively high summer ABLHs (1-2.5 km). Clearly, the ABLH is not the main factor controlling the surface pollution in
Atmos. Chem. Phys. Discuss., https://doi.org/10.5194/acp-2018-1219Manuscript under review for journal Atmos. Chem. Phys.Discussion started: 30 November 2018c© Author(s) 2018. CC BY 4.0 License.

13
summer in Warsaw, which is consistent with the reports by Bonn et al. 2016, Stachlewska et al. 2017b, 2018, and Geiß et al.
2017.
4.2 Interrelations within optical properties and with surface PM
The relationship of air pollution and aerosol optical properties are given in Figures 6 and 7. The separation thresholds are
defined as FCMR > 1.5 (vertical line) means that fine particles (<2.5µm) dominated and FCMR < 0.5 (vertical dashed line) 5
means domination of coarse particles (2.5-10µm). The ÅE roughly indicates dominating particle size distribution mode, with
separation thresholds of for small particles ÅE > 1.5 (horizontal line) and large particles ÅE < 1 (horizontal dashed line).
However, relationship between ÅE and aerosol size distribution is complicated, and so it is for the FCMR.
Figure 6 presents the relationship of ÅEABL, LRABL, PLDRABL and surface FCMR for the entire time, nocturnal time and
sunrise/sunset time during July, August and September in 2013, 2015 and 2016. Aerosol optical depth (AOD) not shown, as 10
there is no clear correlation of AODABL and FCMR (R2<0.18 for all time periods; compare also Figure 7). In general, for all
time periods the values of FCMR between 0.5 and 1.5 constitute the largest proportion in total (least for nocturnal time). In
entire time the surface fine and coarse particles are almost equal but in nocturnal time there is more fine particles and at
transition sunrise/sunset time there is more coarse particles. There is clear separation mark at FCMR of 1.5.
There is no correlation of ÅEABL and FCMR for the entire time, however, a very weak negative correlation is visible for the 15
nocturnal time and a very weak positive correlation for the sunrise/sunset time. For 1 < ÅEABL < 2, this negative relationship
at nocturnal time indicates more PM2.5 and positive relationship at sunrise/sunset indicates more PM10 at the surface. Because
of a weak vertical air motion (no convective mixing) and lower ABLH during the nighttime, relatively large aerosol particles
are deposited in ABL and most of small aerosol particles stack below the inversion of boundary layer top (or residual layer).
This should lead to an increase of number of small particles accumulated within nocturnal ABL, which manifest as fine 20
particles increase at surface. In general, urban pollution, regarded as road traffic, industrial emission and chemical reaction of
gases (SO2, NO2, NOx), causes increase of both PM10 and PM2.5 (He et al. 2008). The sunrise time (7:00-9:00 local time)
corresponds to urban traffic emission, which can cause lifting of coarse particles from the ground, thus larger amounts of
coarse particles can manifest (Zawadzka et al. 2013). Less traffic emission at nighttime, results in less PM10 and more PM2.5
observed, therefore, an increasing FCMR appears (the mean PM10 data during measurement period was of 31.85±12.27 25
μg/m3 in the nocturnal time, 33.36±12.90 μg/m
3 in the transition time, and 32,23 ±12.21 μg/m
3 in the entire time. PM2.5 was
of 17.32±7.47 μg/m3 at nocturnal time, 15.07±8.81 μg/m
3 in the transition time and 15.45±7.83 μg/m
3 in the entire time. Both
less traffic emission and strong stratification at night are reasons for the observed differences). Note: STD2.5 (~8-9) and
STD10 (~12-13) are similar for all periods, thus values are the same within given uncertainty!
The relationship of LRABL and FCMR in Figure 6, shows no correlations for the entire time. However, there is a weak 30
positive correlation at the nocturnal time, being mainly a result of higher abundance of the fine particles (PM2.5 with higher
Atmos. Chem. Phys. Discuss., https://doi.org/10.5194/acp-2018-1219Manuscript under review for journal Atmos. Chem. Phys.Discussion started: 30 November 2018c© Author(s) 2018. CC BY 4.0 License.
14
LRABL values 35-85sr). On the contrary, when more coarse particles (PM10 with higher LRABL values 40-85sr) occur at
sunrise/sunset time, a weak negative correlation is present.
The relationship of PLDRABL and FCMR in Figure 6, shows relatively high negative correlations (0.4-0.7; stronger at
532nm) for all of the predefined time periods. The higher the abundance of fine particles at the surface, the more spherical
particles is within the ABL and/or the more isotropic the atmosphere. Opposite holds for the increase of coarse particles. 5
Both trends are especially well visible at the nocturnal versus the sunrise/sunset time.
Bennouna et al. 2016, reported that a significant positive correlation of PM10 and AODCL and increasing correlation
coefficient for daily, monthly and yearly averages, relays on the aerosol characteristics of the site. Zawadzka et al. 2013,
reported a negative correlation between PM10 and AODCL for long-term monthly mean values in winter in Belsk and
Warsaw, and a positive relation for unstable (meaning strong turbulent vertical mixing in summer) atmospheric condition in 10
Warsaw. Relationship between optical properties and surface aerosol mass concentration depends on boundary layer
processes, chemical composition, source regions, weather conditions and aerosol type, which is challenging to be
characterized well by columnar AODABL and surface PM10 mass concentrations alone, and thus in Figure 7, a relationship of
AODABL and PM10 and PM2.5 is depicted. No significant differences in the relation of AODABL with PM10 or PM2.5 are
reported in current study (strikingly similar PM10 and PM2.5!). Stachlewska et al. 2018 discussed such daily mean surface 15
PM10 and PM2.5 increase with increase of the AODABL for growing ABLH in August 2016 in Warsaw. Figure 7 exhibits a
very weak correlation of AODABL and PM10 for the entire time (similar reported by Filip & Stefan 2011), no significant
linear correlation for the nocturnal time, while some positive correlation was observed for the sunrise/sunset time (similar
reported by Zawadzka et al. 2013). The ABL in summer is primarily driven by intensive convective mixing; resulting in
significantly higher ABLH than in other seasons (Wang et al. 2018). In summer, the ABL aerosol can be elevated by 20
effective convection to the free troposphere, and thus lead to decrease of aerosol loading within ABL, as reported by e.g. He
et al. 2008, Tian et al. 2017. The emission of PM10 in summer is lower than for the other seasons in Warsaw (Zawadzka et al.
2013). Even less urban emissions at night reduce the mass concentrations of surface PM10, and at the same time the aerosol
properties within ABL are relatively stable due to stable boundary layer in nighttime. Therefore, no apparent relationship can
be observed in nocturnal time. 25
Interrelations of optical properties within ABL are given in Figure 8. A positive correlation of AODABL and LRABL is
observed for entire time (~0.6), whereby it is higher for nocturnal time (0.7-0.8) and lower for sunrise/sunset time (~0.4).
The AODABL and LRABL depend on extinction coefficient derived within the ABL, thus both values will increase when fine
particle contribution increases and/or when there is an increase of the light absorption capability of the particles within the
ABL, and vice versa. This result may be partly due to the presence of biomass burning particles inside the ABL, as e.g. in 30
Stachlewska et al. 2018.
The relationship between ÅEABL and LRABL shows negative correlation during the analysed measurement period (0.2-0.6).
The captured ÅEABL decrease with increasing LRABL can be related with larger size particles being injected into the ABL,
particles growing in the ABL or indicate significant smoke contribution in composition of ABL aerosol. As for the latter, a
Atmos. Chem. Phys. Discuss., https://doi.org/10.5194/acp-2018-1219Manuscript under review for journal Atmos. Chem. Phys.Discussion started: 30 November 2018c© Author(s) 2018. CC BY 4.0 License.
15
possible explanation could be that the aging smoke was present in the ABL, which would be in agreement with literature,
e.g. correlations of -0.79 and -0.84 between LRABL and ÅEABL found for smoke particles e.g. by Giannakaki et al. 2010 and
Amiridis et al 2009. Also Stachlewska et al 2018 showed negative correlation of ÅEABL and LRABL for smoke particles.
Another explanation could be as due to the condensation of large organic molecules and particle coagulation from upper
atmosphere into the ABL, as reported by e.g. Posfai et al. 2004 and Fiebig et al 2003. 5
Giannakaki et al. 2010 showed no significant correlation of LRABL and ÅEABL for continental and urban aerosols, which are
mainly related with anthropogenic pollution. Also, no relationship between ÅEABL and LRABL was reported by Mattis et al.
2004 when anthropogenic particles dominated in Leipzig. Nevertheless, obtained in current paper results show that for the
mixture of local urban anthropogenic aerosols in ABL and natural long-range transported aerosols into the ABL, the
relationship of ÅEABL and LRABL display an negative correlation during summer and early-autumn in Warsaw. At nighttime, 10
due to weaker air convection, slightly higher correlation coefficient of LRABL and ÅEABL are obtained (Figure 8).
4.3 Relations of optical properties and relative humidity
Relations between the surface relative humidity (RH0) with surface PM10 and PM 2.5 and FCMR for entire, nocturnal and
sunrise/sunset time were investigated. Additionally, nighttime relation between lidar derived water vapour mixing ratios
(WVMRABL) and relative humidity (RHABL) with surface PM10 and PM 2.5 and FCMR as well as with lidar derived aerosol 15
properties (ÅEABL, LRABL and PLDRABL) were searched for.
Generally, a weak positive correlation of RH0 and PM2.5 and a weak negative correlation of RH0 and PM10 was revealed for
each time period (Figure 9), which is in agreement with the results of Sharma et al. 2017. The RH and FCMR exhibit
positive correlation, with significantly higher correlation coefficients of 0.67, 0.58 and 0.72 in the entire, nocturnal and
transition time, respectively. Zhang et al. 2015 reported that high relative humidity led to high PM2.5 in Beijing. Li et al. 20
2017 showed that in summer urban environment, due to the hygroscopic effect on aerosols, an increase of relative humidity
can lead to a growth of the fine particles PM2.5, but not to a growth of PM10, mainly attributed to the effects of wet
scavenging under high summer rainfall. The mean relative humidity obtained in current study was higher in the nocturnal
time (60.44%±10.63), than in the entire (52.45%±13.30) and in the sunset/sunrise time (44.18%±11.94). Gou et al. 2017
reported that high relative humidity favors accumulation of pollutants. Then the small particles have greater possibility to 25
aggregate into relatively large particles at nighttime, and thus lower correlation coefficients for RH and PM2.5 (and FCMR)
are found for the nocturnal time.
Figure 10 presents a weak positive relationship of water vapour mixing ratio within ABL (WVMRABL) and PM2.5, PM10 and
FCMR in nocturnal time during July, August and September in 2013, 2015 and 2016 in Warsaw. The correlation of
WVMRABL and PM2.5 is a little higher than WVMRABL and PM10, indicating that water vapour in ABL affects surface fine 30
particles more than surface coarse particles. Unlike for the relationship of RH0 and PM10 (Figure 9), the WVMR and PM10
exhibit a weak positive correlation. One reason for this may be the presence of anthropogenic particles inside the ABL, as
Atmos. Chem. Phys. Discuss., https://doi.org/10.5194/acp-2018-1219Manuscript under review for journal Atmos. Chem. Phys.Discussion started: 30 November 2018c© Author(s) 2018. CC BY 4.0 License.

16
these hygroscopic particles absorb water vapour and its gradually increase in size. Furthermore, growth of particles resulted
from coagulation of particles within ABL cannot be excluded (Fiebig et al. 2003).
Figure 11, depicts scatter plots of water vapour mixing ratio and aerosol optical properties in nocturnal boundary layer
during July, August and September in 2013, 2015 and 2016. No clear relations found between WVMRABL and AODABL,
AEABL and LRABL for nocturnal time during given measurement period in Warsaw. PLDRABL and WVMRABL show a 5
negative trend (Figure 11) with the correlation coefficient of -0.49 at 355 nm and -0.23 at 532 nm. The hygroscopicity of
particles increases with decreasing particle size Petters et al. 2009, and at the same time, the more fine particles the lower the
PLDR (see Figure 6). Hence, increase of water vapour and presence of hygroscopic particles leads to decrease of
depolarization. For occurrence of long-range transported aerosol of biomass burning, hygroscopic effects can be well
captured with quasi-continuous profiling of water vapour (Stachlewska et al. 2017). 10
As such, the obtained extensive data set have a potential to be used for testing and interpreting results of aerosol typing
algorithms, especially those needing sets of Raman-derived lidar products as they are using artificial neural network
approaches for aerosol categorization (Nicolae et al. 2018).
5 Conclusions
The study of optical properties within ABL calculated at 355 and 532 nm based on EARLINET dataset on July, August and 15
September during 2013, 2015 and 2016 in Warsaw was conducted. Interrelationships of different optical properties within
ABL were discussed. In addition, the relationship of aerosol optical properties within ABL and PM were highlighted. The
comparison of various parameters was analysed in three different periods (entire time, nocturnal time and sunrise/sunset
time).
AODABL and LRABL at both wavelengths at sunrise/sunset are relatively higher than for the other two periods, indicating that 20
convective mixing, and change of atmospheric conditions impact light extinction on aerosol particles in the ABL. In
nocturnal period, ÅEABL values are higher than for the two remaining periods, suggesting smaller particles dominate at
nighttime during summer time in Warsaw. Aerosols composition within ABL of summer and early-autumn in Warsaw,
consists of urban anthropogenic pollution, biomass burning aerosols, marine particles and their mixtures. Comparison of
AODABL with columnar AODCL, found the latter significantly higher (3-4 times) when optically thick aerosol layers due to 25
long-range transport of air-masses were observed above the ABL, and less than 2 times higher for cases with no aerosol
layers in the free troposphere (but with presence of aloft pollution due to convection). The AODCL and ABLH are negatively
correlated (-0.58 to -0.62), which can be attributed to the influence of either dust or smoke layers suspended in free
troposphere. The AODABL and ABLH exhibit positive correlation (~0.60) in observation period. There is no clear
relationship between ÅEABL and ABLH, nor is there clear correlation between ÅEABL and FCMR, although, a very weak 30
negative correlation 0.31 of the latter at nighttime time and a very weak positive correlation 0.27 of them at sunrise/sunset is
discerned. Due to more fine particles in nighttime boundary layer, LRABL and FCMR reveals positive correlation, and on the
Atmos. Chem. Phys. Discuss., https://doi.org/10.5194/acp-2018-1219Manuscript under review for journal Atmos. Chem. Phys.Discussion started: 30 November 2018c© Author(s) 2018. CC BY 4.0 License.

17
contrary, negative correlation of LRABL and FCMR is present, when more coarse particles occur at sunrise/sunset time. A
negative-correlation of PLDRABL and FCMR was found for all time-periods, which indicates higher sphericity of fine
particles and thus higher isotropy of the atmosphere what consisting of fine particles. Reported in literature, different
correlations obtained for AODABL and PM10 are explained as due to complicated atmospheric and weather conditions. In
summer and early-autumn in Warsaw, there is generally high-pressure systems that govern the dynamics of the atmosphere, 5
there is significantly less traffic pollution (people on holidays, on bicycles), pollination of plants plays role. The relationship
between AODABL and PM10 reported here, displays positive correlation only at sunrise/sunset (at least at sunrise this can be
due to traffic peaks). Due to less urban emissions (neither traffic nor domestic heating) and relatively stable boundary layer
at nighttime, no apparent relationship of AODABL with PM10 was observed. The AODABL and LRABL depend on extinction
coefficient derived inside the ABL, thus their positive correlation is observed. Relationship of ÅEABL and LRABL reveals 10
negative correlation. When ABLH grows, a declining trend of FCMR is observed, indicating an increase of coarse particle
fraction. However, there is no clearly apparent link between PM10 or PM2.5 and ABLH.
The obtained results contribute to increase of knowledge on variability of optical properties within the aerosol boundary
layer at a continental site in central Europe.
Bottom line is that regular, automated observations with the NeXT generation PollyXT lidar conducted at the EARLINET 15
site allow for such studies. The excellent capabilities of this lidar gave possibility to combine the derived within this
preliminary study lidar results with other data sources (e.g. AERONET). Hypothesis for boundary layer aerosol properties
interrelations were proposed and will be further verified with more lidar data of regular observations in Warsaw. What could
be improved by enlarging the existing high-quality lidar data sample is investigation of subgrouping of aerosol properties
that could provide statistically significant correlations. Further, more observations will allow for extension of search for 20
differences to other seasons, daytime analyses, and distinguishing sunset from sunrise aerosol properties relationships.
Finally, a separation of aerosol properties accordingly to aerosol content, i.e. pure urban versus its mixture with other aerosol
types, would be possible (currently too little data in mixed categories) and estimation of their radiative effect.
Acknowledgments: 25
This research has been done in the frame of the Technical assistance for Polish Radar and Lidar Mobile Observation System
(POLIMOS) funded by ESA-ESTEC Contract no. 4000119961/16/NL/FF/mg.
The PollyXT-Warsaw lidar was developed in a scientific collaboration of the Faculty of Physics, University of Warsaw
(FUW) with the Institute of Tropospheric Research (TROPOS). This development was financed by the Polish Foundation of
Science and Technology (FNTP-No. 519/FNITP/115/2010). We especially acknowledge colleagues of the PollyXT Lidar 30
Group lead by Dietrich Althausen.
Authors acknowledge the Warsaw Regional Inspectorate of Environmental Protection WIOS-Warsaw for provision of the
processed PM2.5 and PM10 data, visualised at http://www.wios.warszawa.pl. The data were accessed via the Data Archive of
the National Chief Inspectorate for Environmental Protection (GIOS) via http://powietrze.gios.gov.pl/pjp/archive.
Atmos. Chem. Phys. Discuss., https://doi.org/10.5194/acp-2018-1219Manuscript under review for journal Atmos. Chem. Phys.Discussion started: 30 November 2018c© Author(s) 2018. CC BY 4.0 License.
18
We acknowledge Brent Holben for processing of the AERONET data (https://AERONETl .gsfc.nasa.gov); Aleksander
Pietruczuk and Piotr Sobolewski of Institute of Geophysics at Polish Academy of Sciences for performing the AERONET
measurements in Belsk; Phillippe Golub for performing instrument calibrations at the PHOTONS/AERONET-EUROPE
calibration center, supported by ACTRIS-1 project funded within the European Union Seventh Framework Program
(FP7/2007e2013) under Grant Agreement No.262254. 5
We acknowledge Krzysztof Markowicz for processing of the MFR-7 data within the Polish aerosol Research Network
PolandAOD-NET (https://polandaod.pl). The MFR-7 radiometer was purchased within a grant No.1283/B/P01/2010/38 of
the Polish Ministry of Science and High Education.
The EARLINET is currently supported by the ACTRIS-2 project, funded by the European Union
Research Infrastructure Action under the H2020 specific program for Integrating and opening existing national and regional 10
research infrastructures of European interest under Grant Agreement No. 654109 and No. 739530. The University of
Warsaw participates in ACTRIS-2 project as an associate partner without funding.
Author Contributions:
I.S.Stachlewska wrote the paper, obtained funding for the research, came up with the study approach, designed methodology, 15
and performed experiment, contributed to development of PollyXT-Warsaw lidar and lidar evaluation algorithms, took care
of quality assurance of lidar measurements and data products, and holistically interpreted the lidar results with other data
sources results (AERONET, PolandAOD-NET). D.Szczepanik contributed with calculation of the aerosol optical properties
profiles (α, β, DR) and with their categorization for the EARLINET/ACTRIS Data Base. D.Wang contributed with extensive
literature review, wrote the codes for the ABLH and the WV retrieval algorithms, and performed statistical analysis of the 20
optical properties (AE, LR, DR, WVMR). All authors contributed with merit revisions of the paper.
Conflicts of Interest: The authors declare no conflict of interest.
References
Alados‐Arboledas, L., Müller, D., Guerrero‐Rascado, J., Navas‐Guzmán, F., Pérez‐Ramírez, D., and Olmo, F.: Optical and 25
microphysical properties of fresh biomass burning aerosol retrieved by Raman lidar, and star‐and sun‐photometry, Geophys.
Res. Lett, 38, 2011.
Alastuey, A., Querol, X., Castillo, S., Escudero, M., Avila, A., Cuevas, E., Torres, C., Romero, P. M., Exposito, F. and
García, O.: Characterisation of tsp and pm2. 5 at Izaña, and Sta. Cruz de tenerife (Canary Islands, Spain) during a Saharan
dust episode (July 2002), Atmos. Environ., 39, 4715-4728, 2005. 30
Atmos. Chem. Phys. Discuss., https://doi.org/10.5194/acp-2018-1219Manuscript under review for journal Atmos. Chem. Phys.Discussion started: 30 November 2018c© Author(s) 2018. CC BY 4.0 License.

19
Amiridis, V., Balis, D., Kazadzis, S., Bais, A., Giannakaki, E., Papayannis, A., and Zerefos, C.: Four‐year aerosol
observations with a Raman lidar at Thessaloniki, Greece, in the framework of European Aerosol Research Lidar Network
(EARLINET), J. Geophys. Res., 110, 2005.
Amiridis, V., Balis, D., Giannakaki, E., Stohl, A., Kazadzis, S., Koukouli, M., and Zanis, P.: Optical characteristics of
biomass burning aerosols over Southeastern Europe determined from UV-Raman lidar measurements, Atmos. Chem. Phys., 5
9, 2431-2440, 2009.
Ansmann, A., Tesche, M., Knippertz, P., Bierwirth, E., Althausen, D., Mueller, D., and Schulz, O.: Vertical profiling of
convective dust plumes in Southern morocco during SAMUM, Tellus B: Chem. and Phys. Meteo., 61, 340-353, 2009.
Ansmann, A., Baars, H., Chudnovsky, A., Mattis, I., Veselovskii, I., Haarig, M., Seifert, P., Engelmann, R., and Wandinger,
U.: Extreme levels of Canadian wildfire smoke in the stratosphere over Central Europe on 21–22 August 2017, Atmos. 10
Chem. Phys., 18, 11831-11845, 2018.
Baars, H., Kanitz, T., Engelmann, R., Althausen, D., Heese, B., Komppula, M., Preißler, J., Tesche, M., Ansmann, A., and
Wandinger, U, Lim, J.-H., Ahn, J. Y., Stachlewska, I. S., Amiridis, V., Marinou, E., Seifert, P., Hofer, J., Skupin, A.,
Schneider, F., Bohlmann, S., Foth, A., Bley, S., Pfüller, A., Giannakaki, E., Lihavainen, H., Viisanen, Y., Hooda, R. K.,
Pereira, S. N., Bortoli, D., Wagner, F., Mattis, I., Janicka, L., Markowicz, K. M., Achtert, P., Artaxo, P., Pauliquevis, T., 15
Souza, R. A. F., Sharma, V. P., van Zyl, P. G., Beukes, J. P., Sun, J., Rohwer, E. G., Deng, R., Mamouri, R.-E., and
Zamorano, F.: An overview of the first decade of Polly NET: An emerging network of automated Raman-polarization lidars
for continuous aerosol profiling, Atmos. Chem. Phys., 16, 5111-5137, 2016.
Barlage, M., Miao, S., and Chen, F.: Impact of physics parameterizations on high‐resolution weather prediction over two
Chinese megacities, J. Geophys. Res., 121, 4487-4498, 2016. 20
Belegante, L., Bravo-Aranda, J. A., Freudenthaler, V., Nicolae, D., Nemuc, A., Ene, D., Alados-Arboledas, L., Amodeo, A.,
Pappalardo, G., D'Amico, G., Amato, F., Engelmann, R., Baars, H., Wandinger, U., Papayannis, A., Kokkalis, P., and
Pereira, S. N.: Experimental techniques for the calibration of lidar depolarization channels in EARLINET, Atmos. Meas.
Tech., 11, 1119-1141, https://doi.org/10.5194/amt-11-1119-2018, 2018.
Bennouna, Y., Cachorro, V. E., Mateos, D., Burgos, M. A., Toledano, C., Torres, B. and de Frutos, A.: Long-term 25
comparative study of columnar and surface mass concentration aerosol properties in a background environment, Atmos.
Environ., 140, 261-272, 2016.
Bonn, B., Schneidemesser, E. V., Andrich, D., Quedenau, J., Gerwig, H., Lüdecke, A., Kura, J., Pietsch, A., Ehlers, C., and
Klemp, D.: Baerlin 2014–the influence of land surface types on and the horizontal heterogeneity of air pollutant levels in
Berlin, Atmos. Chem. Phys., 16, 7785-7811, 2016. 30
Böckmann, C., Wandinger, U., Ansmann, A., Bösenberg, J., Amiridis, V., Boselli, A., Delaval, A., De Tomasi, F., Frioud,
M., and Grigorov, I. V.: Aerosol lidar intercomparison in the framework of the EARLINET project. 2. Serosol backscatter
algorithms, Applied Optics, 43, 977-989, 2004.
Atmos. Chem. Phys. Discuss., https://doi.org/10.5194/acp-2018-1219Manuscript under review for journal Atmos. Chem. Phys.Discussion started: 30 November 2018c© Author(s) 2018. CC BY 4.0 License.
20
Burton, S., Ferrare, R., Hostetler, C., Hair, J., Rogers, R., Obland, M., Butler, C., Cook, A., Harper, D., and Froyd, K.:
Aerosol classification using airborne high spectral resolution lidar measurements–methodology and examples, Atmos. Meas.
Tech., 5, 73-98, 2012.
Chen, B. and Kan, H.: Air pollution and population health: A global challenge, Environmental health and preventive
medicine, 13, 94, 2008. 5
Chilinski M. T., Markowicz K. M., Zawadzka O., Stachlewska I. S., Kumala W., Petelski T., Makuch P., Westphal D. L.,
and Zagajewski B.: Modelling and Observation of Mineral Dust Optical Properties over Central Europe, Acta Geophysica,
64 (6) , 2550-2590 , doi:10.1515/acgeo-2016-0069, 2016.
Dawson, K., Meskhidze, N., Josset, D., and Gassó, S.: Spaceborne observations of the lidar ratio of marine aerosols, Atmos.
Chem. Phys., 15, 3241-3255, 2015. 10
De Leeuw, F., Sluyter, R., van Bruegel, P., Bogman, F., and van Aalst, R.: Air pollution by ozone in Europe in 1999 and the
summer of 2000, Office for Official Publications of the European Communities, 2001.
Du, C., Liu, S., Yu, X., Li, X., Chen, C., Peng, Y., Dong, Y., Dong, Z., and Wang, F.: Urban boundary layer height
characteristics and relationship with particulate matter mass concentrations in Xi’an, Central China, aerosol, Air Qual. Res.,
13, 1598-1607, 2013. 15
The EARLINET publishing group 2000-2015.: EARLINET All 2000-2015. World Data Center for Climate (WDCC) at
DKRZ. https://doi.org/10.1594/WDCC/EARLINET_All_2000-2015, 2018.
Engelmann, R., Kanitz, T., Baars, H., Heese, B., Althausen, D., Skupin, A., Wandinger, U., Komppula, M., Stachlewska,
I.S., Amiridis, V, Marinou, E., Mattis, I., Linné, H., and Ansmann, A.: The automated multiwavelength Raman polarization
and water-vapor lidar PollyXT: The next generation, Atmos. Meas. Tech., 9, 1767-1784, 2016. 20
Fiebig, M., Stohl, A., Wendisch, M., Eckhardt, S., and Petzold, A.: Dependence of solar radiative forcing of forest fire
aerosol on ageing and state of mixture, Atmos. Chem. Phys., 3, 881-891, 2003.
Filip, L. and Stefan, S.: Study of the correlation between the near-ground pm10 mass concentration and the aerosol optical
depth. J. Atmos. Solar.-Terrestrial. Phys., 73, 1883-1889, 2011.
Flentje, H., Heese, B., Reichardt, J., and Thomas, W.: Aerosol profiling using the ceilometer network of the German 25
Meteorological Service, Atmos. Meas. Tech. Discuss, 3, 3643-3673, doi.org/10.5194/amtd-3-3643-2010, 2010.
Freudenthaler, V., Linné, H., Chaikovski, A., Rabus, D., and Groß, S.: EARLINET lidar quality assurance tools, Atmos.
Meas. Tech. Discuss., doi.org/10.5194/amt-2017-395, in review, 2018.
Freudenthaler, V., Esselborn, M., Wiegner, M., Heese, B., Tesche, M., Ansmann, A., Müller, D., Althausen, D., Wirth, M.,
and Fix, A.: Depolarization ratio profiling at several wavelengths in pure Saharan dust during SAMUM 2006, Tellus B: 30
Chem. and Phys. Meteo., 61, 165-179, 2009.
Gasteiger, J. and Freudenthaler, V.: Benefit of depolarization ratio at λ= 1064 nm for the retrieval of the aerosol
microphysics from lidar measurements, Atmos. Meas. Tech., 7, 3773-3781, 2014.
Atmos. Chem. Phys. Discuss., https://doi.org/10.5194/acp-2018-1219Manuscript under review for journal Atmos. Chem. Phys.Discussion started: 30 November 2018c© Author(s) 2018. CC BY 4.0 License.
21
Geiß, A., Wiegner, M., Bonn, B., Schäfer, K., Forkel, R., Schneidemesser, E. V.; Münkel, C., Chan, K. L., and Nothard, R.:
Mixing layer height as an indicator for urban air quality?, Atmos. Meas. Tech., 10, 2969-2988, 2017.
Groß, S., Tesche, M., Freudenthaler, V., Toledano, C., Wiegner, M., Ansmann, A., Althausen, D., and Seefeldner, M.:
Characterization of Saharan dust, marine aerosols and mixtures of biomass-burning aerosols and dust by means of multi-
wavelength depolarization and Raman lidar measurements during SAMUM 2, Tellus B: Chem. and Phys. Meteo., 63, 706-5
724, 2011.
Giannakaki, E., Balis, D., Amiridis, V., and Zerefos, C.: Optical properties of different aerosol types: Seven years of
combined Raman-elastic backscatter lidar measurements in Thessaloniki, Greece, Atmos. Meas. Tech., 3, 569-578, 2010.
Guo, H., Wang, Y., and Zhang, H.: Characterization of criteria air pollutants in Beijing during 2014–2015. Environ. Res.,
154, 334-344, 2017. 10
Haarig, M., Ansmann, A., Gasteiger, J., Kandler, K., Althausen, D., Baars, H., Radenz, M., and Farrell, D. A.: Dry versus
wet marine particle optical properties: RH dependence of depolarization ratio, backscatter, and extinction from
multiwavelength lidar measurements during saltrace, Atmos. Chem. Phys., 17, 14199, 2017.
Haarig, M., Ansmann, A., Baars, H., Jimenez, C., Veselovskii, I., Engelmann, R., and Althausen, D.: Depolarization and
lidar ratios at 355, 532, and 1064 nm and microphysical properties of aged tropospheric and stratospheric Canadian wildfire 15
smoke, Atmos. Chem. Phys., 18, 11847-11861, 2018.
Harrison, L., Michalsky, J., and Berndt, J.: Automated multifilter rotating shadow-band radiometer: An instrument for
optical depth and radiation measurements, Applied Optics, 33, 5118-5125, 1994.
He, Q., Li, C., Mao, J., Lau, A. K. H., and Chu, D.: Analysis of aerosol vertical distribution and variability in Hong Kong, J.
Geophys. Res., 113, 2008. 20
Heese, B. and Wiegner, M.: Vertical aerosol profiles from raman polarization lidar observations during the dry season amma
field campaign, J. Geophys. Res., 113, 2008.
Holben, B. N., Eck, T. F., Slutsker, I., Tanré, D., Buis, J. P., Setzer, A., Vermote, E., Reagan, J. A., Kaufman, Y. J., and
Nakajima, T., et al., AERONET-A federated instrument network and data archive for aerosol characterization. Remote Sens.
Environ., 66, 1-16, 1998. 25
Janicka, L., Stachlewska, I. S., Veselovskii, I., and Baars, H.: Temporal variations in optical and microphysical properties of
mineral dust and biomass burning aerosol derived from daytime Raman lidar observations over Warsaw, Poland, Atmos.
Environ., 169, 162-174, 2017.
Juda-Rezler K., Reizer, M., and Oudinet, J.P.: Determination and analysis of PM10 source apportionment during episodes of
air pollution in Central Eastern European urban areas: The case of wintertime 2006, Atmos. Environ., 45(36), 6557-6566, 30
2011.
Kaufman, Y. J. , Tanré, D., and Boucher, O.: A satellite view of aerosols in the climate system, Nature, 419, 215, 2002.
Lelieveld, J., Evans, J. S., Fnais, M., Giannadaki, D., and Pozzer, A.: The contribution of outdoor air pollution sources to
premature mortality on a global scale, Nature, 525, 367, 2015.
Atmos. Chem. Phys. Discuss., https://doi.org/10.5194/acp-2018-1219Manuscript under review for journal Atmos. Chem. Phys.Discussion started: 30 November 2018c© Author(s) 2018. CC BY 4.0 License.

22
Li, X., Ma, Y., Wang, Y., Liu, N., and Hong, Y.: Temporal and spatial analyses of particulate matter (pm10 and pm2. 5) and
its relationship with meteorological parameters over an urban city in Northeast China. Atmos. Res., 198, 185-193, 2017.
Marinou, E., Amiridis, V., Binietoglou, I., Tsikerdekis, A., Solomos, S., Proestakis, E., Konsta D., Papagiannopoulos, N.,
Tsekeri, A., and Vlastou, G.: Three-dimensional evolution of Saharan dust transport towards Europe based on a 9-year
EARLINET-optimized CALIPSO dataset, Atmos. Chem. Phys., 17, 2017. 5
Markowicz, K., Chilinski, M., Lisok, J., Zawadzka, O., Stachlewska, I., Janicka, L., Rozwadowska, A., Makuch, P., Pakszys,
P., and Zielinski, T.: Study of aerosol optical properties during long-range transport of biomass burning from Canada to
Central Europe in July 2013, J. Aeros. Sci., 101, 156-173, 2016.
Masonis, S. J., Anderson, T. L., Covert, D. S., Kapustin, V., Clarke, A. D., Howell, S., and Moore, K.: A study of the
extinction-to-backscatter ratio of marine aerosol during the shoreline environment aerosol study, J. Atmos. Ocean. Techn., 10
20, 1388-1402, 2003.
Matthias, V., Balis, D., Bösenberg, J., Eixmann, R., Iarlori, M., Komguem, L., Mattis, I., Papayannis, A., Pappalardo, G.,
and Perrone, M.: Vertical aerosol distribution over Europe: Statistical analysis of Raman lidar data from 10 European aerosol
research lidar network (EARLINET) stations, J. Geophys. Res., 109, 2004.
Mattis, I., Ansmann, A., Müller, D., Wandinger, U., and Althausen, D.: Multiyear aerosol observations with dual‐wavelength 15
Raman lidar in the framework of EARLINET, J. Geophys. Res., 109, 2004.
Nicolae, D., Vasilescu, J., Talianu, C., Binietoglou, I., Nicolae, V., Andrei, S., and Antonescu, B.: A neural network aerosol-
typing algorithm based on lidar data, Atmos. Chem. Phys., 18, 14511-14537, https://doi.org/10.5194/acp-18-14511-2018,
2018.
Müller, D., Ansmann, A., Mattis, I., Tesche, M., Wandinger, U., Althausen, D., and Pisani, G.: Aerosol‐type‐dependent lidar 20
ratios observed with Raman lidar, J. Geophys. Res., 112, 2007.
Nemuc, A., Vasilescu, J., Talianu, C., Belegante, L., and Nicolae, D.: Assessment of aerosol's mass concentrations from
measured linear particle depolarization ratio (vertically resolved) and simulations, Atmos. Meas. Tech., 6, 3243-3255, 2013.
Ortiz-Amezcua, P., Guerrero-Rascado, J. L., Granados-Muñoz, M. J., Benavent-Oltra, J. A., Böckmann, C., Samaras, S.,
Stachlewska, I. S., Janicka, Ł., Baars, H., and Bohlmann, S.: Microphysical characterization of long-range transported 25
biomass burning particles from North America at three EARLINET stations, Atmos. Chem. Phys., 17, 5931-5946, 2017.
Pandolfi, M., Martucci, G., Querol, X., Alastuey, A., Wilsenack, F., Frey, S., O'Dowd, C., and Dall'Osto, M.: Continuous
aerosol boundary layer observations in the coastal urban area of Barcelona during SAPUSS, Atmos. Chem. Phys., 13, 4983-
4996, 2013.
Papagiannopoulos, N., Mona, L., Amodeo, A., D'Amico, G., Gumà Claramunt, P., Pappalardo, G., Alados-Arboledas, L., 30
Guerrero-Rascado, J. L., Amiridis, V., Kokkalis, P., Apituley, A., Baars, H., Schwarz, A., Wandinger, U., Binietoglou, I.,
Nicolae, D., Bortoli, D., Comerón, A., Rodríguez-Gómez, A., Sicard, M., Papayannis, A., and Wiegner, M.: An automatic
observation-based aerosol typing method for EARLINET, Atmos. Chem. Phys., 18, 15879-15901,
https://doi.org/10.5194/acp-18-15879-2018, 2018.
Atmos. Chem. Phys. Discuss., https://doi.org/10.5194/acp-2018-1219Manuscript under review for journal Atmos. Chem. Phys.Discussion started: 30 November 2018c© Author(s) 2018. CC BY 4.0 License.

23
Papayannis, A., Amiridis, V., Mona, L., Tsaknakis, G., Balis, D., Bösenberg, J., Chaikovski, A., De Tomasi, F., Grigorov, I.,
and Mattis, I.: Systematic lidar observations of Saharan dust over Europe in the frame of EARLINET (2000–2002), J.
Geophys. Res., 113, 2008.
Pappalardo, G., Amodeo, A., Apituley, A., Comeron, A., Freudenthaler, V., Linné, H., Ansmann, A., Bösenberg, J.,
D'Amico, G., and Mattis, I.: EARLINET: Towards an advanced sustainable European aerosol lidar network. Atmos. Meas. 5
Tech., 7, 2389-2409, 2014. Pérez, C., Sicard, M., Jorba, O., Comerón, A., and Baldasano, J.M.: Summertime re-circulations
of air pollutants over the north-eastern Iberian coast observed from systematic EARLINET lidar measurements in Barcelona,
Atmos. Environ., 38, 3983-4000, 2004.
Perrone, M. R., De Tomasi, F., and Gobbi, G.: Vertically resolved aerosol properties by multi-wavelength lidar
measurements, Atmos. Chem. Phys., 14, 1185-1204, 2014. 10
Petters, M. D., Carrico, C. M., Kreidenweis, S. M., Prenni, A. J., DeMott, P. J., Collett, J. L., and Moosmüller, H.: Cloud
condensation nucleation activity of biomass burning aerosol, J. Geophys. Res., 114, 2009.
Pósfai, M., Gelencsér, A., Simonics, R., Arató, K., Li, J., Hobbs, P.V., and Buseck, P.R.: Atmospheric tar balls: Particles
from biomass and biofuel burning, J. Geophys. Res., 109, 2004.
Rost, J., Holst, T., Sähn, E., Klingner, M., Anke, K., Ahrens, D. and Mayer, H.: Variability of pm10 concentrations 15
dependent on meteorological conditions, Intern. J. Environ. Poll., 36, 3-18, 2009.
Sakai, T., Nagai, T., Zaizen, Y., and Mano, Y.: Backscattering linear depolarization ratio measurements of mineral, sea-salt,
and ammonium sulfate particles simulated in a laboratory chamber, Applied Optics, 49, 4441-4449, 2010.
Sicard, M., Rocadenbosch, F., Reba, M., Comerón, A., Tomás, S., García-Vízcaino, D., Batet, O., Barrios, R., Kumar, D.,
and Baldasano, J.: Seasonal variability of aerosol optical properties observed by means of a Raman lidar at an EARLINET 20
site over Northeastern Spain, Atmos. Chem. Phys., 11, 175-190, 2011.
Siomos, N., Balis, D. S., Poupkou, A., Liora, N., Dimopoulos, S., Melas, D., Giannakaki, E., Filioglou, M., Basart, S., and
Chaikovsky, A.: Investigating the quality of modeled aerosol profiles based on combined lidar and sunphotometer data,
Atmos. Chem. Phys., 17, 7003-7023, 2017.
Siomos, N., Balis, D. S., Voudouri, K. A., Giannakaki, E., Filioglou, M., Amiridis, V., Papayannis, A., and Fragkos, K.: Are 25
EARLINET and AERONET climatologies consistent? The case of Thessaloniki, Greece, Atmos. Chem. Phys., 18, 11885-
11903, 2018.
Stachlewska, I. S., Costa-Surós, M., and Althausen, D.: Raman lidar water vapour profiling over Warsaw, Poland, Atmos.
Res., 194, 258-267, 2017.
Stachlewska, I.S., Zawadzka, O., and Engelmann, R.: Effect of heat wave conditions on aerosol optical properties derived 30
from satellite and ground-based remote sensing over Poland, Remote Sensing, 9, 1199, 2017.
Stachlewska, I. S., Samson, M., Zawadzka, O., Harenda, K. M., Janicka, L., Poczta, P., Szczepanik, D., Heese, B., Wang, D.,
and Borek, K. Tetoni, E., Proestakis, E., Siomos, N., Nemuc, A., Chojnicki, B.H., Markowicz, K.M., Pietruczuk, A., Szkop,
Atmos. Chem. Phys. Discuss., https://doi.org/10.5194/acp-2018-1219Manuscript under review for journal Atmos. Chem. Phys.Discussion started: 30 November 2018c© Author(s) 2018. CC BY 4.0 License.
24
A., Althausen, D., Stebel, K., Schuettemeyer, D., and Zehner, C.: Modification of local urban aerosol properties by long-
range transport of biomass burning aerosol, Remote Sensing, 10, 412, 2018.
Stocker, T., Qin, D., Plattner, G., Tignor, M., Allen, S., Boschung, J., Nauels, A., Xia, Y., Bex, V., and Midgley, P.: IPCC,
2013: Climate Change 2013: The Physical Science Basis. Contribution of Working Group I to the Fifth Assessment Report of
the Intergovernmental Panel on Climate Change, Cambridge Univ. Press, Cambridge, UK, and New York, 1535 pp., 2013. 5
Szczepanik, D. and Markowicz, K.: The relation between columnar and surface aerosol optical properties in a background
environment, Atmos. Poll. Res., 9, 246-256, 2018.
Szkop, A. and Pietruczuk, A.: Analysis of aerosol transport over southern poland in august 2015 based on a synergy of
remote sensing and backward trajectory techniques. J. Appl. Rem. Sens., 11, 016039, 2017.
Schäfer, K., Emeis, S., Hoffmann, H., and Jahn, C.: Influence of mixing layer height upon air pollution in urban and sub-10
urban areas, Meteorologische Zeitschrift, 15, 647-658, 2006.
Sharma, A., Mandal, T., Sharma, S., Shukla, D., and Singh, S.: Relationships of surface ozone with its precursors, particulate
matter and meteorology over Delhi, J. Atmos. Chem., 74, 451-474, 2017.
Tian, P., Cao, X., Zhang, L., Sun, N., Sun, L., Logan, T., Shi, J., Wang, Y., Ji, Y., and Lin, Y.: Aerosol vertical distribution
and optical properties over China from long-term satellite and ground-based remote sensing, Atmos. Chem. Phys., 17, 2509-15
2523, 2017.
Trickl, T., Vogelmann, H., Flentje, H., and Ries, L.: Stratospheric ozone in boreal fire plumes–the 2013 smoke season over
Central Europe, Atmos. Chem. Phys., 15, 9631-9649, 2015.
Wandinger, U., Freudenthaler, V., Baars, H., Amodeo, A., Engelmann, R., Mattis, I., Groß, S., Pappalardo, G., Giunta, A.,
D'Amico, G., Chaikovsky, A., Osipenko, F., Slesar, A., Nicolae, D., Belegante, L., Talianu, C., Serikov, I., Linné, H., 20
Jansen, F., Apituley, A., Wilson, K. M., de Graaf, M., Trickl, T., Giehl, H., Adam, M., Comerón, A., Muñoz-Porcar, C.,
Rocadenbosch, F., Sicard, M., Tomás, S., Lange, D., Kumar, D., Pujadas, M., Molero, F., Fernández, A. J., Alados-
Arboledas, L., Bravo-Aranda, J. A., Navas-Guzmán, F., Guerrero-Rascado, J. L., Granados-Muñoz, M. J., Preißler, J.,
Wagner, F., Gausa, M., Grigorov, I., Stoyanov, D., Iarlori, M., Rizi, V., Spinelli, N., Boselli, A., Wang, X., Lo Feudo, T.,
Perrone, M. R., De Tomasi, F., and Burlizzi, P.: EARLINET instrument intercomparison campaigns: overview on strategy 25
and results, Atmos. Meas. Tech., 9, 1001-1023, https://doi.org/10.5194/amt-9-1001-2016, 2016.
Wang, D. S., Stachlewska, I. S., Song, X., Heese, B., and Nemuc, A.: Annual, seasonal and diurnal variability of boundary
layer over an urban continental site based on 10 years of active remote sensing observations in Warsaw, Remote Sensing, in
review, 2018.
Xie, C., Nishizawa, T., Sugimoto, N., Matsui, I., and Wang, Z.: Characteristics of aerosol optical properties in pollution and 30
asian dust episodes over Beijing, China, Applied Optics, 47, 4945-4951, 2008.
Zawadzka, O., Markowicz, K., Pietruczuk, A., Zielinski, T., and Jaroslawski, J.: Impact of urban pollution emitted in
Warsaw on aerosol properties. Atmos. Environ., 69, 15-28, 2013.
Atmos. Chem. Phys. Discuss., https://doi.org/10.5194/acp-2018-1219Manuscript under review for journal Atmos. Chem. Phys.Discussion started: 30 November 2018c© Author(s) 2018. CC BY 4.0 License.
25
Zhang, H., Wang, Y., Hu, J., Ying, Q., and Hu, X.-M.: Relationships between meteorological parameters and criteria air
pollutants in three megacities in china. Environ. Res., 140, 242-254, 2015.
Atmos. Chem. Phys. Discuss., https://doi.org/10.5194/acp-2018-1219Manuscript under review for journal Atmos. Chem. Phys.Discussion started: 30 November 2018c© Author(s) 2018. CC BY 4.0 License.
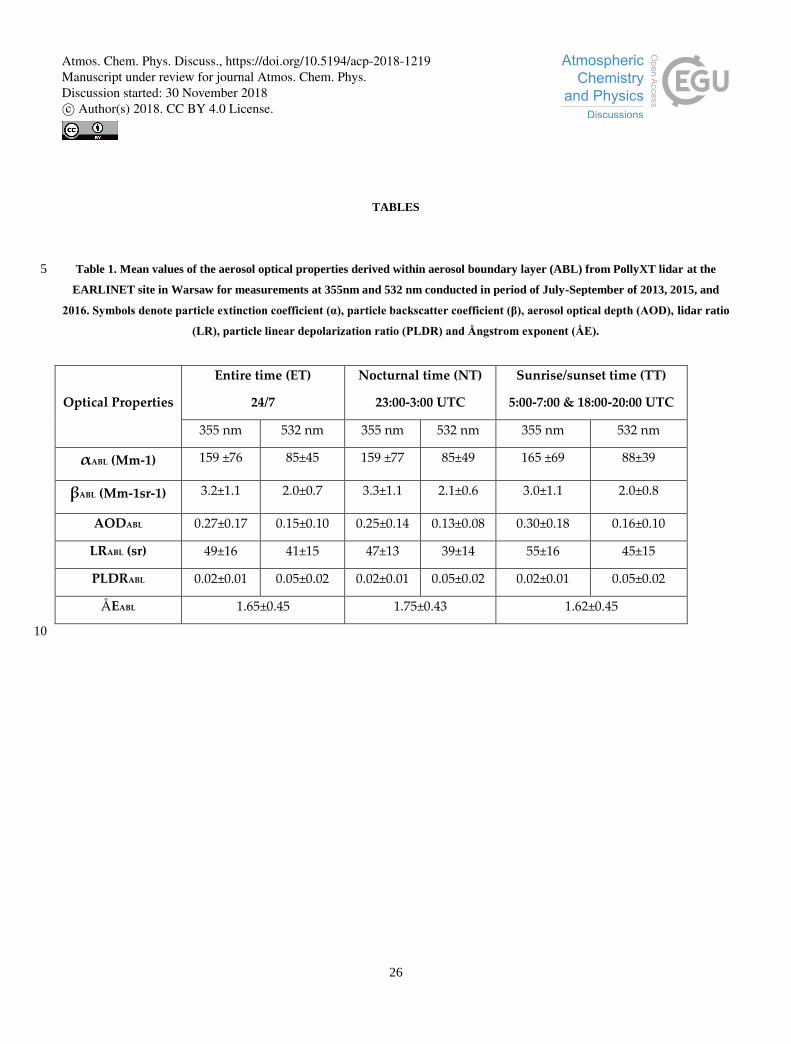
26
TABLES
Table 1. Mean values of the aerosol optical properties derived within aerosol boundary layer (ABL) from PollyXT lidar at the 5
EARLINET site in Warsaw for measurements at 355nm and 532 nm conducted in period of July-September of 2013, 2015, and
2016. Symbols denote particle extinction coefficient (α), particle backscatter coefficient (β), aerosol optical depth (AOD), lidar ratio
(LR), particle linear depolarization ratio (PLDR) and Ångstrom exponent (ÅE).
Optical Properties
Entire time (ET)
24/7
Nocturnal time (NT)
23:00-3:00 UTC
Sunrise/sunset time (TT)
5:00-7:00 & 18:00-20:00 UTC
355 nm 532 nm 355 nm 532 nm 355 nm 532 nm
αABL (Mm-1) 159 ±76 85±45 159 ±77 85±49 165 ±69 88±39
βABL (Mm-1sr-1) 3.2±1.1 2.0±0.7 3.3±1.1 2.1±0.6 3.0±1.1 2.0±0.8
AODABL 0.27±0.17 0.15±0.10 0.25±0.14 0.13±0.08 0.30±0.18 0.16±0.10
LRABL (sr) 49±16 41±15 47±13 39±14 55±16 45±15
PLDRABL 0.02±0.01 0.05±0.02 0.02±0.01 0.05±0.02 0.02±0.01 0.05±0.02
ÅEABL 1.65±0.45 1.75±0.43 1.62±0.45
10
Atmos. Chem. Phys. Discuss., https://doi.org/10.5194/acp-2018-1219Manuscript under review for journal Atmos. Chem. Phys.Discussion started: 30 November 2018c© Author(s) 2018. CC BY 4.0 License.
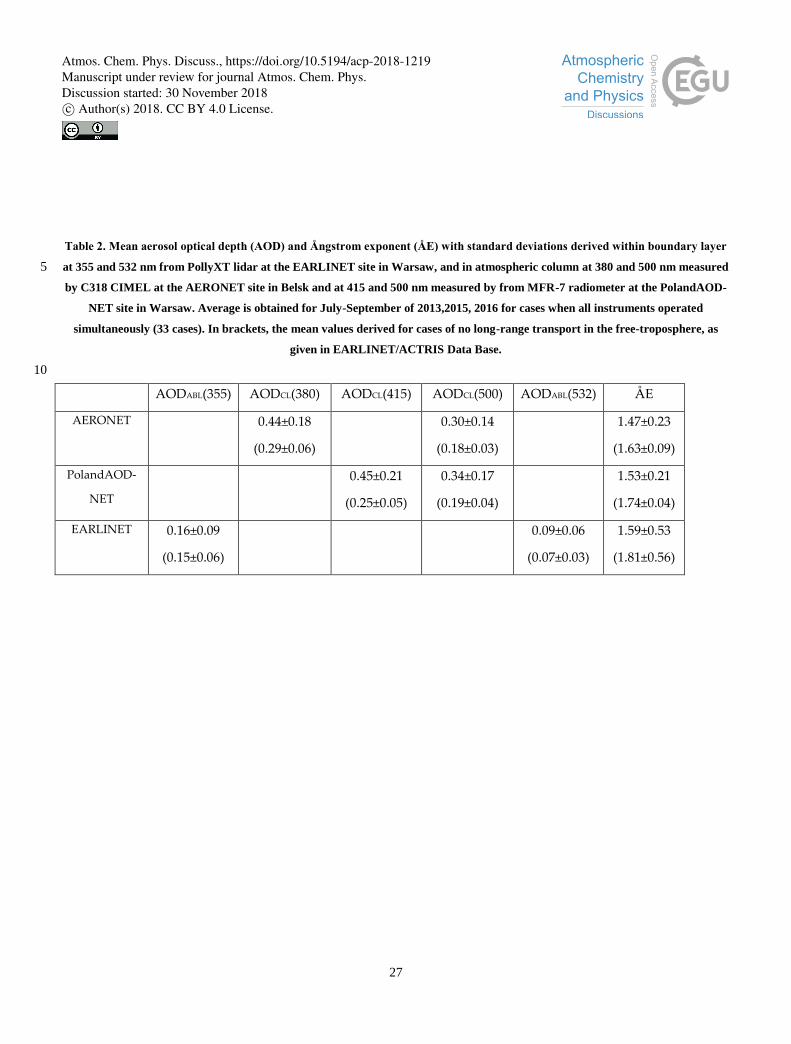
27
Table 2. Mean aerosol optical depth (AOD) and Ångstrom exponent (ÅE) with standard deviations derived within boundary layer
at 355 and 532 nm from PollyXT lidar at the EARLINET site in Warsaw, and in atmospheric column at 380 and 500 nm measured 5
by C318 CIMEL at the AERONET site in Belsk and at 415 and 500 nm measured by from MFR-7 radiometer at the PolandAOD-
NET site in Warsaw. Average is obtained for July-September of 2013,2015, 2016 for cases when all instruments operated
simultaneously (33 cases). In brackets, the mean values derived for cases of no long-range transport in the free-troposphere, as
given in EARLINET/ACTRIS Data Base.
10
AODABL(355) AODCL(380) AODCL(415) AODCL(500) AODABL(532) ÅE
AERONET 0.44±0.18
(0.29±0.06)
0.30±0.14
(0.18±0.03)
1.47±0.23
(1.63±0.09)
PolandAOD-
NET
0.45±0.21
(0.25±0.05)
0.34±0.17
(0.19±0.04)
1.53±0.21
(1.74±0.04)
EARLINET 0.16±0.09
(0.15±0.06)
0.09±0.06
(0.07±0.03)
1.59±0.53
(1.81±0.56)
Atmos. Chem. Phys. Discuss., https://doi.org/10.5194/acp-2018-1219Manuscript under review for journal Atmos. Chem. Phys.Discussion started: 30 November 2018c© Author(s) 2018. CC BY 4.0 License.

28
FIGURES
5
Figure 1. Frequency distribution of aerosol optical depth (AOD), lidar ratio (LR), particle linear depolarization ratio (PLDR) and
Ångstrom exponent (ÅE) at 355 and 532 nm, derived within aerosol boundary layer at the EARLINET lidar site in Warsaw for
period of July-September 2013, 2015, 2016 as compared to the fine to coarse mass ratio (FCMR) derived from surface particulate
matter with an aerodynamic diameter below 10μm (PM10) and below 2.5μm (PM2.5) measurements at the WIOS site in Warsaw-10
Ursynów. The period of measurement is divided to the entire time (ET; 24 h), the nocturnal time (NT; 23:00-3:00 UTC) and the
sunrise/sunset transition time (TT; 5:00-7:00 and 18:00-20:00 UTC).
0.05-0.1 0.1-0.3 0.31-0.5 0.51-0.7 0.71-0.9 >0.910
20
40
60
80
Fre
qu
ency
[%
]
AOD355 nm
ET
NT
TT
0.03-0.1 0.1-0.3 0.31-0.5 0.51-0.7 0.71-0.9 >0.910
20
40
60
80
Fre
qu
ency
[%
]
AOD532 nm
ET
NT
TT
25-30 31-50 51-70 71-90 >910
20
40
60
80
Fre
qu
ency
[%
]
LR355 nm
[ sr ]
ET
NT
TT
25-30 31-50 51-70 71-90 >910
20
40
60
80
Fre
qu
ency
[%
]
LR532 nm
[ sr ]
ET
NT
TT
<0.02 0.02-0.04 0.04-0.06 0.06-0.08 0.08-0.10 >0.100
20
40
60
80
Fre
qu
ency
[%
]
PLDR355 nm
ET
NT
TT
<0.02 0.02-0.04 0.04-0.06 0.06-0.08 0.08-0.10 >0.100
20
40
60
80
Fre
qu
ency
[%
]
PLDR532 nm
ET
NT
TT
<0.5 0.51-1.0 1.01-1.5 1.51-2.0 2.01-2.5 >2.510
20
40
60
80
Fre
qu
ency
[%
]
AE355/532 nm
ET
NT
TT
<0.5 0.51-1.0 1.01-1.5 1.51-2.0 2.01-2.5 >2.510
20
40
60
80
Fre
qu
ency
[%
]
FCMR
ET
NT
TT
Atmos. Chem. Phys. Discuss., https://doi.org/10.5194/acp-2018-1219Manuscript under review for journal Atmos. Chem. Phys.Discussion started: 30 November 2018c© Author(s) 2018. CC BY 4.0 License.

29
Figure 2. Hourly averages of aerosol optical depth (AOD) and Ångstrom exponent (ÅE) derived within boundary layer at 355 and
532 nm from PollyXT lidar at the EARLINET site in Warsaw (open circle/square), and in atmospheric column at 380 and 500 nm 5
measured by C318 CIMEL at the AERONET site in Belsk (black/blue dots) and at 415 and 500 nm measured by from MFR-7
radiometer at the PolandAOD-NET site in Warsaw (grey/red dots). Note, only data points for which all 3 measurements were
available are plotted. For day of year 182-274, for all years (2013,2015, 2016) we superimpose available data points (33 cases) on
single plot (note 2016 was a lap year).
10
183 184 185 186 187 188 189 190 191 1920
0.2
0.4
0.6
0.8
AO
D U
V
216 218 220 222 224 226 228 230 232 234 236 2380
0.2
0.4
0.6
0.8
AERONET(380nm) BELSK
PolandAOD(415nm) WARSAW
EARLINET(ABL)
(355nm) WARSAW
183 184 185 186 187 188 189 190 191 1920
0.2
0.4
0.6
0.8
AO
D V
IS
216 218 220 222 224 226 228 230 232 234 236 2380
0.2
0.4
0.6
0.8
AERONET(500nm) BELSK
PolandAOD(500nm) WARSAW
EARLINET(ABL)
(532nm) WARSAW
183 184 185 186 187 188 189 190 191 1920
1
2
3
AE
Day of year
216 218 220 222 224 226 228 230 232 234 236 2380
1
2
3
AERONET(380/500) BELSK
PolandAOD(415/500) WARSAW
EARLINET(ABL)
(355/532) WARSAW
Day of year
Atmos. Chem. Phys. Discuss., https://doi.org/10.5194/acp-2018-1219Manuscript under review for journal Atmos. Chem. Phys.Discussion started: 30 November 2018c© Author(s) 2018. CC BY 4.0 License.
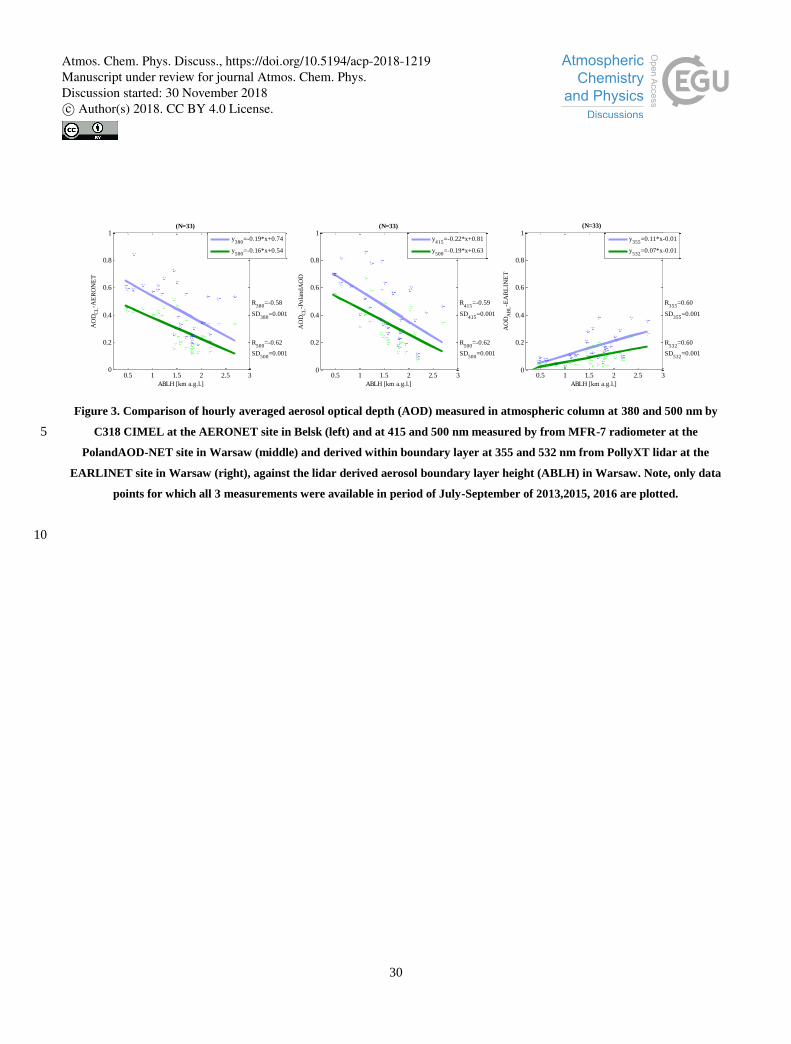
30
Figure 3. Comparison of hourly averaged aerosol optical depth (AOD) measured in atmospheric column at 380 and 500 nm by
C318 CIMEL at the AERONET site in Belsk (left) and at 415 and 500 nm measured by from MFR-7 radiometer at the 5
PolandAOD-NET site in Warsaw (middle) and derived within boundary layer at 355 and 532 nm from PollyXT lidar at the
EARLINET site in Warsaw (right), against the lidar derived aerosol boundary layer height (ABLH) in Warsaw. Note, only data
points for which all 3 measurements were available in period of July-September of 2013,2015, 2016 are plotted.
10
0.5 1 1.5 2 2.5 30
0.2
0.4
0.6
0.8
1
ABLH [km a.g.l.]
AO
DC
L-A
ER
ON
ET
R380
=-0.58
SD380
=0.001
R500
=-0.62
SD500
=0.001
y380
=-0.19*x+0.74
y500
=-0.16*x+0.54
0.5 1 1.5 2 2.5 30
0.2
0.4
0.6
0.8
1
ABLH [km a.g.l.]
AO
DC
L-P
ola
ndA
OD
(N=33)
R415
=-0.59
SD415
=0.001
R500
=-0.62
SD500
=0.001
y415
=-0.22*x+0.81
y500
=-0.19*x+0.63
0.5 1 1.5 2 2.5 30
0.2
0.4
0.6
0.8
1
ABLH [km a.g.l.]
AO
DA
BL
-EA
RL
INE
T
R355
=0.60
SD355
=0.001
R532
=0.60
SD532
=0.001
y355
=0.11*x-0.01
y532
=0.07*x-0.01
(N=33) (N=33)
Atmos. Chem. Phys. Discuss., https://doi.org/10.5194/acp-2018-1219Manuscript under review for journal Atmos. Chem. Phys.Discussion started: 30 November 2018c© Author(s) 2018. CC BY 4.0 License.
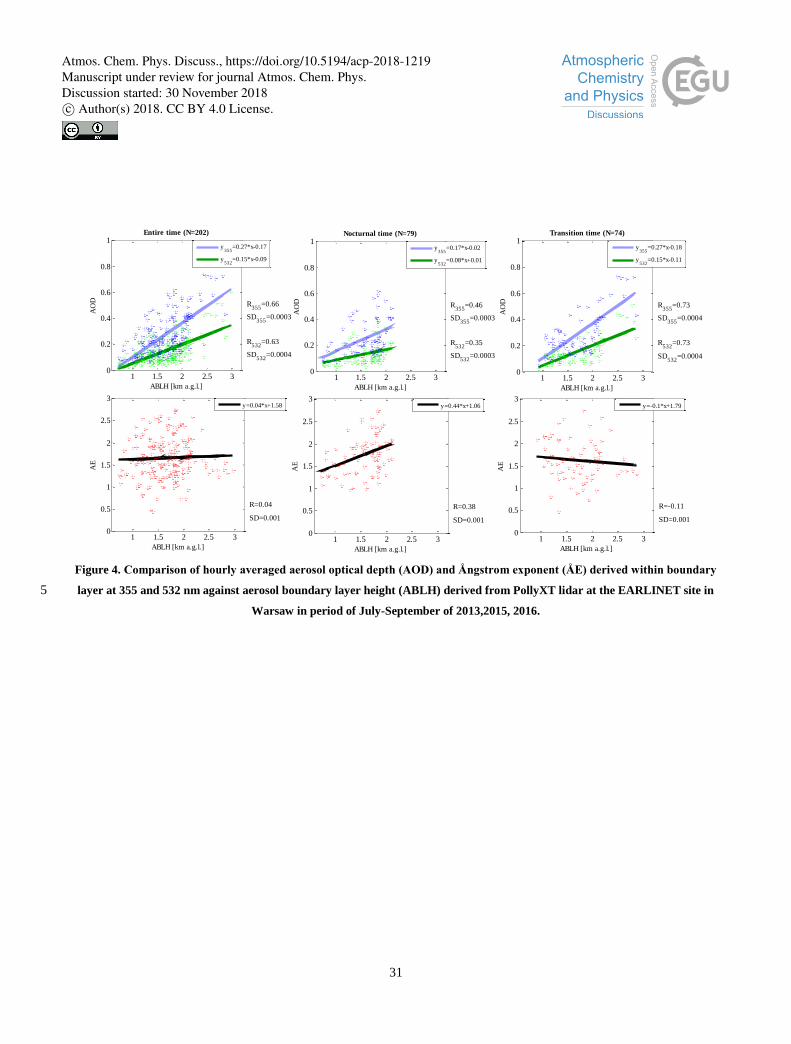
31
Figure 4. Comparison of hourly averaged aerosol optical depth (AOD) and Ångstrom exponent (ÅE) derived within boundary
layer at 355 and 532 nm against aerosol boundary layer height (ABLH) derived from PollyXT lidar at the EARLINET site in 5
Warsaw in period of July-September of 2013,2015, 2016.
1 1.5 2 2.5 30
0.2
0.4
0.6
0.8
1
ABLH [km a.g.l.]
AO
D
Entire time (N=202)
R355
=0.66
SD355
=0.0003
R532
=0.63
SD532
=0.0004
y355
=0.27*x-0.17
y532
=0.15*x-0.09
1 1.5 2 2.5 30
0.2
0.4
0.6
0.8
1
ABLH [km a.g.l.]
AO
D
Nocturnal time (N=79)
R355
=0.46
SD355
=0.0003
R532
=0.35
SD532
=0.0003
y355
=0.17*x-0.02
y532
=0.08*x+0.01
1 1.5 2 2.5 30
0.2
0.4
0.6
0.8
1
ABLH [km a.g.l.]
AO
D
Transition time (N=74)
R355
=0.73
SD355
=0.0004
R532
=0.73
SD532
=0.0004
y355
=0.27*x-0.18
y532
=0.15*x-0.11
1 1.5 2 2.5 30
0.5
1
1.5
2
2.5
3
ABLH [km a.g.l.]
AE
R=0.04
SD=0.001
y=0.04*x+1.58
1 1.5 2 2.5 30
0.5
1
1.5
2
2.5
3
ABLH [km a.g.l.]
AE
R=0.38
SD=0.001
y=0.44*x+1.06
1 1.5 2 2.5 30
0.5
1
1.5
2
2.5
3
ABLH [km a.g.l.]
AE
R=-0.11
SD=0.001
y=-0.1*x+1.79
Atmos. Chem. Phys. Discuss., https://doi.org/10.5194/acp-2018-1219Manuscript under review for journal Atmos. Chem. Phys.Discussion started: 30 November 2018c© Author(s) 2018. CC BY 4.0 License.
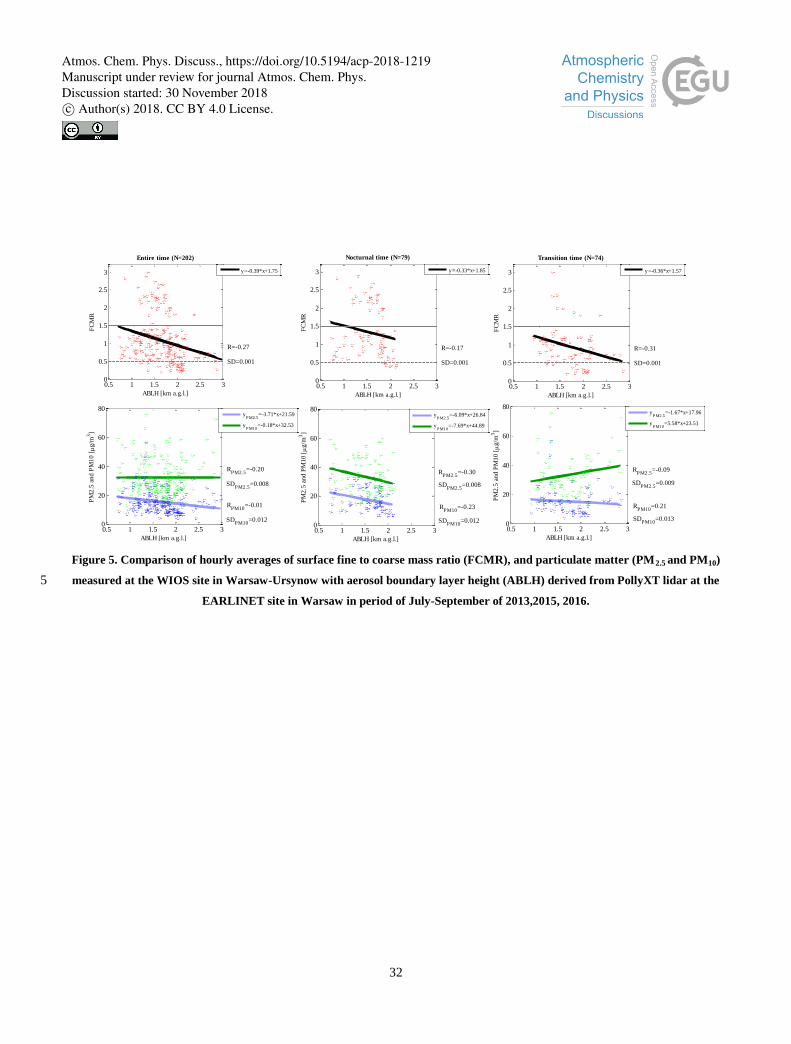
32
Figure 5. Comparison of hourly averages of surface fine to coarse mass ratio (FCMR), and particulate matter (PM2.5 and PM10)
measured at the WIOS site in Warsaw-Ursynow with aerosol boundary layer height (ABLH) derived from PollyXT lidar at the 5
EARLINET site in Warsaw in period of July-September of 2013,2015, 2016.
0.5 1 1.5 2 2.5 30
0.5
1
1.5
2
2.5
3
ABLH [km a.g.l.]
FC
MR
Entire time (N=202)
R=-0.27
SD=0.001
y=-0.39*x+1.75
0.5 1 1.5 2 2.5 30
0.5
1
1.5
2
2.5
3
ABLH [km a.g.l.]
FC
MR
Nocturnal time (N=79)
R=-0.17
SD=0.001
y=-0.33*x+1.85
0.5 1 1.5 2 2.5 30
0.5
1
1.5
2
2.5
3
ABLH [km a.g.l.]
FC
MR
Transition time (N=74)
R=-0.31
SD=0.001
y=-0.36*x+1.57
0.5 1 1.5 2 2.5 30
20
40
60
80
ABLH [km a.g.l.]
PM
2.5
and P
M10 [
g/m
3]
RPM2.5
=-0.20
SDPM2.5
=0.008
RPM10
=-0.01
SDPM10
=0.012
yPM2.5
=-3.71*x+21.59
yPM10
=-0.18*x+32.53
0.5 1 1.5 2 2.5 30
20
40
60
80
ABLH [km a.g.l.]
PM
2.5
and P
M10 [
g/m
3]
RPM2.5
=-0.30
SDPM2.5
=0.008
RPM10
=-0.23
SDPM10
=0.012
yPM2.5
=-6.09*x+26.84
yPM10
=-7.69*x+44.89
0.5 1 1.5 2 2.5 30
20
40
60
80
ABLH [km a.g.l.]
PM
2.5
and P
M10 [
g/m
3]
RPM2.5
=-0.09
SDPM2.5
=0.009
RPM10
=0.21
SDPM10
=0.013
yPM2.5
=-1.67*x+17.96
yPM10
=5.58*x+23.51
Atmos. Chem. Phys. Discuss., https://doi.org/10.5194/acp-2018-1219Manuscript under review for journal Atmos. Chem. Phys.Discussion started: 30 November 2018c© Author(s) 2018. CC BY 4.0 License.

33
Figure 6. Comparison of hourly averaged Ångstrom exponent (ÅE), lidar ratio (LR) and particle linear depolarization ratio
(PLDR) derived within boundary layer at 355 and 532 nm from PollyXT lidar at the EARLINET site in Warsaw in period of July-5
September of 2013,2015, 2016 with hourly averages of surface fine to coarse mass ratio (FCMR) derived from particulate matter
(PM2.5 and PM10) measured at the WIOS site in Warsaw-Ursynow. Thresholds of AE and FCMR are marked as horizontal/vertical
lines.
10
0 0.5 1 1.5 2 2.5 30
0.5
1
1.5
2
2.5
3
FCMR
AE
Entire time (N=202)
R=0.06
SD=0.001
y=0.04*x+1.61
0 0.5 1 1.5 2 2.5 30
0.5
1
1.5
2
2.5
3
FCMR
AE
Nocturnal time (N=79)
R=-0.31
SD=0.001
y=0.19*x+2.01
0 0.5 1 1.5 2 2.5 30
0.5
1
1.5
2
2.5
3
FCMR
AE
Transition time (N=74)
R=0.27
SD=0.001
y=0.22*x+1.42
0 0.5 1 1.5 2 2.5 3
20
40
60
80
FCMR
LR
[ s
r ]
R355
=-0.03
SD355
=0.016
R532
=0.01
SD532
=0.016
y355=-0.69*x+50.19
y532=0.14*x+41.26
0 0.5 1 1.5 2 2.5 3
20
40
60
80
FCMR
LR
[ s
r ]
R355
=0.34
SD355
=0.013
R532
=0.41
SD532
=0.014
y355=6.37*x+38.07
y532=8.37*x+28.03
0 0.5 1 1.5 2 2.5 3
20
40
60
80
FCMR
LR
[ s
r ]
R355
=-0.25
SD355
=0.016
R532
=-0.28
SD532
=0.015
y355=-7.11*x+62.16
y532=-7.56*x+52.28
0 0.5 1 1.5 2 2.5 3
0.02
0.04
0.06
0.08
FCMR
PL
DR
R355
=-0.43
SD355
=0.001
R532
=-0.58
SD532
=0.001
y355=-0.01*x+0.03
y532=-0.02*x+0.07
0 0.5 1 1.5 2 2.5 3
0.02
0.04
0.06
0.08
FCMR
PL
DR
R355
=-0.43
SD355
=0.001
R532
=-0.58
SD532
=0.001
y355=-0.01*x+0.03
y532=-0.01*x+0.06
0 0.5 1 1.5 2 2.5 3
0.02
0.04
0.06
0.08
FCMR
PL
DR
R355
=-0.41
SD355
=0.001
R532
=-0.67
SD532
=0.001
y355=-0.01*x+0.03
y532=-0.02*x+0.08
Atmos. Chem. Phys. Discuss., https://doi.org/10.5194/acp-2018-1219Manuscript under review for journal Atmos. Chem. Phys.Discussion started: 30 November 2018c© Author(s) 2018. CC BY 4.0 License.
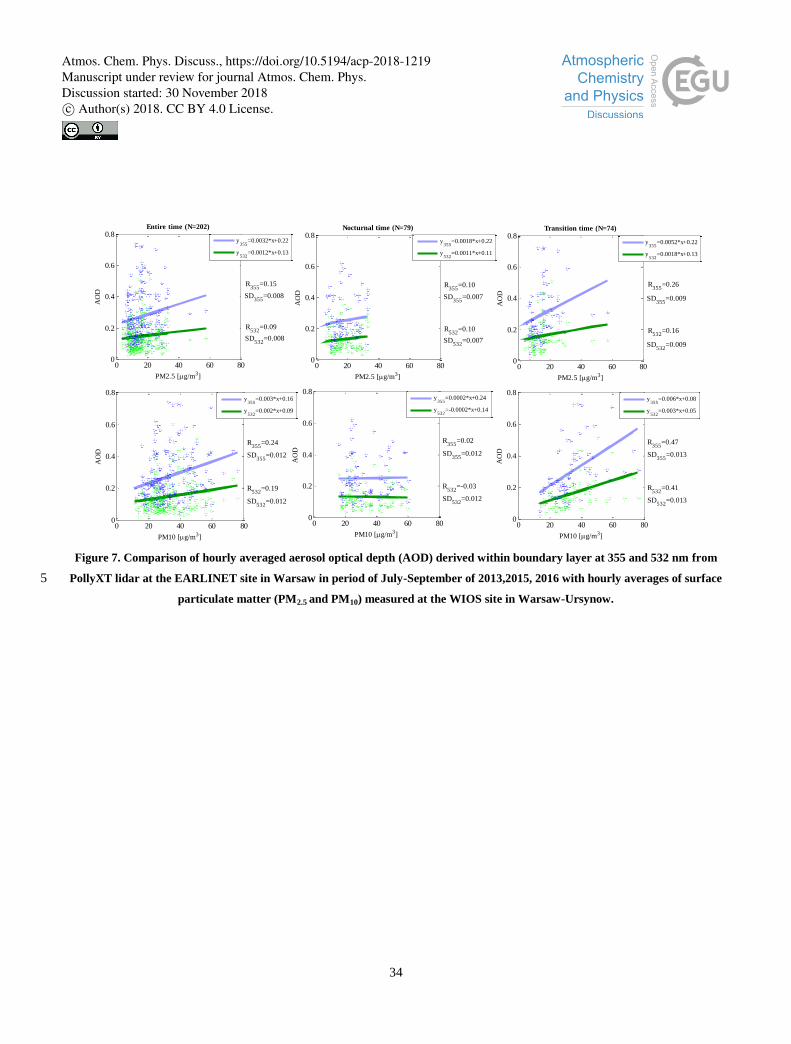
34
Figure 7. Comparison of hourly averaged aerosol optical depth (AOD) derived within boundary layer at 355 and 532 nm from
PollyXT lidar at the EARLINET site in Warsaw in period of July-September of 2013,2015, 2016 with hourly averages of surface 5
particulate matter (PM2.5 and PM10) measured at the WIOS site in Warsaw-Ursynow.
0 20 40 60 800
0.2
0.4
0.6
0.8
PM2.5 [g/m3]
AO
D
Entire time (N=202)
R355
=0.15
SD355
=0.008
R532
=0.09
SD532
=0.008
y355
=0.0032*x+0.22
y532
=0.0012*x+0.13
0 20 40 60 800
0.2
0.4
0.6
0.8
PM2.5 [g/m3]
AO
D
Nocturnal time (N=79)
R355
=0.10
SD355
=0.007
R532
=0.10
SD532
=0.007
y355
=0.0018*x+0.22
y532
=0.0011*x+0.11
0 20 40 60 800
0.2
0.4
0.6
0.8
PM2.5 [g/m3]
AO
D
Transition time (N=74)
R355
=0.26
SD355
=0.009
R532
=0.16
SD532
=0.009
y355
=0.0052*x+0.22
y532
=0.0018*x+0.13
0 20 40 60 800
0.2
0.4
0.6
0.8
PM10 [g/m3]
AO
D
R355
=0.24
SD355
=0.012
R532
=0.19
SD532
=0.012
y355
=0.003*x+0.16
y532
=0.002*x+0.09
0 20 40 60 800
0.2
0.4
0.6
0.8
PM10 [g/m3]
AO
D
R355
=0.02
SD355
=0.012
R532
=-0.03
SD532
=0.012
y355
=0.0002*x+0.24
y532
=-0.0002*x+0.14
0 20 40 60 800
0.2
0.4
0.6
0.8
PM10 [g/m3]
AO
D
R355
=0.47
SD355
=0.013
R532
=0.41
SD532
=0.013
y355
=0.006*x+0.08
y532
=0.003*x+0.05
Atmos. Chem. Phys. Discuss., https://doi.org/10.5194/acp-2018-1219Manuscript under review for journal Atmos. Chem. Phys.Discussion started: 30 November 2018c© Author(s) 2018. CC BY 4.0 License.

35
Figure 8. Comparison of hourly averaged aerosol optical depth (AOD), Ångstrom exponent (ÅE), and lidar ratio (LR) derived
within boundary layer at 355 and 532 nm from PollyXT lidar at the EARLINET site in Warsaw in period of July-September of 5
2013,2015, 2016. The correlation of linear particle depolarization ratio (PLDR) and lidar ratio was of 0.01~0.04, not shown for
brevity.
20 40 60 800
0.2
0.4
0.6
0.8
LR [ sr ]
AO
D
Entire time (N=202)
R355
=0.56
SD355
=0.02
R532
=0.60
SD532
=0.02
y355
=0.008*x-0.037
y532
=0.004*x-0.016
20 40 60 800
0.2
0.4
0.6
0.8
LR [ sr ]
AO
D
Nocturnal time (N=79)
R355
=0.73
SD355
=0.01
R532
=0.79
SD532
=0.01
y355
=0.008*x-0.099
y532
=0.005*x-0.044
20 40 60 800
0.2
0.4
0.6
0.8
LR [ sr ]
AO
D
Transition time (N=74)
R355
=0.40
SD355
=0.02
R532
=0.44
SD532
=0.01
y355
=0.005*x+0.045
y532
=0.003*x+0.025
20 40 60 800
0.5
1
1.5
2
2.5
3
LR [ sr ]
AE
R355
=-0.26
SD355
=0.02
R532
=-0.58
SD532
=0.02
y355
=-0.008*x+2.025
y532
=-0.017*x+2.353
20 40 60 800
0.5
1
1.5
2
2.5
3
LR [ sr ]
AE
R355
=-0.35
SD355
=0.01
R532
=-0.62
SD532
=0.01
y355
=-0.012*x+2.291
y532
=-0.019*x+2.489
20 40 60 800
0.5
1
1.5
2
2.5
3
LR [ sr ]
AE
R355
=-0.21
SD355
=0.02
R532
=-0.55
SD532
=0.02
y355
=-0.006*x+1.964
y532
=-0.016*x+2.364
Atmos. Chem. Phys. Discuss., https://doi.org/10.5194/acp-2018-1219Manuscript under review for journal Atmos. Chem. Phys.Discussion started: 30 November 2018c© Author(s) 2018. CC BY 4.0 License.

36
Figure 9. Comparison of the hourly averaged near-surface relative humidity (RH) measured by the weather transmitter WXT510
(Vaisala) in Warsaw in period of July-September of 2013,2015, 2016 with the hourly averages of surface particulate matter PM2.5 5
and PM10 measured at the WIOS site in Warsaw-Ursynow.
0 20 40 60 8020
30
40
50
60
70
80
90
PM2.5 and PM10 [g/m3]
RH
[ %
]
Entire time (N=192)
RPM2.5
=0.33
SDPM2.5
=0.013
RPM10
=-0.07
SDPM10
=0.018
yPM2.5
=0.64*x+42.83
yPM10
=-0.08*x+55.13
0 20 40 60 8020
30
40
50
60
70
80
90
PM2.5 and PM10 [g/m3]
RH
[ %
]
Nocturnal time (N=69)
RPM2.5
=0.10
SDPM2.5
=0.012
RPM10
=-0.20
SDPM10
=0.018
yPM2.5
=0.14*x+58.05
yPM10
=-0.17*x+65.99
0 20 40 60 8020
30
40
50
60
70
80
90
PM2.5 and PM10 [g/m3]
RH
[ %
]
Transition time (N=65)
RPM2.5
=0.24
SDPM2.5
=0.012
RPM10
=-0.40
SDPM10
=0.017
yPM2.5
=0.59*x+37.06
yPM10
=-0.58*x+60.80
0 0.5 1 1.5 2 2.5 320
30
40
50
60
70
80
90
FCMR
RH
[ %
]
R=0.67
SD=0.013
y=14.38*x+37.38
0 0.5 1 1.5 2 2.5 320
30
40
50
60
70
80
90
FCMR
RH
[ %
]
R=0.58
SD=0.01
y=8.96*x+49.15
0 0.5 1 1.5 2 2.5 320
30
40
50
60
70
80
90
FCMR
RH
[ %
]
R=0.72
SD=0.012
y=17.48*x+29.48
Atmos. Chem. Phys. Discuss., https://doi.org/10.5194/acp-2018-1219Manuscript under review for journal Atmos. Chem. Phys.Discussion started: 30 November 2018c© Author(s) 2018. CC BY 4.0 License.
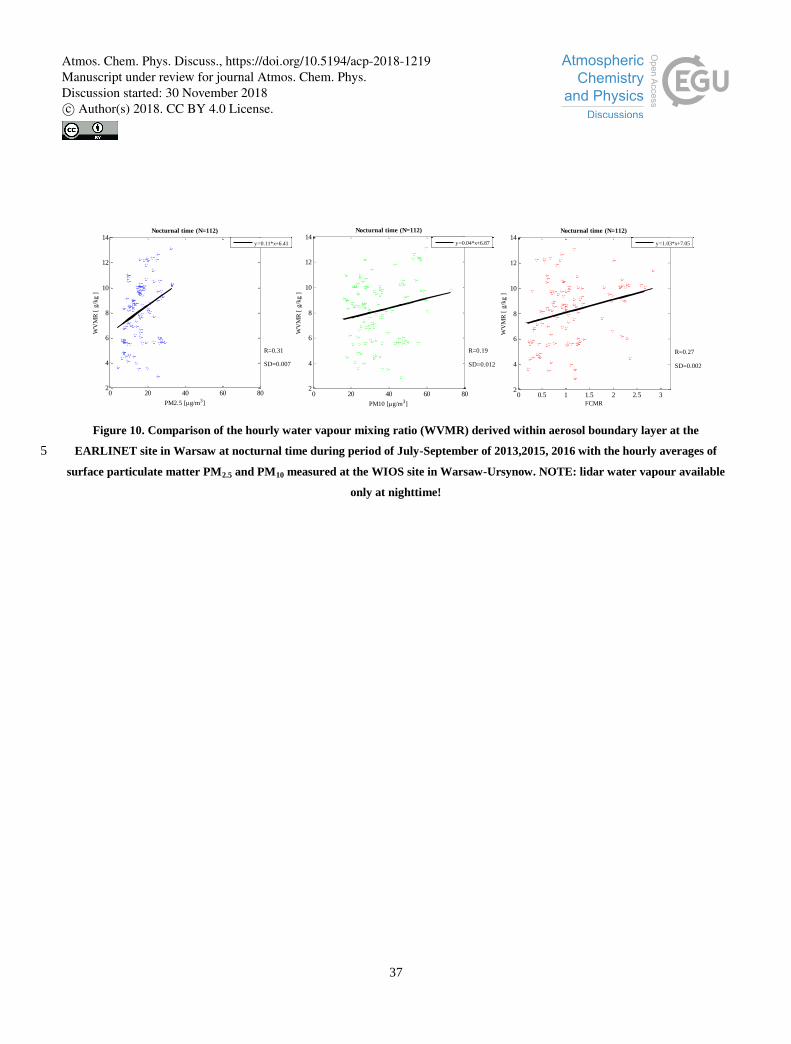
37
Figure 10. Comparison of the hourly water vapour mixing ratio (WVMR) derived within aerosol boundary layer at the
EARLINET site in Warsaw at nocturnal time during period of July-September of 2013,2015, 2016 with the hourly averages of 5
surface particulate matter PM2.5 and PM10 measured at the WIOS site in Warsaw-Ursynow. NOTE: lidar water vapour available
only at nighttime!
0 20 40 60 802
4
6
8
10
12
14
PM2.5 [g/m3]
WV
MR
[ g
/kg ]
Nocturnal time (N=112)
R=0.31
SD=0.007
y=0.11*x+6.41
0 20 40 60 802
4
6
8
10
12
14
PM10 [g/m3]
WV
MR
[ g
/kg ]
Nocturnal time (N=112)
R=0.19
SD=0.012
y=0.04*x+6.87
0 0.5 1 1.5 2 2.5 32
4
6
8
10
12
14
FCMR
WV
MR
[ g
/kg ]
Nocturnal time (N=112)
R=0.27
SD=0.002
y=1.03*x+7.05
Atmos. Chem. Phys. Discuss., https://doi.org/10.5194/acp-2018-1219Manuscript under review for journal Atmos. Chem. Phys.Discussion started: 30 November 2018c© Author(s) 2018. CC BY 4.0 License.
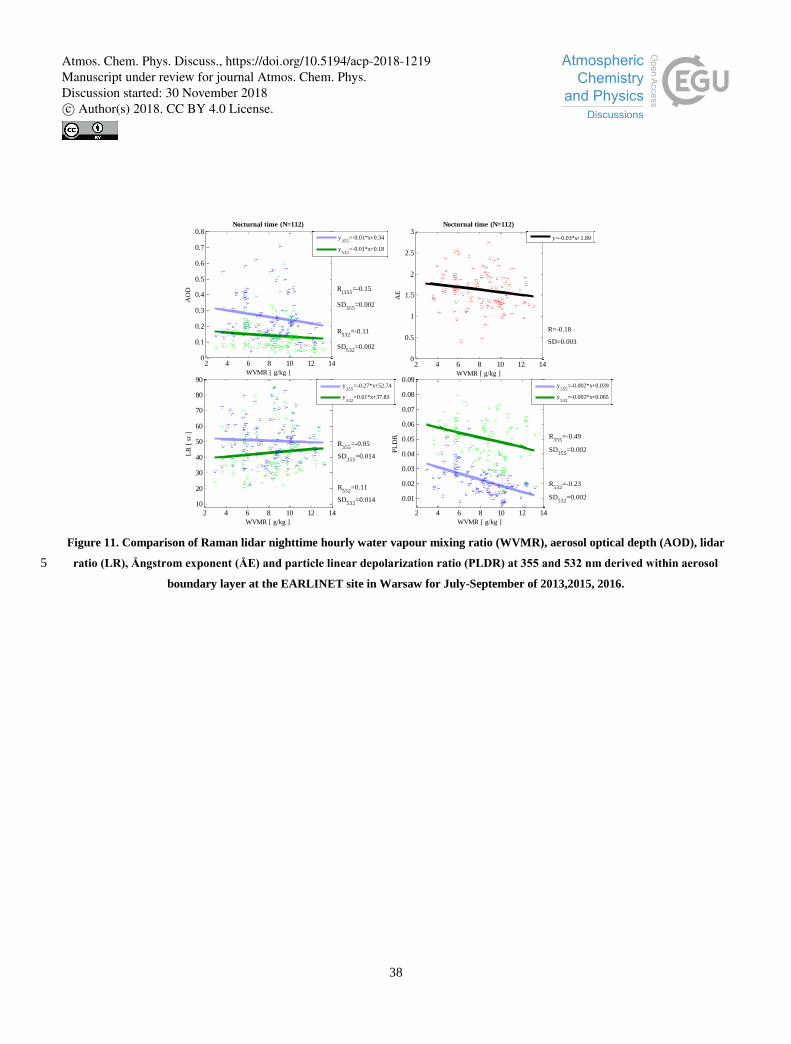
38
Figure 11. Comparison of Raman lidar nighttime hourly water vapour mixing ratio (WVMR), aerosol optical depth (AOD), lidar
ratio (LR), Ångstrom exponent (ÅE) and particle linear depolarization ratio (PLDR) at 355 and 532 nm derived within aerosol 5
boundary layer at the EARLINET site in Warsaw for July-September of 2013,2015, 2016.
2 4 6 8 10 12 140
0.1
0.2
0.3
0.4
0.5
0.6
0.7
0.8
WVMR [ g/kg ]
AO
D
Nocturnal time (N=112)
R(355
=-0.15
SD355
=0.002
R532
=-0.11
SD532
=0.002
y355
=-0.01*x+0.34
y532
=-0.01*x+0.18
2 4 6 8 10 12 140
0.5
1
1.5
2
2.5
3
WVMR [ g/kg ]
AE
Nocturnal time (N=112)
R=-0.18
SD=0.003
y=-0.03*x+1.89
2 4 6 8 10 12 14
10
20
30
40
50
60
70
80
90
WVMR [ g/kg ]
LR
[ s
r ]
R355
=-0.05
SD355
=0.014
R532
=0.11
SD532
=0.014
y355
=-0.27*x+52.74
y532
=0.61*x+37.83
2 4 6 8 10 12 14
0.01
0.02
0.03
0.04
0.05
0.06
0.07
0.08
0.09
WVMR [ g/kg ]
PL
DR
R355
=-0.49
SD355
=0.002
R532
=-0.23
SD532
=0.002
y355
=-0.002*x+0.039
y532
=-0.002*x+0.065
Atmos. Chem. Phys. Discuss., https://doi.org/10.5194/acp-2018-1219Manuscript under review for journal Atmos. Chem. Phys.Discussion started: 30 November 2018c© Author(s) 2018. CC BY 4.0 License.