Interpreting NMR Spectra CHEM 318. Introduction You should read the assigned pages in your text...
27
Interpreting NMR Spectra CHEM 318
-
Upload
kathlyn-carter -
Category
Documents
-
view
213 -
download
0
Transcript of Interpreting NMR Spectra CHEM 318. Introduction You should read the assigned pages in your text...

Interpreting NMR Spectra
CHEM 318

Introduction
• You should read the assigned pages in your text (either Pavia or Solomons) for a detailed description of NMR theory and instrumentation.
• This presentation will focus on interpreting 1H and 13C NMR spectra to deduce the structure of organic compounds.
• Here is a reminder of some important points and vocabulary:

Introduction
• Atomic isotopes with either an odd number of protons or neutrons possess a spin angular momentum (1H, 13C, and 15N but not 12C and 16O).
• The positively charged nuclei generate a small electric current and thus also generate an associated magnetic field.
• When the nuclei are placed in an external magnetic field, their magnetic spins align either with the external field (lower energy) or against it (higher energy).
Introduction
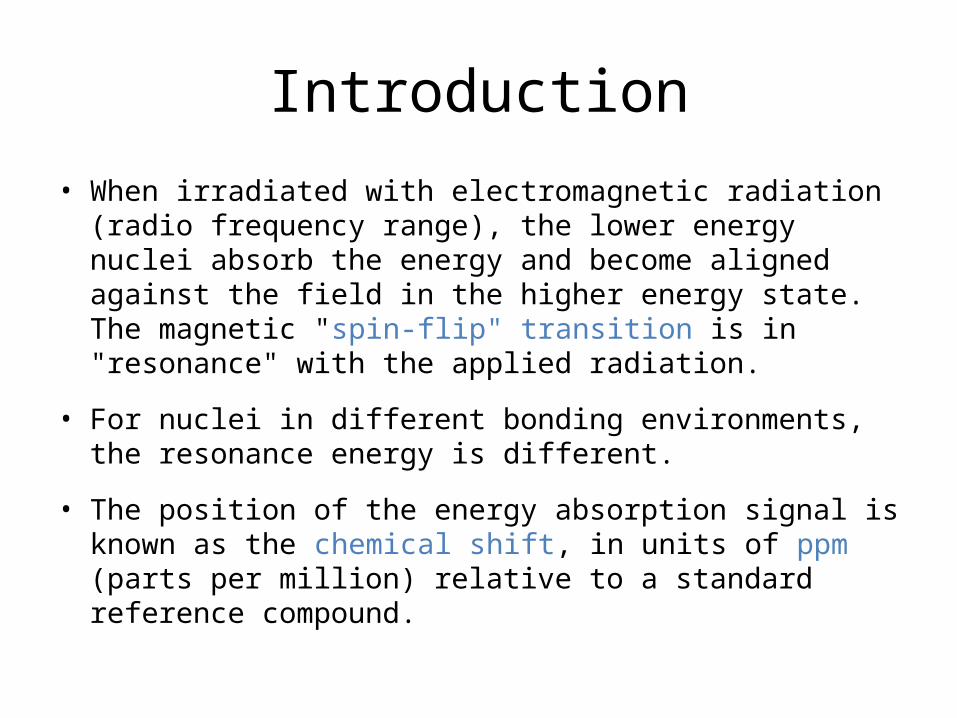
• When irradiated with electromagnetic radiation (radio frequency range), the lower energy nuclei absorb the energy and become aligned against the field in the higher energy state. The magnetic "spin-flip" transition is in "resonance" with the applied radiation.
• For nuclei in different bonding environments, the resonance energy is different.
• The position of the energy absorption signal is known as the chemical shift, in units of ppm (parts per million) relative to a standard reference compound.

Introduction
• Most carbons are the 12C6 isotope – 6 protons and 6 neutrons in the nucleus. ~ 1.1% of carbons are the 13C6 isotope with an extra neutron. With this odd number of nucleons, the 13C6 atoms can give rise to an NMR signal.
• Most hydrogens are the 1H1 isotope – 1 proton in the nucleus and no neutrons. The hydrogen atom thus has an odd number of nucleons and can produce an NMR signal.

13C NMR Spectroscopy
• Information obtained from a 13C NMR spectrum:
– the number of resonance signals denotes the number of different carbon atoms present
– the chemical shift reveals the electronic bonding environment of the carbons
– signal splitting gives the number of hydrogens bonded to each carbon

13C NMR Spectroscopy• The range of chemical shifts is about 0-220 ppm. • Saturated carbon atoms absorb upfield (lower ppm) relative
to unsaturated carbons (downfield at higher ppm).• Electron-withdrawing atoms cause a downfield shift
– compare shifts of –CH2– with –CH-O– and C=C with C=O

HexaneCH3
CH3
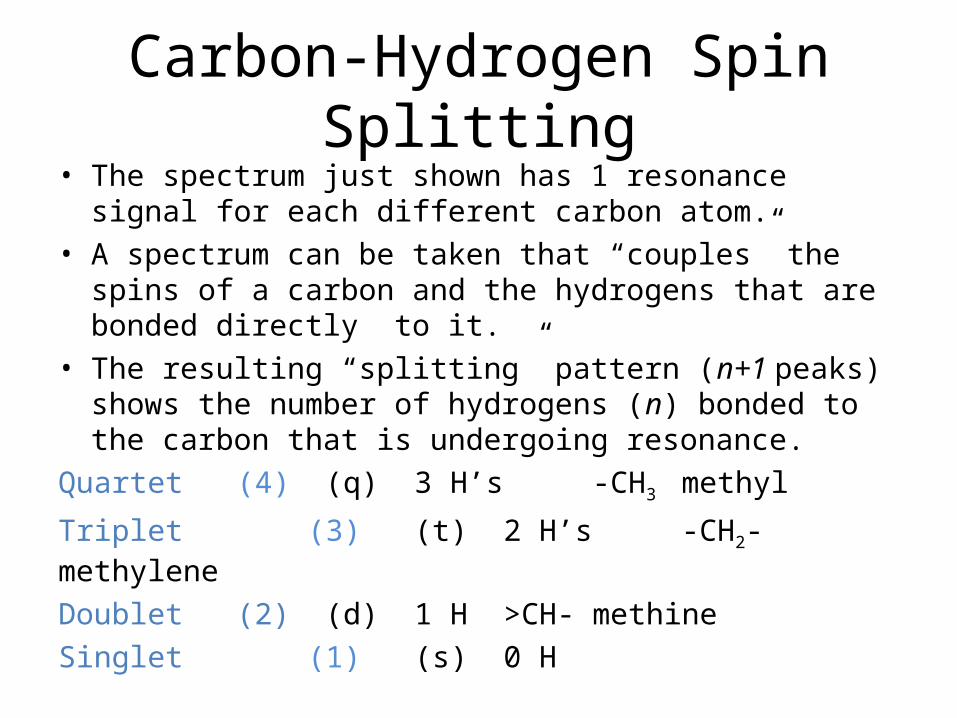
Carbon-Hydrogen Spin Splitting• The spectrum just shown has 1 resonance signal for each
different carbon atom.• A spectrum can be taken that “couples” the spins of a carbon
and the hydrogens that are bonded directly to it.• The resulting “splitting” pattern (n+1 peaks) shows the
number of hydrogens (n) bonded to the carbon that is undergoing resonance.
Quartet (4) (q) 3 H’s -CH3 methyl
Triplet (3) (t) 2 H’s -CH2- methylene
Doublet (2) (d) 1 H >CH- methineSinglet (1) (s) 0 H
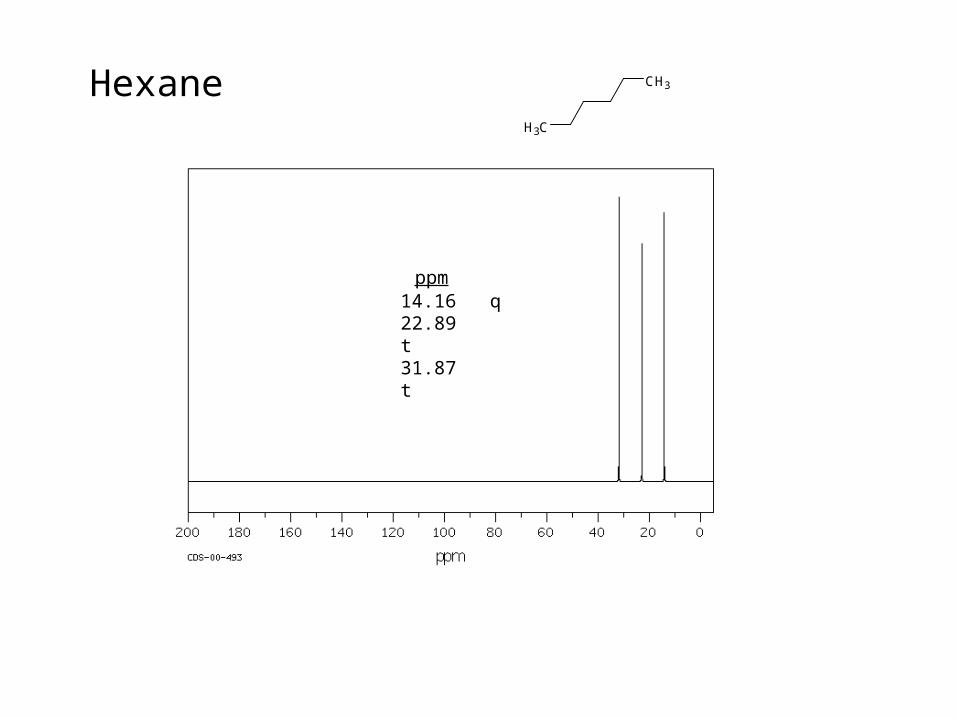
HexaneCH3
CH3
ppm 14.16 q22.89 t31.87 t

2,2-DimethylbutaneCH3
CH3
CH3CH3

2,2-DimethylbutaneCH3
CH3
CH3CH3
ppm 8.88 q 28.96 q30.42 s
36.49 t

AcetaldehydeCH3
O
H

Ethyl propionateCH3
O
O
CH3
ppm174.40 s 60.26 t 27.71 t 14.32 q 9.19 q

ortho-XyleneCH3CH3
H
H H
H

1-ButyneCH3
H
ppm 85.96 d 71.94 s 13.81 q 12.27 t

1H NMR Spectroscopy
• Information obtained from a 1H NMR spectrum:
– the number of resonance signals denotes the number of different hydrogen atoms present
– the chemical shift reveals the electronic bonding environment of the hydrogens
– integration of the peaks gives the relative number of hydrogens causing the resonance
– signal splitting gives the number of hydrogens bonded to the adjacent atom(s)

1H NMR Spectroscopy• The range of chemical shifts is about 0-12 ppm. • Hydrogens bonded to saturated carbons absorb upfield
relative to hydrogens on unsaturated carbons (downfield).• Electron-withdrawing atoms cause a downfield shift.
– compare >CH – with >CH-O– and compare C=CH with HC=O

1H NMR SpectroscopyChemical shift: There are two resonance peaks, indicating two different kinds
of H’s. The upfield signal is in the saturated C region; the downfield signal is in the unsaturated C region.
CH3

1H NMR SpectroscopyIntegration: The area under the peak is proportional to the number of
hydrogens causing the absorbance.
CH3
After integration and rounding to small whole numbers, the peak area ratio is 5:3.

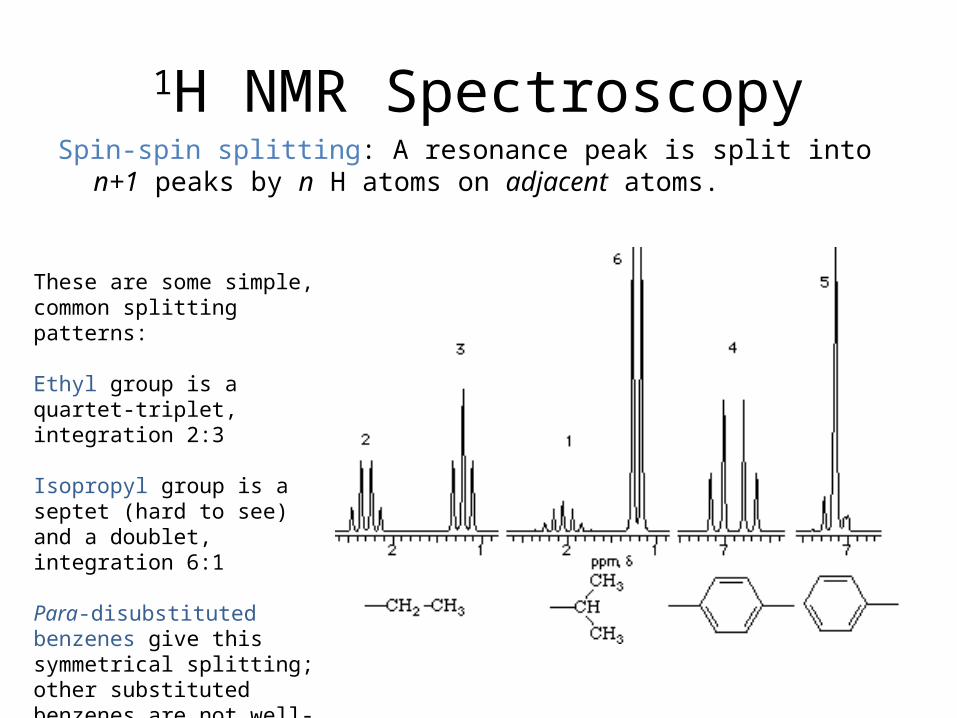
1H NMR SpectroscopySpin-spin splitting: A resonance peak is split into n+1 peaks by n H atoms on
adjacent atoms.
CH3 CH2
IIntegration: 2:3
The CH3 resonance (1.8 ppm) is split by the neighboring CH2.
There are n=2 neighboring H’s and so the methyl resonance is split into n+1=3 peaks – a triplet.
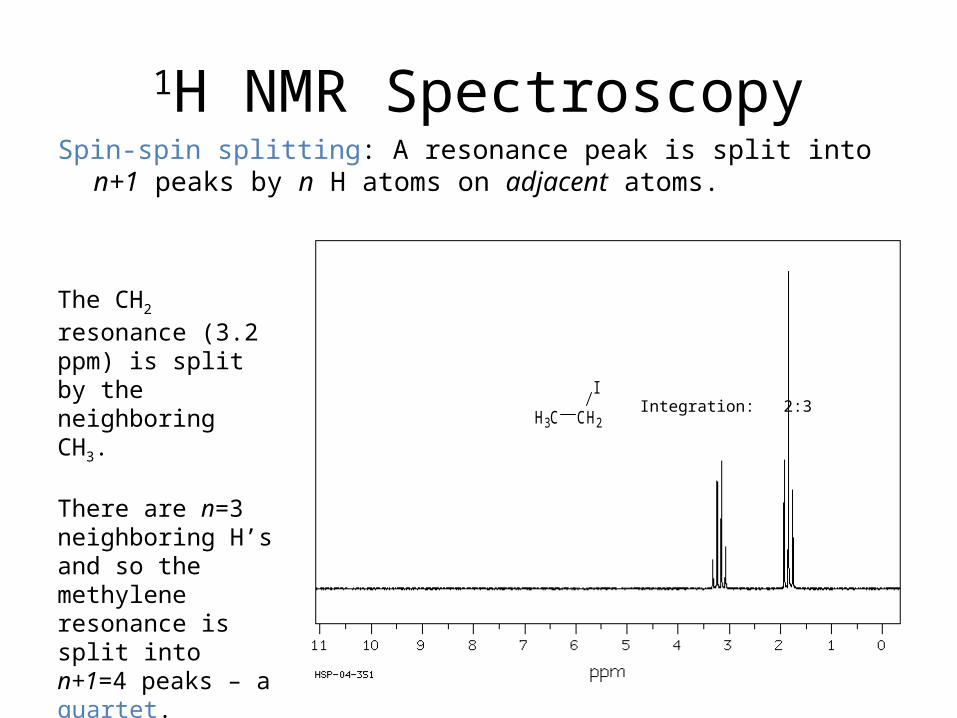
1H NMR SpectroscopySpin-spin splitting: A resonance peak is split into n+1 peaks by n H atoms on
adjacent atoms.
CH3 CH2
IIntegration: 2:3
The CH2 resonance (3.2 ppm) is split by the neighboring CH3.
There are n=3 neighboring H’s and so the methylene resonance is split into n+1=4 peaks – a quartet.
1H NMR SpectroscopySpin-spin splitting: A resonance peak is split into n+1 peaks by n H atoms on
adjacent atoms.
These are some simple, common splitting patterns:
Ethyl group is a quartet-triplet, integration 2:3
Isopropyl group is a septet (hard to see) and a doublet, integration 6:1
Para-disubstituted benzenes give this symmetrical splitting; other substituted benzenes are not well-resolved. Relative integrations are shown.
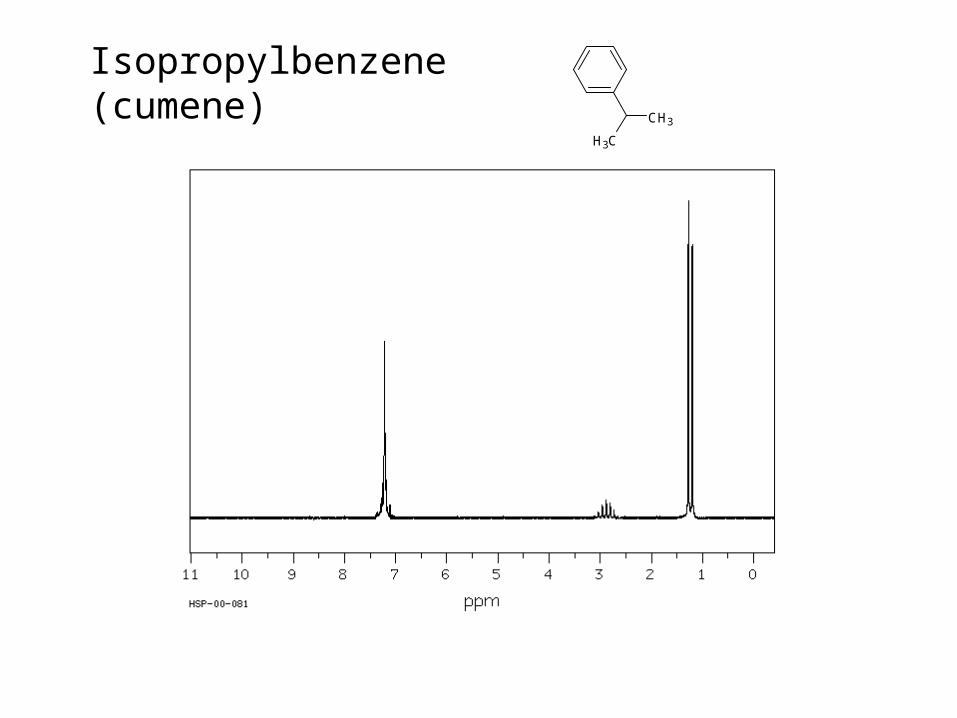
Isopropylbenzene (cumene)CH3
CH3

Propanoic acidCH3 CH2 C
O
OH
25

Acetaldehyde (ethanal)
26
CH3
O
H
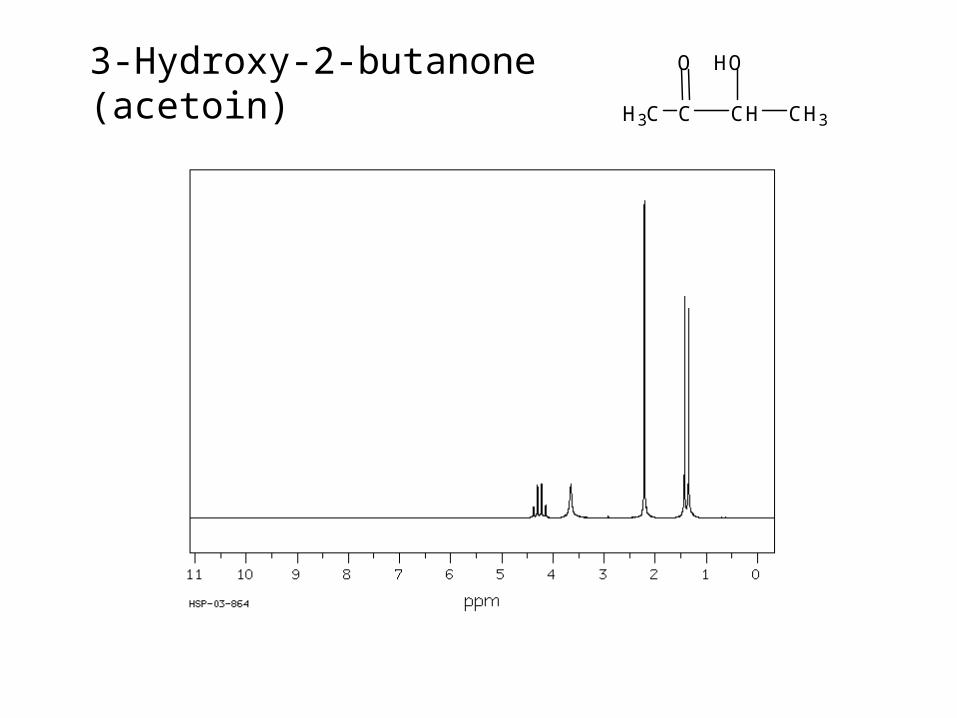
3-Hydroxy-2-butanone (acetoin)CH3 C CH CH3
OHO