Interpreting graphs and tables with cognitive tools
324
University of Wollongong Thesis Collections University of Wollongong Thesis Collection University of Wollongong Year Interpreting graphs and tables with cognitive tools Brian Ferry University of Wollongong Ferry, Brian, Interpreting graphs and tables with cognitive tools, Doctor of Philosophy thesis, Faculty of Education, University of Wollongong, 1997. http://ro.uow.edu.au/theses/1780 This paper is posted at Research Online.
Transcript of Interpreting graphs and tables with cognitive tools

University of Wollongong Thesis Collections
University of Wollongong Thesis Collection
University of Wollongong Year
Interpreting graphs and tables with
cognitive tools
Brian FerryUniversity of Wollongong
Ferry, Brian, Interpreting graphs and tables with cognitive tools, Doctor of Philosophy thesis,Faculty of Education, University of Wollongong, 1997. http://ro.uow.edu.au/theses/1780
This paper is posted at Research Online.


Interpreting graphs and tables with cognitive tools
A Thesis submitted in fulfilment of the requirements for the award of the
degree of Doctor of Philosophy (PhD)
from
The University of WoUongong
by
Brian Ferry
B.A., M. Stud. Ed., M. Ed. (Hons.)
Faculty of Education
1997

Declaration
I certify that this is my original work and that it has not been submitted for a degree at any other university or institution.
Brian Ferry 24.3.97

u
Acknowledgments
I wish to acknowledge the guidance, encouragement and support provided by my supervisors, Associate Professor Barry Harper and Associate Professor John Hedberg.
There are always many others to thank during a project such as this. First, I would like to thank the preservice teachers who took part in this study. Second, I would like to thank Sean Cmickshank, Peter Gracie, Matthew Fifield and Rob Wright for their technical assistance. Also I wish thank my colleagues Christine Brown and Peter Keeble who have provided valuable input at various stages of this study.
Last, but certainly not least, I wish to thank my family Chris, Michelle and Belinda for putting up with the constant talk about this study and the long periods of time that I spent working on this project.

m
Abstract This study explores some ways in which cognitive tools may be used to assist learners to
interpret graphs and tables. It investigates ways in which concept mapping tools may be
applied to this task, and then it investigates how preservice teachers used a suite of simple
cognitive tools designed to reduce cognitive load. All cognitive tools were developed
with HyperCard"™ software and these tools were used by preservice teachers (the
subjects of this study).
The thesis is divided into three linked studies. Study 1 investigated the cognitive
strategies employed by preservice teachers when they interpreted graphs and tables. The
findings were then used to guide the design of the cognitive tools that were used in Study
2.
During Study 1 the ability of various groups of preservice teacher to interpret graphs and
tables were compared. The findings showed that when these learners interpreted graphs
and tables they had difficulties with understanding the context as described by the
accompanying text, sorting and comparing relevant data in tables, and identifying specific
global (eg. slope, tuming points, discontinuities) and local features (eg. labels on axes,
points on graphs) that were relevant.
During Study 2 a prototype of the cognitive tools was developed and trialled. These tools
were designed to assist leamers to interpret information in form of text, graphs and tables
that related to the destmction of rainforests. During Study 3 the improved cognitive
tools were used by 80 preservice teachers. Interviews, artefacts and tracking data were
gathered and used to evaluate the tools.
The findings from all data sources suggest that there are procedures that we should
employ to effectively introduce leamers to cognitive support tools, as it is not just a
matter of designing a suitable tool and then handing it over to the learner to use. Analysis
of the concept maps and interview transcripts showed that the leamers used one of three
strategies to constmct their concept maps, but in most cases there was little difference in
the quality of the final map produced. It appears that one strength of the concept mapping
tool was that it helps leamers to visually organise knowledge in different ways. Also the
other cognitive tools may have acted as mental devices that supported, guided and
extended the thinking processes of leamers.

IV
Contents Chapter 1: Introduction 1
The problem 2 Definitions of important terms used in the study 4
Tables and graphs 4 Interpreting graphs and tables 5 Cognitive tools 9 Concepts 10 Concept map 10
Purpose of the study 11 Theoretical perspective 12 The cognitive tools 13 Research questions and strategies 15 Brief discussion of the research questions 16 Data sources and research strategies 18 The subjects 19 Limitations 20 Significance of the study 20
OutUne of the stmcture of the remainder of the thesis 21 Chapter 2: Supporting Educational Theory 24
Part 1: Relevant theoretical models of learning 24 Guidance from educational theory 27
Part 1: Summary 43 Part 2 : Learner processing of information in graphs and tables 44
Features of cognitive tools that support leamer processing of information 44 Strategies that help leamers to process information 45 Additional strategies that help leamers to process information 64
Applying the research to educational settings 77 The design and presentation of cognitive tools that facilitate leamer processing of information 79 Evaluation of cognitive tools that facilitate leamer processing of information 81
Part 2: Summary 81 Chapter 3 Leamer Interpretation of Graphs and Tables 83
Part 1: Relevant research relating to the interpretation of graphs and tables 83
The use of graphs and tables to support learning 86 Research related to the instmctional effectiveness of graphs and tables 91
Part 1: Summary 101 Part 2: Applying the findings from Chapters 2 and 3 102
Layout and buttons 103 Specific cognitive tools 104
Chapter 4: Methodology-Overview of the three research studies 108 Study 1: Describing leamer interpretation graphs and tables i l l Study 2: Development and evaluation of the prototype 112 Study 3: Researching use of the improved cognitive tools 112
Chapter 5: Study 1- Leamer background and strategies as factors affecting their ability to interpret graphs and tables 113
Research questions and hypotheses 113 Methodology 115
Mathematics and science backgrounds of the preservice primary teachers 117 Variables investigated in this study 119 Measuring leamer ability in interpreting graphs and tables 121 Analysis of graphs and tables test 122

Results - Study 1 122 The interviews with the seven preservice teachers 127
Chapter 6: Study 2-Development and evaluation of the prototype 141 Methodology - Study 2 142
Research questions - Study 2 142 Variables selected during Study 2 144 Analysis of concept maps 146 Analysis of the quantitative data gathered 149 Data from journal entries and interviews 150 Development of tools to support cognitive outcomes 151 Development of cognitive tools used in the rainforest prototype 154 Experimental procedure for Study 2 157 Use of all cognitive tools 160
Results for Study 2: Leamer use of the prototypes of the cognitive tools 160 Use of cognitive tools that helped leamers to analyse rainforest data 166 Summary of Study 2: Use of the prototypes of the cognitive tools 171
Chapter 7: Study 3-Use of the concept mapping and information handling cognitive tools 177
Research questions and hypotheses - Study 3 180 Experimental procedure-Study 3 182 Results from Study 3: Researching use of the improved cognitive tools 183
Use of the improved concept mapping tool 183 Use of the improved cognitive tools that assisted leamers to analyse graphs and tables 208 Summary 234
Chapter 8: Discussion and Conclusion 237 Learner interpretation of graphs and tables 237 Introducing learners to cognitive tools 242 The impact of cognitive tools upon leamers 248 Conclusion 257
Investigating leamer interpretation graphs and tables 258 How to introduce leamers to cognitive tools 258 Leamer use of cognitive tools 259 Leamer constraction of knowledge with cognitive tools 260
Appendices 286 Appendix 1: Plate displaying graphs by William Playfair (1801) 287 Appendix 2: Multiple choice test on Graphs and Tables 288 Appendix 3: Skills grid for multiple choice test on Graphs and
Tables 314 Appendix 4: Attitude to computers questionnaire 316 Appendix 5: Learning style inventory 318 Appendix 6: Journal questions used with prototype 319 Appendix 7: Interview questions used witii preservice teachers
who used the final version of the concept map 320 Appendix 8: Interview questions used with preservice teachers
who used the analysis tools with the information about rainforest destruction 320
Appendix 9: Sample interview transcripts 321 Appendix 10: Preservice teacher concept maps revised away from
the computer 327 Appendix 11: Concept mapping software 329 Appendix 12: Web sites for concept mapping software 330 Appendix 13: Permission documents and other relevant
information 331

VI
Figures Figure 1.1 A model of leamer interpretation of information contained text, 7
graphs and tables
Figure 1.2 A simple concept map (after White and Gunstone, 1992) 11
Figure 2.1 An information processing model of human performance 35 (Romiszowski, 1990)
Figure 2.2 A model of the stmcture of human memory (after Gagne, 1987) 46
Figure 2.3 A holistic model of leaming (after Camboume, 1988) 55
Figure 2.4 A model of classroom literacy (after Camboume, 1995) 56
Figure 2.5 The design of the concept mapping tool 61
Figure 2.6 Components of metacognition 66
Figure 2.7 The four quadrants of Kolb's Leaming Style Inventory 74
Figure 3.1 Dale's Cone of Experience (1969) 84
Figure 3.2 A schematic diagram of the cognitive demands associated with 85 various forms of information presentation
Figure 3.3 A model of the processes involved in interpreting graphs (after 94 Janvier, 1978)
Figure 3.4 The original plans for the cognitive tools 103
Figure 4.1 An annotated flow chart of the study 109
Figure 4.2 Summary of the studies 110
Figure 6.1 A simple concept map used to show how the marking scheme 147 was applied (after White and Gunstone, 1992)
Figure 6.2 A plan of the opening screen of the prototype 151
Figure 6.3 The original six buttons on the concept tools palette 152
Figure 6.4 A concept map in the process of creation with the prototype 154
Figure 6.5 The opening screen of the prototype of the support system to 155 assist leamers to interpret graphs and tables
Figure 6.6 The screen used to support the interpretation of tables 156
Figure 6.7 The screen used to support the interpretation of graphs 157
Figure 6.8 The redesigned palette of concept map constraction tools 174
Figure 7.1 The revised opening screen 178
Figure 7.2 The revised concept mapping tool 178
Figure 7.3 The revised display of tabular information 179
Figure 7.4 The revised balloon help for the graphs 180
Figure 7.5 Sally's concept map 192
Figure 7.6 Mary's concept map 193
Figure 7.7 Kerry W's concept map 194

vu
Figure 7.8 Adele's concept map undergoing modification 199
Figure 7.9 Barbara's first map 200
Figure 7.10 Barbara's second map 201
Figure 7.11 The four quadrants associated with Kolb's theory of experiential 213 leaming
Figure 7.12 A text screen showing words that were linked to a simple 217 glossary
Figure 8.1 Kolb's model of leaming 247
VUl
Table 2.1
Table 2.2
Table 3.1
Table 3.2
Table 5.1
Table 5.2
Table 5.3
Table 5.4
Table 5.5
Table 5.6
Table 5.7
Table 5.8
Table 5.9
Table 5.10
Table 5.11
Table 5.12
Table 5.13
Table 5.14
Table 5.15
Table 6.1
Table 6.2
Table 6.3
Table 6.4
Table 6.5
Table 6.6
Table 7.1
Table 7.2
Table 7.3
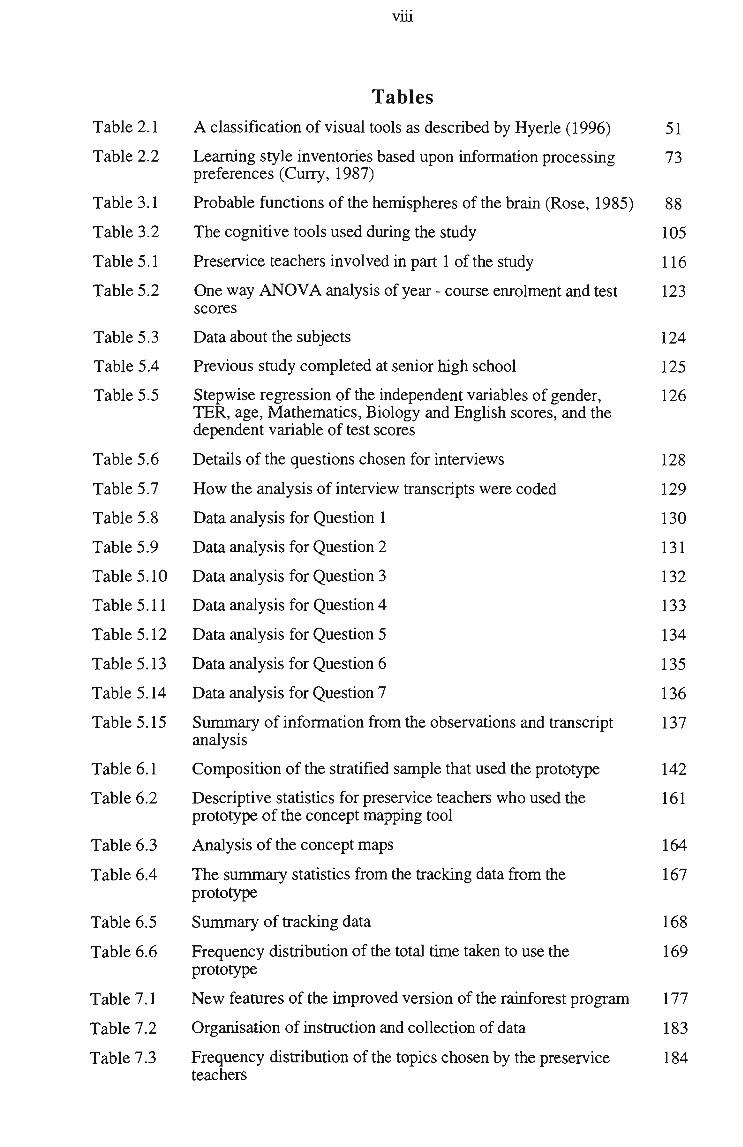
Tables A classification of visual tools as described by Hyerle (1996) 51
Leaming style inventories based upon information processing 73 preferences (Curry, 1987)
Probable functions of the hemispheres of the brain (Rose, 1985) 88
The cognitive tools used during the study 105
Preservice teachers involved in part 1 of the study 116
One way ANOVA analysis of year - course enrolment and test 123 scores
Data about the subjects 124
Previous study completed at senior high school 125
Stepwise regression of the independent variables of gender, 126 TER, age. Mathematics, Biology and English scores, and the dependent variable of test scores
Details of the questions chosen for interviews 128
How the analysis of interview transcripts were coded 129
Data analysis for Question 1 130
Data analysis for Question 2 131
Data analysis for Question 3 132
Data analysis for Question 4 133
Data analysis for Question 5 134
Data analysis for Question 6 135
Data analysis for Question 7 136
Summary of information from the observations and transcript 137 analysis
Composition of the stratified sample that used the prototype 142
Descriptive statistics for preservice teachers who used the 161 prototype of the concept mapping tool
Analysis of the concept maps 164
The summary statistics fi:om the tracking data from the 167 prototype
Summary of tracking data 168
Frequency distribution of the total time taken to use the 169 prototype
New features of the improved version of the rainforest program 177
Organisation of instmction and collection of data 183
Frequency distribution of the topics chosen by the preservice 184 teachers

IX
Table 7.4 Frequencies of the most popular topic areas in the first and 185 second concept maps
Table 7.5 Summary statistics for the concept notes and hnk notes 186 associated with concept maps 1 and 2
Table 7.6 Organisation of instmction and data collection 208
Table 7.7 Tracking data showing user access to information 209
Table 7.8 Times spent using the software 209
Table 7.9 Regression analysis for the relationship between frequency 210 (independent variable) and time (dependent variable) for the various sources of information
Table 7.10 Descriptive statistics for age and gender 211
Table 7.11 Responses to survey on attitude to computers 212
Table 7.12 Paired t-test results for subscales 212
Table 7.13 Responses to kolb's leaming style inventory 212
Table 7.14 Preferred leaming style of preservice teachers interviewed and 214 the information sources they preferred to use
Table 7.15 Summary statistics for multiple regression analysis of 215 relationships among variables
Table 7.16 Result of multiple regression analysis of other factors examined 215
Table 7.17 A list of the questions asked 221
Table 7.18 Summary statistics for the concepts displayed on the maps 229
Table 7.19 The location and frequency of the concepts listed by the 230 preservice teachers
Table 7.20 An alphabeticallist of concepts and their frequencies 231
Table 7.21 A synthesis of attributed sources of information used by 233 preservice teachers when they constmcted their concept maps

Chapter 1: Introduction When William Playfair first discussed the use of graphs to represent information he
claimed:
"... I have succeeded in putting into practice a new and useful mode of
accounts,... as much information may be obtained in five minutes as would
require days to imprint on memory, in a lasting manner, by a table of
figures" (Playfair, 1801a, p. 12).
Besides demonstrating the value of graphs and charts for displaying data, Playfair
contributed to the development of new forms of data display which included the
rectihnear coordinate graph, area circle graph, pie diagram and bar chart (Schmidt, 1979).
However, it must be recognised that Playfair's work was preceded by many basic
developments in mathematics such as the work of Rene Descartes (Funkerhouser, 1937).
Since Playfair's time, graphs and tables have become a formally recognised and concise
way of displaying trends in data. The large number of graphs and tables found in
newspapers, magazines, govemment reports and in science, geography and economics
texts show that the authors of these materials think that they are a good way of displaying
data and conveying information (Preece, 1985). Weintraub (1967) asserts that "graphs,
charts and diagrams have assumed an increasing role in our society. They represent
concepts in a concise manner or give at a glance information which would require a great
deal of descriptive writing. They often distil a wealth of information into a small amount
of space" (Weintraub, 1967, p.345). Despite common usage of graphs and tables, many
are not easy to interpret and sometimes they are constracted to be deliberately misleading
in order to support the claims of advertisers and politicians (Huff, 1975; Tufte, 1983).
Whilst graphs and tables may be a convenient way to "distil a wealth of information"
most people who read graphs and tables in newspapers, magazines and books appreciate
that it often requires a great deal of mental effort to interpret the information presented.
Readers who are unable to fully process this "wealth of information", often fail to link it
with other concepts embedded in their semantic network (Janvier & Garancon, 1989;
Janvier, 1978; Preece, 1985). Hence they may not fully understand the issues presented.

In some situations, such as those relating to personal finances and health, accurate
interpretation of information presented in tables and graphs becomes essential for
informed decision-making. At the macro-level, decisions made by leaders of govemment
and business which affect the lives of citizens are often guided by information presented
in graphs and tables. Whilst tables and graphs can be accurate and detailed, there is no
guarantee that the consumers of the information will fully understand it or correctiy apply
it.
The problem
When a learner is confronted with unfamiliar information organised in graphical or
tabular form, (s)he may find that cognitive sttategies that were successful in the past do
not help to process the new information. Reasons for this may relate to:
• leamer prior knowledge: many researchers claim that leamers need help to
link new information with prior knowledge so that it becomes embedded into
existing schema (Clarke, 1992; Gery, 1989; Jonassen, 1988; Hannafin,
1989; Kenny, 1993; Bonner, 1988; Holley & Dansereau, 1984);
• preferred leaming style: researchers suggested that leaming styles influence
the ways in which leamers process information (Dunn, Cavanaugh, Eberle,
& Zenhausem, 1982; Kolb, 1984; Claxton & Hurrell, 1987; De Bello, 1990;
Dunn, Beaudry, Klavas, 1989; Jung, 1993; Jonassen & Grabowiski, 1993;
Schmeck, 1988; Sims & Sims, 1995). Since most leamers have preferred
ways of leaming, then different cognitive (leaming) styles require different
modes of leaming (Romiszowski, 1990; Tyler, 1993; Alhnson & Hammond,
1990; Stanton & Baber, 1992; Jonassen & Grabowiski, 1993);
• the complexity of the presentation of the information. If the presentation of
information is complex, then the essential message becomes lost because
leamer attention is distracted by a display of incomprehensible symbols,
numbers, lines and labels. This effect is know as cognitive load and has
been identified by researchers as a factor that impairs leamer ability to
interpret graphs and tables (Chandler & Sweller, 1991; Sweller, 1994);

• factors that relate to transfer (Salomon & Perkins, 1989): there are numerous
research studies that suggest that learners need help to transfer prior
knowledge to new situation (Mayer, 1980; Weingrad, Hay, Jackson, Boyle,
Guzdial, & Soloway, 1993; Huberman, 1990; De Corte, 1990; Hannafin,
1989). Since there are alternative paths and many different sets of conditions
researchers suggest that transfer may be enhanced when leamers are
provided with a variety of pathways to follow (Salomon & Perkins (1989),
• other variables such as gender, age, and ability in mathematics.
Leamers may find graphs and tables about familiar topics such as the greenhouse effect
more understandable than those relating to the formation of minerals from magmas
because they have more extensive prior knowledge about the topic. Because they
understand the context and the key terms about the greenhouse effect, leamers can relate
this new information to concepts already held in their semantic memory. However, they
are likely to experience difficulty when they are not familiar with the information
presented. In order to help leamers to process less familiar information, we may provide
specific material (eg. a glossary) about the subject and/or assistance such as a semantic
network map or advanced organiser (Ausubel & Youseff, 1963).
On the other hand, there may be leamers who are familiar with the subject matter
presented, but find the organisation of the information difficult to comprehend, because
the explanatory text, graphs and tables use unfamiliar terms, measures and labels. Thus
the essential message becomes lost among a display of incomprehensible terms,
numbers, lines and labels. To overcome this problem we could simplify and reduce the
amount of information displayed, but there is a danger that important details will be lost.
We could also provide the leamer with human tutorial support, but it is not always
feasible to provide a knowledgeable human tutor standing by. Cognitive tools that can be
accessed at the moment of need to help the leamer read labels and sort variables in
numerical order may be an altemative form of assistance.

Definitions of important terms used in the study
In this section a range of definitions for each key term is discussed and then the specific
definition chosen for this study is presented. The key terms discussed are: graphs and
tables, interpreting graphs and tables, cognitive tools, concept, and concept map.
Tables and graphs
Tables, graphs and diagrams have in common the attributes of abstraction and the
exploitation of space (Hegarty, Carpenter, & Just, 1991). However, graphs and tables
differ from diagrams because they illustrate relationships among variables whereas
diagrams describe processes and stmctures (Winn, 1987).
Bertin (1983, p.2) defines graphical representation as "one of the basic sign-systems
conceived by the human mind for the purpose of storing, understanding, and
communicating essential information". Like Playfair (1801b), Bertin also believes that
"graphics owes its special significance to its double fiinction as a storage mechanism and
a research tool" (p.2). Thus graphics have been regarded for almost two centuries as
rational and efficient tools that can be used to present large amounts of information. This
broad definition also includes "the fields of networks, diagrams and maps" (p.2). Fields
of networks are often described as two dimensional arrangements of words, some of
which are joined with lines; diagrams are often described as labelled drawings that are
used to convey information about ideas, objects, or processes; and maps are often
described as labelled representations of space that can be used to locate one's position or
to navigate from one location to another. For the purposes of this study it is important
that graphs and tables are clearly identified as separate entities.
Schmidt (1979) describes graphs and charts as presentations "of quantitative data in a
simple clear and effective manner and facilitate comparison of values, trends, and
relationships " (Schmidt, 1979, p. 10). He asserted that:
• "the use of graphs and charts saves time since the essential meaning of large
masses of a statistical data can be visuahsed at a single glance" (p.2);
• visual relationships are more easily portrayed and remembered;

• they "provide a comprehensive picture of a problem that makes possible a
more complete picture and better-balanced understanding than could be
derived from tabular or texmral forms of representation" (p.2);
• they "can bring out hidden facts and relationships and can stimulate, as well
as aid, analytical thinking and investigation" (p.2).
Frances Curcio (1989) concurs with Schmit's assertions about the advantages of
displaying data in the form of graphs and charts. She considers graphs to be an aid for
clarifying, organising, and summarising quantitative information.
At times the terms graphs and charts may be used as synonyms and this can lead to
confusion. For example, authors describe both bar charts (Schmidt, 1979) and bar
graphs (Curcio, 1989, p.3); yet in the context in which they are described they represent
the same type of display. Others interchange the terms (Hegarty et al., 1991, p.645).
To avoid any confusion during this study graphs are defined as "forms that illustrate
relationships among variables, at least one of which is continuous." (Winn, 1987,
p.153). Thus a plot of height with age and a histogram of stream velocity with sediment
sizes, and a plot of rainforest area against the name of a country are all graphs.
There is less confusion associated with the term tables and the definition that follows
contains the essential elements mentioned by authors in the field (Huff, 1975; Salomon,
1983; Janvier, 1978; MacDonald-Ross, 1977; Winn, 1987; Bowen, 1992). For the
purposes of this study tables are defined as displays arranged in rows and columns that
illustrate relationships among categorical variables or continuous variables. These rows
and columns contain an arrangement of numbers, letters, words, diagrams or a mixture
of all of tiiese forms (Winn, 1987, p. 153).
Interpreting graphs and tables
Interpreting graphs and tables involves more than the examination of trends; it includes
relating trends to explain cause and effect. Janvier (1978) states that "cmdely speaking,
interpreting a graph consists of putting into verbal form information, regarding a
situation, given in a graphical form" (p.3.1). He views the problem in interpreting
graphs as associated with the many modes of representation possible. Apart from a

graph, verbal descriptions, tables and formulas are often used to represent the same
relationship, and this, he claims, confuses the issue. The research of Chandler and
Sweller (1991) supported Janvier's claim as they showed that poorly organised
information causes learners to divide their attention among the various pieces of
information and this creates cognitive load which in tum leads to inefficient processing of
the information.
Preece (1985) contended that to interpret a graph successfully the leamer not only had to
read the information contained in the display, but also relate the graph to its context. This
view is shared with Janvier (1978); the reader of the graph has to tell the story contained
in the information presented. However, some researchers such as Appel (1973) have a
narrower definition and maintain that the interpretation of graphs and tables is the ability
to read with understanding and to get information that has to do with number values
(Appel, 1973). She also contends that it is important to teach skills in graph reading and
interpretation. Whilst few would argue with Appel's suggestion that these skills should
be taught, the question of how and when they are taught might be more contentious.
Various researchers who have studied how leamers interpret graphs and tables mention
the following processes:
1. reading a graph or table (Bowen, 1992; Janvier, 1978);
2. deciphering the labels on axes and the headings of columns (Appel, 1973;
Dugdale, 1986; Janvier, 1978; Pinker, 1981; Preece, 1985);
3. describing the global features of the data such as maxima, minima, slope,
tuming points, regular trends or the means of data presentation such as
picture form, bars, columns, lines (Dugdale, 1986; Janvier, 1978, Preece,
1985; van Reeuwijk, 1992);
4. relating the properties of the graphs and charts to information described in
accompanying text (Janvier, 1978; Mosenthal & Kirsh, 1991; Roth &
Bowen, 1994);
5. application of prior knowledge to aid in the comprehension of the
information presented (Janvier, 1978; Preece, 1985; Roth & Bowen, 1994).

The first three points relate to reading or processing of displayed information and the last
two points relate to the context in which the information occurs. To correctiy interpret a
graph or table a person has to read or process the information accurately and then relate it
to the context. Figure 1.1 shows a concept map developed by the researcher to explain
how this process of interpretation may work.
Figure 1.1: A model of leamer interpretation of information contained text, graphs and tables
affects leamer Interpretation of
This diagram shows that graphs have two types of visual information; one type is
associated with pictures and the other is associated with text and numerical information.
Pictures in this context include the global features described previously but may also
include iconic labels. Text and numeric features are often found in headings, and on
labelled axes but they may be used to direct reader attention to a global feamre such as a
change in slope or tuming point. To successfully interpret a graph the leamer has to link
both types of information to his/her semantic memory and then constract meaning by
relating the features to the context that is usually described by supporting text.
Throughout, the prior knowledge of the learner continuously interacts with the
interpretation process.

8
For this study the interpretation of graphs and tables is defined as the abiHty to read the
information contained in the displayed graph or table and to relate it to its context.
To do this successfully a person must be able to read the data portrayed and the labels,
relate the labels and data to a specific context, described in the accompanying text, and
then translate the meaning associated with the display of the data into words. The
process of relating the labels and data portrayed to the context often involves:
identification of maximum and minimum; intervals over which the function increases;
intervals over which a variable is less than, greater than, or equal to a given constant
(plateau); drops and rises of curves between plateaux or extreme points; the general shape
(up or down) or curves; discontinuities; pattems that give rise to cycles; steady rates of
change; symmetry; extrapolation; interpolation (asymptotes); dispersion of a graph and
difference in shape measured by area, and many curves on the one graph (Janvier, 1978).
However, this process does not occur in isolation and as Janvier (1978) claims there is
no interpretation without regard to the situation. Therefore we must be aware that "any
pupil has a personal knowledge...a vast background more or less precisely defined is
already present in the pupil's mind before he tackles any question" (Janvier p3.6). While
the graph conveys definite information which constitutes a definition of the situation,
"this is analysed through a process involving a continuous reference to the underlying
background" (p.3.6).
Many previous studies that related to the interpretation of graphs relied upon interviews
with a small sample of subjects (less than 25) or survey techniques with a large sample of
subjects (over 150). A few studies such as those of Janvier (1978) and Preece (1985)
used a combination of these methods. Because of the multiple sources of data used, their
studies made significant contributions to our understanding of how leamers interpret
graphs and tables. Consequentiy, a similar strategy was adopted during this study.
While this study focuses upon the development of cognitive tools designed to support
learners as they interpret graphs and tables, it also builds upon the work of Janvier
(1978) and Preece (1985). The cognitive tools were designed to assist leamers in the
total interpretation process. Therefore the cognitive tools provided assistance in reading
data labels and values, in relating the data display to a specific context and with the
constraction of a knowledge map that represented the leamer's understanding of the
information presented.
Cognitive tools
David Jonassen (1992b) has described cognitive tools as both mental and computation
devices that support, guide and extend the thinking processes of the users. Such tools
are extemal to the leamer and are computer-based devices that extend the thinking
processes of the leamers and engage the leamer in meaningful processing of information
(Jonassen, 1992b).
For the purposes of this study cognitive tools are defined as: "generalisable tools that can
facilitate cognitive processing " (Jonassen, 1992b, p.2). They may make it easier for
leamers to process information, but their main "goal is to make effective use of the mental
efforts of the leamer" (Jonassen, 1996, p. 10).
Cognitive tools that function as mindtools (Jonassen, 1996) are those that engage the
leamer in higher order thinking skills such as critical, creative and complex thinking. An
example of a mindtool is a computer-based concept mapping tool that leamers use for
knowledge constraction. During the process of knowledge constraction leamers may
employ critical thinking skills to evaluate, analyse and connect concepts and information;
creative thinking skills to elaborate, synthesise and visually arrange concepts and
information; and complex thinking skills to assess, revise, find altemative stractures and
make choices.
Cognitive tools that provide "just in time" support (Gery, 1991) are "fingertip" tools
(Perkins, 1993) that leamers use naturally and effortlessly. They provide context-
specific support at the moment of need and balloon help is an example of a "fingertip"
tool.
During this study both "fingertip" tools and mindtools were employed to assist leamers
to analyse and then synthesise information presented as text, graphs and tables.
Concepts
The term "concept" has many uses in educational and psychological literature. Some
definitions focus on common attributes of objects or events which result in them

10
belonging to the same category (Frayer, Fredrick, & Klausmeier, 1969). Others focus
on the network of relationships between concepts (Anderson, 1980; Novak & Gowin,
1984).
While Novak and Gowin (1984) consider concepts to be "a regularity in events or objects
designated by some label" (p.4). For example, the concept "chair" is the label we use in
English to designate an object with legs, a seat, and a back that is used for sitting on.
That is, the use of the chair was as important as its other attributes. They assert that
culture is the vehicle through which children acquire concepts that have been constracted
over centuries, and schools are recent inventions for the acceleration of the process of
acquiring concepts. When leamers begin to constract new knowledge they begin with
observations of events and objects and relate this to the concepts that they already hold.
Thus "knowledge is not discovered like gold or oil, but rather is constracted like cars and
pyramids" (Novak & Gowin, 1984, p.4).
For the purposes of this study a concept represents "anything that can be recognised,
that is, that can be attributed identity" (Holley & Dansereau, 1984, p.23). Thus
ideas, objects, images, notions, conceptions, beliefs, events, features, properties,
and states are examples of concepts. What is commonly referred to as 'having a
concept' involves the performance of a combination of generalisation and
discrimination behaviour such as classifying correctiy any examples of the concept
and not including any non-examples, however similar they may be.
Concept map
Often children and adults will revert to concrete examples in order to clarify new
concepts. During knowledge acquisition leamers identify important concepts/ideas in the
material and may represent their interrelationships and stmcture in the form of a network
map (Armbraster, 1979; Goetz & Armbraster, 1980; Holley & Dansereau, 1984; White
& Gunstone, 1992). The result is a stractured two dimensional concept map representing
the spatial organisation of the material and "the meaning of each concept is embodied in
its relations with other concepts" (Fisher Faletti, Patterson, Thornton, Lipson, & Spring,
1990, p.347). Concept maps can be further elaborated by attaching images, and text
(definitions, descriptions, formulae, synonyms or other relevant links).

11
Figure 1.2 displays a simple concept map. It has a hierarchical stracture and the
relationship between terms is inclusive, with general ones standing above the specific
ones.
Figure 1.2: A simple concept map (after White and Gunstone, 1992)
Researchers such as: Novak (1990); Jegede, Alaiyemola, and Okebukola, (1990);
Jonassen (1992a); and Lloyd (1990) share the view that concept mapping helps leamers
organise their cognitive frameworks into powerful integrated pattems.
Purpose of the study
This study sought to develop and evaluate a set of cognitive tools designed to assist
leamers to process information presented in text, graphs and tables. The text, graphs and
tables were presented on an Apple Macintosh TM computer platform and the cognitive
tools were developed using a HyperCard programming environment.
The cognitive tools were to serve three basic functions: first the tools were to assist the
leamer to read and compare the values presented in the graphs and tables; second they
were to help the leamer to relate the data to a specific context that was described in the
accompanying text; and third they were to provide a mechanism for the translation of
meaning associated with the data into words.
The graphs and tables used in this study were not presented in isolation from their
context. They related to the specific topic of rainforest destmction and text was included
with the graphs so that the leamer could relate the context and the data presented.
12
Theoretical perspective
The theoretical perspective adopted during this study is based upon a constractivist
philosophy which asserts that we can only know about reality in a personal and
subjective way (von Glaserfeld, 1989). Thus each person's experiences dictate how
(s)he interpret the world and the knowledge (s)he constracts from these experiences is
based upon both individual and social interaction (Cannon, 1995). A constractivist
approach to leaming is based upon the supposition that leaming is "the product of self-
organisation" (von Glaserfeld, 1989, p. 136) which occurs as the leamer interprets new
experiences by relating them to past understandings. This process of leamer self-
organisation may occur alone or in a social setting such as a classroom or in the home.
Contractivist leaming theory recognises that each leamer has a uruque experience of the
world and this influences how (s)he organises these experiences into knowledge
stractures and beliefs. Furthermore, these personal (and often idiosyncratic) sets of
knowledge stractures and beliefs strongly influence the way in which (s)he interprets
new leaming experiences (Cannon, 1995; Jonassen, 1996). Leaming experiences that
are based upon constractivist theory acknowledge that leaming is a purposive process
and leamers are ultimately responsible for the knowledge they constract (Driver et al.,
1994). Since prior conceptions brought to leaming situations influence what is leamt, the
approach requires leamers to be actively involved in the process of constraction of
meaning which often takes place through interpersonal negotiation (von Glaserfeld,
1989).
This study focuses on two aspects that relate to a constractivist perspective on leaming.
First, the processes involved in the design and modification of the cognitive tools
employed during this study, and second, upon the leamer interactions with these tools as
they generate their own understandings from the information presented. The outcomes
from this study may stimulate instractional designers to develop more cognitive tools
from a constractivist perspective, and researchers to investigate new research questions.
Ultimately it should be the leamer who benefits most from the outcomes of this study.
An important aspect of the cognitive tools investigated in this study was the facilitating
role they can play. Simply providing leamers with tools to process information is not

13
enough, the leaming environment in which the tools are used also has to be considered.
This notion is supported by authors such as Jonassen (1996) who claimed that cognitive
tools will have their greatest effectiveness when they are applied within constractivist
leaming environments. He asserted that cognitive tools should enable leamers to create
their own representations of knowledge rather than absorbing knowledge representations
created by others. That is, cognitive tools can support the deep reflective thinking
required for meaningful leaming. Furthermore, the technology of the computer and its
associated software form an intellectual partnership with the leamer and this in tum
creates a cognitive residue that remains after the cognitive tools are used.
The inquiry techniques employed during this study required a judicious mixture of
context specific methods that meet the unique requirements of the specific research
questions. Multiple data gathering techniques were needed to ensure that the data were
comprehensive, reliable and valid. Data were gathered from: interviews; computer
monitoring of subject use of software (tracking data); surveys, and analysis of concept
maps created by the leamers.
The cognitive tools
Rather than develop one specific tool, it was decided to develop a suite of cognitive tools
that could be used in a more realistic leaming situation where text, graphs and tables were
used together to present information to leamers. The tools developed were designed to
serve two broad purposes. First tools were developed to assist leamer analyse
information presented in text, graphs and tables; and second a concept mapping tool was
developed to assist leamers synthesise information presented in text, graphs and tables.
These cognitive tools were developed with HyperCardTM software, a software product
for Apple Macintosh' *^ computers. It has many applications some of which include:
screen painting; database management; a programming language; a tool set; a resource
library, and an operating shell that can be used to make multimedia productions.
All of the tools developed made use of on-screen buttons. A button in HyperCard""^
applications is an on-screen area that is activated when a leamer uses the mouse to move
the pointer over this area (which may be visible or invisible to the user) and presses the
mouse button once.

14
The cognitive tools developed to analyse information were to serve three basic functions:
first the tools assisted the leamer to understand the meaning of key words presented in
text; second they assisted leamers to read and compare the values presented in the graphs
and tables; third they allowed to leamer to relate the data to a specific context. The
concept mapping tool provided a mechanism for the translation of meaning associated
with the data into words.
1 . Understanding the meaning of words presented in text
Explanatory text that accompanied the graphs and tables contained key concepts that were
colour coded. These concepts were linked to a glossary that could be accessed when a
leamer used a mouse to click on these colour coded words.
2 . Reading and comparing values presented in graphs and tables
The tool used with the table was a simple sorting tool that allowed the user to sort the data
in each column in descending order. To activate this function the user clicked on the
column headings.
The tool used to assist with the reading of graphs was in the form of balloon help. This
tool was automatically activated when the cursor was positioned above a labelled section
of a graph. Then a balloon containing some explanatory text appeared.
3. Relating the data to a speciHc context
Once again balloon help was employed to display location maps of the countries listed on
the axes of the graphs. A location map appeared when a user moved the cursor over the
name of a country.

15
4 . The translation of meaning associated with the text, graphs and
table into a concept map
Of the tools developed this presented the greatest challenge because it involved the use of
the concept mapping tool as a means of translating data presented in text, graphs and
tables into a knowledge stracture. The concept mapping tool developed allowed leamers
to make a list of concepts and to draw links among them. They could also add
explanatory notes to the links and to the concepts. The concepts and attached notes could
be re-arranged, modified and linked into a comprehensive concept map that represented
leamer understanding of the information presented. This information could be saved as a
text file and imported into a word processor appUcation where it could be developed into
a short explanatory essay. Therefore the concept tool was used a means of integrating the
various sources of information in order to generate a written summary which reflected the
current understanding of the leamer.
Research questions and strategies
The research questions posed were:
1. What factors affect the ability of various groups of preservice teachers to
interpret a set of graphs and tables?
2. What cognitive strategies do preservice teachers employ when they interpret
graphs and tables?
3. How do the identified cognitive strategies compare with those strategies
identified by other researchers?
4. Could the instractional strategies identified by researchers in related fields be
apphed to effectively introduce leamers to the concept mapping tool?
5. What effect does the concept mapping support tool have upon the way the
leamers stracture their knowledge?
6. Do the cognitive support tools assist leamers to analyse information in text,
tables and graphs?

16
7. What evidence is there that these cognitive tools had an impact upon the
concepts developed by the leamers?
8. Do the tracking data help researchers in understanding the way in which the
tools were used?
9. How did the leamer access information?
Brief discussion of the research questions
Research questions 1, 2 and 3 are discussed together.
1. What factors affect the ability of various groups of preservice teachers to
interpret a set of graphs and tables?
2. What cognitive strategies do preservice teachers employ when they interpret
graphs and tables?
3. How do the identified cognitive strategies compare with those strategies
identified by other researchers?
This part of the study focused on the research strategies employed by leamers as they
interpreted graphs and tables.
Three broad research strategies were adopted: the first was a review of studies akeady
undertaken; the second was a quantitative approach that formulated and tested hypotheses
that predicted relationships independent and dependent variables; and the third used a
qualitative approach that relied upon interview data gathered from a small sample of
subjects.
4. Could the instractional strategies identified by researchers in related fields be
apphed to effectively introduce leamers to the concept mapping tool?
Research strategies 3, 4, 5, and 6 were adopted to investigate this research question.
The concept mapping tool was developed to help leamers synthesise the data presented in
graphs and tables into a semantic network that reflected each subject's current
understanding of the topic. Hence the use of concept mapping tool as a strategy to assist
in the knowledge constraction process was a critical part of this study.
17
However, before the concept mapping tool was used it was necessary to provide the
subjects with some experience with the process of concept mapping. Researchers have
suggested that a period of direct instraction is needed before leamers can successfully
employ this process (Harlen, 1992; White and Gunstone, 1992), but it is claimed that
after total of two hours of instmction and practice adult leamers become proficient in
developing concept maps (Martin, 1994, pp. 13-14).
5. What effect does the concept mapping support tool have upon the way the
leamers stracture their knowledge?
The research strategies adopted were associated with strategies 3, 4, 5 and 6 listed
previously. Data from concept map analysis, interviews, and tracking files were used.
The data from the concept maps and tracking data were analysed first and trends that
emerged from this data were used to guide the formulation of additional questions asked
during interviews. The tianscripts from the interviews were then analysed to verify any
emerging trends. Also any new trends that emerged from the interview transcripts were
verified by re-examination of the other data sources.
6. Do the cognitive support tools assist leamers to analyse information in text,
tables and graphs?
The cognitive tools designed to assist leamers to analyse information in text, graphs and
tables were the glossary, the questions, the sorting tool and the balloon help. It was
anticipated that the organisation and timing of the interviews would be of critical
importance to the quality of the data obtained.
7. What evidence is there that these cognitive tools had an impact upon the
concepts developed by the leamers?
This part of the study examined the ways in which information about rainforest
destmction was accessed, what cognitive tools were used and whether this information
had an impact upon the concepts developed by the preservice teachers. The data from the
interviews and the concept maps were analysed, and where appropriate, supplemented
with data from the tracking files.
18
8. Do the tiacking data help researchers in understanding the way in which the
tools were used?
The tracking data were collected automatically after the user logged on to the software. A
large amount of data could be gathered automatically, but a large volume of reliably
collected data does not necessarily equate with useful and interpretable information and
other data sources such as interviews and observations were used to verify the tracking
data.
9. How did the leamer access information?
A variety of research approaches were employed in answering this question. First
multiple regression analysis of survey data and tracking data was use to determine if there
was any relationship among any of the independent variables (attitudes to computers
score, gender, age, preferred leaming style), and the dependent variables (total time spent
using the application, and the frequency of subject referrals to specific screens of
information). Interviews and observations were also use to verify these findings.
Data sources and research strategies
During this study six research strategies were employed to gather reliable and valid data
and these are briefly described.
Research strategy 1: A review of the literature
This section consisted of two chapters each of which was divided into two parts. The
first part of Chapter 2 reviews relevant leaming theory that supported this study. The
second part of Chapter 2 discusses relevant models of how leamers assimilate and
accommodate new information into their existing schemata. In Part 1 of Chapter 3
relevant studies relating to the interpretation of graphs and tables are examined, and in
Part 2 of Chapter 3 the findings from the previous sections are synthesised and apphed to
the problem of designing cognitive tools that assist leamers to interpret graphs and tables.
Research strategy 2: Questionnaires and tests
Questionnaires and tests were used to ascertain the ability of the subjects to interpret
graphs and tables. Data for other variables that may affect the ability of subjects to
interpret graphs and tables were gathered from university records or from questionnaires

19
and tests. Where appropriate, multiple regression analysis was then use to identify any
significant relationships among the variables.
Research strategy 3: Interview methods
Interviews were conducted with a sample of subjects who completed a test on interpreting
graphs and tables, and with subjects who used the cognitive tools. These interviews
were to verify data collected by other methods and to identify any emerging trends.
Research strategy 4: Tracking files of learner use of the software
Tracking files of leamer use of the software were recorded on a file server. This file was
created when a leamer logged on to the software. The file contained information about
the frequency and time that the cognitive tools were activated. Multiple regression
analysis was used to identify any relationships between the independent variables and the
tracking data. The tracking data was also compared to the other sources in order to
identify or verify any emerging trends.
Research strategy 5: Analysis of learner-created concept maps
The concept maps created by leamers were automatically recorded on the file server when
they quit the software. These were analysed and compared with the other data collected
in order to identify or verify any emerging tiends.
Research strategy 6: Observations of learner use of the software
The researcher took a voice-activated micro cassette audio recorder to all laboratory
sessions. Spoken observations were recorded when the need arose.
The subjects
All subjects of this study had completed a one semester subject in information
technology, and could used an Apple Macintosh™ computer. They could switch it
on, use a mouse, load and save software, print out documents, and safety shut down
the computer. The reading level of the subjects was equal to or greater than a Fry
Readability index (Fry, 1977) that gave a value in the year 10 age group (16 to 17
year old reading level).

20
Limitations
The following points need to be made about the Umitations of the study.
1. The study was Hmited to subjects who were years 1, 3 and 4 preservice
teachers. Researchers who intend to apply the findings to other contexts
would need to view the findings from this perspective. The research
strategies and cognitive tools developed may be applicable to other contexts,
and the findings may support and extend the work of previous researchers in
the field, but specific findings may be unique to the population studied.
2. The cognitive tools developed were used with bar graphs only. While the
tools can be applied to line graphs as well as other forms of graphs, no claim
can be made about the general applications without further studies with
different forms of graphs.
3. The graphs and tables related to the topic area of rainforest depletion. No
claim can be made about the success of this approach to other topic areas
without further studies.
4. The type of cognitive skills involved in the interpretation of graphs and tables
were identified through the literature review and then verified by the findings
from the first part of the study. These skills fell into three broad categories:
reading and comparison skills needed to identify individual values and trends
presented by the data displayed in the graphs and tables; reading
comprehension skills needed to relate the data to its context; and translation
skills needed to the articulate the message conveyed by the data into words.
These skills are in reality an extemal manifestation of much a deeper level of
cognitive processing within the human brain, but the investigation of this
aspect of cognitive processing is beyond the scope of this study.
Significance of the study
The study has significance from four perspectives. First, the findings should add to our
understanding of leamer use of the specific cognitive tools designed to assist them to

21
interpret graphs and tables. The identification of use pattems and strategies employed by
leamers should guide future refinements of these tools.
Cognitive tools have the potential to play a significant role in the reduction of cognitive
load associated with many information processing tasks, but they can do the reverse if
poorly designed. If the use of the tool creates significant cognitive load on the leamer,
then its use may be counter-productive. During this study the cognitive tools were
designed with this perspective in mind. The methods employed and the findings from
this research should provide some assistance to instractional designers, other educational
practitioners, and researchers as they develop and evaluate cognitive tools in similar
contexts.
Second, the findings related to the development of the cognitive tools may stimulate
others to follow a similar research path and to build upon the findings of this research.
Instractional designers, other educational practitioners and researchers may wish to
improve on the cognitive tools developed for this study or modify them to apply to other
contexts.
Third, the findings should add to our understanding of how leamers employ the
previously discussed cognitive skills to interpret graphs and tables. The studies of
Janvier (1978) and Preece (1985) demonstrated how multiple sources of data may be
used to make a significant contiibution to our understanding of how leamers interpret
graphs and tables. This study builds upon their work and adds an additional source of
data.
Fourth, the research methods employed should benefit others in the field. Researchers
should be able to evaluate the effectiveness and efficiency of the methods employed and
modify or re-apply them to their contexts.
Outline of the structure of the remainder of the thesis
This thesis consists of eight chapters: the contents of Chapters 2 to 8 follow the stracture
as shown below.
Chapter 2 - Supporting Educational Theory and Chapter 3 - Leamer Interpretation of
Graphs and Tables.

22
The purpose of these chapters is to provide theoretical guidance for the design of
cognitive tools that assist leamers to process and constract meaning from information
presented in the form of text, graphs and tables. It was important to examine previous
studies about the interpretation of graphs and tables that were relevant to the context of
this study as not only are they are a source of appropriate research techniques, they are a
source of data that can help in the development of suitable cognitive tools.
Chapters 2 and 3 each contain 2 parts. Part 1 of Chapter 2 discusses leaming theories
that relate to the context of this study. In particular it examines the contribution of
cognitive leaming theory to our understanding of how leamers process information in the
form of text, graphs and tables. Part 2 presents researcher-based models of how leamers
assimilate and accommodate new information into their existing schemata. In Part 1 of
Chapter 3 research findings that relate to the interpretation of graphs and tables are
examined. It identifies stractural features of graphs and tables that researchers claim
supports leamer processing of information. Also this section describes in general terms a
theoretical model of leamer interpretation of graphs. Finally, in Part 2 of Chapter 3 the
findings from the previous sections are applied to the designing appropriate cognitive
tools. This part then concludes with a brief discussion of the research questions that
emerge from the review of the literature.
Chapter 4 - Methodology: An overview of the three studies
This chapter summarises the methods used to gather and analyse data. It also outlines the
way in which the cognitive tools were developed and modified. The chapter begins with
a description of an annotated flow chart that provides an overview of the studies. Also it
includes a diagram that describes the data gathering events.
There were three sequential studies. Study 1 investigated leamer interpretation graphs and
tables. Study 2 developed and evaluated a prototype of cognitive tools designed to assist
leamers to interpret graphs and tables, and Study 3 investigated leamer use of the concept
mapping and information handling cognitive tools.
Chapter 5 - Study 1: Interpreting graphs and tables
This chapter examines how leamers interpreted graphs and tables and tiie findings related
to research questions 1, 2, and 3 .

23
Chapter 6 - Study 2: Leamer use of the prototypes of the cognitive tools.
These data were to be used to further refine the cognitive tools and contributed toward the
understanding the research questions 4, 5, 6, 7, and 8, but these questions were treated
in much greater depth in Study 3.
Chapter 7 - Study 3: Use of the concept mapping and information handling cognitive
tools.
This chapter examines leamer use of the refined version of the concept mapping tool.
Also presented are data arising from preservice teacher use of the refined version of the
analytical (or "finger tip") cognitive tools developed to enhance their understanding of
rainforest destmction. The data contributed to the understanding of research questions 6,
7, 8 and 9.
Chapter 8 - Discussion and Conclusion
This chapter discusses the results presented in Chapters 5, 6, and 7, and relates them to
the research questions, the literature review and research methods employed. As each
research question is discussed, related theoretical and methodology issues are raised.
Also the limitations of the current study are discussed and avenues for further research
identified.
In addition, this chapter discusses issues that need further investigation and makes
suggestions for future studies. Also it discusses future uses of cognitive tools to support
education and leaming.

24
Chapter 2: Supporting Educational Theory The previous chapter explained that this study sought to develop and evaluate cognitive
tools that would assist leamers to process information presented in text, graphs and
tables. The purpose of this review of relevant research is to provide theoretical guidance
for the design of cognitive tools that assist leamers to process and constract meaning
from information presented in the form of text, graphs and tables.
The supportive theory is based upon a constractivist epistemology. Although
constractivism is not a new philosophy of leaming, there are now efforts to understand
the application of constractivist principles across all areas of education (Tobin, Tippins &
Gallard, 1994). This review develops an understanding of how this approach can be
applied to help leamers interpret graphs and tables.
This chapter is stractured in two parts. Part 1 discusses leaming theories that relate to the
context of this study. In particular, it examines the contribution of cognitive leaming
theory to our understanding of how leamers process information in the form of text,
graphs and tables. The processing of information in the form of text is also included as
graphs and tables are typically accompanied by explanatory text that describes their
context. Part 2 presents researcher-based models of how leamers assimilate and
accommodate new information into their existing schemata. It concludes with a summary
that relates these ideas to the context of this study.
Part 1: Relevant theoretical models of learning
In this literature review, theoretical models of leaming that assist researchers to
understand how leamers process graphical and tabular information are discussed and
where appropriate relevant models relating to the processing of text are also included.
The focus is on educational and psychological theories that can provide guidance in the
design of cognitive tools which assist leamers in the interpretation of text, graphs and
tables.
When a leamer interprets graphs and tables, (s)he may find that familiar cognitive
strategies such as those used when reading text are not as successful in this context.
Several reasons have been proposed for this and these include the learner's prior

25
knowledge, preferred leaming style, the complexity of the presentation of the information
(the text, the graph or the table), cognitive load (Chandler & Sweller, 1991) and factors
that relate to tiansfer (Salomon & Perkins, 1989).
Let us consider a specific example, of graphs and tables that relate to the formation of
metal alloys. It soon becomes clear that much of the information cannot be fully
understood without prior understanding of specialised terms such as alloy, phase,
eutectic, eutectoid, liquidus, solidus, and solvus. Once leamers understand these terms,
they can relate this information to their existing semantic network. To help leamers to
process this unfamiliar information, we may provide specific information about the
subject and/or assistance such as a semantic network map or advance organiser (Ausubel
& Youseff, 1963).
On the other hand, leamers may be familiar with the subject matter presented, but find the
presentation of the information confusing, because the text, graphs and tables use
unfamiliar measures and labels. Then the essential message becomes lost because leamer
attention is distracted by a display of incomprehensible symbols, numbers, lines and
labels. This effect is known as cognitive load and has been identified by researchers as a
factor that impairs leamer ability to interpret graphs and tables (Chandler & Sweller,
1991; Sweller, 1994). To reduce this effect we could simplify or reorganise the
information displayed, but there is a danger that the message conveyed will be lost. We
could provide learners with tutorial assistance, but it is not always feasible to have a
knowledgeable human tutor standing by to lend assistance. Therefore, other forms of
assistance need to be considered.
Various researchers argue that it may be important to provide the leamer with strategies
that help him/her to assimilate data from sources such as graphs and tables to his/her
existing semantic network (Quillan, 1968; Holley & Dansereau, 1984; Heimlich &
Pittelman, 1986; Clarke, 1991; Mayer, Dyck & Cook, 1984; Bean, Singer, Sorter &
Frazee, 1986; Ausubel, 1960; Mayer, 1975; Mayer, 1976; Mayer, 1977; Mayer, 1979).
One such mechanism may take the form of a semantic network map or post-organiser
(Heimlich & Pittelman, 1986; Merrill & Stolurow, 1966).

26
An additional way to assist leamers to interpret text, graphs and tables may be through an
electronic support system (EPSS) which provides leamer access to required help at the
moment of need (Gery, 1989; Clarke, 1992). Such a support system provides at the
moment of need the essential knowledge needed by the learner to understand the
information and the underlying message conveyed by the data presented. Only leamers
who require support access it, so the responsibility for obtaining help lies with the
leamer.
Gery (1989) asserts that if the leamer is provided with an EPSS that provides additional
knowledge at the time of need, then (s)he can make progress in learning. She
demonstrated that computer-based monitoring of performance can provide intelligent
advice that assists worker productivity. This form of support may be effective in
industrial contexts where subjects are adults who have to perform specialised and well-
defined tasks, but it may be less effective in school-based leaming situations, where the
leaming tasks are not as well defined and transferable generic skills are often more
important than specific procedural knowledge. Since, the context of this study is
different to those of Gery, direct transfer of her ideas may only apply to specific
situations.
Another approach is to use a more general form of cognitive support and during this
study cognitive tools were developed for this purpose. The generic term 'cognitive tool'
(Jonassen, 1992b, p.2) describes devices that facilitate cognitive processing of
information and is the term adopted for this study. Cognitive tools are both mental and
computation devices that support, guide and extend the thinking processes of the users
and are extemal to the leamer. They also engage the leamer in meaningful processing of
information (Jonassen, 1992b). In 1996 David Jonassen employed the term Mindtools to
refer to "computer applications that require students to think in meaningful ways in order
to use the application to represent what they know" (Jonassen, 1996, p.3). He argues
that in order to use such tools leamers have to engage their mind and become involved as
active constractors of their own understanding and knowledge. That is, the leamer forms
"an intellectual partnership with the computer" (p.4).
Visual tools as described by David Hyerle (1996) are cognitive tools that can be used to
reflect our capacities to pattem and reorganise relationships (Hyerle, 1996). He classifies

27
such visual tools into three basic categories "brainstorming webs, task-specific
organisers, and thinking-process maps" (p.3). A computer based concept mapping tool
was used by leamers during this study to constract knowledge. According to Hyerle
(1996), this tool is classified as one that creates a thinking-process map whereas
Jonassen (1996) would use the generic term mindtool.
Guidance from educational theory
In 1977 Joseph Novak stated that "the development of interpretive models is needed and
can be valuable to the advance of educational practice, provided we recognise the tentative
and evolutionary character of the concepts we derive from them." (Novak, 1977a, p.20).
In the context of this study the theoretical models of leaming reviewed were used to
identify principles of instractional design that applied to cognitive tools developed for
specific tasks associated with leamer understanding of graphs and tables. These tasks
were first identified after reviewing relevant studies associated with the interpretation
graphs. They were then verified when the researcher sought to replicate aspects of
studies reviewed in the literature.
Most researchers classify leaming theories into two broad groups known as behavioural
and cognitive (Bigge & Shermis, 1992). As with most human classification schemes,
some overlap occurs, and later in this chapter Gagne's eight principal categories of
leaming outcomes are used as an example of the overlap and evolution in ideas toward a
cognitive perspective. In this section it is argued that behavioural and cognitive theories
apply to different aspects of the design of computer-based instractional materials, and
embedded within these broad categories are other theories that can be considered as sub
sets.
Relevant aspects of behavioural theory
While behaviourism may be less fashionable today, a review of supporting theory would
be incomplete without a mention of the contribution of behavioural theory.
Behavioural psychology is based on experimentalism that has as its origins the methods
promoted by Francis Bacon (1620) over 370 years ago. Twentieth century behaviourist
leaming theory has as an experimental research base the results of numerous studies of

28
stimulus-response relationships and reinforcement such as those of Pavlov, Watson,
Thomdike and Skinner (Lefrancois, 1972; Skinner, 1958).
The behavioural model of leaming can describe simple leaming situations where the
stimulus and the response are easily identified, but as one progresses to higher order
leaming in human subjects, it becomes increasing difficult to describe the outcomes
completely in terms of pattems of Stimulus-Response connections. Most cognitivists
would say that this is impossible to do (Romiszowski, 1990) and would argue that
behavioural models of leaming fail to recognise the complexity of the interactions among
the experimenter and the variables, the changes in those interactions produce in the
variables, and the concepts that govem their interpretation. Also there are many
antecedent conditions that affect a leaming situation and these cannot be accounted for
(Novak, 1977a).
Past studies that focused upon behavioural models of leaming were usually quantitative
and based upon some form of comparison between experimental and control groups.
The findings from such studies have limited apphcation because of the reasons previously
mentioned, but there were some successful apphcations associated with drill and practice
software. Whilst many of these early attempts were criticised as boring and lacking in
strategies to motivate students (Sewell, 1990), others could be effective in narrow
applications such as drill and practice associated with the leaming of multiphcation tables
or spelling rales (Price, 1991). Therefore, drill and practice software should be
considered as a legitimate application of behavioural education theory to the design of
computer-based instractional systems, but the context is limited to specific situations
where leaming outcomes are observable and measurable.
Relevant aspects of cognitive theory
The limitations of behavioural theory made researchers look more closely at other
theoretical models of leaming and thus cognitive theoretical models such as those of
Piaget (1971) and Braner (1966) received more attention. Bruner's theory of instraction
as presented in "Towards a Theory of Instraction" (1966) is an example of a cognitive
theory that has application in this area. He states that a theory of instraction should take
into account: the nature of persons as knowers; the nature of knowledge, and the nature
29
of the knowledge-getting process. For Braner, a theory of instraction should cover five
main aspects of leaming:
1. optimal experiences that predispose leamers to leam. As Braner (1966) states
"Leaming and problem solving require the exploration of altematives. Instraction that is
geared to promote this function should minimise the risk involved in exploration; it
should maximise the informativeness of error, and should seek to weaken the effects of
previously estabhshed constraints on exploration and curiosity ..." (p. 198);
2. stracturing knowledge for optimal comprehension. He states that "grasping the
stracture of a subject is understanding that it in a way that permits many other things to be
related to it meaningfully"(p.7). Hence, knowledgeable experience should be coded in
such a way that it is useable by students in both present and future leaming and living
situations;
3. organisation of the materials to be leamt into optimal sequences of presentation.
Braner argues that the task of instractors is to convert knowledge into stractures that are
within the grasp of leamers at various ages and to arrange the stractures in an optimum
sequence of materials to be leamt. The reverse of this approach is to provide the leamer
with tools that allow him/her to arrange leaming materials into meaningful knowledge
stractures and cognitive tools are designed to assist leamers to provide this function;
4. the role of success and failure and the nature of reward and punishment. Rewards and
punishments associated with leaming are seen as motivators that affect the informative
utility of successful and unsuccessful attempts at problem solving. Such successes and
failures in leaming may lead to: more rapid awareness and understanding; a feeling of
capability associated with the challenge of exercising one's full mental powers; a
development of interest and involvement; the pleasure gained from mastery of a cognitive
task; a sense of achievement, and the development of 'reciprocity' - deep human need to
respond to others and to operate jointiy with tiiem;
5. procedures for stimulating thought in a school setting. Braner believes that "if
information is to be used effectively, it must be translated into the leamer's way of
solving a problem" (Braner, 1966, p.53). Therefore instraction should "make the leamer

30
or problem-solver self-sufficient." (Braner, 1966, p.53). Again cognitive tools are
designed to support the leamer in becoming a self-sufficient problem solver.
Later in this study the principles identified by Braner were applied to the design and
introduction of cognitive tools.
Research associated with cognitive leaming theory is usually qualitative because it lends
itself to a holistic approach that views leaming from multiple perspectives, and reflects
the complexity of the interactions between those involved in the leaming process. Whilst
the problem of generalisable findings exists, there is value in qualitative studies that focus
upon subjects in natural settings. A limited discussion of a number of significant
researchers whose works are relevant to the context of this study follows.
The contribution of Jean Piaget
Piaget studied the nature of children at different ages and focused upon the innate
development stages of children as they relate to their acquisition of knowledge. It has
been argued that the contribution of Jean Piaget to the understanding of leaming was
more in developmental psychology than in leaming theory (Bigge & Shermis, 1992).
For Piaget, the mental development of any child consisted of a succession of stages or
periods. Each stage extends the preceding stage, reconstracts cogiution on a new level,
and comes to surpass the earlier stage.
The key processes in the stages of child development are assimilation and
accommodation. Assimilation consists of filtering or modification of the input from the
environment. In this process new knowledge is assimilated with the child's previous
experiences. Accommodation consists of the modification or change of the child's
internal pattems of understanding to fit reality. During this process existing intemal
insights are reconstracted so as to "accommodate" new data or information. It is the key
processes of assimilation and accommodation that provide theoretical support to the
experimental research involved in this study.
However, Piaget was criticised by some researchers as they claimed that his theory
hmited his interpretation of his interview data (Novak, 1977a; Donaldson, 1978; Modgil
& Modgil, 1982; MacNamara, 1982). Also they have claimed that he failed to recognise
adequately the powerful roles that language development and specific frameworks of

31
relevant concepts play in the development in the pattem of children's reasoning. This is
an important criticism as many researchers have shown that language plays an important
role in the development of concepts (Garton, 1992; Lozanov, 1978; Osborne & Wittrock,
1985; Vygotsky, 1978). Nevertheless, these criticisms do not detract from pradent
adoption of his ideas in a new context, as the postulated processes of assimilation and
accommodation enable us to form a mental model of the leaming process, and to develop
an understanding of what happens when leaming occurs. Von Glaserfeld (1989) argues
that "knowledge for Piaget is never (and can never be) a representation of the real world.
Instead it is a collection of conceptual stractures that tum out to be adapted or, as I would
say, viable within the subject's range of experience" (p. 125) and "leaming is the product
of self-organisation" (von Glaserfeld, 1989, p. 136).
Seymour Papert and the idea of constructionism
The work of Seymour Papert forms part of this review because of his significant
contiibution to the use of computers as leaming tools. His work is presented at this stage
of the literature review as Papert was strongly influenced by Piaget.
Papert believed "that certain uses of very powerful computational technology and
computational ideas can provide children with new possibilities for leaming" (Papert,
1980, p. 17) and asserted that computers "should serve children as instraments to work
and to think with, as the means to cany out projects, the source of concepts to think new
ideas." (Papert, 1993, p. 168). He admitted that he was strongly influenced by Piaget's
notion that 'to understand is to invent' in a new domain (Papert, 1993, p. 169). In this
way knowledge becomes useful and can be shared with others.
Papert argued that the notion of "different ways of knowing" was the most important
contribution of Piaget. Furthermore these "different ways of knowing" are used by
learners to solve real world problems every day. He prefers to use the term
"constractionism" (Papert, 1993, p. 142) to describe the intellectual processes involved in
the reconstraction of knowledge for specific purposes. Often this knowledge is not
learned at school and does not conform to the traditional school-based notion of what
proper knowing is. The leamer uses an idiosyncratic set of cognitive tools in this re
constraction process. While his ideas appear to be part of a 'constractivist' approach to

32
learning (discussed later in this chapter), he claims that his term is a "personal
reconstruction of constructivism" (p. 142) and is different. Papert asserts that
constractivism expresses the theory that knowledge is built by the learner and not
supplied by the teacher, and constractionism expresses the further idea. That is,
knowledge constraction happens felicitously when the learner is "engaged in the
constraction of something extemal or at least shareable... a sand castle, a machine, a
computer program, a book ..." (p. 142). The constraction of a concept map that reflects a
leamer's understanding of a specific domain of knowledge would also be an example.
Such a map may represent a leamer's cognitive stracture or "cognitive scaffolding"
(Ausubel, 1968). A discussion of Ausubel's work follows as his research inspired the
application of his theory to the procedure of concept mapping by Novak and Gowin
(1984).
Ausubel - supplying a cognitive structure
Ausubel argued that the provision of cognitive scaffolding supports leamers when they
acquire new information, and the idea of an advance organiser developed from his
research (Ausubel, 1960; Ausubel & Youseff, 1963; Ausubel, 1968). Various claims
have been made about the effectiveness of advance organisers (Clarke, 1991; Mayer,
1980; Mayer, 1975; Merrill & Stolurow, 1966), and several reviews of research findings
reported small improvements in leaming across all content areas (Luiten, Wilbur &
Ackerson, 1980). Others have concluded that "the efficacy of advanced organisers has
not been estabhshed" (Barnes & Clawson, 1975, p.651). It may be more productive in
the context of this study to acknowledge this debate rather than participate in it. Rather
the focus for this study is upon the essence of Ausubel's theory as summarised by his
statement that "the most important single factor influencing leaming is what the leamer
already knows. Ascertain this and teach him accordingly" (Ausubel, 1968, preface page
vi). Thus, to apply this idea, we must identify the relevant concepts that are part of the
leamer's existing knowledge or, as Ausubel explained, identify the relevant subsuming
concepts that are available in the leamer's cognitive stiiicture.
Ausubel conceived of cognitive stracture as highly organised linkages formed between
information stored in the brain. While such a stracture is idiosyncratic, it is highly
ordered, forming links between various older and newer elements of knowledge

33
(concepts). This conceptual hierarchy contains minor elements of knowledge that are
linked (subsumed) under more general, more inclusive concepts.
Thus a cognitive stracture represents a framework of hierarchical organising concepts
which depict an individual's organisation of experience. Every individual has a unique
history and an individual's cognitive stracture relates to their life experiences.
As new experiences are acquired, new knowledge is related to concepts already in a
person's cognitive stracture. These concepts become elaborated or altered so that they
can be linked to a wider array of new information in subsequent leaming. Such a process
is described by Ausubel as concept differentiation (Ausubel, 1963). This aspect of
Ausubel's work suggests that it is not a simple task to ascertain what the leamer already
knows. Therefore we may need to look at the problem of ascertaining what the leamer
akeady knows from a different perspective as traditional methods of testing reveal littie, if
anything about the learner's cognitive stracture. Concept mapping developed as an
altemative strategy that could be used to obtain a representation of a leamer's cognitive
stracture (Novak & Gowin, 1984).
The second part of Ausbel's statement about learning mentions to "teach him
accordingly". Individuals can leam information that bears little or no association with
existing concepts, but Ausubel argues that meaningful learning occurs when new
information is linked with existing concepts. When this happens he claims that the new
information is more likely to be successfully retrieved from long-term memory.
When we apply this principle, Ausubel suggests that we might begin instraction with the
most general concepts, but we need to show how they are related and need to move up
and down the concept hierarchy in order to illustiate links between concepts. Such an
approach is called expository teaching. While other researchers supported the notion that
leaming materials should be ordered in some sort of discipline-determined logical order
they reported no evidence to support the use of an organisational stracture based upon
psychological factors (Holley & Dansereau, 1984; Bigge & Shermis, 1992).
Other theories of leaming were proposed and some evolved to consider leaming from the
perspective of information processing. Robert Gagne is an example of a researcher who
now considers leaming from an information processing perspective and his theoretical

34
approaches serves to illustiate how the ideas of established researchers continue to evolve
as they straggle to understand human leaming. His hierarchical model of leaming was a
neo-behaviourist model that drew upon behavioural theory up until a certain stage (step
6), but then it adopted a cognitive approach. More recently Gagne moved toward an
information processing model of instraction as discussed in Gagne, Briggs and Wagner
in their 1988 edition of "Principles of Instractional Design".
The use of information processing models of learning
Information processing models of leaming make use of a computer metaphor to model
human processing of information. It has proved to be an important strategy for research
in cognition especially in the areas of attention, memory and problem solving. The
emergence of information processing models co incided with the decline in Piaget's
influence and the tuming away from earlier theories of cognition such as Ausubel's.
The major objective of information processing models is to trace the flow of information
through space and time through a processing system. Such a human information
processing system is analogous to an electronic computer and is conceptualised as having
inputs, throughputs and outputs. Inputs begin when information in the form of a
stimulus (verbal, visual, tactile) impinges on the sensory receptors. As the sensory
information moves through the system, it is altered, tiansformed into a meaningful code,
compared to information already in memory and is stored in memory for future use.
Output occurs in the form of verbal and non-verbal responses, a decision, or a
representation stored in memory.
The information processing framework has several basic characteristics:
• people are viewed as autonomous intentional beings who interact with the
extemal world;
• the mind through which they interact with the world is a general-purpose,
symbol processing system;
• symbols are acted on by various processes which manipulate and transform
them into other symbols which ultimately relate to things in the extemal
world;

35
• cognitive processes take time, so predictions about reaction times can be
made if one assumes that certain processes occur in sequence and/ or have
some specified complexity;
• the mind is a limited capacity processor having both stractural and resource
limitations;
• the symbol system depends on a neurological substrate, but is not wholly
constrained by it (Eysenck & Keane, 1990, p.9).
A simple information processing model of human performance has been proposed by
Roniiszowiski( 1990).
Figure 2.1: An information processing model of human performance (Romiszowski, 1990).
S stimulus
information
R response
behaviour
1 receptors
perceive
4 effectors
2 memory
recall and store
3 processors
Romiszowiski's model conceives of the performer as a system interacting with an
environment or problem situation. The performer is seen as composed of four principal
sub-systems consisting of:
• receptors that perceive and select incoming information for interpretation and
action. Usually the senses are employed, but the sub-system also includes
reflective-introspection;
• memory or store. Knowledge from prior leaming is kept in an organised
manner (long term memory);

36
• processor or brain or intellect-stractures. New relationships between
incoming and existing information are processed. The processor sets up
hypotheses and tests them. Romiszowiski claims that this is where thinking
occurs;
• effectors. The leamer realises the actions that communicate the results of the
memory-recall and information-processing. It can include any of the
following: limbs; voice; written communication; introspection and self-
analysis.
Many of these ideas originate from the view that human cognition can be understood by
comparison to computers (Eysenck & Keane, 1990), but the use of a computer as a
metaphor can be taken to extremes and the various models of information processing lie
along a continuum. At one extreme of the continuum is the computer simulation
approach, which seeks to develop computer programs that will model the human thought
processes. At the other end of the continuum are theorists who use the computer
metaphor as a convenient heuristic device. If the metaphor is taken too far then we are
likely to ignore the very important differences between humans and machines. The
machine analogy is misleading, as humans are not passive, motionless entities controlled
by external forces. Rather they are viewed as active seekers of information in the
environment. They often constract inferences about this information using present
knowledge and past experience (Eysenck & Keane, 1990). The following statement
summarises the position taken in this study which is that "the assumptions incorporated
in the information processing approach may be reasonable as far as they go, but they do
not go far enough" (Eysenck & Keane, 1990, p. 10).
An altemative approach to human leaming is to consider humans as knowledge
constractors. That is, humans construct meaning from their present experiences by
relating them to past leaming experiences.
A constructivist approach to learning
A constractivist approach to leaming is based upon the supposition that as leamers
interact with the world, they constract their own experience and knowledge (Lyddon &
McLaughlin, 1992; Novak, 1988). Thus, leaming is viewed as "the product of self-

37
organization" (von Glaserfeld, 1989, p. 136). This leaming process is supported by two
broad principles: first, knowledge is not passively received but actively constracted by
the learner, and second, leamers generate understanding when they relate prior
knowledge to present experiences (Wheatiey, 1991). Often this occurs when the leamer
attempts to reconcile differences that exist between his/her explanation and the
explanations of others about the same phenomena (Osbome & Wittrock, 1985; Posner,
Strike, Hewson, & Gertzog, 1982). Such a process often involves intensive and
extensive interpersonal negotiation (Osbome & Wittrock, 1985; von Glaserfeld, 1989).
Piaget's constractivist theory of cognitive development and cognition that involved the
notions of assimilation and accommodation was a foreranner of modern day
constructivism (von Glaserfeld, 1989). The idea is not new and von Glaserfeld's
research showed that unbeknown to Piaget, a forerunner was the philosopher
Giambattista Vico (1710). The findings from Piaget's research with children stimulated a
rapid growth in research into children's ideas and beliefs before formal learning
commenced. Science and Mathematics educators, in particular, became interest in this
type of research and it is not surprising that science education was greatly influenced by
the ideas of Piaget given the large amount of research that began to emerge at the time.
Researchers in the field of science education have conducted extensive reviews of the
research on learner's ideas and beliefs (Osbome & Wittrock, 1985; Driver et al., 1994)
and they have consistently found that when leamers come to science they already hold
some explanatory views of phenomena. These views can be tightly held and can be
remarkably unaffected by traditional forms of instraction. Particular views can be quite
common and these ideas/beliefs are often remarkably consistent across groups differing
in age and nationahty.
This section of the literature review focuses on science education because of the long
history of research into the nature and importance of the ideas that children bring to the
science classroom and the context of this study. Tobin, Tippins and Gallard (1994) state
that "although constractivism is not a new way of thinking, it has not been accepted as
the prevalent way to conceptualise knowledge by the community of educators." (p.46).
They claim that the education community seems to be involved in a process that is similar
to what Kuhn (1962) called a paradigm shift. While constractivism may not have been

38
accepted a decade ago, there are now efforts to understand constractivism across all areas
of education. Such a paradigm shift in cognitive theory challenges researchers to develop
new techniques for educational inquiry.
Driver (1988) argues that instraction that is based upon a constractivist perspective has to
take into account findings relating to leamer's ideas and beliefs and there are various
features which may be seen to be characteristic of such a perspective. She stated that:
"a) Leamers are not viewed as passive but are seen as purposive and ultimately
responsible for their own leaming. They bring their prior conceptions to leaming
situations.
b) Leaming is considered to involve an active process on the part of the leamer. It
involves the constraction of meaning and often takes place through interpersonal
negotiation.
c) Knowledge is not 'out there' but is personally and socially constracted, its stams
is problematic. It may be evaluated by the individual in terms of the extent to
which it 'fits' with their experience and is coherent with other aspects of their
knowledge.
d) Teachers also bring their prior conceptions to leaming situations not only in terms
of their subject knowledge but also their views of teaching and leaming. These
can influence their way of interacting in classrooms.
e) Teaching is not the transmission of knowledge but involves the organisation of
the situations in the classroom and the design of tasks in a way which promotes
scientific leaming.
f) The curriculum is not that which is to be leamed, but a program of leaming tasks,
materials and resources from which students constract their knowledge" (Driver,
in Fensham, 1988, p.l38.)
Furthermore, Driver (1988) stated that this
"view of the curriculum also has implications for curriculum development and argues that linear means-ends model of curriculum development is clearly inappropriate as it fails to take account of the purposes and meanings constructed by the various participants. Instead, the progressive development of curriculum requires a reflexive process in which feedback

39
from all the participants, including researchers, teachers and learners, provides information on how each are interpreting a series of tasks which can then be adapted to improve the extent to which leaming is promoted. This implies not only leaming by students but also leaming by teachers about the ways students constrae presented tasks." (Driver, in Fensham, 1988, p.l38.).
These principles have been applied to the design, presentation and use of the cognitive
tools used by leamers in this study.
The impact of increased use of constractivist-based methods with leamers includes:
increased learner independence; greater leamer responsibility and control; increased
emphasis upon shared knowledge and decision making, and the development of a
coaching and mentoring relationship among teachers and students (Goodram, Dorsey &
Schwen, 1993; von Glaserfeld, 1989). However, such changes in the classroom may
not be liked by all students and teachers and concems about constractivists approaches to
learning have been raised by Matthews (1994; 1997). Matthews (1994) argues that
constractivism "radically underestimates the degree to which individual cognition and
thought is dependent upon social reality, and the sophistication of language available to
the individual..."(p.6). This criticism may have been a vahd comment about some of the
more radical neo-Piagetian based approaches to personal constractivism, but the
movement has evolved toward social constractivism which emphasises the social context
of the leaming situation where leamer interaction and cooperative leaming are seen as
integral parts of the process (Wilson, 1993; Wittrock, 1990; von Glaserfeld, 1989;
Vygotsky, 1978). This point has been acknowledged by Matthews in recent articles, but
he maintains constractivist leaming theory "is simply getting in the way of good
teaching" (Matthews, 1997. p. 13).
Matt^.ev«(1994) also contends that "the vitality of scientific tradition depends upon the
success of schools in initiating children into this tradition"(p.l3). However, it can be
argued that the objectivity of science is not a matter for individual scientists who have
been "initiated" into the system, but rather the result of a social process based upon their
mutual criticism (Popper, 1976), and such a tradition is supported by modem social
constractivism. For the purposes of this study the term 'constractivism' refers to social
constractivism which recognises the importance of social interaction in leaming. This
involves the use of language (von Glaserfeld, 1989), and it is through such a process of
40
that we "have our experiential reality confirmed by others" (von Glaserfeld, 1989,
p. 130).
Another major concern is that little consideration has been given to how leamers
experience constractivist leaming (Goodram, Dorsey & Schwen, 1993). For example,
problems arise as the approach places a high cognitive load upon the leamer because: the
leamer is expected to manage their own leaming; yet the leaming process may not be
familiar to the student. Leamers often feel less secure as they like to stay with familiar
routines and find the reluctance of the instractor to tell exactly what to do in specific
situations frustrating. However, researchers such as Collins (1990) have identified
tiends in school-based instraction with technology which they contend will provide better
support for constractivist leaming (Cognition & Technology Group, 1991; Wilson,
1993; Tobin et al., 1994). The trends identified by Collins (1990) include: a shift from
whole-class to small-group instraction; a shift from lecture and recitation to facilitation
and coaching; a shift from working with better students to working with all students; a
shift toward more engaged students; an assessment based on products, progress, and
effort; a shift from a competitive to a social stracture; a shift from all leamers leaming the
same things to different students learning different things; and a shift from verbal
thinking to the integration of visual and verbal thinking.
To successfully apply a constractivist approach in the context of this study, the research
process must address the issues raised in the previous paragraphs and the role of the
instractional designer and the leamer needs to be a collaborative one. Such an integrated
approach is consistent with a constractivist approach to leaming and should improve the
usefulness of the cognitive tools produced to help leamers read and interpret graphs and
tables. As each prototype was developed, it was used with participants, and the purposes
and meanings they constracted with the cognitive tools were reflected upon and apphed to
subsequent revisions of these tools.
As a set of beliefs about knowing and knowledge, constractivism must be able to be used
to analyse the leaming potential of any situation. Educators should be able to use it as a
reflective tool that empowers leamers and teachers. Cognitive tools that purport to be
constractivist should allow the leamer to develop their own knowledge stractures and
give them tiie opportunity to interrogate and manipulate tiie various forms of information

41
available. Ideally teachers should be able to monitor leamer use of cognitive tools so that
they can develop an understanding of the way in which their students constract
knowledge. This information can be used as a referent for deciding which teacher and
leamer roles are likely to be more productive in given circumstances, but this does not
mean that teachers should focus on monitoring student use of cognitive tools; the reverse
is the case as an important role for the teacher is to mediate the leaming of students and
this implies a strong focus on the leamer. To undertake such a role, teachers need to
interact with leamers to a greater extent, to ascertain what they know and what they are
thinking. Cognitive tools may assist leamers and teachers in this process as they may
help them to develop a clearer understanding of their leaming outcomes so that there is
congraence between the leaming goals of the teacher and the leamer (Tobin, Tippins,
Gallard, 1994).
Computer-based leaming systems have the potential to assist teachers in this task for they
can tiack the way students use an application and this data can be analysed and presented
in a form that identifies where instractor mediation is needed. Hence the system could
become an 'infobase' linked to a support system consisting of expert systems, interactive
productivity software, help systems, monitoring assessment and feedback systems
(Gery, 1991).
During this study a tracking program was included with the cognitive tools developed.
This information was combined with other data and then assessed as a valid information
source. The use of this tool to analyse the leaming potential of an instractional situation
may assist researchers to understand learner performance with cognitive tools as
researchers may want to monitor the effects of cognitive tools and to modify them
according to the feedback received.
However, systematic, comprehensible and informative data is difficult to gather through
the exclusive use of a computer-based leaming environment. Much of the data gathered
rehes on tracking user pathways through applications. These are analysed and plotted as
summary maps, but they tell us littie about the cognitive processes the leamer employed.
Instead they are an extemal manifestation of actions. It is impossible to directly monitor
thoughts, but various qualitative techniques such as interviews, video and audio
recording can be employed to further our understanding of the cognitive processes

42
involved in computer-based leaming. There is, however, a dilemma as the gathering of
so much data can create information overload, making data analysis difficult and time
consuming. This can defeat the purpose of the information gathering process. Therefore
some rationalisation is necessary either in the amount of data monitored or in the number
of subjects involved. The methods need to be efficient in terms of the use of human
resources and this study represents an attempt to address these issues.
Vygotsky and the role of language and social interaction
Vygostsky suggests knowledgeable instractors assist leamers to constract knowledge
that is viable in the community in which they live. Thus the role of these instractor is to
facilitate leamer by extending the leamers zone of proximal development. To achieve this
goal, instractors will need to ascertain what leamers already know and design tasks so
that leamers can build upon and verify existing knowledge stractures (von Glaserfeld,
1989).
An important aspect of leaming that can be overlooked if the model of instraction focuses
entirely on the individual smdent and the teacher is the significant role played by peers in
the social setting of learning situations. Many of the ideas associated with early
constractivist theory developed from the work of Piaget whose research focus was upon
interviews with individual children, but other researchers recognised the role that
language played in knowledge constraction, especially in social settings such as schools
(Vygotsky, 1978; Osborne & Wittrock, 1985). Among other things, the classroom
situation is a social situation that involves communication among many participants,
language and social interaction are also important factors that impinge upon the way
leaming occurs.
Vygotsky (1978) claimed that language and other sign systems are culturally constracted
and mental development is largely due to contact with social influences. He emphasised
the importance of collaboration with peers, teachers and other social actors through the
medium of language. Thus language development enables the transformation of
behaviour into more abstract realisations.
He defined the zone of proximal development as the zone between the present potential to
leam without intervention and the potential to leam with appropriate intervention. The

43
zone of proximal development is not static and constantiy changes over time. An aim of
effective instraction is to extend this zone of proximal development in a forward
direction. Cognitive tools can provide specific leamer support that assists in this process.
Concepts also evolve though social interaction with adults and their peers, and according
to the theories developed by Vygotsky (1978) and Braner (1986) : "Children solve
practical tasks with the help of their speech, as well as with their eyes and hands"
(Vygotsky, 1978, p.26). Language is "...a way of sorting one's thoughts about things"
(Braner, 1986, p.72) and during social interaction, ideas are shared, clarified and
affirmed during exchanges with other people. When learners engage in social
interactions in classrooms they bring new ideas and prior experiences together, modify
their understanding which in tum takes their thinking forward. Thus individuals build on
each other's ideas in order to reach solutions. The importance of leamer interaction has
been emphasised by Woolfolk (1990) who suggests that: "Sometimes the best teacher is
another student who just figured out the problem" (Woolfolk, 1990, p.61).
The views of Vygotsky and the many advocates of social constractivism are in accord, as
they are based upon the premise that knowledge is constracted through a process that
relates new ideas to prior experience which modifies understanding and moves thinking
forward. The importance of leamer interaction needs to be recognised and in this study
was considered to be an essential part of the process of leaming with cognitive tools.
Part 1: Summary
Part 1 discussed leaming theories that are relevant to this study. It focused on cognitive
theory and, in particular, the concepts assimilation and accommodation as described by
Piaget. These concepts provided the basis for a model of leaming which has been refined
and extended by researchers who adopted a constractivist approach to leaming. As these
researchers began to understand more about a constractivist approach to leaming, their
ideas have evolved, placing more emphasis upon the influence that prior concepts
(already possessed by learners) have upon the way new information is assimilated and
accommodated into existing schema.
Vygotsky's work with language development emphasised that leaming is often a social
activity and the social setting in which leaming occurs influences the leaming process.

44
Thus in a situation where computers are used to assist leamers to assimilate new
information it into existing schemata and, where necessary, accommodate their schemata,
we need to be aware that there are many variables that remain hidden. Attempts by
researchers to control these variables are likely to be disappointing. Therefore, instead of
attempting to control variables and follow a so called 'empirical' research paradigm,
researchers may find it more rewarding to recognise that they cannot control all of the
variables and instead use a 'naturalistic' research paradigm so that we can develop a more
detailed understanding of the leaming processes involved in this context.
Part 2 : Learner processing of information in graphs and
tables
The purpose of Part 2 of this chapter is to examine research that describes how leamers
process and assimilate new information into their schemata. The general principles that
emerge from this research are then used to assist in the process of designing of cognitive
tools that assist leamers to process information presented in the form of graphs and
tables. These findings will be apphed to the design of the cognitive tools.
Features of cognitive tools that support learner processing of
information
Cognitive tools "are generalisable tools that can facilitate cognitive processing "
(Jonassen, 1992b, p.2). They are both cognitive and computation support devices that
guide and extend the thinking processes of the users. Such tools are external to the
leamer: they are computer-based devices that extend the thinking processes of the leamers
and are designed to engage the leamer in meaningful processing of information.
Cognitive tools engage the generative leaming process which occurs when leamers
assign meaning by relating current information to prior knowledge (Wittrock, 1974).
This results in deeper information processing because: the leamer activates appropriate
schemata; uses them to interpret new information; assimilates new information back into
the schemata; reorganises them in the light of newly interpreted information; and then
uses those revised schemata to explain, interpret, or infer new knowledge.
A cognitive tool such as a concept map creation tool allows students to leam with
information processing technologies as opposed to leaming of them. Hence, they

45
facihtate the leamer's cognitive processing. They are leamer controlled and not teacher or
technology driven and are designed to reduce information processing, making a task
easier for leamers (Jonassen, 1992a, 1966)
Cognitive tools are based upon constractivist epistemology. They augment thinking and
facilitate knowledge constraction. Therefore, they can be thought of as constractivist
tools. As Jonassen (1992a) states "cognitive tools are constractivistic because they
actively engage the leamer in the creation of knowledge that reflects their comprehension
and conception of the information rather than focusing on the presentation of objective
knowledge" (p.5).
However, it is not reasonable to assume that all knowledge should be personally
constracted by leamers. Socially constracted reality plays a very important role in all
societies and important procedures such as road rales and laws could not operate unless a
socially constracted reality existed. Complete idiosyncratic knowledge constractions
would result in chaos. Therefore, knowledge should to some degree be personally
constracted, but also socially shared.
Strategies that help learners to process information
Every moment we are exposed to large amounts of information; however we do not
suffer from information overload because we select the information which we regard as
important and ignore that which is not. Our memories can only receive, process, store
and retrieve a finite amount of information (Clark & Taylor, 1994; Yates & Moursund,
1989; Miller, 1956; Simon, 1974). Tt is likely, then, that graphs and tables that contain
large amounts of information will be difficult to interpret.
Research suggests that the general strategies discussed below assist leamers to process
information provided in the form of text and graphics. These strategies are described
under the headings of:
• linking new information to existing schema;
• helping leamers to transfer prior leaming to new situations;
• the use of metacognitive stiategies;
• strategies that can reduce leamer cognitive load;

46
• catering for differences in the way leamers process information.
A conceptual model of human memory may help researchers to visualise and understand
how the processes of assimilation and accommodation occur and this model may act as a
source of ideas for the design of cognitive tools provided to assist leamers in this
process.
Figure 2.2 shows a model of how information may flow in short and long-term memory
registers (After Gagne, 1987). The model can be seen in terms of a computer
information processing metaphor (Gagne, 1987). In particular inputs are stored and
processed by three different kinds of memory: short-term memory, working memory and
long term memory.
Figure 2.2: A model of the structure of human memory (after Gagne, 1987)
Sensory registers Short-term memory Primary memory storage
I Working memory Rehearsal
Matching for recognition
Integration of the new with the old
Long-term memory Episodic Memory Space-time events
Semantic Memory propositions meanings rules procedures organised knowledge
Short-term memory receives information coming to the leamer through the senses. It
stores limited amounts of information for a fairly short time interval. Single items stored
in short-term memory die away after about 20 seconds (Peterson, 1959, pp.193-198),
and researchers considered the capacity of this form of memory to be seven plus of minus
two items (Miller, 1956; Simon, 1974). However, a phenomenon known as 'chunking'
makes it possible to store familiar words or letter combinations as meaningful groupings
(Simon, 1974; Clark & Taylor, 1994; Gagne, 1987) and this extends the capacity of
short term memory.
Working memory compares incoming uiformation with previously stored information (in
long-term memory), retiieved to working memory so tiiat it is "matched" and recognised

47
(Carpenter & Just, 1989). This kind of memory also combines or integrates new material
with an organised set of existing knowledge (schema) retrieved from long-term memory.
Another function of working memory is rehearsal which permits initially encoded
material to be retained over a longer period of time.
Many researchers claim that humans have two types of long-term memory that assist
them in learning: episodic memory and semantic memory, as shown in Figure 2.2
(Tulving & Donaldson, 1984). Episodic memory receives and stores information about
time dated episodes or events as well as spatial relations among events, while semantic
memory is necessary for the understanding and use of language. It is a mental thesauras
of organised knowledge that a person possesses about words and other verbal symbols,
meanings referents and relationships between concepts, terms, and rales. Tulving (1972)
perceived these forms of memory as two interdependent information processing systems
that selectively receive, retain, retrieve and transmit information. Holley and Dansereau
(1984) also saw these forms of memory as interdependent when he discussed the
development of spatial leaming strategies that rely on episodic memory and semantic
memory.
It is assumed that the semantic memory stractures of leamers process information in
accord with hierarchically schemata (Bransford & McCarrell, 1974) and leaming . }S a
reorganisation of these knowledge stractures (Jonassen, 1988). For example, a schema
for an object, event or idea is comprised of a set of attributes such as the associations that
an individual forms around an idea (eg firetrack such as red, hoses, fireman, siren). Our
knowledge stracture consists of schemata for all of these attributes, so that schemata are
said to embed within each other. Such schemata are viewed as interconnected and
overlapping.
Each schema we constract represents a mini-framework on which to interrelate elements
or attributes of information about a topic into a single conceptual unit (Norman, Gentier
& Steeves, 1976; Lindsay & Norman, 1977). These concepts are all arranged in a
network of relationships known as a semantic network. While this theoretical model has
been useful in providing a framework for studies of prose processing where the
activation of appropriate existing schema facilitates comprehension and recall (Bransford

48
& McCarrell, 1974), it is not precise enough for accurate prediction in varied education
settings.
Because our semantic networks represent our knowledge stractures and the schemata in
our semantic network are linked together by way of various associations, leamers can
combine ideas, infer, extrapolate, or otherwise reason from them. Probably the most
universally accepted method of modelling semantic networks is the "active stractural
networks" (Quillian, 1968). Stractural networks are composed of nodes (schemata) and
ordered, labelled relationships (links) connect them (Norman et al., 1976). These
networks describe what the leamer knows, providing the foundations for leaming new
ideas, thus expanding the learner's semantic network. In this view, then, leaming
consists of building new stractures by constracting new nodes and interrelating them
with existing nodes and with each other (Norman, 1976). The more links that can be
formed between existing knowledge and new knowledge, the better the information will
be comprehended, and the easier leaming will be. Therefore leaming is seen as
reorganising the leamer's knowledge stracture, but such reorganisation is not a random
or haphazard event; it is purposive. This view is similar to the Piaget's descriptions of
assimilation and accommodation. In Piaget's words, "...no behaviour, even if it is new
to the individual, constitutes an absolute beginning. It is always grafted onto previous
schemes and therefore amounts to assimilating new elements to already constracted
stractures" (Piaget, 1976, p. 17).
When a student acquires knowledge from an instractor, the newly acquired knowledge is
"grafted" onto previously help schemata. Empirical evidence has demonstrated that
during this process, the leamer's knowledge stracture begins to resemble the instractor's
(Shalveson, 1974; Thro, 1978). Thus leaming may be conceived as the mapping of the
subject matter knowledge (usually that possessed by a teacher or expert) onto the
leamer's knowledge stracture. Von Glaserfeld (1995) asserts that this cognitive change
takes place when the leamer's existing schema fails to produce an expected result in a
given situation and an alteration or accommodation occurs in order to maintain or re
establish equihbrium.

49
Linking new information to existing schemata
Leamers need help to link new information with prior knowledge so that the new
knowledge becomes embedded into existing schema (Clarke, 1992; Gery, 1989;
Jonassen, 1988; Hannafin, 1989; Kenny, 1993; Bonner, 1988; Holley & Dansereau,
1984). Strategies are needed that assist instractors to probe the cognitive stracmres of
leamers, and help them to map their existing knowledge stractures. Such strategies
should make it easier for instractors to plan leaming experiences that help leamers to re
organise their knowledge stracture in order to assimilate the new information and if
necessary accommodate their schemata. Computer-aided leaming strategies are possible
ways of supporting both instractors and leamers in these tasks, and hypertext, in
particular, shows promise.
For the purposes of this study "the term hypertext refers to both textual and non-textual
systems, single medium and multimedia: no distinction is made between hypertext and
hypermedia."(Hammond, 1991, p.l50). Computer software that is hypertext-based
makes use of the node and link model to create a leaming environment that is similar to
the way that human memory is organised (Nelson, 1981). Price (1991) proposed that
such leaming environments should assist leamers to form nodes and links that match
their own semantic network. He described these "associative links" as basic cognitive
processes that allow the human brain to store and retrieve information quickly and
intuitively.
The strategies for leamer information processing that follow suggest ways that leaming
can be organised to enhance "associative links" or semantic memory. These models
consider depth of processing (including top-down/ bottom-up processing) and
reorgaiusation of the stimulus material presented. They have been applied to text and
diagrams, but there may be some transfer of tiiese stiategies to graphs and tables.
Depth of processing
Craik and Lockhart (1972) suggest tiiat tiiere are two levels of information processing,
surface processing associated with the physical characteristics of the stimulus (eg.
brightness, lines, angles) and deeper processing which is concemed with the semantic
aspects of the stimulus. They suggest that the durabUity of memory depends on the level

50
of processing. However their model has been criticised as an oversimplification, with
dispute over the criteria used to distinguish the two levels of information processing
(HoUey & Dansereau, 1984).
Another approach is to use what is known as top-down and bottom-up processing. The
effect of top-down information processing is to engage the leamer and create expectations
about the material to be presented. It is claimed that leaming is enhanced when the
leamer is provided with an advanced organiser and an overview of the stimulus material
to be presented can be considered as one example (Ausubel, 1960; Ausubel & Youseff,
1963; Clarke, 1991; Kenny, 1993; Mayer et al., 1984; Mayer, 1980, 1976, 1975).
Bottom-up information processing assumes that the learning of new information is
affected by the properties of the stimulus material presented. The leamer will attempt to
reorganise the information presented into a form that can be assimilated by his/her
existing schemata.
Both models have been applied to learning strategies that enhance the processing of
information from text (Lindsay & Norman, 1977; Rigney & Munro, 1977; Rumelhart,
1977). However, the research findings are not conclusive and these models may be
oversimplifications as a dialectic exists between these types of information processing
(HoDey & Dansereau, 1984; Kolb, 1984; Salomon & Perkins, 1989). Another reason
may be that the two types of information processing are merely subsets of a more general
sttategy.
Reorganisation of information into spatial networks
Holley and Dansereau (1984) claim that "if network representations are the most adequate
model of human knowledge available, then presenting information in the form of a
network will be the most adequate parallel to the knowledge presented in the text."
(p.25). Jonassen (1996) argues that it is the process of network constraction rather than
the final representation that benefits leamers most of all as it requires leamers to identify
important concepts in a content domain, to hnk them, and to articulate these links. While
it is not an easy process for novices, he claims that this process "mirrors to some degree
the natural pattem of knowledge acquisition" (p.98).

Please see print copy for image

52
(comprehension and memory strategies). Secondary support stiategies maintain a
suitable cognitive climate and examples are concentration and motivation strategies
(Holley & Dansereau, 1984).
The key feature of these primary support strategies are their use of spatial or graphic
properties and nodes to represent concepts and lines, or arcs to represent relationships
between concepts. Whilst a variety of strategies have been proposed, they have common
features which involve the use of a set of related conventions or symbols to label
concept(s). The stiategy employed during this study was concept mapping.
Concept maps
The term "concept map" has been used by many authors to include the types of maps
previously described (Fisher et al.. May 1990; Marguhes, 1991; ; Novak & Gowin,
1984; Heimhch & Pittelman, 1986; Clarke, 1991; Harlen et al., 1990; White &
Gunstone, 1992; Tobin et al., 1994).
In the context of this study concepts represent "anything that can be recognised, that is,
that can be attributed identity" (Holley & Dansereau, 1984, p.23). Thus ideas, objects,
images, notions, conceptions, beliefs, events, features, properties, and states are
examples of concepts. What is commonly referred to as "having a concept" involves the
performance of a combination of generalisation and discrimination behaviour such as
classifying correctiy any examples of the concept and not including any non-examples,
however similar they may be.
Often children and adults will revert to concrete examples in order to clarify new
concepts. During acquisition leamers identify important concepts/ideas in the material
and represent their interrelationships and stracture in the form of a network map
(Armbraster, 1979; Goetz & Armbraster, 1980; Holley & Dansereau, 1984; White &
Gunstone, 1992). The result is a stractured two dimensional map representing the spatial
organisation of the original text. White and Gunstone (1992) claim that the writing of
links is cracial (p. 18) and that without links the concept mapping technique is of littie
value. Jonassen (1996) and Hyerle (1996) also agree with White and Gunstone's claim
and agree with the view that leamers should be encouraged to add paraphrasing and
diagrams to the maps they constract (Holley & Dansereau, 1984). However, White and

53
Gunstone (1992) claim that students find this "the most irksome task ... and would skip
it if they could" (p. 18). Jonassen (1996) provides a possible explanation for this when
he suggests that the process of articulation of links "requires leamers to search through
the range of possible relationships in order to define the relationship that exists in the
context..." (p.98). It is the cognitive challenge of the task that may explain why students
find it "irksome".
Therefore it is important that the instractor models the process of concept map creation to
students, and provides assistance that can be in the form of named links, stractured
hierarchies, chains, or clusters of concepts. In particular the instractor needs to model
and articulate his/her thought processes as the links are described. Researchers suggests
that a period of direct instraction is necessary before leamers can successfully employ
this process (Harlen, 1992; Hyerle, 1996; Jonassen, 1996; White & Gunstone, 1992).
For adult leamers they recommend one to two hours of initial instraction. White and
Gunstone (1992) recommend the following six steps when concept maps are introduced
to leamers (p.29):
1. begin with a simple topic, familiar to students so that it is easier for them to
concentrate on (or become engaged in) the leaming process. Ensure that a
small number of terms are involved;
2. model the constraction of a concept map to the class. This can be done with
an overhead projector or computer with projection facilities;
3. encourage students to think of all possible hnks and to write down the nature
of each hnk;
4. it is unlikely that students will produce good maps on their first attempt -
their first attempt will be an approximation. Provide constractive criticism;
5. you may provide a suggested layout the first time, but it is important to
remove these prompts from subsequent maps and allow the leamer to take
responsibility for the maps they produce;
6. help students that there is not single correct answer to the task.

54
Similar suggestions are made by Novak & Gowin (1984), Harlen, Macro, Schilhng,
Malvem and Reed. (1990), and Hyerle (1996). White and Gunstone (1992) also suggest
that "there are several discrete steps that students should go through in producing a
concept map" (p. 16) and they have summarised this as a procedure. They recommend
that students need to manipulate the position of concepts in a two dimensional space.
Students also need to establish links between concepts that can be easily changed. Hence
a set of cards is recommended for use as concept labels and pieces of string for the links.
These are arranged on a large sheet of cardboard and then attached with sticky tape. The
relation between concepts is then written next to the links. Computer technology can be
used to replace cardboard and string as concepts and hnks can be easily manipulated on a
computer screen. Furthermore, the final printed product fits on to one or two pages.
Instructing learners to construct concept maps
The model presented in figure 2.3 (Camboume, 1988, p.33) is a theoretical model
that suggests how we could instract leamers to constract concept maps. Several
other models also apply but this one was chosen because: it is a holistic model; it
includes many of the strategies already mentioned; and it recognises the importance
of leamer-to-leamer and leamer-to-instractor interaction in the process.
While Camboume applied the model to text hteracy, his model is apphcable in the
context of this study because the constraction of concept maps relating to text, tables
and graphs involves text and graphic literacy. Camboume uses the terms immersion,
demonstration, expectation, responsibihty, employment, approximation, to describe
the key components of his model. These components are not necessarily sequential
and learners may move back and forth as the situation demands, and a later version
(Camboume, 1995) shown in figure 2.4 tries to capture this notion and to make the
model broader, deeper and more inclusive.
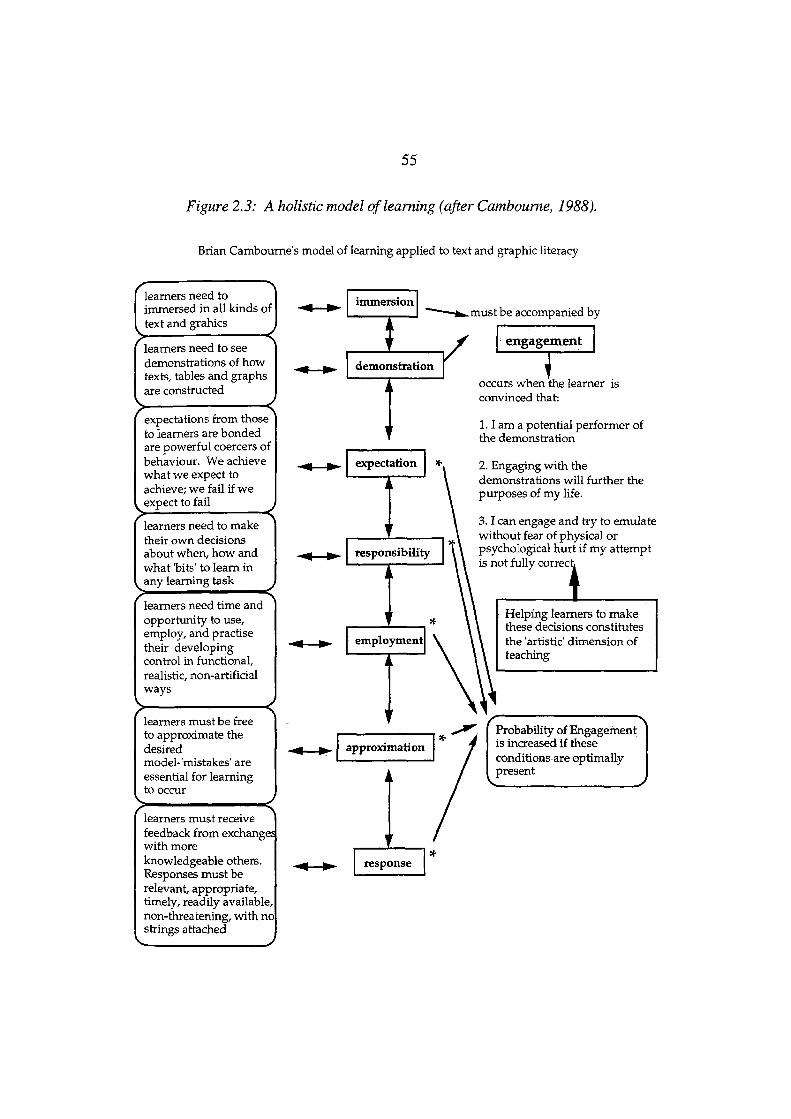

56
Figure 2.4: A model of classroom literacy (after Camboume, 1995)
Classroom Context
The key concept in Camboume's model is that of engagement. He maintains that leamers
become engaged in their leaming when they are convinced that they can perform a
demonstrated task and that this task has relevance in their life. Leamers need to feel that
if they take risks in leaming a new skill they will not suffer any adverse physical or
psychological consequences.
Immersion. The term immersion is used in the model to describe the exposure to
language that leamers receive in then young hfe. Camboume (1988) points out that what
the leamer is immersed in should be "whole, usually meaningful and in a context which
makes sense or from which sense can be constraed" (p.34). It follows that, if this model
is adopted, graphs and tables also should be presented as a meaningful whole rather than
as isolated entitles. Unfortunately, the graphs and tables found in many texts are not
explicitiy linked to the text and they are not easy to interpret (Janvier, 1978; Preece,
1985). Thus the graphs and tables are seen as an adjunct to rather than part of the whole
presentation.
Please see print copy for image

57
Two approaches can be taken to make graphs and tables more accessible to leamers, one
is to improve the way they are presented in text m order to make it easier for the leamer to
link it to the context, and Chandler and Sweller's (1991, 1994) research about cognitive
load theory makes suggestions about how such information can be stracmred to reduce
cognitive load so that the assimilation into the leamer's schema is more efficient. The
other approach is to provide the leamer with a cognitive tool that assists them to integrate
the information provided in the graphs and tables into a meaningful whole. During this
study concept mapping was employed as a strategy to help leamers integrate information
presented as text, graphs and tables. The process of concept map constraction should
encourage leamers to process information presented in graphs and tables and then make
links with the associated text. This strategy may encourage the leamer to become
immersed in the total meaning of the information, rather than in discrete parts of it.
Demonstration. Camboume (1988, p. 34) describes two forms of demonstration,
actions or artefacts, and he believes that "demonstrations are the raw material of nearly all
leaming, not only in language". This view concurs with those presented previously, but
Camboume adds the caveat that before leaming can occur, a process called 'engagement'
is needed (Smith, 1981). While all leamers are exposed to thousands of demonstrations
each day, most just wash over them and are ignored. Learning only occurs when
engagement occurs and Camboume (1988) claims that this happens when the following
criteria are met:
1. the potential leamers see the demonstration as achievable and themselves as
being able to do it;
2. the demonstration witnessed will somehow serve some future purpose in
their hves;
3. when they attempt the demonstration there will not be any unpleasant
consequences.
It can be seen that there is a parallel between Camboume's ideas about engagement and
the suggestions by White and Gunstone (1992) about how to intioduce concept maps to
leamers.

58
Expectation. "Expectations are subtle and powerful coerces of behaviour",
(Camboume, 1988, p.35). They can be viewed from a number of different perspectives.
In one sense they can refer to the expectations that the leamer has about himself as a
leamer or they can refer to what 'significant others' convey to the leamer. Smith (1981)
argues that young leamers in particular beheve that they are capable of leaming anything
until they are convinced otherwise. Thus expectation can work for or against leaming.
In the context of this study the leamers need to have an expectation that the concept
mapping procedure would help them to interpret text, graphs and tables, and that it had
application in a variety of contexts that are meaningful to their lives. During this study
the researcher provided a period of direct instraction and demonstration of concept
mapping strategies which were designed to provide leamers with an expectation that they
were capable of using the cognitive tools.
Also the early instractional experience was planned around the task of planning a unit of
instraction in science that would be taught to a class later in the year. It was anticipated
that this task would be seen as relevant to the preservice teachers involved and the
process would be viewed as one that would support their skills in the planning of
instraction. Furthermore, a study reported by Roth (1994), found that experience with
the process of planning instraction helped teachers to develop more open-ended enquiry
techniques in science.
Responsibility. The responsibility for supplying demonstiations and for providing the
climate for demonstration lies with the instractor. However, leamer responsibility also
has two levels: firstly, (s)he is expected to become proficient in the total task; and
secondly, (s)he is expected to make the decisions about the most useful aspect with
which to engage from the current demonstration. Camboume (1988) believes that once
we take this responsibility away from the learner, and attempt to predetermine the
learning process, we comphcate the learning process and fragment it.
When teaching students to constract concept maps, White and Gunstone (1992) suggest
that teachers provide a demonstration of a possible layout the first time. In subsequent
lessons they should remove these prompts and help students to realise that there is not a
single correct answer to the task. This approach is supported by Camboume's (1988)
59
descriptions of how to approach demonstrations to leamers and to develop learner
responsibility for their subsequent use of these demonsttations.
Employment. Leamers need time and opportunity to use, employ and practise in a
non-artificial way. They need to have time and opportunity to work with others as well
as time alone to use what they have been leaming. When instracting leamers to constract
concept maps it is important to recognise that leamers will need time to work with peers
and to work alone. Researchers such as White and Gunstone (1992) and Harlen (1992)
mention the need for this to occur when leamers are instracted in the constraction of
concept maps.
Approximation and feedback. It is claimed by Camboume that the willingness to
accept approximations "is absolutely essential to the processes which accompany
language leaming" (p.38). When he models "leaming to mean" procedures he claims that
a cycle of hypothesise, test, modify hypothesis and test again occurs. Such a cycle
occurs in many leaming situations and can be applied to the teaching of the constraction
of concept maps. As leamers need time to use and re-use a newly developed skill, it is
necessary to provide ample opportunity to practise new skills. During this phase of
'use', leamers need to receive feedback about their performance. Camboume (1988)
prefers to call this 'response' as he feels that the term 'feedback' has behavioural and
mechanistic overtones. Such an approach is also recommend by White and Gunstone
(1992) when they discuss teaching children to constract concept maps.
During this study Camboume's model of leaming guided the stiategies employed when
leamers are instracted to create concept maps with a concept mapping tool. These
strategies arise from the "principles of engagement" displayed in figure 2.3 (Camboume,
1995). He discovered that when these principles are consciously employed by
instractors, the probability of increased leamer engagement with demonstrations
dramatically increased. In Piagetian terms these principles can be thought of as providing
optimal conditions for leamer assimilation of new information or the leamer is able to
engage "in goal-directed action" (von Glaserfeld, 1995).
Camboume uses the terms transformation, discussion and reflection, and application
which together describe in Piagetian terms the processes involved in accommodation. He
60
believes that all of these processes are interwoven and interact with each other.
However, we need to be aware of what these processes are in order to provide optimal
conditions for leamer accommodation. Transformation is the part of this process that
occurs when leamers take something demonstrated by another and make it part of their
own understanding and/or skills. For example, a leamer may express some knowledge
or concept in their own words while closely approximating the core meaning.
Camboume's research suggests that the process of transformation is enhanced through
discussion with others, and older leamers, like younger counterparts, "need a myriad of
opportunities to interact with others in order to clarify, extend, refocus, and modify their
own leaming" (Camboume, 1995, p. 188). He asserts that "leaming, thinking, knowing
and understanding are significantly enhanced when one is provided with opportunities for
'talking one's way to meaning,' both with others and with oneself (p. 188).
Application involves problem solving and Camboume suggests that there is a
multilayered relationship among application, discussion/reflection and transformation
when two or more persons are collaborating in solving a problem. This involves
discussion and transformation often occurs as a consequence of discussion. Such a
process of tiansformation leads to the constraction of new understanding or knowledge,
or the mastery of new skills. Finally, the new knowledge can be reflected upon and
further transformed. Such linguistic interactions are described by Piaget as the most
frequent cause of accommodation (von Glaserfeld, 1995, p.66).
Applying spatial learning theory. Spatial leaming theory advocates a strategy that
breaks up the process of comprehending text and diagrams into small manageable parts
that focus on processing of specific features (eg. labels, diagrams, text). It then focuses
on improving specific leamer skills associated with these parts. Then the leamer re-
combines the information into a semantic network, summary or concept map. Whilst the
strategy cannot make up for lack of essential knowledge, advocates claim that it does
allow the learner to make more efficient use of his/her current knowledge (Holley &
Dansereau, 1984). Six steps tiiat constitote tiie stiategy are:
• select key concepts. This is a recognition process that activates relevant
knowledge, and assists in topic identification;

61
write the key concepts;
make an attribute hst of the key concepts;
relate key concepts in a spatial relationship;
rearrange spatial representations;
compare representation to the text.
There is a similarity between these steps and those recommended by White and
Gunstone (1992). In this study the first five steps recommended by Holley and
Dansereau (1984) were combined with those recommended by White and Gunstone
(1992) to guide the design of the concept tools. The cognitive tool developed
consisted of the six elements shown in Figure 2.5.
Figure 2.5: The design of the concept mapping tool
vO^ Concept Tools iiii: iiii
concept
eraser
h^link 1
help
a
The six buttons on this palette will have the following functions:
• concept allows the user to type concept labels and to move these labels
in two dimensional space;
• link allows the user to draw link arrows between concepts. Arrows
indicate the direction of these links;
• note allows the user to attach explanatory notes to the links or concept
labels;
• eraser aUows the user to correct mistakes;
help provides access to a simple help screen;
print allows the user to print out the concept map and the notes.

62
Uses of concept maps. Six uses have been identified by White and Gunstone (1992)
and these are:
to explore understanding of a lunited aspect of the topic;
to check whether leamers understand the purpose of instraction;
to see whether leamers can make links between concepts;
to identify changes that leamers make in relationships between concepts;
to find out which concepts are regarded as key ones;
to promote leamer discussion.
Jonassen (1996) expresses these ideas in a different way when he asserts that "the
process of creating semantic networks engages leamers in an analysis of their own
knowledge stractures, which helps them to integrate new knowledge with what they
aheady know" (p.95).
In this study the purpose of the computer-based concept mapping tool will be similar to
those proposed by Jonassen (1996, p.95). He proposed that such tools could be used by
learners to: reorganise knowledge; explicitly describe concepts and their
interrelationships; encourage deeper processing of knowledge; relate new concepts to
existing concepts, and spatially represent concepts that summarise the topic they are
studying.
Mapping does have limitations and there has been dispute over the long-term benefits of
this strategy (Armbraster, 1979). White and Gunstone (1992) claim that mapping
appears to be best suited for probing understanding of a whole discipline or a substantial
part of it. However Armbuster (1979) claims that mapping is hmited in its apphcation as
it doesn't give a "big picture" of a domain of knowledge. Advocates such as Heillich and
Pittelman (1986) assert that it is a very good device to use to find out how leamers link
ideas, or how they see the stracture of a large topic. Others argue that while concept
mapping is a useful tool, it is still just another sfrategy, and even strong advocates of
concept mapping concede that if it is over-used, it becomes less effective (White &
Gunstone, 1992).

63
One assumption made is that concept maps are reasonable representations of cognitive
stracmre (Holley & Dansereau, 1984). In a study that compared pattem notes to free
word association structures Jonassen (1987) found that the underlying stractures in
concept maps were virtually identical to those in the free association tasks. However,
they are not trae maps of a learner's knowledge stracture; instead they are a
representation of the leamer's knowledge stracture (Jonassen, 1996). Furthermore the
propositional networks that exist in the mind are likely to be far more complex
(multidimensional) than can be represented by a concept map.
Another assumption is that the process of creating a concept map engages leamers in an
analysis of their own knowledge stractures and this will help them to use knowledge
more frequently. Jonassen (1992a) argues that the process of concept map constraction
aids leaming by requiring leamers to analyse the underlying stracture of the ideas they are
studying. In other words organised information is more memorable. Like White (1992),
Jonassen (1992a) believes that " if semantic networking is to be maximally effective,
leamers need to interpret the clusters and dimensions of their map as well as build them"
(p.20).
It is difficult to use concept maps to clearly represent causal relationships without
attaching explanatory notes. Such a feature was added to the concept mapping tool used
during this study because it was anticipated that such a feature may make it easier for
leamers to explain causal relationships.
Critics of concept mapping claim that it describes only declarative knowledge and
therefore can only benefit memory processing, but research by Gordon and Gill (1989)
has shown the central role of these knowledge stractures in problem solving. Others
such as Jonassen (1996) and Diekhoff (1983) share this view and they argue that concept
maps represent an intermediate type of knowledge which has been called stractural
knowledge. Stractural knowledge is knowledge of how the ideas within a domain are
integrated and interrelated (Diekhoff, 1983), and this knowledge aids the articulation of
both declarative and procedural knowledge.

64
Additional strategies that help learners to process information
Research related to spatial strategies in processing and remembering text showed that
students leam and remember more from text when they employ one or more of the
following strategies:
• study the text in a deep and meaningful fashion;
• form mental images;
• constract an organised interrelated representation of concepts;
• bring to bear appropriate knowledge and incorporate the new information
with what they know;
• process the material initially in a manner compatible with testing conditions;
• actively monitor and regulate their studying process (metacognitive
processes) (Bean et al., 1986; Flavell, 1987; Li, 1993; Jo, 1993; Holley &
Dansereau, 1984; Balajthy, 1990; Claxton & Hurrell, 1987; Goetz &
Armbraster, 1980; Craik & Lockhart, 1972; Wittrock, 1990; Anderson,
1972; Anderson and Kulhavy, 1972; Reder, 1978).
These steps focus on development of leamer skills in processing text or graphics, but an
equeilly important sttategy is to design the instractional material so that it is easier for the
leamer to process. Whilst the learner is the focus, it needs to be acknowledged that
focusing on the leamer alone only looks at part of the leaming process. The organisation
and delivery of the information also needs to be considered as this can enhance cognitive
links that promote the tiansfer of prior leamer knowledge to a new simation. Cognitive
tools have the potential to assist leamers in the transfer of prior learning to new
situations.
Helping learners to transfer prior learning to new situations
Salomon and Perkins (1989) define leaming as something that leads to a later
performance which we identify as more or less the same, whereas tiansfer is more likely
to be mentioned when leaming has a side effect that we were not perfectiy confident tiiat
it would have (p.l 16.). There are plenty of research data to suggest that leamers need

65
help to tiansfer prior knowledge to the context of a problem with which tiiey are currentiy
dealing (Mayer, 1980; Weingrad, Hay, Jackson, Boyle, Guzdial, Soloway, 1993;
Huberman, 1990; De Corte, 1990; Hannafin, 1989).
Salomon and Perkins (1989) argue that tiansfer of leaming is not a unitary phenomenon
and that there are altemative transfer paths and many different sets of conditions. This,
they believe, would explain why research results are likely to vary. Their research
suggests that transfer may be enhanced when leamers are provided with a variety of
pathways to follow. Since cognitive tools are capable of providing learners with a variety
of leaming pathways, they may enhance transfer.
Low-road transfers (Salomon & Perkins, 1989) occur when a performance is
unintentional, implicit, based on modelling, and driven by reinforcement. They define
the "amount of tiansfer" as how much improvement occurs and the "distance of transfer"
refers to how closely the tasks are related. Their research suggests that low-road transfer
affects the amount of transfer but has a much smaller effect on the distance of transfer.
The mechanism for low-road transfer is practice with related tasks which leads to
automation. Drill and practice software is an example of a computer-based leaming that
relies on low-road ttansfer.
High-road transfer involves a greater distance of tiansfer because knowledge and skills
are abstracted from their present context and reapplied in a new context. This form of
transfer relies on the mechanisms of abstraction and mindfulness. Abstraction is a
process that involves a variety of information processing manoeuvres, whilst
mindfulness is the volitional, metacognitively guided employment of non-automatic
processes, typical of deeper processing, and conscious manipulation of the elements of
one's envkonment. Such a process is more difficult to achieve through instraction and it
is not surprising that the researchers are interested in improving this form of transfer
through metacognition.
Computer-based applications which support transfer through deeper processing and
conscious manipulation of information have been called mindtools (Jonassen, 1996).
Also some have been called visual tools (Hyerle, 1996). Mindtools are "computer
applications that require students to think in meaningful ways in order to use the

66
application to represent what they know" (Jonassen, 1996, p.3) and include databases,
spreadsheets, semantic networking tools, expert systems and computer-mediated
communication systems. Visual tools are tools that Jonassen calls "semantic networking
tools" and can be considered a subset of mindtools.
The use of metacognitive strategies
Jo (1993) describes metacognition as "... cognitions about cognitions or the executive
decision making process in which the individual must carry out cognitive operations and
oversee his/her progress" (p.416). Figure 2.6 represents the components of
metacognition commonly agreed upon by most researchers.
Figure 2.6: Components of metacognition
Metacognition
^
Knowledge of
ZX
Regulation involves
Personal cognitive resources
Task requirements Planning Revising
Monitoring
Flavell (1987) suggests that metacognitive knowledge can be divided into three
categories: knowledge of person variables; task and strategy variables; and regulation.
Person variables refer to the kind of knowledge and beliefs that concern what humans are
like as cognitive beings (affective, motivational, perceptual); a leamer may believe that
(s)he is good at dealing with numerical information, but poor at verbal tasks. Task
variables relate to how the nature of the information encountered affects and constrains
the ways leamers to deal with it. For example, a leamer will have to take more time to
process densely packed information. Stiategy variables are used to achieve more than
just to reach the cognitive goal or subgoal; a leamer may employ a cognitive strategy to
compare a series of numbers displayed on a computer screen, but a metacognitive
strategy would be to use a sorting tool to rearrange the numbers so that the task was

67
easier to perform. Thus metacognitive strategies are self-regulated, conscious
experiences that are cognitive and affective; any kind of conscious affective or cognitive
experience that is pertinent to the conduct of intellectual life is a metacognitive experience.
Person, task and strategy variables interact and we need to understand these interactions
(Flavell, 1987). Furthermore, personal growth in metacognitive strategies is often
related to an ongoing experience and it needs to be recognised that leamers need time and
experience to better regulate their cognitive processes (Flavell, 1987).
Many studies have reinforced the notion that leamers can conttol and direct their mental
processes if they are provided with cognitive and metacognitive support (Flavell, 1987;
Flavell, 1976; Li, 1993; Holley & Dansereau, 1984; Jo, 1993). During information
processing metacognitive guidance plays a major role, a process during which Salomon
and Perkins, (1989) claim that "mindful abstraction" occurs: metacognitively guided and
effortful abstraction of information. Cognitive tools can support this process; "mindful
abstraction" and concept mapping tools are one example. Moreover, findings from
metacognition research suggest that the development of skills in metacognition will not
only help learners to process information, but to transfer these strategies to new
situations (Salomon & Perkins, 1989).
Strategies that can reduce learner cognitive load
In any leaming situation, whether computer-managed or human-managed, cognitive
overload is likely to occur when the total cognitive demand of the task is beyond the
leamer's current abihty to process the available information. It is important, therefore,
that leaming or the environment be stractured to reduce this effect. Active self-regulation
and purposeful control are needed to keep metacognition active during the leaming
process, but unsupported leamers usually cannot meet these demands and suffer
cognitive overload. Thus, ways to reduce cognitive load associated with the application
of metacognition to information processing need to be explored.
Clark and Taylor (1994) suggest eight ways to avoid cognitive overload in leaming
situations. They suggest that instiiictors should:
• talk less and incorporate the key leaming points into succinct reference notes;
• do less while your leamers do more;

68
• chunk instractional segments and distribute them evenly over the time
available;
• design the layout of workbook pages and on-screen computer presentations
to aid memory;
• design job aids be used as aids to memory during and after training;
• include some drill and practice exercises to achieve automation;
• support the leamer through the provision of "training wheels" that can be
removed when (s)he is capable or achieving the task without support;
• build in strategies that allow the instractor to detect and remedy cognitive
overload during training sessions.
Since most of these suggestions are generalisable, they can be applied in the context of
this study. In particular the strategies of the even spacing of presentations of chunks of
information over time, the provision of succinct printed instractions (help screens), and
the provision of removable support were apphcable to this study.
Another source of cognitive load relates to hypertext leaming environments such as the
one developed during this study. The term 'hypertext' was coined by Nelson (1981) to
describe a combination of natural language text with the computer's capacity for
interactive branching, that created a dynamic display of non-hnear text which cannot be
printed convenientiy on a conventional page. Hypertext software allows users to explore
information in a non-linear and interactive fashion (Barker & Tucker, 1990). The
leaming environments created by hypertext software give the leamer access, via
computer, to graphics, sound, text, video, animation and other leamers. The leamer can
be free to follow his/ her own non-linear path through this environment (Nelson, 1981),
but without navigational support it is very easy for a leamer to become 'lost in
hyperspace' and to be unsure about what information they have covered and how it links
together (Sewell, 1990; Hammond, 1991).
Jo, (1993), Hedberg and Harper, (1991) and Doland, (1989) assert that cognitive
overload in hypertext leaming environments is related to the degree of complexity of the
non-linear leaming environment. Variables such as number of choices, task scheduling.

69
tracking guides and navigation aids overload leamer short-term and working memories
(Jonassen, 1988). Therefore, it is not surprising that researchers propose that hypertext
leaming environments need careful management of the number of user choices in order to
make decision making easier and reduce cognitive load (Liebhold, 1987; Doland, 1989).
Findings from research into leamer use of hypertext systems by various researchers
revealed a number of problems which can occur (Allinson & Hammond, 1990 Jones,
1987; Ferry, Hedberg & Harper, 1996). First, leamers often get lost. The knowledge
base may be large and unfamiliar, the links provided will not be suitable for all
individuals and for all tasks, and the users may be confused by the embarrassment of
choice. Second, leamers may find it difficult to gain an overview of the material. They
may fail to see how parts of the knowledge base are related and may even miss large
relevant sections. Third, even if leamers know specific information is present, they may
have difficulty finding it. A related problem is that of uncertain commitment where the
user is unsure where a link will lead or what type of information will be shown. A fourth
problem arises where minimal guidance or consttaints are provided as leamers are liable
to ramble through the knowledge base in an instractionally inefficient fashion with their
choices motivated by moment-to-moment aspects of the display which attract attention.
Thus a system which gives a multiplicity of choice but the minimum of guidance may not
be ideal. The term navigation has been used to describe most of these problems, and the
section following describes ways that navigation may be managed in a hypertext
environment.
Reducing cognitive load in hypertext learning environments
The less stractured a hypertext leaming environment is, the more likely leamers are to
experience navigation problems (Hammond, 1991). Without an explicit extemal
organisation, leamers find it difficult to integrate what they have leamt into their existing
schemata (Conklin, 1987; Hedberg, 1988; Hedberg & Harper, 1991; Doland, 1989;
Hammond & Allinson, 1991; Underwood, 1988; Tripp & Roby, 1990; Jonassen, 1988).
Stanton and Baber (1992) discusses the effect of navigation upon planning of search
stiategies which are sometimes referred to as cognitive stiategies.
70
Webb (1990) suggests that maps and analogies assist navigation. He found that
performance with the assistance of analogy was superior and supported goal-directed
movement through information. Four elements of successful cognitive maps were
identified: where you are; where you want to be; how to get there, and how to overcome
obstacles. Webb also suggests that users of hypertext may wish to create their own
spatial cognitive map. His suggestion looks at the problem of leamer use of hypertext
from the perspective of the leamer rather than that of the instractional designer.
When we assist leamers to integrate new information from hypertext into theh own
knowledge stractures we need to be aware that the willingness and ability of leamers to
use their own knowledge stractures to assimilate information is dependent on individual
differences such as cognitive ability and leaming styles (Hammond, 1991). Researchers
have argued that we need to find out how to stracture hypertext to replicate content
stractures or knowledge stractures of leamers, and how likely are users to assimilate
these stractures or accommodate to them (Dede, 1990; Barker & Tucker, 1990; Jonassen,
1988; Underwood, 1988). For too long authors of instractional software have been
plagued with problems such as: where should users begin in a hypertext learning
environment; what sort of access stractures are needed to guide the user; and how overt
should navigation aids be (Hammond, 1991). The focus has been upon designing the
hypertext environment to match the ways leamers will want to use the materials. This
could be related to the degree to which the individual is familiar with the environment,
time available, amount of self-direction the individual is motivated to assert, together with
the amount of change occurring in the environment. Because these variables interact, it is
not possible to cater for more than a few sets of circumstances. Jonassen (1992b) argues
that "rather than develop more powerful teaching hardware, we should teach leamers
how to think more efficiently" (p.2). One way of achieving this goal is to develop
cognitive tools that assist leamers to process and stracture information and mindtools
(Jonassen, 1996) and visual tools (Hyerle, 1996) are examples.
Besides navigation, other sources of cognitive load exist. For example, the demands
associated with cognitive processing of information in numerical form have the potential
to create cognitive overload, but cognitive tools such as calculators can help to reduce this
(Doland, 1989; Hammond & Allinson,; Conklm, 1987; Webb & Kramer, 1990; ShueU,

71
1986; Braner, 1966; Franklin, 1988; Hedberg, 1988; Sweller, 1988; Jonassen, 1988).
We need to explore the use of other cognitive tools and part of this study is a contribution
to this field of research.
Sweller (1994) suggests that to reduce cognitive load, instractional designers need to
focus leamer cognitive activity on schema acquisition which is a gradual and incremental
rather than an all-or-none process. When a complex intellectual skiU is first acquired, it
may be useable only by devoting considerable cognitive effort to the process. With time
and practice, the skill may become automatic to the point where it may require minimal
thought for its operation. Then the intellectual performance can attain its full potential.
However, instractional techniques that are not directed at schema acquisition and
automation "frequently assume processing capacity greater than our limits and so are
likely to be defective" (Sweller, 1994, p.298).
Sweller (1994) proposed two general sources of cognitive load that can affect instraction.
He calls these extraneous and intiinsic sources of cognitive load (p.303). Extraneous
sources are artificial because they are imposed by the instractional methods, but intrinsic
sources are not controlled by the instractor. Sweller asserts that the primary determinant
of intrinsic cognitive load is element interactivity. The higher the number of interacting
elements (information that the leamer needs to understand in order to successfully
complete a task), the greater the cognitive load generated. Schemata organise these
elements and, in tum, can act as elements themselves in higher order schemata. That is,
once a schema is acquired and automated, it can act as an element in further tasks.
For any given instractional situation intrinsic cognitive load is fixed and cannot be
reduced, but extraneous cognitive load can be reduced. Extianeous cognitive load may
be less important when the intrinsic cognitive load is low. However when intrinsic
cognitive load is high, the reverse is trae, and when leamers deal with high element
interactivity materials, the combination of high extianeous and intrinsic cognitive load
may overwhelm their limited processing capacity. This may be the case when leamers
attempt to interpret a combination of text, graphs and tables found in many text books.
Cognitive load theory suggests that effective instractional material directs cognitive
resources toward activities that are relevant to leaming. It is concemed with the manner

72
in which cognitive resources are focused and used during leaming and problem solving.
Researchers in the field claim that many leaming procedures engage students in cognitive
activities far removed from the ostensible goals of the task and the cognitive load
generated by these irrelevant activities can impede skill acquisition (Chandler & Sweller,
199, p.294). For example, mental integration of information in graphs, tables and
diagrams in text requires searching for appropriate referents in the graphs, tables and
diagrams or in a set of statements. This can split leamer attention and create additional
cognitive load. If the materials are redesigned to reduce the amount of split attention,
then cognitive load is reduced and this makes the task of mental integration is easier.
The cognitive tools developed during this study will have a positive impact upon the
cognitive load experienced by the leamers and this may relate to the way in which they
are used. In particular, leamers may have preferences for tools that help them to reduce
cognitive load as they process information. Also the tools that leamers prefer to use may
relate to differences in the way leamers process information and this issue is discussed in
the next section.
Catering for differences in the way learners process information
An established history of research suggests that leaming styles influence the ways in
which leamers process information (Dunn et al., 1982; Kolb, 1984; Claxton & Hurrell,
1987; De Bello, 1990; Dunn et al., 1989; Jung. W., 1993; Jonassen & Grabowiski,
1993; Schmeck, 1988; Sims & Sims, 1995). Since most leamers have preferred ways of
leaming, researchers claim that different cognitive (leaming) styles require different
modes of leaming (Romiszowski, 1990; Tyler, 1993; Allinson & Hammond, 1990;
Stanton & Baber, 1992; Jonassen & Grabowiski, 1993). Similarly, Messick describes
cognitive styles as "characteristic self-consistencies in information processing that
develop in congenial ways around underlying personahty tiends" (Messick, 1984, p.23).
For the purposes of this study the terms leaming style and cognitive style are used as
synonyms.
While various systems of leaming styles have been proposed, there are three popular
categories. Curry's (1987) extensive study of 21 leaming style instraments from North
America, Europe and Australia suggests that it is possible to reorganise what these

73
instraments into a three-layer system of categories based upon various leamer preferences
(Curry, 1987). These can be arranged in layers hke an onion. The outer layer is based
upon instractional and environmental preferences; the middle is based upon information
processing preferences and the inner layer is based upon personality-related preferences.
Because this study focuses upon the processing of information, only the categories that
focus upon information processing are discussed.
Table 2.2 summarises the leaming style inventories based upon information processing
preferences.
Table 2.2: Leaming style inventories based upon information processing preferences (Curry, 1987).
Authors
Biggs
Entwise & Ramsden
Hunt
Kolb
Reinert
Schmeck, Ribich & Ramanaih
Schroeder
Inventory Title/ Number of Questions
Study Processes Questionnaire
42 items
Approaches to Studying
64 items
Paragraph Completion Method
6 items
Leaming Style Inventory
12 items
Edmonds Learning Style Identification Exercise
N.A.
Inventory of Leaming Process
62 items
Paragraph Completion Test
5 items
R e l i a b i l i t y & Validity (Curry, 1987)
high reliability
fair validity
good reliability & validity
fair reliability & validity
strong reliability & fair validity
poor reliability & no evidence of validity
The most highly rated
good reliability & fair validity
The inventories in table 2.2 are based upon information processing preferences and relate
to an individual's cognitive approach to the assimilation of information. Of the 7
inventories mentioned the highest rating (based upon reliability and validity) was given to
Schmeck, Ribich and Ramanaih and this was followed by Kolb. Kolb's leaming theory
was adopted for use during this study and is discussed in more detail.

74
David Kolb's (1971, 1984) leaming style inventory arose from his theory of experiential
leaming. This theory draws upon the work of Dewey (1938) who emphasised the need
for leaming to be grounded in experience. Kolb also emphasised the importance of active
leaming and applied some of the ideas of Piaget (1971) who described intelhgence not as
innate but the result of interaction between the person and the environment.
The four step process of experiential leaming proposed by Kolb involves concrete
experience, reflective observations, abstract conceptualisation (creating generalisations
which guide further action), and active experimentation (testing what has been leamed in
a new situation). His inventory of leaming styles identifies a person's preferred leaming
style and places them into one or more of four quadrants shown in figure 2.7.
Figure 2.7: The four quadrants of Kolb's Leaming Style Inventory.
Concrete experience
jRc4ive experimentation
Acconunodator Doing involved impatient people
Quadrant 1
1 1 1 1 1 1
Quadrant 4
Converger Unemotional things oriented people
20 _
18 _
16 _
14 —
12 —
10 — 1 1
1 1 1 1 1 1
Diverger Imaginative emotional people
Quadrant 2
1 1 1 1 1 1 1 1 1 1 1 1
Quadrant 3
Assimilator Conceptual less practical people
Reflective observation
Abstract conceptualisation
It needs to be noted that terms "assimilator" and "accommodator" describe leaming
preferences.
The Leaming Style hiventory (Kolb, Rubin & Mchityre, 1974) was designed to assess a
student's method of leaming. As they take the inventory, leamers give a high rank to
those words which best characterise the way they leam and a low rank to the words
which are least characteristic of their leaming style. Different characteristics described m

75
the inventory are equally good and the aim of the inventory is to describe how students
leam, not to evaluate what they have leamt.
Leamers whose dominant leaming style is located in the first quadrant are described as
"accommodators" who grasp experience through concrete experience and transform it
through active experimentation. They are risk-takers and do well in sitoations where they
have to adapt to new circumstances. Leamers whose dominant leaming style is located in
the second quadrant are described as "divergers" who grasp the experience through
concrete experience and transform it through reflective observation. Kolb claims that
such people are imaginative, generate ideas, and are generally people-oriented and
emotional. Leamers whose dominant leaming style is located in the third quadrant are
described as "assimilators" who grasp experience through abstract conceptualisation and
transform it through reflective observation. They are good at creating theoretical models,
less interested in people more interested in concepts. Leamers whose dominant leaming
style is located in the fourth quadrant are described as "convergers" who grasp experience
through abstiact conceptualisation and transform it through active experimentation. They
quickly move to solve problems.
Kolb's leaming style inventory has stimulated the development of at least 7 variations
(McCarthy, 1987). McCarthy developed a version that was based upon Kolb's model
and she applied Kolb's theory to a complete leaming system known as 4 Mat. She
contends that traditional instraction does not address all leaming styles and this
disadvantages some leamers. The 4 Mat system of instraction is designed to help
instractors to plan systematic instraction that creates a variety of leaming experiences that
will ensure that all leaming styles are catered for during a series of lessons.
Another inventory was developed by Gregorc and Wardm (1977), modified in 1982
(Gregorc, 1982), and updated by DePorter (1992, pp 125-127). This inventory has been
successfully used to ascertain leaming styles by DePorter (1992) and Dry den and Voss
(1994). All of the leaming style inventories discussed are based upon the four
dimensions originally proposed by Kolb: concrete experience, reflective observation,
abstiact conceptualisation and active experimentation.

76
Kolb's leaming style inventory was employed in this study. The instrament has also
been used in research with computer-based concept mapping tools (Kessler, 1995).
Kessler's study examined the relationship between cognitive style (as measured by
Kolb's instrament) and total concept map score (based upon the criteria of Novak and
Gowin, 1984). Kessler found no significant relationship between leaming styles and
concept map scores, but other researchers (Schreiber & Abegg 1991; Reiff & Powell,
1992) reported significant findings in different contexts. For example, Schreiber and
Abegg (1991) reported that the total concept map scores (as measured by Novak and
Gowin's procedure, 1984) were related to the preferred leaming styles of Quadrants 1
and 3 (accommodators, assimilators) as described by Kolb's instrament. The variant
results that Kessler reported may have occurred because the interrater reliability of
concept map scorers was low. A similar criticism could be made of the other studies
because the reliability of the scoring procedure for concept maps has been questioned by
several researchers (Jonassen, 1996; White & Gunstone, 1992; Shalveson, 1993).
A different perspective on leamer preferences for certain types of information was taken
by Bowen (1992). This study examined the way leamers accessed relevant information
chosen to assist them to solve problems. It examined the strategies adopted by leamers
when they could access hints to help them solve problems. The findings showed that
leamers adopted one of the following five strategies. Some were determined to solve the
problem without resorting to hints; others requested a hint after giving the challenge a
good try; another group of leamers pursued a hint only far enough to get an idea and then
proceeded with the challenge (that is smdents exited the hints early); others went fi-eely to
the hints as if they were tutorials to be completed before attempting the challenge; and
finally a few students examined the hints after completing the task to see what
suggestions were made. Bowen claimed that the final strategy could be valuable as it
helped students to formahse and generahse the techniques they employed.
Bowen recommended that students be shown a variety of leaming stiategies when they
leam to solve problems as they may need to employ different approaches when
chaUenged to solve different problems. He also found that inventive students were more
likely to tackle a challenge with vigour if it appealed to them. Also these students were
77
more likely to use trial and error, but they were students who were not the highest
achievers.
Leamer-centred stiategies emphasise methods requiring greater leamer responsibility for
assessing their needs and seeking appropriate information (Wittrock, 1974). While we
can provide cognitive support tools such as menus and indexes to permit access to needed
information, we cannot be sure that the leamer has the ability and the motivation to use
them correctly. More research is needed into the relationship among preferred cognitive
tools, leamer cognitive requirements and cognitive styles.
Another approach was taken by Stanton and Baber (1992) who assert that cognitive
styles are related to a predisposition of behaviour, whereas cognitive strategies are the
translation of predisposition in combination with the multi-factorial environmental
situational social variable. Ferry, Hedberg and Harper (1996) found that they could
identify two cognitive strategies that leamers attempted to apply to a hypertext leaming
environment. These were described as sequential and goal oriented. Sequential users of
hypertext attempt to use the materials in the 'order' that it appears. Goal-oriented users
use strategies to find specific information that they require. Similarly, Stanton and Baber
(1992) identified sequential users of hypertext and found that they wanted to use a
stractured overview screen for navigation purposes. However, they also found that it
may be necessary to provide some initial constraints otherwise this may lead to a situation
of 'taught helplessness' due to an oversupply of information.
Hypertext leaming environments can be designed to cater for various leaming styles, but
a certain amount of judgement is needed by the instractional designer. If the environment
is too organised and only suits a particular leaming style, then individuals who approach
the material from another perspective may be frastiated when they try to assimilate the
materials into their cognitive stracture (Hammond & Allinson, 1991; Jonassen, 1988;
Underwood, 1988; Tripp & Roby, 1990). Also if the learning environment is
unstractured, then cognitive load associated with navigation will reduce its effectiveness.
Applying the research to educational settings
In a society where work is becoming computer based, 'school work' cannot forever
resist the change. Television and video technology already has profound effects on

78
education such as the decline of print culture and the rise of visual culture, low tolerance
for boredom and the loss of innocence for children (Postman, 1992). Already large
amounts of information in digital form are freely available to leamers who have the
hardware, the software and the cognitive skills required to access and search the
information and then manipulate it so that it has personal meaning.
Some leamers have the skills needed to participate in this digital leaming environment,
but others do not and their leaming is at risk. It is not good enough to simply spend
more and more money on hardware and software without addressing the issue of how
computers and their associated software can be used to enhance the process of leaming
rather than just providing access to information. Many homes already possess extensive
sources of information in the form of printed text, radio, television, video, intemet access
and computer software, yet not all the occupants of the home take advantage of these
sources of information. The same applies to educational institutions and if we reflect on
the last twenty years or so of educational computing, then it is likely that we will
conclude that there is little in educational computing that is vital to education as it is
practised in schools. There is a need to integrate hardware and quality software into
schools so that computer-literate teachers and students can become skilful, reflective and
mindful users of information. McKenzie (1996) further expresses this point in the
following statement:
"Unless students have a tool kit of thinking and problem-solvmg skills which match the feasts of information so readily available, they may emerge from theh meal bloated with techno-garbage, information junk food... We must guide our students to become infotectives. What is an infotective? (It is a) student thinker capable of asking questions about data (with analysis) in order to convert the data into information (data organised so as to reveal pattems and relationships) and eventually into insight (information which may suggest action or strategy of some kind)" (McKenzie, Jan./Feb.l996)
The behavioural and cognitive views of leaming discussed earlier in this chapter tend to
support two conflicting views of education: the didactic information-transmissive view,
and the constractivist view which suggests that teachers should be facilitators who help
children constract their own understanding and develop their own abihty to carry out
challenging tasks. These different views of education are likely to influence the way
information technology is used in classrooms.

79
Postman (1992) suggests that there are already three different uses of technology in
classrooms: tools such as word processing, graphing, communication electronic mail;
integrated learning systems that tutor and keep records of student progress; and
simulations and games. He argued that the tools will be developed first because they
allow a great deal of user and instractor flexibility, and later the others will follow.
Salomon, Perkins and Globerson (1991) supported this position and asserted that such
tools mindfully engage leamers in the tasks affordable by these tools. Jonassen (1996)
expressed the same concept when he said "when students work with computer
technology, instead of being controlled by it, they enhance the capabilities of the
computer, and the computer enhances their thinking and leaming" (p.4).
The design and presentation of cognitive tools tiiat facilitate
learner processing of information
The following suggestions come from the models of leamer information processing
discussed previously.
• New information should be compatible with the way the leamer represents
knowledge held in long-term memory. Therefore we need to understand
how the leamer employs his/her schema to represent his/her current
knowledge. Strategies such as concept map constraction may help to reveal
some of the stracture of the leamer's schema (Holley & Dansereau, 1984;
Novak & Gowin, 1984; White & Gunstone, 1992).
• We should require the leamer to process the material in depth. Strategies
such as embedded questions and problem-solving may be needed to ensure
that this occurs (Craik & Lockhart, 1972; Holley & Dansereau, 1984).
• We should provide opportunities for the leamer to produce greater degrees of
elaboration via reorganisation or dual encoding. Concept maps may be a
suitable stiategy for leamers to employ (White & Gunstone, 1992).
• We should provide a reconstractive retrieval mechanism. This could take
forms such as a graphic organiser, a stractured overview, or leaming log. A
leaming log (Camboume, 1988) is a personal diary kept by the leamer. The
entries are a record of the leamer's reactions to current leaming experiences.
80
Advocates (Camboume, 1988) claim that regular use of such a device assists
the leamer to understand their own leaming processes. When shared with
others, the leaming log provides an insight into another person's leaming
processes as told in their own voice. Such a device can help leamers employ
metacognitive sttategies to conttol their own mental processes.
We should provide for bottom-up extraction of top-level schemata. Again
strategies such as a graphic organiser, a stractured overview, or leaming log
may be employed.
Transfer mechanisms should be included. Strategies that encourage
automation support low-road transfer include the familiar drill and practice
procedures. Another strategy is the use of electronic performance support
systems that provide immediate assistance at the time. Advocates of this
form of support (Gery, 1989) claim that this form of support will be more
effective than "ttaditional" computer-based drill and practice ttaining.
During high-road transfer, knowledge and skills are abstracted from their
present context and deliberately reapplied in a new context. The processes
involved in the constraction of a concept map may support high-road ttansfer
because the leamer has to abstract information from its present context and
re-constiuct this information into a schematic network that reflects their
present understanding.
There needs to be greater emphasis on the learner's role in mediating
interactions. Leamers are not viewed simply as responders to extemally
generated questions or queries, but as controlling the degree to which
information is selected, organised and integrated(Mayer, Dyck & Cook,
1984).
Cognitive engagement is influenced by the nature of the presentation stimuli,
the associated response requirements and the consequences of the responses
(Hannafin & Reiber, 1989).
Responses made with mirumal effort offer objective evidence of interaction,
but littie about the degree to which the relevant concepts have been mastered.

81
• Meaningful leaming is more completely integrated with existing schema,
presumably increasing both the utility of the knowledge and the potential for
transfer to untaught problems.
• The technology that supports people with such environments (enriched
leaming and information environments) can be seen as a performance system
of conceptual and technical tools that enhances information management, and
productivity through embedded guidance and a problem-solving environment
(Derry & LaJoie, 1993).
Evaluation of cognitive tools that facilitate learner processing of
information
David Jonassen (1996) suggested that there are six basic pedagogical criteria that should
be apphed to the evaluation of cognitive tools such as mindtools.
• They can be used to represent knowledge (how someone represents content
or personal knowledge).
• They are generalisable (can be used to represent knowledge in different
content areas).
• They engage the leamer in critical thinking about the subject.
• The skills acquired are generalisable and ttansferable to other contexts.
• The formalism embedded in the tool is simple but powerful as it encourages
deeper thinking and processing of information.
• The software should be easy to leam and the mental effort needed to leam the
software should not exceed the benefits.
The concept mapping tools in this study were designed to meet these criteria as they
belonged to the mindtool category as defined by Jonassen (1996).
Part 2: Summary
Computer-based leaming environments show promise in assisting leamers to process
new information. In particular, hypertext-based leaming envhonments that make use of
cognitive tools can assist leamers to form associative links with existing semantic

82
networks akeady held in long-term memory. Such tools should assist leamers to process
new material in depth and to re-organise it so that it can be more easily absorbed into
long-term memory.
Abstract representational schemes such as concept mapping may be gainfully employed
as cognitive tools but they may be context-specific and appeal more to one leaming style
than another. Ideally, they should be independent of context and leaming style and be
easy to use so that the cognitive load associated with their use is kept to a minimum
otherwise their use will be self-defeating. During this study, concept mapping was
employed as an absttact representational scheme because the subject matter was science-
based and much of the past research associated with concept maps related to science
education.

83
Chapter 3 Leamer Interpretation of Graphs and Tables The previous chapter provided a theoretical perspective to the study by discussing
relevant models of leaming and pertinent theoretical research. It is now appropriate to
discuss physiological and cognitive mechanisms that may help researchers to understand
how leamers process information presented in graphs and tables. In addition, stracmral
features of graphs and tables that support leamer processing of information are
discussed.
This chapter will also examine previous studies about leamer interpretation of graphs and
tables. Not only are these a source of appropriate research techniques, but they also
guide in the development of suitable cognitive tools.
The chapter is divided into two parts. Part 1 examines the findings from research that are
relevant to the interpretation of graphs and tables. There is no specific discussion of
leamer interpretation of text in this section as the general principles that were applied in
this study were discussed in Chapter 2. Instead, relevant discussion of text will be
integrated into the context of leamer interpretation of graphs and tables.
Part 2 of this chapter presents a summary that synthesises the main ideas that apply to the
design of the cognitive tools from Chapters 2 and 3. It presents the initial design criteria
and finally the section ends with a brief discussion of the research questions that arose
from this review of the literature.
Part 1: Relevant research relating to the interpretation of
graphs and tables
Modem technology can provide leamers with information that comes in a variety of
formats that can be seamlessly integrated to form unique leaming experiences. In the
past we could attempt to classify information and to understand its effect in terms of a
conceptual model and Dale's cone of experience (1969) is an example of how this was
attempted. Dale's model (1969) placed "direct purposeful experience" at the base and
"verbal experience" at the apex. The model was based upon the assumption that greater

84
sensory participation by the leamer resulted in more efficient and meaningful leaming.
Thus information presented in the forms just below the apex was considered to provide
less sensory experience and stimulation than those experiences located at the base of the
cone (see Figure 3.1).
Figure 3.1: Dale's Cone of Experience (1969)
However, Dale's model is only one way to represent the presentation of information and
was devised well before the information technology revolution. It did not take into
account the fact that modem interactive multimedia presentations can present the leamer
with many forms of information that can be combined with each other. While the model
may not be appropriate for use in an information technology era, it can still serve as a
referent for instractors when they integrate multimedia packages into holistic leaming
experiences.
A different approach was taken by Winn (1987) who claimed that researchers would be
better served if they arranged the various forms of information eilong a continuum with
realistic pictures at one end and written and spoken language at the other (Dale, 1946;
Knowlton, 1966; Levie & Dickie, 1973; Flemming & Levie, 1978). The rationale for
this classification is based upon the notion that realistic pictures resemble what they stand
for while the words chosen to describe them are more arbitrary and conventional
(Knowlton, 1966); or that pictures describe phenomena, while words name and explain
Please see print copy for image

85
them (Doblin, 1980). Winn claims that these forms of information may be arranged in
boxes along a continuum that extends from pictures to words (Winn, 1987). Again this
classification scheme was more useful when information appeared in static form in books
and posters, but dynamic, electronic, digital storage of information allows users to
reconstitute information into a variety of forms that can combine many of these features.
Figure 3.2 represents a slightiy different way of looking at this issue because a linear
representation that places these various modes of information into boxes may give an
inappropriate representation of what happens in real as opposed to theoretical situations.
Usually leamers have access to a combination of various forms of information and, as
they interact with them, they constract meaning. Different forms of information place
different cognitive demands on the learner and, in a situation where the forms of
information presented are constantly changing, the cognitive demands are also constantly
changing. Cognitive load can occur when a leamer moves from one form of information
to another because their attention can be split among these different forms of knowledge.
Figure 3.2: A schematic diagram of the cognitive demands associated with various forms of information presentation.
Cognitive demands associated with various forms of information presentation
Interpretation of graphics without printed text
Interpretation of graphics and words arranged in two-dimer\sional space
Interpretation of a sequential arrangement of words
Past experience with these forms of information presentation plus the life experiences that the leamer brings with them influence interpretation

86
The figure attempts to represent situations where the leamer moves from one form of
information to another in a unique pattem of interaction that helps him/her to generate
meaning. That is, the leamer does not act as a passive receiver of knowledge but actively
explores and manipulates it to constract their own meaning. Therefore, the leamer's
cognition is adaptive and serves to organise his/her experiential world.
This interpretation is based upon a constractivist philosophy which espouses the notion
that as humans interact with the world they constract their own experience and
knowledge. Each leamer comes to any leaming situation with previous life experiences
that influence how they constract meaning from the information presented. However, it
is likely that leamers need to use strategies that assist them in the constraction of
knowledge from these various forms of information presentation. Moore (1993) suggests
that a mechanism is needed to help leamers process graphs, diagrams and texts, and he
proposes that training in metacognitive strategies may have a positive impact. Concept
mapping is a metacognitive sttategy that may provide learners with a means of
constracting meaning from these various forms of information presentation. During this
study the use of concept mapping as a metacognitive support sttategy to enhance leamer
processing of information contained in text, graphs and tables was investigated.
The use of graphs and tables to support learning
Wilham Playfair (1801) was one of the first people to use graphs to illusfrate data and his
publication of a "The Statistical Breviary:..." showed how the resources of Europe could
be displayed visually (see Plate 1 in Appendix 1). He argued that "...it occurred to me
that tables are by no means a good form of conveying such information..." (p.3) and that
we can use the graphical "mode of representation to facilitate the attainment of
information and aid the memory in retaining it: which two points form the principal
businesses of what we call leaming or the acquisition of knowledge." (Playfair, 1801,
p. 14). While the idea of using graphs as a visual display of information is nearly 200
years old, and our dependence on graphs to present data has grown exponentially
(Weintraub, 1967), we still do not fully understand the cognitive processes people
employ when tiiey interpret tiiem.
87
There are a variety of arguments put forward to explain why graphs and tables should be
used to support leaming. MacDonald-Ross (1979) suggest that visual representations
such as graphs, maps, and charts use an entirely different type of logic based on the
meaningful use of space and the juxtaposition of elements in a graphic, and this enhances
leaming. Other researchers (Winn, 1987) suggest that it just may be that graphs and
tables can offer more information in the available space than words. However, (Olson,
1977) believes that the explanation is more complex and that visual displays of
information (such as graphs) are effective because they make use of under-utilised visual
abilities. He contends that schooling encourages leamers to rely upon a narrow set of
cognitive skills because it is biased toward verbal discourse and verbal representation of
information. When we present information in graphical form, we encourage leamers to
use cognitive skills that are different to those they normally employ. As they master new
cognitive skills leamers may become more productive because they ttansfer these skills to
other tasks.
Other researchers have proposed that graphs and tables support leaming because of
physiological reasons and these are briefly discussed below.
Physiological mechanisms that may explain why graphs and
tables support are effective in conveying information to
learners
The human eye is also very good at recognising geometric shapes and Pinker (1981,
1983) attributes the success of graphical forms largely to this ability. While the human
eye is very good at recognising global or general features, it cannot easily encode specific
details (local features) without the support of other sttategies such as counting or
measuring. Some researchers associate the advantages of graphical displays of
information with physiological mechanisms and Sless (1981) reminds us that the human
eye is well suited to pattem recognition, but very poor at quantitative judgments (Sless,
1981, p. 147). Therefore it may be useful to provide humans with cognitive support that
makes it easier for them to make quantitative judgments associated with graphs and
tables.

88
Research into leaming with the right cerebral hemisphere suggests that tiiis side of the
human brain is used in the interpretation of spatial pattems such as those presented in
graphs and diagrams. In the 1960's Roger Sperry and his students began their historic
split-brain experiments and were able to test separately the thinking abilities of the two
surgically separated halves of the human brain (Sperry, 1964). They found tiiat each half
of the brain had its own separate ttain of conscious thought and its own memories. The
left brain handles language and logical thinking, while the right brain "does things that are
difficuk to put into words" (Blaksee, 1980, p.6). For example, by thinking in images
instead of words the right brain can recognise a face in a crowd or put together pieces of a
jig-saw puzzle. Further research in educational settings produced evidence that supported
the notion that not only do the two hemispheres of the brain process information
differently, but the right hemisphere is better suited for processing spatial information
(Helhge, 1980; Witttock, 1980). Table 3.2 after Rose (1985) summarises the probable
ftinctions of the two hemispheres of the brain.
Table 3.1: Probable functions of the hemispheres of the brain (Rose, 1985)
Left brain
emphasises: language, mathematical formulae, logic, numbers, sequence, linearity, analysis, words of a song
Right brain
emphasises: forms and pattems, spatial manipulation, rhythm and musical appreciation, images and pictures, daydreaming, dimension, tune of a song.
It can be seen that the right side of the brain is more likely to be involved in the
processing of spatial information presented in graphs, but the left side of the brain is
probably more involved in the interpretation of tables.
Some researchers such as Toth (1980) suggest that graphs and diagrams are successful in
conveying information because they call upon the right-brain processes that would
otherwise not be used (Toth, .1980). Several other researchers claim that traditional
schooling is predominanfly "left brained" and that the "right brain" has been neglected
(Blakeslee, 1980; Sylwester, 1981). Out of research associated with leamer use of the
right side of the brain to process information, grew a movement that supported the use of
educational sttategies that encouraged right-brained processing of information (Grinder,
1989; Rose, 1985). Such sttategies emphasised visualisation and employed techniques
such as mind mapping (Buzan, 1995) which purported to link right brain processing of
visual information and left brain processing of verbal information (Margulies, 1991).
89
Margulies (1991) asserts that this "holistic" approach stimulates both cerebral
hemispheres and aids information processing and memory. It may be that mapping
techniques that use visual tools (such as concept mapping) have similar effects.
Some researchers claim that learning can be accelerated through "holistic" techniques that
stimulate right brain as well as left brain processing of information (Rose, 1985). This
supposition is based upon the notion that much of the information leamers receive is
processed by the left brain, and techniques that encourage greater use of the right brain
can greatly increase leamer capacity to process and remember information. While these
claims have not been substantiated across large groups of leamers, they have generated a
large amount of interest in leaming activities that stimulate right brain processing of
information (Grinder, 1989).
Besides mapping, other strategies to encourage right brained processing of information
have included: the association of concepts or words with images (eg. the Lozanov
method of foreign language instraction combines images with relaxation exercises to
achieve what is claimed to be "accelerated leaming", Lozanov, 1978); the placement of
concepts into a logical arrangement of images such as rooms in a building (Blakeslee,
1980); and the use of teacher behaviour (Fenker & Mullins, 1982) to encourage
visualisation (eg. still arms and body, flat high voice, talking at a slow pace and
increasing the length of sentences). The claims tiiat have been made about tiie benefits of
such sttategies relate specific contexts and further research is needed before claims can be
made in more general contexts.
Cognitive mechanisms that may explain why graphs and tables
are effective In conveying information to learners
Many studies associated with cognitive mechanisms describe dichotomies whose poles
are pairs of abilities, one of which is maintained to be associated with graphic
representation. For example Paivio (1971, 1972, 1983) proposed that a "dual encoding"
theory could be used to explain how humans are capable of encoding information both
imaginally and verbally. This theory is important as it recognises that leamers are capable
of "dual encoding" of both visual and verbal information when they interpret verbal and

90
visual information found in graphs. Also, this notion builds upon the spht brain research
of Spen7(1964).
Other research has been conducted into mental abilities relating to spatial and verbal
processes (Snow, 1980), but the results are context specific. For example, it has been
proposed that certain types of information are stored in memory as image-like stractures
which retain some, though not all of the properties of the image (Anderson, 1978;
Kosslyn, 1980, 1981). Pylyshyn (1973, 1981) disputed this view and clamied that the
information may be stored as propositions in language-like stractures. A conclusion that
can be drawn from a series of studies designed to clarify this dispute is that "graphic
forms encourage students to create mental images that, in tum make it easier for them to
leam certain types of material" (Winn, 1987, p. 159). These findings describe outcomes
of leamer processing of information in graphical form, but they fail to describe how
leamers read graphs and process the information they contain. Research related to these
issues has also been reported by Janvier (1978) and Preece (1985), and will be discussed
later in this chapter.
Another approach was to consider the simultaneous and successive processing of
information by leamers. The bulk of this work focused on labelled diagrams rather than
graphs and tables; however the findings may be ttansferable. Winn (1987) claimed that
the ability of leamers to simultaneously scan all the information (text and graphics) they
need to understand labelled diagrams assists them to quickly derive meaning.
Information processing is also enhanced if leamers ttace logical paths through diagrams,
so that they can understand relationships among parts in a process. Thus the more
capable leamers are likely to successively process sequences of information in labelled
diagrams, and simultaneously scan pictures and related labels.
In the area of reading there has been a great deal of research associated with the use of
graphic organisers with text and many sttategies are available (Morris & Stewart-Dore,
1984), but there is also evidence that graphic organisers can improve the performance of
leamers presented with text or labelled diagrams (Jonassen & Hawk, 1984). The
sttength of the graphic organiser appeared to be that leamers could create an overview of
the whole material. Hyerle (1996) contends that organisers are like maps and act as

91
guides and visual tools allowing us to make these maps which represent connections
among ideas and concepts.
Research related to the instructional effectiveness of graphs and
tables
Much of the research conducted into the instractional effectiveness of graphs and tables
has been criticised by Winn (1987). In his review of the research related to this topic he
makes five important points.
1. Many studies fail to clearly define the instractional function of the graphic
used. The experimental effects cannot be linked to specific features of the
graphs or tables. Therefore, the best conclusion that can come from this
form of research is that the graphs and tables may have had an effect, but we
cannot identify any factors that may explain why this happened.
2. A great deal of research has been concemed with whether the graph or table
has an effect on what students leam. Many are comparison studies that
compare a graphical tteatment with a textual one. Again the emphasis is on
describing effects rather than explaining them.
3. Winn (1987) states that the research associated with the fields of semantic
networks, concept mapping and spatial leaming theory (Holley & Dansereau,
1984) may prove to be very fraitful as they deal with the psychological
factors that are fundamental to visual processing.
4. Very littie research has been conducted on the instractional effectiveness of
graphs and tables.
5. The effectiveness of graphics cannot be explained in a simple way, because
in a substantial number of studies the experimental effects were found to
depend on leamer ability and on the nature of the leaming task.
Structural features of graphs and tables that convey
information to learners
Graphs and tables convey meaning by exploiting the pattems formed by the data elements
they contain and by the sequences that these elements form. These stractural feamres of
92
sequence and pattem can make it easy or difficult for leamers to process the information
presented in graphs or tables (Winn, 1987). Tables convey sequence through the order
in which elements are encountered; usually we read them from top to bottom or left to
right. They emphasise class memberships, by means of column and row headings. By
way of contrast graphs exploit the convention that higher on the page or the y-axis,
means larger or more value, and the general shape of the line or pattem of bars conveys a
general sense of the relationships conveyed.
Research with tables has shown that simply artanging the data elements into groups
improves leamer ability to understand and remember them (Decker & Wheatiey, 1982).
Furthermore, if the elements are grouped according to some conceptual stracture (for
example taxonomy), then their arrangement can reinforce that stracture (Rabinowitz &
Mandler, 1983). In his review of the research relating to tables Winn (1987, p. 177)
concludes that "even the simplest spatial organisation of elements into meaningful clusters
has the potential to improve leaming." This research is also supported by the studies of
Chandler and Sweller (1991, 1994).
More recent research associated with cognitive load, (Chandler & Sweller, 1991;
Sweller, 1994; Sweller & Chandler, 1994) built on this research and suggested that
"effective instractional material facilitates leaming by directing cognitive resources toward
activities that are relevant to leaming rather than toward preliminaries to leaming"
(p.293). This describes a situation where well designed cognitive tools could be used to
reduce cognitive load associated with leamer processing of information in graphs and
tables.
Research related to the interpretation of graphs
"Interpreting a graph consists of putting into verbal form information, regarding a
situation, given a graphical form" (Janvier, 1978).
Two dissertations form the focus of this part of the chapter. The first was a PhD
dissertation completed by Claude Janvier in 1978, and the second was a PhD dissertation
completed by Jenny Preece in 1985. Both studies were chosen because the methods
employed interview techniques that produced findings that described the cognitive
strategies leamers used to understand graphs. During this study subjects were

93
interviewed to find out if they employed similar cognitive sttategies to those identified by
Janvier and Preece.
Janvier's study
This study examined how leamers interpreted complex cartesian graphs. Survey
methods were not employed as Janvier found that many of the seventy studies related to
this topic were based upon survey methods that yielded conttadictory results. He claimed
that this occurted because of a lack of clear definition of the variables, and "the blind
manipulation of testing and statistics" (Janvier, 1978, p.2.8). Instead he employed
interview techniques.
During his study 20 students aged 11 to 12 years of age, plus a few aged 14 and 15 were
interviewed. His interview techniques evolved during the course of the study, with the
first session interviews being less standardised than the others. The pattem of questions
was loosely followed, but became more standardised in later interviews as he became
more confident in his ability to probe the reasoning employed by learners. He believes
that "one must pay sufficient attention to the leaming naturally taking place during the
interview" (p.4.5) as this may give further insights into how the leaming is taking place.
The questions he chose were divided into two categories: those that were regarded as
easy and involved ideas not expected to correlated with other ideas; and those that require
more processing of information and are expected to correlate with other ideas.
The findings
The interview data confirmed that the problems presented were basically new to the
subjects, and on the whole "regurgitation of memorised answers or bhnd application of
well-known rales were rare" (p.4.7). His findings produced organised description and
classification of the difficulties met by the pupils and of the sttategies used. These
difficulties were compared across tasks and across years.
Janvier claimed that his study showed that interpretation can be either guided by the
semantic content of the question or by tiie symbohc outiook of the graph. Two processes
are in operation: one obtains information provided in the question (the situation or
context) and relates it to the graph, and the other scans graphical features in order to
derive meaning. He claims that graphical interpretation is "a subtle mixture of these two

94
processes" (p.9-42) and that "graphical interpretation can be best described as a
progressive integration of the various pieces of information conveyed by the graph with
the underlying situational background" (p.3.6).
Furthermore, there is no interpretation without situation (context) as any leamer has
personal knowledge already present in his/her mind before (s)he tackles any question.
The graph and question convey definite information which constitutes a definition of the
situation and this is analysed through a process involving a continuous reference to the
underlying background knowledge of the leamer. Figure 3.3 displays Janvier's model of
this process. The vertical arrow labelled "as the direction of graph - situation prevails"
shows that the process is seen as starting at the top of the model and finishing at the
bottom.
Figure 3.3: A model of the processes involved in interpreting graphs (after Janvier, 1978).
more graphical features become meaningfiil, the graph becomes meaningful
As the direction of grapli situation prevails
leads to the production of a rich mental image based upon one mode but its details are based on the
execution of the other mode
the situation becomes more particularised and more abstract and less and less referred to
When the leamer is first given a graph to interpret, (s)he starts with either the situation
(context) or the graph, but as attention is focused on the graph, its features become
meaningful and provide the leamer with greater understanding of the original situation.

95
Gradually the original situation is referred to less and less and becomes integrated with
the graph which becomes the principal conveyer of meaning. While this model is
plausible, there were no clear examples of gradual integration developing.
When Janvier examined the coordination of these two processes involved in graphical
interpretation he found that the coordination between the two modes of information
presented required learners to simphfy and memorise one or both. Pure visual
simplification appeared to be insufficient and "verbal" summaries spelled out during the
checking of an hypothesis appeared to literally replace the graph, but it was also
necessary for various global features such as rises and falls, and local features such as
specific labels on axes to be handled in order for interpretation to be successful.
The following features of graphs were identified by Janvier as global: maximum and
minimum; intervals over which the function increases; intervals over which a variable is
less than, greater than, or equal to a given constant (plateau); drops and rises of curves
between plateaux or extreme points; the general shape (up or down) or curves;
discontinuity; pattems that give rise to cycles; steady rates of change; symmetry;
exttapolation; interpolation (asymptotes); dispersion of a graph and difference in shape
measured by area; and many curves on the one graph.
He claimed that "generally the interviews have shown the key to success in the ttanslation
skills lies in the possibility to derive an equivalent of one mode - as a mental rich image -
on which is based the execution of the other representation" (p. 10.8). The interview data
were consistent with Paivio's views (1972) that the mental representation of a dynamic
situation is not sheer reproduction like a film, but an intemal reconstitution done by the
mind. During the process of interpretation mental reconstraction varies in its association
between the situation and the graph, but gradually becomes more articulated with the
graph itself.
Nine specific skills were considered to be important for the interpretation of graphs.
These are discussed below:
1. Reading skills - Janvier found that competence in reading scales and handling
units were the main areas that needed further support. He suggested that leamers
may be supported with indhect exercises that extended over a long period of time.

96
2. Interpolation - Janvier suggests that leamers should have access to a table of
values associated with the graph as this makes interpolation more accurate.
3. Comparison of two variables - the use of language to describe comparisons
assists some learners to compare values but the evidence was not always
conclusive.
4. Interval of increase - the use of language to describe increases assisted some
leamers to accurately describe and measure intervals of increase but the evidence
was not always conclusive.
5. Rates of change - less able students have difficulty answering questions that relate
to rates of change and need support. This may relate to cognitive load as they
have to read the graph and interpret scales on two axes.
6. "Graphical awareness" - pupils who were more aware of the meaning of the
symbols presented by the graph were more likely to choose the correct answer to
questions.
7. Association of the gradient with the situational feature - in simple situations (eg.
temperature versus time graphs) students who were aware of the relationship
between the gradient and the situation were more likely to choose the cortect
answer. However, with complex graphs the results were less conclusive.
8. Association of graphical features with experimental details - students with "above
average ability" who had access to the table of values associated with the graph
were more likely to be successfiil in answering the question.
9. Co-ordination of the graph with pictures - some students could correctly relate the
events depicted in graphs to sequences of pictures. In most cases they were more
hkely to successfully interpret these graphs.
Janvier claimed that six classes made up an "index of competence in graphical
interpretation". These were: comparing values; recognising changes in values; linking of
graphical features to a situation; linking a graph to a picture; numerical awareness of
graphical pattems; and capacity for absttaction (general mathematic ability). While this

97
may be a useful descriptive classification, it does not offer any explanation of the
cognitive processes involved.
Further studies recommended by Janvier.
During a discussion of points for further studies Janvier raised the notion that graphs can
be used to "teach" science concepts (p. 15.4). Furthermore, children's concepts could be
investigated through the use of graphs as a tool to probe their mental stractures. A related
idea is to develop higher order leamer skills such as knowledge constraction and to apply
these skills to represent the knowledge that leamers gain when interpreting graphs and
tables.
Another issue raised was the transference of skills. If we consciously provide practice in
them, they may transfer to new contexts but Janvier is not certain whether verbal
mediation is needed. However, if verbal mediation is required, the form it takes could be
either direct teacher instraction or computer supported mstraction.
Finally, Janvier calls for further investigation of the "graphical reasoning" expected from
science pupils at the end of secondary schooling. He believed that such an investigation
would yield important data that could influence teaching practices, particularly in science
and mathematics.
Synopsis
Any graphical interpretation involves analytic and synthetic components. If leamers
choose to make use of global or local features (specific labels) in isolation, they will be
ineffective as they have to link the information to a situation. The development of skills
in handhng global and local features of graphs reduces leamer cognitive load associated
with this aspect of the process and makes interpretation easier and more efficient. Also
the development of vocabulary skills associated with the context is a sttategy that actively
engages the leamer to reflect on, and verbally re-constract the information presented.
Finally, the use of tables that contain the data presented in graphs helps learners to
analyse graphs. Later studies by Janvier (Janvier, 1980) reported that leamers use
different types of reading styles when interpreting graphs and the kind of reading style
used contributes significantiy to the success (or lack of success) of graph interpretation.

98
He claims that leamers read graphs in an absolute or a relative manner. Absolute reading
can occur with little or no interpretation and focuses on specific values. Relative reading
is concemed with relationships between global features and ttends in sections of graphs.
Specific points are usually read but often little attention is paid to the exact information on
the scales of the axes. Janvier claims that relative reading is better for interpreting ttends
because absolute reading produces too much confusing detail and this leads to cognitive
overload. However, Preece (1985) argues that terms such as absolute and relative
reading may not be useful concepts as some interpretation is always occurring.
Nevertheless, the notion of reading styles helped to identify the issue of cognitive
overload which is suffered by many leamers when they read complex graphs and tables.
Later in the 1990's research associated with cognitive load (discussed earlier in the
literature review) further developed our understanding of how cognitive load occurs in
such situations - in particular, the effect that split attention has upon mental integration of
different forms of information.
Chandler and Sweller (1991) claimed that mental integration is likely to be cognitively
taxing. It is important, therefore, to save leamers from unnecessary mental integration as
they process new information. Where mental integration is necessary, conventional
instraction may be better replaced by integrated instraction which could be performed by
a suite of cognitive tools.
Janvier (1980) and Swan (1980) suggested that graph sketching exercises will help
leamers to improve their interpretation skills, but the development of applications for
computers that directly plot graphs from data gathered by sensors may result in less
emphasis on this skill. Also they provided no research evidence to support their
assertion.
Preece's study
Preece reviewed the findings from previous studies relating to the interpretation of graphs
and concluded that they pointed out trends but told us "little about why the children
answered questions incortectiy" (p.2-15). She argued that interview methods are needed
to understand what is really happening when children interpret graphs, because the
process is complex and requires understanding of the child's thinking processes. As

99
Preece explained when a child interprets a graph, (s)he "has to integrate the new
information from the graph with her already existing knowledge of the context" (p.2-16).
Preece reviewed attempts that have been made to link events to graphs via computer
animations, but found that most of the evidence was inconclusive. She claims that the
reasons for this may be associated with the rigorous quantitative design of many of the
studies which may have obscured some of the more interesting results.
Since her work was completed, many simple micro computer interface kits have been
developed which plot graphs from data collected by sensors attached to experimental
apparatus. A review of this topic is beyond this smdy. However, it should be mentioned
that while the enthusiasm for these devices lies with the fact that they "instantly" plot
graphs and generate tables (and some provide simple tools for data analysis), they still
have to be interpreted. There is a danger that leamers who become isolated from the
context of the data may have difficulty in interpreting the graphs and tables generated.
Preece wanted "to find out what kinds of errors are made, and what strategies and
conceptions are used when 14 and 15 year olds interpreted ttends in single and multiple-
curve graphs" (p.3-2). She also wanted to "confirm that context does have an effect and
to describe tiie effect it has on the process of interpretation" (p3-2). Her sample consisted
of nine students who were interviewed a number of times in the manner described by
Janvier (1978). Another group of 144 subjects (age 14 to 15 and of mixed ability) were
surveyed to collect performance information across a range of tasks related to graphs.
Over 50% of Preece's subjects could answer straight-forward interval questions.
However, leamers had difficulty when they had to compare intervals. When students
had to relate a graph to its context the number of cortect descriptions dropped to 16%.
The ttanscripts of the answers indicated that the context of the graph influenced the way it
was interpreted.
Maxima and minima questions were correctiy answered by 73% of the subjects. These
findings support Janvier's (1978) work which showed that these questions are low in
cognitive demand. Some questions which displayed the graph in a less conventional
manner were poorly answered. This raises questions about the effect of the form of the
display on the leamer processing of information.

100
Only 11% of subjects could describe a graph as a representation of the relationship
between two variables; they found questions about the interpretation of gradients difficult
and they had difficulty relating a graph to its context.
The results from more detailed investigations that followed on from her survey work
showed that the context of the graph has a sttong influence on the way pupils interpret the
graph. Furthermore, the pupil's contextual knowledge either helps or hinders
interpretation; the effect is never neutral. As Preece states: "when interpreting a graph,
the pupil always brings general contextual knowledge to the task and then has to select
the information which is relevant. Gradually, during the process of interpretation, the
pupils will add more information as she integrates the graph and the context more fully"
(p.9-3). These findings are supported by the work of other researchers (Donaldson,
1978; Johnson-Laird, 1981; Hughes, 1975).
In discussing the influence of context over the interpretation of the graph Preece mentions
the work of Driver and Erickson (1983) and Gilbert and Watts (1983) which related to
the altemate concepts that children develop from their everyday hfe experiences. Preece
recognised that the subjects of her study came to the task with sttongly held concepts
stractured from theh own life experiences and these have influenced the way that they
interpreted the graphs. She claimed that the context of the graph affects how the pupil
interprets the graph by influencing the selection and use of concepts in the interpretation.
Also the stracture of the graph can stimulate thinking about a particular part of the graph
or about other aspects of the context. If the context is ambiguous then the stracture of the
graph will have a sttong influence on its interpretation.
In 1992, Preece and Janvier collaborated to examine the role of context on the ability of
twenty-three 14 and 15 year olds to interpret graphs about ecological contexts. The
findings from their interviews indicated that the students were using their own contextual
knowledge when they interpreted the graphs, and this impacted upon how they
interpreted graphs (Preece & Janvier, 1992).
While Preece (1985) implied a constractivist approach and mentioned that prior leaming
influences the way leamers interpret graphs, she did not formally link the term
constractivism to the process of interpreting graphs. In 1994 Roth and Bowen linked a

101
constractivist perspective to the constraction of meaning from graphs and tables, and
their study is one of the few recent studies to formally hnk constractivist perspective to
the interpretation of graphs and tables.
Synopsis
Preece has shown that many leamers have difficulties with interpreting graphs. While
most graph work taught in mathematics is quantitative and involves activities such as
plotting and reading values, in the world outside the classroom the most usual way to use
graphs is to read global features and interpret trends in data. When teachers assist
children to interpret graphs, they need to be sensitive to the kinds of conceptions children
bring to the task and need to take into account these conceptual frameworks. Also the
way that graphical interpretation is taught in mathematics may not be appropriate for other
contexts, where different skills and concepts need to be developed.
Preece recommends that interactive computer programs be explored as a means of directly
relating the graph to its context. Sketching and interpreting programs that relate to
simulation programs are also recommended. Finally she recommends the development of
conceptual models and teaching materials that build upon her research (p.9-9), and this
study aims to extend upon this aspect of her work.
Part 1: Summary
Learners often have difficulty interpreting graphs and tables even though they are a
convenient way of displaying large amounts of information. When researchers have
attempted to understand how leamers process information displayed they have usually
take one of three approaches. The first approach is based upon attempts to understand
physiological mechanisms such as leamer eye movements when they read graphs, and
the function of the cerebral hemispheres of the brain (in particular the right hemisphere).
The second has been the most popular approach and focuses on cognitive components
such as information processing and mental imaging. The third approach focuses upon
the sttuctural features of graphs and tables and how these affect the processing of
information.
The approach that focuses on stractural features has also been hnked to research relating
to the instractional effectiveness of graphs and tables. However, the small aniount of

102
research conducted into the instractional effectiveness of graphs and tables has only
found that their effectiveness cannot be explained in any simple way, and much more
research is needed in this area.
During the last 20 years research into the interpretation of graphs and tables has received
more recognition, and this may be related to the greater use of qualitative research
methods, in particular interviews. Studies have shown that the interpretation of graphs
and tables is an analytical and synthetic process. Leamers need to process global and
local features from the graph and table and then link this to information about the context.
However, leamers already have formed concepts that relate to the context and these have
an influence on how the graph or table is interpreted.
Part 2: Applying the findings from Chapters 2 and 3
Part 1 of Chapter 2 focused on leaming theory and in particular upon constractivist
principles of leaming. Part 2 of Chapter 2 focused upon how leamers assimilate and
accommodate new information into theh existing schema. Various general sttategies that
involved the use of cognitive tools were discussed and these included: the use of advance
organisers; concept mapping; support tools that reduced cognitive load; and support tools
that facilitated ttansfer. A model of leaming that supported a holistic approach to the
introduction of leamers to cognitive tools that were to be used in this study was also
presented.
Part 1 of Chapter 3 focused upon studies that helped us to understand how leamers
interpreted graphs and tables.
The system of cognitive tools developed during this study was guided by a constractivist
theory of leaming (von Glaserfeld, 1989), described in Chapter 2. Relevant research
findings that related to other theories of leaming were also apphed to the development of
the cognitive tools. In particular findings associated with advance organisers (Ausubel,
1968; Novak, 1977b; Clarke, 1991), semantic networks, concept maps and information
processing models of leaming were applied in an eclectic manner (Quillian, 1968;
Shalveson, 1974;Tulving & Donaldson, 1984; West & Pines, 1985; Heimlich &
Pittelman, 1986; Jonassen, 1988; Wandersee, 1990; Novak, 1990; Jonassen, 1992a;
White & Gunstone, 1992). Thus the final product was developed after taking cognisance

103
of previous research into leaming. In the section that follows the features of the cognitive
tools developed are described and linked to relevant leaming theory reviewed in Part 1 of
Chapter 2.
Figure 3.4: The original plans for the cognitive tools
The original design card for the cognitive tools
Instructions
Name
Student number.
Concept map creation tools
Pop-up pallet activated by clicking on concept map button
/
D D D D D
concept
Unk
notes
HELP
print concept map
text
glossary
view table
graph 1
graph 2
questions
concept map
QUIT
Figure 3.4 displays the original conceptiial diagram for the cognitive tools used in this
study. These main features are described under the headings of layout and buttons,
special features and leamer tracking. Layout refers to tiie design of tiie individual screens
displayed and buttons refers to the location and function of the individual on-screen
buttons
Layout and buttons
The original prototype had a layout as shown Figure 3.4. Eight on-screen buttons are
located along the right hand border of the screen. This is consistent with the findings of

104
Miller (1956) whose research suggested that seven plus or minus two items of
information can be stored in short-term memory at any one time. The order of the
buttons from top to bottom was in a temporal sequence suggested by a group of three
researchers experienced in the field of instractional design (Hedberg, Harper, Cheung,
personal communication, November 24th, 1994). To ensure that the labels were
consistent with the functions of the buttons the same three researchers were referred to as
well as ten volunteers who trialed the buttons.
The concept mapping tool was linked to the button labelled concept map. This tool
contained a pop-up palette of six buttons which appeared once the concept map button
was activated. The six buttons employed by the concept mapping tool mirrored the
process recommended by White and Gunstone (1992) and the arrangement of the buttons
in the palette was made to follow the instractional sequence which they also
recommended.
A full description of the screens is left to Chapters 6 and 7 where screen-captures are
displayed.
Specific cognitive tools
The following cognitive tools were designed to assist leamer comprehension of the
information presented in the tables and graphs: balloon help; a map; a sorting tool;
embedded questions; and a concept map creation tool. All were designed to help the
leamer to assimilate and accommodate new information. They are fully described in the
Chapters 6 and 7.
Balloon help
The leamer could use a button to activate or de-activate the balloon help. This feature
allows the leamer conttol of the help. Instead of being continually available, it can be
activated at the moment of need. Gery (1991) recommends that leamers access help at
the moment of need, however novices may forget that they have this form of help
available and fail to take advantage of it (Clarke, 1992). Therefore, in this study it was
sensible to begin with the help activated and then allow the leamer the option of switching
it off.

105
Tlie sorting tool
The sorting tool in the table permitted leamers to re-arrange individual data columns in
numerical or alphabetical order. This made it easier for leamers to compare data and to
see trends in the data.
Questions
These were designed to encourage deeper processing of information.
The concept map creation tool
The concept map was designed to be a metacognitive tool that allowed leamers to
restracture the information into a form that was personally meaningful to them.
Table 3.2 briefly describes the cognitive tools used during this study, their purposes and
some of theh links them to supporting theory. The purpose of the table is not to show all
theoretical hnks; instead it is designed to show that the cognitive tools developed had
specific purposes and was supported by educational theory.
Table 3.2: The cognitive tools used during the study
Cognitive tool
Buttons
Balloon help
The sorting tool
The embedded questions
The concept map creation tool
Purpose
to link the leamer to tools that assisted them to process information and to provide functional tools
to provide "just in time" support
to reduce cognitive load
to encourage deeper processing of information
to act as a knowledge construction tool
Supporting theory
top down, bottom up processing (Stanton & Baber, 1992)
electronic performance support (Gery, 1989)
cognitive load theory (Sweller & Chandler, 1994)
top down, bottom up processing (Stanton & Baber, 1992)
Meaningful leaming, (Ausubel, 1968, Novak & Gowin, 1984) Constmctivist leaming, (von Glaserfeld, 1989; Jonassen, 1996.)
This chapter ends with a list of the research questions that developed from this hterature
review. The questions are listed and briefly discussed in relation to Chapters 2 and 3.
1. What factors affect the ability of various groups of preservice teachers to
interpret a set of graphs and tables?

106
2. What cognitive sttategies do preservice teachers employ when they interpret
graphs and tables?
Questions 1 and 2 relate to previous smdies of researchers such as Janvier (1978) and
Preece (1985). The methodology chapter outlines procedures used to verify their
research and strategies employed to identify other factors that may be specifically related
to the subjects of this smdy.
3. How do the identified cognitive strategies compare with those strategies
identified by other researchers?
While the question relates to previous studies of researchers such as Janvier (1978) and
Preece (1985), it also relates the work of Winn (1987) as well as that associated with
cognitive load (Chandler & Sweller, 1991; Sweller & Chandler, 1994). The methodology
chapter outlines procedures used to verify their research.
4. Could the instractional strategies identified by researchers (Gunstone &
White, 1992; Holley & Dansereau, 1984; Camboume, 1988) in related fields
be applied to effectively inttoduce leamers to the concept mapping tool?
This question specifically relates to the suggestions of researchers such as White and
Gunstone (1992) and Holley and Dansereau (1984). It also relates to Camboume's
(1988) model of leaming that supported the procedures adopted in the methodology
chapter. In addition, it relates to constractivist theory as discussed by von Glaserfeld
(1995).
5. What effect does the concept mapping support tool have upon the way the
learners structure their knowledge?
This question relates to the research of Hyerle (1996); Jonassen (1996); Kessler (1995)
and Novak and Gowin (1984). In particular the methodology chapter describes the
sttategies use to gather data that could be used to understand how the leamers constructed
their concept maps with the concept mapping tool.
6. Do the cognitive support tools assist leamers to analyse information in text,
tables and graphs?

107
This question specifically relates to the research of Janvier (1978); Preece (1985), and
Chandler and Sweller (1991); and Sweher and Chandler (1994). ft also relates to the
research associated with "just in time" support (Gery, 1991).
7. What evidence is there that these cognitive tools had an impact upon the
concepts developed by the leamers?
This question relates primarily to the research of Jonassen (1996); Hyerle (1996) and
Kessler (1995). The methods used to investigate this question also explored the issue of
preferred leaming styles (Kolb, 1984).

108
Chapter 4: Methodology-Overview of the three research studies This study involved three linked research studies that complemented each other. During
each study the methodology chosen was considered most appropriate for the research
questions posed. In order to find examples of appropriate methoiojogies in recent
studies, it was decided to search recent databases (ERIC, PsycLIT, Dissertation Absttacts
from 1992 to 1995).
A search of these databases produced 134 different titles relating to the descriptors of
"understanding or comprehending graphs" or "interpreting graphs". Of these only one
was solely an empirical study that attempted to compare two sets of conttoUed conditions
but the findings were too narrow to be of application to this study. The other 123 titles
employed a mixture of methods such as survey, interview, audio recording, journal
entries, video recording, and computer monitoring. While the findings from these
studies were not generalisable to other contexts, collectively they identified factors that
warranted further investigation. These studies guided the selection of many of the
variables that were investigated.
A similar search involving the term "cognitive tools" (8 titles) showed that quantitative
methods of analysis were employed in only one of these studies. This study employs
both quantitative and qualitative research methods because it allowed the researcher to:
• use ttiangulation in order to seek a convergence of results;
• use complementary methods to identify overlapping and different facets of a
phenomenon;
• use one method developmentally so as to inform tiie second method;
• bring multiple perspectives to the data;
• add scope and breadth to the smdy.
This chapter briefly describes tiiree related and sequential studies that are tiie basis for this
thesis and they are elaborated upon in Chapters 5, 6, and 7. Chapters 5, 6 and 7

109
elaborate further on the methods employed to gather and analyse data during each specific
study. The annotated flow chart shown in Figure 4.1 provides an overview of the three
sequential studies. Study 1 was designed to identify commonalities between previous
studies and the preservice teachers used in this study and sought to identify and describe
the cognitive strategies employed by preservice teachers as they interpreted graphs and
tables. Study 2 apphed the findings from Study 1 to develop a prototype of the cognitive
tools that helped them make sense of data relating to rainforest destruction. Also Smdy 2
was designed to gather data about preservice teacher use of these cognitive tools. These
data were then used to guide improvements that were made to the cognitive tools. During
Study 3, the improved cognitive tools were then evaluated when they were used by the
preservice teachers.
Figure 4.1: An annotated flow chart of the three studies
The subjects vi ere preservice teachers enrolled at the University of WoUongong
A validated muitiple choice test was developed. Forty items were selected from test questions used in the Australian Science in Schools Competition (1988-94)
STUDY 1 1994-1995 STUDY 2 1995
132 Year 1, 38Yeai3 choice test to measure
i& 19 Year 4 subjects administered a multiple their ability to interpret graphs and tables
Develop a prototype trial with 63 students enrolled in Year 3
....../.........., Data collected from university enrolment records. Multiple regression used to identify any relationships among the factors survey
Inten/iews about cognitive strategies employed when answering specific questions
Analysis tools such as balloon help, text glossary, table sorting tool.
Synthesis tool such as a concept mapping tool
I
. i . i . i . i . i ;pyyT:»"i . i . i . i . i . i , i • \
Common cognitive strategies and errors identified
common strategies and errors used to guide development of prototype
Data collected from test results, audit trails, journal entries, and Inter/iews
Design and evaluation of final version of the cognitive tools
/
The system was designed using principles related to constructivist learning
/
/
I Research use of the improved cognitive tools with 80 preservice teachers enrolled in Year 3 of a Bachelor of Teaching (Primary) Degree
7
STUDY 3 1996 /
/ /
/ /
/
y
Data collection from enrolment records test results, audit trails, and interviews

110
Figure 4.2 is a summary of the studies in schematic form. It serves to indicate when
various data collection episodes occurred and when the various forms of the software
were presented to preservice teachers.
Figure 4.2 Summary of the studies
1994-1995 1996
Study 1
01 02
- • T ^
Study 2
03 X I 04 05 X2 06 07
Study 3
X3 08 X4 09
Years 1, 3, 4. Years 1 & 3 preservice teachers enrolled in a Bachelor of Teaching Degree (Primary). Year 4 science graduates enrolled in a Diploma of Education Degree
'.'.'L,''.'.'.'.'*.''•'.'.''.''.'.'''.'*.'•'.'.*•'.'i'i'i'?*J'.^ l!-'?!-!S'''!-!-'^-!'?-.'''-!'!?!-?TTT?FTT*T!?r!-!-'i-!'''!'i!M S!PI"I^-!*J^*IT!*I-I*I'!''-I'ISI-:T-!'I?l'!-PI*r'r'!*r'J'I'P!*!
Year 3 preservice teachers enrolled in a Bachelor of Teaching Degree (Primary)
Year 3 preservice teachers enrolled in a Bachelor of Teaching Degree (Primary)
Key
01 data from university database (gender, age, marks from senior high school and university studies in the English, Mathematics and Science, Computer studies. University Entrance Scores), responses to survey of previous experience with computers, plus leaming style inventory responses (retest after a one month interval)
Subjects preservice teachers from Years 1 and 3
0 2 test on interpreting graphs and tables (retest after one month)
Subjects preservice teachers from Years 1,3 and 4
0 3 attitude to computer questionnaire (retest after one month)
Subjects preservice teachers from Year 3 1995
X1 concept map tool.
Subjects preservice teachers from Year 3 1995
0 4 analysis of concept map 1.
Subjects preservice teachers from Year 3 1995
0 5 analysis of concept map 2, joumal entiies, and interviews.
Subjects preservice teachers from Year 3 1995
X 2 prototype tool for interpreting graphs and tables.
Subjects preservice teachers from Year 3 1995

I l l
0 6 analysis of concept maps created
Subjects preservice teachers from Year 3 1995
0 7 ttacking data from the prototype, joumal entries and interviews.
Subjects preservice teachers from Year 3 1995
X 3 final version of the concept mapping tool
Subjects preservice teachers from Year 3 1996
0 8 analysis of 2 sets of concept maps created. One at the start of the process and
one at the end of the process.
Subjects preservice teachers from Year 3 1996
X 4 final version of the information on rainforest destmction
09 final concept map, ttacking data, joumal entries and interviews
Subjects preservice teachers from Year 3 1996
Study 1: Describing learner interpretation graphs and tables
All of the subjects who participated in Study 1 were volunteers and the composition of
these groups is described in more detail in the next chapter. The subjects were drawn
from three groups of preservice teachers: Year 1 (Freshmen), enrolled in a three year
Bachelor of Teaching Degree in primary (elementary) school education; Year 3 (Junior),
enrolled a three year Bachelor of Teaching Degree in primary school education, and Year
4 who were science graduates completing a one year Diploma of Education Degree in
secondary science education.
Data relating to the previous academic experience of these subjects were also collected
and details of the procedures involved are described in Chapter 5. A multiple choice test
was administered to all subjects in order to measure their ability to read graphs (a copy of
this test is shown in Appendix 2) and a description of how the forty-item multiple choice
test was constructed occurs in Chapter 5 under the heading 'Study 1'.
The data from Study 1 were analysed to detect if any of the independent variables had
affected the test scores. Any factors that could be addressed through the practical
application of a system of cognitive tools were then identified and apphed to the design
of the final prototype.

112
Study 2: Development and evaluation of the prototype
Study 2 used the findings from Study 1 to guide the development of the prototype of
cognitive tools designed to help them make sense of data relating to rainforest
destmction. Furthermore, Study 2 gathered data about preservice teacher use these
cognitive tools and these data were then used to further refine the cognitive tools.
The prototype of the cognitive tools was trialled with 63 preservice teachers enrolled in
Year 3 of a Bachelor of Teaching Degree. This sample reflected the size and composition
of the main group of subjects involved in Study 3. Interviews transcripts, joumal entries
and ttacking data (consisting of a software generated summary file of the frequency and
time subjects spent in viewing each individual screen of the program) were gathered and
these data were used to provide information about preservice teacher use of the prototype
of the cognitive tools. In particular, it was important to identify any difficulties they had
with the tools and to gain an understanding of the cognitive strategies employed when
they used the tools. These data were then used to further refine the cognitive tools
Study 3: Researching use of the improved cognitive tools
Study 3 was designed to gather data about preservice teacher use of the improved
cognitive tools and 80 preservice teachers enrolled in the third year of a Bachelor of
Teaching (primary education) Degree used the improved cognitive tools. The data
gathered included: individual concept maps created during the second and last weeks of
the study; responses to an attitiides to computers questionnaire; interviews; and ttacking
data. It was expected that the data would indicate how successful the tools were and
how they could be further modified. Details of how the data were analysed are discussed
in Chapter?.
A process of collaboration was used at each stage in the development process as it was
important to understand how the cognitive tools employed were used to analyse and
synthesise the information presented in the various forms of text, graphs and tables. The
sttategies which ensured effective collaboration were an important part of the research
process and will be outlined in Chapter 7.

113
Chapter 5: Study 1- Leamer background and strategies as factors affecting their abihty to interpret graphs and tables This study was designed to replicate and extend previous studies such as those of Janvier
(1978) and Preece (1985). By applying interview and survey techniques, the researcher
sought to identify common factors in leamer backgrounds that affected their ability to
interpret graphs and tables. Thus the aims of Study 1 were to:
• compare the ability of different groups of preservice teachers to interpret
graphs and tables;
• identify factors that affected the ability of preservice teachers to interpret
graphs and tables;
• identify and describe the cognitive sttategies employed by preservice teachers
when they interpreted graphs and tables.
Research questions and hypotheses
A discussion of the methods used to gather and analyse data associated with each
research question follows.
Question 1. 1
What factors affect the ability of various groups of preservice teachers to interpret a set of
graphs and tables?
Two approaches were taken to this question. The first approach was a quantitative
approach that formulated and tested hypotheses that predicted relationships between
independent and dependent variables. The second used a qualitative approach that relied
upon interview data gathered from eight (7 - Year 1 and 1 - Year 4) preservice teachers
after they completed the test of their ability to interpret graphs and tables.
The test was administered to Year 1, Year 3 and Year 4 preservice teachers. After the test
was marked and the items analysed, seven questions were selected as items for the
clinical interviews. The criteria for selection were varied degrees of difficulty, and varied

114
contexts that demanded a range of skills. Further details of this process are presented
with the results in Chapter 5.
Hypothesis 1.1.1
Students who are enrolled in senior years in the BEd degree will be better at interpreting
graphs and tables than those in junior years.
Hypothesis 1.1.2
Students who have completed an undergraduate science degree prior to commencing the
teacher education program will be better at interpreting graphs and tables than those who
have not completed such a degree.
The ability to interpret graphs and tables was measured by scores on a forty item multiple
choice test designed to test these skills. ANOVA was then used to test for statistically
significant difference in the test scores obtained by Year 1, Year 3 and Year 4 preservice
teachers.
Hypothesis 1,1.3
The independent variables of gender, age, TER (Tertiary Entrance Rank), previous
scores in English, Mathematics and Science tests, previous experience with computers
and leaming style are predictors of the scores obtained by preservice teacher subjects
enrolled in Year 1 on the graphing and tables test (dependent variable).
The Year 1 group was used as a sample because it was a larger group and the whole year
was available. Furthermore, most had completed senior secondary school in the previous
year and the effects of maturation upon variables such as TER and previous scores and
experience with computers would be less than in samples drawn from more senior years.
Hypothesis 1.1.4
Some of the independent variables (gender, age, TER, scores in English, Mathematics
and Science tests, previous experience with computers and leaming style) will serve as
predictors of the other independent variables. In most cases this predictive relationship
would be a positive one with higher scores in one variable predicting higher sores in the
other variable.

115
Data from the Year 1 group was used and regression analysis was employed to test if
there were any predictive relationships among variables. In most cases it was anticipated
that the dttection of any relationship would be positive. That is, the higher TER scores
would be predictors of higher scores in Mathematics, but the reverse may be tme for the
relationship between age and TER as older stiidents may be less famihar witii the rigour
of the extemal examination process associated with TER scores.
Question 1.2
What cognitive strategies do preservice teachers employ when they interpret graphs and
tables?
Interviews were used to gather data about this question. Seven preservice teachers (who
were volunteers from the Year 1 group) were interviewed about how they interpreted
seven questions from the test. The seven questions selected contained a wide variety of
graphs and tables and varied in the degree of difficulty. The questions focused on a
variety of skills including comparing graphs and related tables, interpreting a table and
relating it to text, interpreting a graph and relating it to text, comparing graphs presented
in similar formats, comparing data tables. The preservice teacher who obtained the
highest score on the test was also interviewed and one who obtained a low score was
included in the group of seven mentioned previously.
Question 1.3.
How do the identified cognitive strategies compare with those strategies identified by
other researchers?
The findings from research question 1.2 (the difficulties experienced and the sttategies
used by the seven preservice teachers interviewed) were compared with those of Janvier
(1978) and Preece (1985) who are estabhshed researchers in tiie field.
Methodology
As this study sought to compare the ability of different groups of preservice teachers to
interpret graphs and tables, a multiple-choice test, designed to measure preservice teacher
abiUty to read graphs, was constmcted and administered. A copy of this test is shown in
Appendix 2. Scores on this test were used as a dependent variable to compare test

116
performances among the different groups of preservice teachers. Questionnaires and
university enrolment information were also used to gather data about the independent
variables (age, gender, marks from previous studies of English, Mathematics and
Science, experience with computers and leaming style). After all preservice teachers had
completed the test, seven subjects were interviewed as they re-attempted seven of the
questions from the original test. The data from these interviews were used to identify the
cognitive strategies that the preservice teachers used when they were interpreting graphs
and tables.
The preservice teachers were drawn from three groups: Year 1 who were enrolled in a
three-year Bachelor of Teaching Degree in primary school education. Year 3 who were
also enrolled in a three year Bachelor of Teaching Degree in primary school education,
and Year 4 who were science graduates completing a one-year Diploma of Education
Degree in secondary science education. Table 5.1 shows the numbers in each group.
The year indicates when the test, surveys and interviews were administered.
Table 5.1: Preservice teachers involved in Study 1
Year
1 - 1994
3 - 1995
4 - 1995
Course
B.Teaching (Primary)
B.Teaching (Primary)
Diploma of Education(Secondary Science)
Number
132
38
19
Of similar studies reviewed the smallest sample was 15 (Linderblad, 1990), but most
were between 40 and 200. The sample sizes chosen for this study are within the
boundaries of typical studies in the field. While the sample characteristics and size
would be similar to the intake of many similar sized universities in Austtalia, the findings
may not necessarily be generaliserable to other institutions as the characteristics of the
students enrolled will vary. However, it could form the basis of comparison studies or
for a more extensive study across several institutions (assuming that the samples are
carefully selected).
Participation in the study was voluntary and students had the right to withdraw at any
time. Primary teaching students were chosen as the main focus group because previous
research (DEET, 1989: pp.23, 37) had shown tiiat most students in pre-service primary

117
teacher education courses were low achievers in mathematics and science. Therefore it
could be anticipated that many of this group of preservice teachers would experience
difficulties in interpreting graphs and tables. The secondary science graduates were used
as a comparison group who would be less likely to experience difficulties in interpreting
graphs and tables.
Mathematics and science backgrounds of the preservice primary
teachers
In 1992 only 66% of the first year preservice students enrolled in primary (elementary)
teacher education courses had completed studies in mathematics subjects during senior
high school. By 1993,72% of first year students had completed studies in mathematics
subjects during senior high school. This increase in senior high school completion rates
can be attributed to changes in govemment policy which stated that by 1996 it would be
mandatory for all teachers in New South Wales to have completed studies in senior
secondary school mathematics.
Between 1992 and 1994, the results from screening tests administered to first year
preservice teachers at this institution by Mathematics Educators showed that only prior
experience with the more challenging examination subjects in senior high school (3 and 4
Unit Mathematics) were predictors of preservice teacher success in performance on
screening tests in elementary school mathematics. Those who studied the less
challenging senior mathematics subjects performed no better than those who did not
study mathematics in senior secondary school (Crawford, 1995). Crawford (1995)
concluded that the government legislation alone was unlikely to produce any
improvement in the quality of mathematics education received by preservice teachers
prior to their entry to university.
The situation in Primary Science Education was similar and enrolment data collected
from first year preservice teachers enrolled in primary teacher education from 1991 to
1994 showed that while 12% of students had smdied physical sciences (Physics and/or
Chemistry), only 47% of the remaining group completed a science subject in senior
secondary school.

118
Third year preservice teachers were selected as subjects for ttials because the majority
had successfully completed a compulsory subject in information technology and by the
end of two years of study had used word processing software and drawing software for
the preparation of some written assignments. Previous research (Summers, 1990;
Wilson, 1990) found that a substantial proportion of students entering tertiary instimtions
to undertake teacher training have minimal previous experience with information
technology. Furthermore, without adequate training, students in teacher education
courses can develop misunderstandings and misconceptions about the technology and its
apphcations. Thus the use of preservice students enrolled in the third year of their degree
controlled to some extent the variable of computer expertise as the majority of stodents
would at the very least be familiar with Apple Macintosh TM computers used in the study
and they would also be familiar with HyperCard ^^ presentation of leaming materials.
However, it does not necessarily follow that all students who successfully complete
information technology subjects will feel confident with computers (Haywood &
Norman, 1988; Novak & Knowles, 1991).
Preservice teacher access to computers could be an important factor in how well they use
them. A study of factors influencing teacher uptake of computers by Oliver (1994)
found that access to computers was an important factor. Moreover, Oliver found that it
wasn't just the access to the hardware that was important but also the access to quality
"user friendly" software that could assist the teacher to perform the task required.
During the present study this factor was controlled to some extent through the use of a
questionnaire which asked the subjects about their use of and access to computers. The
responses were allocated into two different categories based upon the subjects' formal
training with computing, access to computers and use of computer software. For
example subjects who completed a formal subject in information technology, had
frequent access to a computer and frequently used application programs like word
processing, data bases and spreadsheets were categorised as experienced users of
computers. Those who had not completed a formal subject, had little if any access to
computers, and made little if any use of application software were considered novice
users. It was expected that in the context of this study very few of the subjects would be
novice users and most would be experienced users of computers. However, it needs to
119
be acknowledged that a person who states that they are an experienced user may not
necessarily feel at ease when they use them.
Variables investigated in this study
The variables included were selected after an extensive review of the literature. The
independent variables selected for this smdy were: age, gender, marks from previous
studies in English, Mathematics and Science, experience with computers and leaming
style. They were chosen so that the data could conttibute to existing and further research
in related fields.
Gender and age were included because the findings from research suggested that these
factors could relate to the ability of subjects to interpret graphs and tables in text
(MacDonald-Ross, 1977; van Reeuwijk, 1992). Research by Mosenthal and Kirsh
(1991) showed that the abiUty to read and interpret graphs was influenced by the levels
of English literacy attained by subjects. The text associated with graphs and tables
identified key terms and concepts and described the context. Therefore the text needed to
be understood as well as the graph or table.
Bowen (1992) claimed that "to read a graph is to state the relationship that is present, to
describe the relationship that is present, and to analyse the slope of the data curve. To
interpret a graph is to determine the significance of the data relationship that is present,
including the causes of the relationship and the implications of it" (p. 63). His work
suggests that mathematics achievement may also be a factor that affects the ability to
interpret graphs and tables. Finally science achievement was included as a factor as the
graphs chosen for the test were related to the interpretation of scientific data. The data
relating to science achievement were likely to be diverse as there were eight different
subjects on offer for senior high school students in New South Wales. As a result, the
numbers in the science subjects may be too small to be used in statistical comparisons.
Instead aggregated science achievement data were used as students of senior high school
science can be expected to have developed skills in interpreting graphs and tables
(Curriculum Corporation, 1994).
Finally, experience with computers was considered as a factor because the task required
them to use a Macintosh^^ computer. However, it was considered likely that most

120
subjects who used the software developed for this study would be capable users of
computers as they had successfully completed a one semester subject in information
technology. The subject outline in the University of WoUongong Calendar
Undergraduate (1995, p. 402-403) states that students enrolled in the subject can expect
to become familiar with the Macintosh^M user interface and "a range of application
packages such as word processing, drawing, databases, and communication
packages...as well as studying a range of commercially available educational software
and application software such as HyperCard™, CD-ROM and interactive multimedia."
The marks from previous studies included: the most recent final marks from the
preservice teacher degree course in Language (English), Mathematics, Science and
Information Technology subjects, as well as subject marks gained from an extemally set
senior high school examination or its equivalent. In New South Wales this examination is
called the Higher School Certificate, and the number of preservice teachers who had
completed this examination was 101 or 78%. Preservice teachers who did not complete
their secondary education in NSW or Australia were included in the sample if the
university enrolment centte allocated a mark (based upon a comparable test) for one or
more of the above subjects. University entrance records were the source of this
information.
The tertiary entrance rank (TER) of each subject was also obtained from the enrolment
records. The TER is a percentile ranking based upon an aggregation of scores students
obtain in the Higher School Certificate in New South Wales. The procedure is conducted
by the University of Sydney for the New South Wales Department of School Education
and has been used for over 15 years as a selection procedure for university enttance. All
preservice teachers who enter university from other states, from overseas and as mature
age students are also allocated a tertiary enttance score by the university. Twenty nine
students were in this category.
Preferred leaming styles were determined using Kolb's leaming style inventory and a full
discussion of Kolb's insttument occurs in Chapter 2. If the cognitive processes that
learners use to interpret graphs and tables vary, then the variable of preferred leaming
style should be investigated because there may be a relationship between preferred
leaming style and the way in which leamers process the information presented.

121
Kolb's inventory is based upon an information processing model of leaming that
involves experiential leaming (Kolb et al., 1974). It applies to adults and is suited to
university stiidents (De Bello, 1990). Other research (Certo and Lamb, 1980; Freedman
and Stumpf, 1981) concluded that the instmment was well suited for leaming about an
individual's leaming style but questioned its reliability when used for comparisons across
groups. Other inventories such as the leaming style inventory, originally designed by
Dunn , Dunn and Price (1979) were considered because they had higher reUability and
validity statistics, but often they contained up to 100 items and were oriented toward use
in secondary schools. The Kolb instmment was simpler and easier to use. Therefore, the
final choice was based on a compromise between the factors of reliability and validity,
ease of use, applicability to the target group, and the relationship of the underlying model
of leaming associated with the inventory and the context of this study.
Measuring learner ability to interpret graphs and tables
The dependent variable was the score that the subjects received on the instmment
designed to test their ability to interpret graphs. This score was a mark out of a total of
forty obtained from a multiple choice test. The test items were selected from an item bank
used in the Austtalian Schools Science Competition from 1988 to 1994, a copy of which
appears in the Appendix. Items were chosen from test papers designed to test students in
Year 10 (16 years old). Year 10 is the final year of compulsory science for most
secondary school students and it was assumed that most subjects would have been
exposed to the language and concepts involved in these questions. The level of difficulty
was considered by staff at the Education Testing Centre of the University of New South
Wales to be challenging (Wang, April 15th, 1995, personal communication), especially
with respect to physical science as only 14.8% of the subjects in this study had studied
physical sciences at senior high school. These results are similar to the figures quoted by
the Discipline Review of Teacher Education in Mathematics and Science which found that
only 14 percent of pre-service primary teachers had studied physical science in senior
high school (DEET, 1989, p.37).
The skills needed to successfully process these test items were identified and categorised
using data supplied by the Education Testing Centte of the University of New South
Wales. A grid of the skills (see Appendix 6) to be tested was constmcted and the items

122
distributed so that the skills identified were tested by the same number of items. AU items
selected were validated by the staff from tiie Education Testing Centte of the University
of New South Wales (Wang, April 15th, 1995 person communication).
Analysis of graphs and tables test
ANOVA was used to compare the three groups who completed the test and regression
analysis was used with each group to ascertain if there was any significant relationship
between the dependent variable (subject scores on the test for interpreting graphs and
tables) and the independent variables of: gender; age; previous scores in English;
Mathematics and Science tests; previous experience with computers; and learning style.
Results - Study 1
The total test score (out of forty) was obtained for each preservice teacher and calculated
by adding the total number of correct responses for the forty item graphs and tables test.
The scores for the main group (first year preservice teachers) were compared with those
enrolled in the third year of the same degree, and with science graduates enrolled in a
Diploma of Education (Secondary Science). After two months each group was given a
retest and the correlations between scores were: Year 1, .74; Year 3, .77; Year 4, .82.
Thus the rehability of the test was acceptable (Oppenheim, 1992, p. 129).
Investigation of Hypotheses 1.1.1 and 1.1.2
One-way ANOVA was to used compare test scores among the first year, third year
preservice teachers and the science graduates. The results of this analysis, reported in
table 5.2, show that there was a significant difference between the scores of the science
graduates and the other preservice teachers, but the difference between Year 1 and Year 3
students enrolled in the Bachelor of Teaching (Primary) did not approach significance.
Therefore hypothesis 1.1.1 was not supported and hypothesis 1.1.2 was supported.

123
Table 5.2: One way ANOVA analysis of year - course enrolment and test scores
One Factor ANOVA X i : Year Y i : Scores /40
Source:
Between groups
Within groups
Total
Analysis of Variance Table
DF; Sum Squares: Mean Square:
2
186
188
4330.1
4098.7
8428.7
2165 22
F-test:
98.2
p = .0001
Model 11 estimate of between component variance = 49.1
One Factor ANOVA X 1 -.Year Y i : Scores/40
Group:
One
Three
Dip Ed
Count:
132
38
19
Mean:
17.2
18.1
33.3
Std. Dev.:
5.2
3.4
2.6
Std. Error:
.5
.5
.6
One Factor ANOVA X -j : Year Y •) : Scores /40
Comparison:
One vs. Three
One vs. Dip Ed
Three vs. Dip Ed
Mean Diff.:
- .9
-16.1
-15.2
Fisher PLSD:
1.7
2.3*
2.6*
Scheffe F-test:
.5
97.4*
66.3*
Dunnett t:
1
14
11.5
significant at 95%
The similarity of scores between the Year 1 and Year 3 undergraduates may indicate that
the skills needed to interpret graphs and tables are not emphasised in their academic
subjects. Examination of the subject descriptions in the University of WoUongong
Undergraduate Handbook for 1995 (pp. 390-420) showed that there was no direct
reference to skills associated with the interpretation graphs and tables. The subject
coordinators of Language (English), Mathematics, Science and Information Technology
(April, 1995) were interviewed and they reported that such skills were not emphasised

124
and curriculum and pedagogical knowledge and skills were considered more important at
this stage of the undergraduates' development. Multiple regression analysis of the Year 3
data gathered from university files for the above subjects showed that there was no
significant relationship between scores in the university subjects of Language (EngUsh),
Mathematics, Science and Information Technology and test scores for interpreting graphs
and tables (F(3,62)=.7, p=.56).
The first year group (enrolled in 1994) formed the focus for the remainder of tiie data
presented as they represent all the preservice teachers in their year. Also many of these
preservice teachers used the final version of the cognitive tools when they were enrolled
in Year 3 (1996).
Data from the first year preservice teachers
Table 5.3 displays a summary of relevant data for the first year group. The acronym
Tertiary Entrance Rank (TER) is a percentile rank based upon student scores in a state
wide extemal examination called the New South Wales Higher School Certificate. One
hundred and one preservice teachers completed the Higher School Certificate, and
obtained a TER. The other 31 preservice teachers who did not sit for a Higher School
Certificate examination were awarded a TER rank that was based upon university
enttance examinations.
Table 5.3: Data about the subjects (N= 132; 115 female and 17 male)
Age
Tertiary Entrance Rank
Mean
22.7
67.6
Standard deviation
6.3
13.2
Maximum
47
99.6
Minimum
18
42.1
The mean TER for preservice teachers was 67.6 and this rank is comparable with other
institutions enrolling first year preservice teachers studying similar courses in New South
Wales (Lewis, 1994.)
Table 5.4 lists the number of first year preservice teachers who completed English,
Mathematics and Science subjects for the Higher School Certificate. This data was
obtained (with student permission) from official enrolment data. The table shows that all
completed the compulsory English subject; 73% percent studied Mathematics in senior
high school, 68% studied Science and 16% studied Computer Studies. No smdent

125
studied 4 units of Mathematics or 4 units of Science. These subjects were academically
more demanding.
Table 5.4: Previous study completed at senior high school (N=101)
Subject
3 Unit English
2 Unit English
TOTAL ENGLISH
3 Unit Maths
2 Unit Maths
TOTAL MATHS
Chemistry*
Physics*
Biology*
Other science
TOTAL SCIENCE
Computer studies
Number of persons
1
100
101
10
63
73
12
3
46
8
66
16
Percentage of total N=101
1
100
101
9.9
62.4
72.3
11.9
2.9
45.5
7.9
65%
15.8
Mean Score
66.8
81.6
71.5
57.3
66.7
67.9
79
70.2
Standard deviation
8.2
8
10.4
7.3
4.2
10.3
7.3
7.4
* These subjects are not necessarily mutually exclusive but in this case only three
students were within two or more categories (eg., the three students who studied Physics
also studied Chemistry). Thus the total number of students who studied at least one
science subject was 66.
Investigation of Hypothesis 1.1.3
Stepwise regression analysis was used to determine if there was any significant
relationship between the independent variables of gender, age, TER, and subject results
in English, Biology and Mathematics and the dependent variable of test score obtained.
Science scores other than biology were aggregated but no significant relationship was
obtained.
Table 5.5 shows that two-unit Maths scores were significant (F(l,34) =6.1, p=.01,
r2=.2), and the positive slope of the regression equation indicated that higher 2 Unit
Mathematics scores were a predictor of higher graphing and table scores. The data also
indicated that 20% of the observed variation in test scores could be atttibuted to 2 unit
Matiis scores. Table 5.5 summarises the results of this analysis.

126
Table 5.5: Stepwise regression of the independent variables of gender, age, TER, Mathematics, Biology and English scores, and the dependent variable test scores
stepwise Regression Y i :TOTAL/40 6 X variables
(Last Step) STEP NO. 1 VARIABLE ENTERED: X 4 : 2UMathsMI<
El R-squared: Adi. R-sguared: RMS Residual:
.1 4.4
Source
REGRESSION
RESIDUAL
TOTAL
Analysis of Variance Table DF: Sum Squares: Mean Square:
1
34
35
119.7
665
784.7
119.7
19.6
F-test:
6.1
STEP NO. 1 Stepwise Regression Y 1 :TOTAL/40 6 X variables
Variable:
INTERCEPT
2UMathsMk
Var Coefficient:
4.5 .2
jables in Equation Std. Err.:
.1
std. Coeff.:
.4
F to Remove:
6.1
Variable: Variables Not in Equation
Par. Corr: F to Enter:
Aae TER
G
2UE
Bl
1.1E-2 .1
.1
-.1
.1
4.0E-3 .1
.5
.4
.7
Key: G=Gender, 2UE= 2Unit English, Bi=Biology
Thus 2 Unit Mathematics scores were the only variable that served to predict preservice
teacher ability to interpret graphs and tables and this could account for 20% of the
variation of the test scores. Further detailed investigation of this variable is warranted as
there may be specific feamres of this mathematics subject that enhance leamer ability to
interpret graphs and tables.
ANOVA was used to determine if there was any significant relationship between
preferred leaming style and test scores but no significant relationship was found (F(3,
132)=.74, p=.6).
Investigating Hypothesis 1.1.4
Only two of the independent variables were related: age and TER. Simple regression
analysis showed tiiat there was a significant relationship between age and TER (F(l,132)

127
=6.6, p=.01, r2 =.04), and 4% of the variation in TER could be attributed to age. The
negative slope of the regression equation suggests that older preservice teachers tended to
score lower TER s than younger preservice teachers. It could be argued that this is
related to how the mature age students are scored for their TER; however the findings of
Lewis (1994) do not support this interpretation. His research indicates that university
entrance standards for mature age students across all faculties are equal to if not better
than those who enter directly from high school, but data in his stiidy did not specifically
relate to the sample involved in this study. Therefore, it would be useful to follow up
this study with similar samples from other universities as it may be that the abihties of the
matore age students enrolled in education faculties differ from those in other faculties.
The interviews with the seven preservice teachers
In addition to the quantitative results, seven preservice teachers (who were volunteers
from the Year 1 group) were interviewed about how they interpreted seven questions
from the test. The seven questions selected contained a wide variety of graphs and tables
and varied in the degree of difficulty. The easiest questions were correctly answered by
94% of preservice teachers in Year 1 and the most difficult question chosen was correctly
answered by 44% of preservice teachers in Year 1. The order in which the questions
were presented was consistent. The first question was used as a "warm up" question so
that the preservice teacher could become engaged with the task. The second question was
the easiest question presented and was deliberately placed in this position in order to build
subject self-confidence.
Table 5.6 displays information about the questions chosen for interviews. The column
labelled "% correct" refers to the percentage of preservice teachers who correctly
answered the questions in the test.

128
Table 5.6: Details of the questions chosen for interviews
Features of questions chosen for interviews
1. comparison of a line graph and a column graph
2. interpreting a table
3. interpreting a curve, determining relative gradient of sections of the graph
4. comparing two pie graphs
5. comparing data from table and line graphs
6. choosing a bar graph that describes a labelled chart
7. choosing a histogram that relates to a specified context
Test question
1
2
3
6
18
20
28
% correct
53
94
63
57
73
91
44
Interview procedure for interpreting graphs and tables
The following procedure was followed for each audio-taped interview .
1. As each preservice teacher read a question and selected their answer, the
researcher made observation notes. To simplify observation, each preservice
teacher was asked to point to each section of the text, table or graph as they read
it.
2. After selecting an answer for a question, each preservice teacher described how
they used the information to obtain their answer.
3. Follow-up questions were used to clarify details. Some of these questions were
based on the observation notes.
4. Finally the subjects were asked to add any additional comments.
Steps 1 to 4 were repeated for each question.
Recorded interviews were transcribed, analysed and coded. The process was iterative
and involved a computer-aided search of ttanscripts and the marking of key words and
phrases, writing narrative summaries that drew attention to the key words and phrases,
coding of key words and phrases.
The final hst of coded actions tiiat were identified by this process is hsted below:
1. the preservice teacher paid attention to global features of the graph(s) eg.
rises/falls; slope; plateaux;
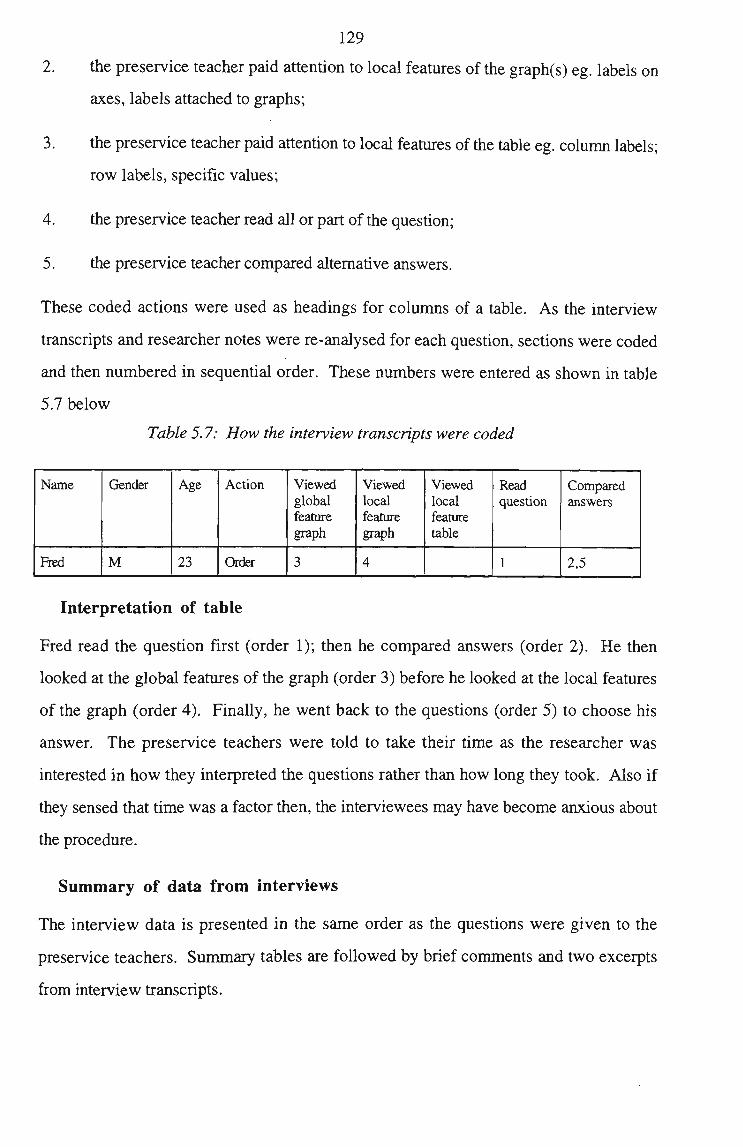
129
2. the preservice teacher paid attention to local features of the graph(s) eg. labels on
axes, labels attached to graphs;
3. tiie preservice teacher paid attention to local feahires of the table eg. column labels;
row labels, specific values;
4. the preservice teacher read all or part of the question;
5. the preservice teacher compared altemative answers.
These coded actions were used as headings for columns of a table. As the interview
transcripts and researcher notes were re-analysed for each question, sections were coded
and then numbered in sequential order. These numbers were entered as shown in table
5.7 below
Table 5.7: How the interview transcripts were coded
Name
Fied
Gender
M
Age
23
Action
Order
Viewed global feature graph
3
Viewed local feature graph
4
Viewed local feature table
Read question
1
Compared answers
2,5
Interpretation of table
Fred read the question first (order 1); then he compared answers (order 2). He then
looked at the global features of the graph (order 3) before he looked at the local features
of the graph (order 4). Finally, he went back to the questions (order 5) to choose his
answer. The preservice teachers were told to take their time as the researcher was
interested in how they interpreted the questions rather than how long they took. Also if
they sensed that time was a factor then, the interviewees may have become anxious about
the procedure.
Summary of data from interviews
The interview data is presented in the same order as the questions were given to the
preservice teachers. Summary tables are followed by brief comments and two excerpts
from interview ttanscripts.

130
Interview Question 1 (Test Question 1- interpreting a graph)
Table 5.8 displays data from the observations of preservice teachers as they attempt to
answer question 1.
Table 5.8: Data analysis for Question 1
Subject name
Sharon, correct
Alison, correct
Anne, correct
Ellon, incorrect
Linda, correct
Monica, correct
Grant, correct
G
F
F
F
F
F
F
M
Age
34
20
39
48
28
42
30
Viewed global feature graph
1,4
2,4,6
3,7,9
1
2,7
3,6
3,5
Viewed local feature graph
6,7
7
2,6
2,6
3,5,8
2,4,7
4,7
Viewed local feature table
Read question
2
1,8
1,5
3,5
1
1
1
Compared answers
3,5, 8
3,5,9
4,8
4,7
4,6
5,8
2,6,8
Comments. The starting point was either the question or the global features of the
graph. Those who chose the correct answer looked at the global features of the graph on
more than one occasion.
The interview transcripts that follow show that the descriptions given by the preservice
teachers were close to what was observed. Note that the labelling of the x-axis conftised
them because it began with July instead of January.
Sharon
Ellon
I looked at the highest temperatures and tried to put it across to the groups in the next graph. I looked at the axes (vertical) to see which temperature range they prefer (Looks at answers). Because it's giving me multiple choice answers I try to work it out before I look at the answers. A verbal description of the graph is given....At first the answers didn't seem to fit the graph. Later I realised that I should read the left hand axes instead of the bottom one.
I was using my fingers to try to juggle the labels on the bottom because I wasn't used to these labels. You got to mentally go through the calendar to find out how the months are labelled.
I referred to the graphs and I tried to formulate an answer before I looked at the question properly. I looked at the ups and downs and found the highest point. Then I found the month (points to x -axis). These (pointing at the months) are out of order, I wasn't sure of the letters meant - I thought that the J label had to be January it didn't occur to me that it was July until now...I should have looked again.

131
Interview Question 2 (Test Question 2 - interpreting a table)
Table 5.9 displays data from the observations of preservice teachers as they attempt to
answer question 2 which related to the interpretation of tables.
Table 5.9: Data analysis for Question 2
Subject name
Sharon, correct
Alison, correct
Anne, correct
Ellon, incorrect
Linda, correct
Monica, incorrect
Grant, correct
G
F
F
F
F
F
F
M
Age
34
20
39
48
28
42
30
Viewed global feature graph
Viewed local feature graph
Viewed local feature table
2,4,6
3,5,7, 9
2,4, 6,8
2
1,4,6,8,10
3,5,7,9
2,4,6
Read questions
1,3
1
1
1,4
2
1
1
Compared answers
5,7
2,4, 6,8
3, 5,7,9
3
3,5,7,9,11
2,4,6,8
3,5,7
Comments. Most read the question first and moved back and forth comparing answers
with the tables. The exception was Ellon who became confused and asked for help.
Linda also had problems with this question; her action summary shows that she spent
time trying to relate the table to the answers. The ttanscripts illusttate the problem of
cognitive load associated with this question.
Sharon
The options didn't fit any of my alternatives until I got to the last column. I eliminated each one as I went along...You had to keep storing the information as you went through the five sections to compare it.
Alison
I read the question then looked at the answers and kept going back to the table to test the answers. I thought that C looked right but even though it didn't work , I kept coming back to it and in the end I chose it...I couldn't match so I had to try and keep the information in my head. I had trouble keeping the information in my head because none of the bits were near each other (no columns were sorted).
Interview Question 3 (Test question 3 - interpreting a gradient)
Table 5.10 displays data from the observations of preservice teachers as tiiey attempt to
answer question 3 which related to the interpretation of a gradient.

132
Table 5.10: Data analysis for Question 3
Subject name
Sharon, correct
Alison, correct
Ann, correct
Ellon, incorrect
Linda, incorrect
Monica, correct
Grant, correct
G
F
F
F
F
F
F
M
Age
34
20
39
48
28
42
30
Viewed global feature graph
1,6
1
3.5
2
2
1,3
2,4
Viewed local feature graph
2,4
3.5.7
2,6
3
4
5
Viewed local feature table
Read question
3,5
2
4,7
1
1
2
1
Compared altematives
7
4,6,8
1
4
3,5
4
3
Comments. This question focused upon the interpretation of a gradient. Therefore,
those who were familiar with gradients should have found this question easy. The
dialogue with Linda illusttates how she could succeed after a littie prompting.
Anne
Linda
Well I read the questions first and then I looked at both lines on the side of the graph, the year (x-axis) and the number of known elements (y-axis), and (pause) then I looked at how the graph went - it went flat then up very steep ...and then I looked at the actual answers. By looking at the graph and finding where the greatest rises and shortest falls were in the years I found the answer.
When I did it I read the question and then looked at the graph and found where the most elements were from the left side (y-axis). This was after 1900...so I decided that D was the answer.
Researcher
Let's explore this a little more. If you look at the question it asks you about the greatest number of elements discovered between certain dates. What does this mean?
Linda
Ah... it should be here (points to greatest slope).
Researcher
Why did you point there Linda?
Linda
Because this is where the greatest rise in the graph is... so that was the biggest rise.
Interview Question 4 (Test question 6 - comparing pie charts)
Table 5.11 displays data from the observations of preservice teachers as tiiey attempt to
answer question 4 which related to the comparison of pie charts.

133
Table 5.11: Analysis of data from Question 4
Subject name
Sharon, correct
Alison, incorrect
Anne, incorrect
Ellon, correct
Linda, correct
Monica, correct
Grant, correct
G
F
F
F
F
F
F
M
Age
34
20
39
48
28
42
30
Viewed global feature graph
1
1
2
1,3
2
4,6
2,4,7
Viewed local feature graph
3
2,5,7,9
4,6
4,6
4,6
5,7
3,6
Viewed local feature table
Read question
2
3
1
2
1
1,3
1,5
Compared altematives
4
4,6,8,10
3,5,7
5
3,5
2
8
Comments. The transcripts show how important it was to carefully read the local
features of the graphs, and the analysis table (column 4) shows that all subjects focused
on this part of the graphs. In Anne's case the most prominent local feature actually
disttacted her attention. Ellon appeared to use mathematics and a process of elimination.
Anne
I read the question, and then I had a quick look at the outside part here. The middle part confused me and I didn't look at that at all. I then looked at the outside part (pie chart) and began a process of elimination to find the right answer. Straight away I went to the remote houses (most prominent global feature) and thought that something that got that in it has to be in one of the answers. Then I have to choose between B and C (at this point she was confused).
Researcher
Did you try comparing the numbers in each pie chart?
Anne
No ... I can see that I really guessed this and didn't take notice of the numbers.
Ellon
I read the graphs first and was confused so I tried the question. I could work out how to compare them because they looked different...then I noticed that the numbers were there so I tried subtracting the numbers to find the difference and I could then get the answer.
Interview Question 5 (Test question 18 - comparing different types of
graphs with a table)
Table 5.12 displays data from the observations of preservice teachers as they attempt to
answer question 5 which related to comparing different types of graphs witii a table.

134
Table 5.12: Analysis of data from Question 5
Subject name
Sharon, correct
Alison, correct
Anne, correct
Ellon, incorrect
Linda, correct
Monica, incorrect
Grant, correct
G
F
F
F
F
F
F
M
Age
34
20
39
48
28
42
30
Viewed global feature graph
3
2
3
3 ,5 ,7
2
3
1
Viewed local feature graph
1,2
5
5
5
3,6
Viewed local feature table
4
1
2
4,6
4,6
4
2
Read question
5
3
1
1
1
1
4
Compared altematives
6
6
4,6
2
3
2,5
5
Comments. The analysis table shows that it was important to carefully read the local
features of the graph and relate it to the table. The ttanscripts below further illusttate this
point. Anne
Grant
I started by reading the question. I had a glimpse of the temperature of the lizard (table) to get a rough idea of the rise and fall. Then I noticed that there were three temperatures there that were all the same and there has to be a flat part on the graph somewhere. So it comes down to those two graphs there. And by tracing it and checking with the table I came up with C.
Yeah ... the way I did... again the swirly line caught my attention first, but I looked at the table and analysed the information there and tried to correlate that to the line. The 36, 36, 36 values stuck in my mind and when I found that part on the graph I knew that I'd found the answer. That was the key thing that stood out and I knew that I was looking for a flat section.

135
Interview Question 6 (Test question 20 - relating a graph to chart)
Table 5.13 displays data from the observations of preservice teachers as they attempt
answer question 6 which related a graph to a chart.
Table 5.13: Analysis of data from Question 6
to
Subject name
Sharon, correct
Alison, incorrect
Anne, incorrect
Ellon, incorrect
Linda, correct
Monica, incorrect
Grant, correct
G
F
F
F
F
F
F
M
Age
34
20
39
48
28
42
30
Viewed global feature graph
2
2 ,4
2
2
2
2
2
Viewed local feature graph
4
3,5
3,5
Viewed local feature table
Read question Compared altematives
3,5
3,5
3
3
4.6
3
4,6
Comments. The interview transcripts and the data table show that again those who
succeeded read the local features (axis labels).
Alison
I was looking at the pictures ... just something didn't click for me ... and I was trying to figure it out. I knew it had to go down but I couldn't see which one (graph) went down by 25%. I just ruled the bottom two out because they were going the wrong way. I thought that B looked more even and must be right but now I realise that A is right because it goes down by 15% at the start (points to left hand axis).
Researcher
Did you look at the label on the left hand side when you answered the question?
Alison
No, no. The pictures were a little confusing as there wasn't much difference in the last two.
Ellon
I looked at the picture and went to the graphs and I went for B, but now I look it again and read the question (I didn't read it before). There is a big difference between the sizes.
Researcher
Tell me how you made your first choice.
Ellon
I just knew that it was a decreasing scale and chose the one that went down in even steps...I was a bit careless.
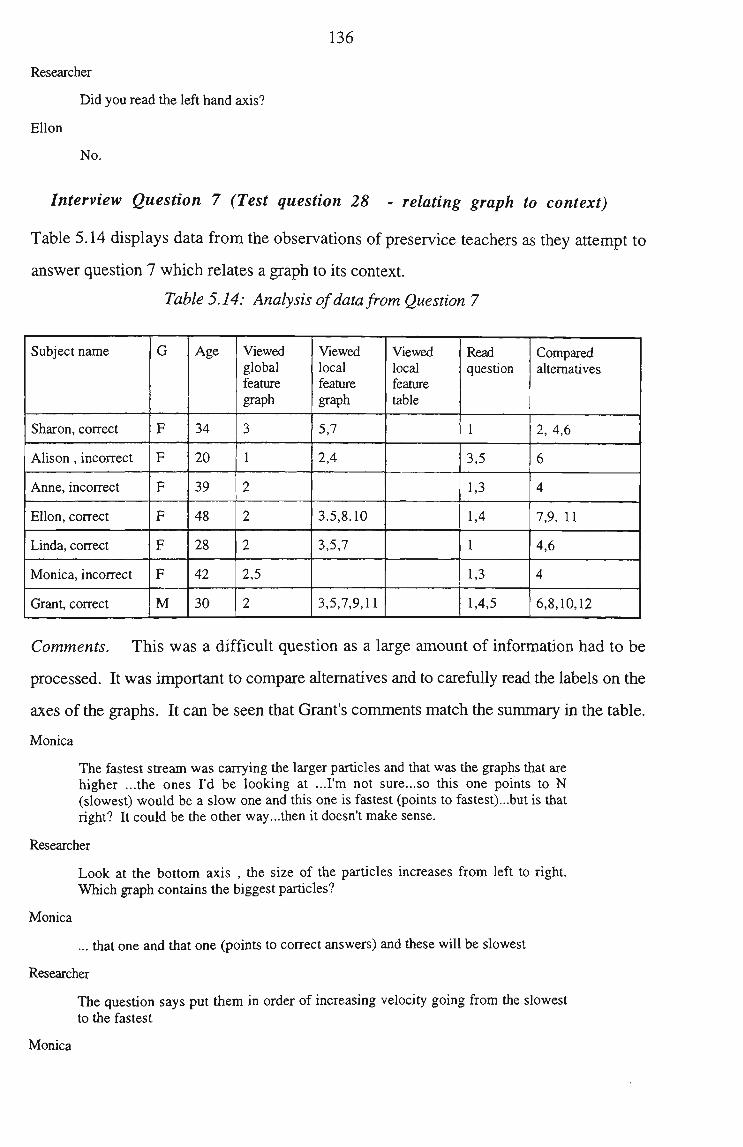
136
Researcher
Did you read the left hand axis?
Ellon
No.
Interview Question 7 (Test question 28 - relating graph to context)
Table 5.14 displays data from the observations of preservice teachers as they attempt to
answer question 7 which relates a graph to its context.
Table 5.14: Analysis of data from Question 7
Subject name
Sharon, correct
Alison, incorrect
Anne, incorrect
Ellon, correct
Linda, correct
Monica, incorrect
Grant, correct
G
F
F
F
F
F
F
M
Age
34
20
39
48
28
42
30
Viewed global feature graph
3
1
2
2
2
2,5
2
Viewed local feature graph
5,7
2,4
3.5,8.10
3,5,7
3,5,7,9,11
Viewed local feature table
Read question
1
3,5
1,3
1,4
1
1,3
1,4,5
Compared altematives
2,4,6
6
4
7,9, 11
4,6
4
6,8,10,12
Comments. This was a difficult question as a large amount of information had to be
processed. It was important to compare altematives and to careftilly read the labels on the
axes of the graphs. It can be seen that Grant's comments match the summary in the table.
Monica
The fastest stream was carrying the larger particles and that was the graphs that are higher ...the ones I'd be looking at ...I'm not sure...so this one points to N (slowest) would be a slow one and this one is fastest (points to fastest)...but is that right? It could be the other way...then it doesn't make sense.
Researcher
Look at the bottom axis , the size of the particles increases from left to right. Which graph contains the biggest particles?
Monica
... that one and that one (points to correct answers) and these will be slowest
Researcher
The question says put them in order of increasing velocity going from the slowest to the fastest
Monica

137
Well those two are the fastest, that one would be the slowest, then that one, that one and that one (in the correct order).
Researcher
Did you look at the picture in the graph?
Monica
Yes without reading the labels.
Grant
I'm not overly confident here but I've gone for D. The thing that struck me here was the amount of information. The first thing I did was read the question, to try and get an understanding of it and I found that I kept going back to the question to make sure that I was understanding it properly. Then I looked at the graphs and I didn't look to much at the percentages because I assumed that it was like a quantity thing...I looked more at the particle size and from there I tried to work out could these be organised in relation to the opening statement. Like this is a fast flowing stream because it is collecting large particles. So once I had worked out the general pattem, I went down to here (points to altematives) to understand this part of it...I wasn't sure what increasing velocity meant but I guessed it meant speed. Then I eliminated all the altematives.
Table 5.15 summarises data from all observations and ttanscripts. Besides hsting the
number of times a specific form of information was referred to, it also indicates which
forms of information were used at the start of a question.
TABLE 5.15: SUMMARY OF INFORMATION FROM THE OBSERVATIONS
AND TRANSCRIPT ANALYSIS
Form of information
graph- global
graph -local
table-local
read text (question)
compare altemative in text
Frequency of referrals
63
75
33
64
110
Frequency of first referral
10
0
2
37
0
Interpreting the table.
Refer to column 3 "Frequency of first referrals". Examination of this column shows that
on 37 occasions (76% of the total) preservice teachers read the question before they
examined the graphs and tables (row 5). On another 10 occasions (20% of the total)
they looked at the graphs before they read the questions (row 2), while 2 (4%) looked at
the tables (row 4).

138
The raw data should not be used to compare referrals among different forms of
information, but can serve to identify the forms of information that are accessed when
preservice teachers attempt to answer questions relating to the interpretation of graphs and
tables.
Summary of the data obtained from the interview transcripts
The data are discussed under the broad headings of text and tables, and graphs.
Text and tables
The context always plays an important part in the interpretation of graphs and tables.
Often terms such as "velocity", "viscosity" are not understood and this makes
interpretation difficult. An excerpt from Ellon's transcript serves to illusttate this point.
She pointed to the text and remarked
If you look at the question it asks you about the greatest number of elements discovered between certain dates. What does this mean? (points to the word 'element').
Thus it is important that key terms in the text are understood as often scientific terms have
very specific meanings that may differ from common colloquial usage.
The transcript excerpts included with table 5.9 illustrate the problems associated with
comparing data in tables. Often the reader has to re-sort values in his/her head and this
creates cognitive load which inevitably leads to errors. As Alison said 'I had to try and
keep the information in my head.' This problem was mentioned in 5 ttanscripts.
Graphs
When the preservice teachers were required to examine and interpret graphs they divided
their attention between local and global features. At times they misinterpreted the graphs
because they did not recognise that a relationship existed between a global feature (eg. a
rise or fall or change in slope) and a specific local feature (eg. a specific value or label on
an axis). Also they often failed to carefully read the details on axes (a local feature).
However once the researcher directed the subjects' attention to the relevant local or global
feature most could choose the correct answer. It appears that context-specific support
was all that was needed. Other common errors included misreading labels and numbers
on axes and the failure to comprehend legends.

139
As further discussion of these findings occurs in the discussion chapter, all that will be
reported at this stage is that the data from the interview ttanscripts support the findings of
Preece (1985) and Janvier (1978). They contend that leamers not only have to accurately
read the local and global information contained in graphs, but also that they need to relate
the graph to its context. Furthermore the specific errors described are similar to those
described in Preece and Janvier's studies.
The best science graduate (awarded the university medal in 1995) was also interviewed
about how she answered the seven questions discussed with the Year 1 students. She
correctly answered all questions and analysis of her methods showed that:
1. she read the question first every time;
2. when she referred to the graphs and table quickly she identified the key global and
local features needed to answer the questions;
3. she then compared answers and referred back to specific local features on three
occasions. On the other occasions she could select the correct answer without
referring back.
This ex-student spent longer reading the question but did not have to refer back to the
text, graph or tables. Also her comments showed that she had a very good understanding
of the context of each question and this helped her to quickly identify which parts of the
information were relevant. This suggests that she had the background knowledge and
skills needed to quickly assimilate the information presented and to analyse it in order to
solve a specific problem. Furthermore it appears that she was able to remember the
information presented in the text, graphs and tables. By way of comparison, records of
action for Alison (who scored 15/40) show that she referred back to information on
many occasions (see figures 5.8 to 5.14 ). In one transcript Alison mentioned that she
"had to try to keep the information in her head"; therefore it may be that her sttategy of
referring back to information was an attempt to deal witii cognitive load.
The findings did not support hypothesis 1.1.1 as no differences were found between the
performances of the Year 1 and Year 3 preservice teachers who were enrolled in the same
degree. It appears that formal studies in education had no measurable efiect on the ability
of preservice teachers to interpret graphs and tables. However the findings did support

140
Hypothesis 1.1.2 and showed that the preservice teachers who have completed an
undergraduate science degree prior to commencing the teacher education program were
better at interpreting graphs and tables than those who have not completed such a degree.
One explanation is that for the Year 4 students involved in this study, formal tertiary
studies in science helped them to further develop skills in interpreting graphs and tables.
Another explanation is that these students had akeady developed these skills before they
entered tertiary studies.
Whilst some of the variation in the ability of the first year preservice teachers to interpret
graphs was related to their Higher School Certificate scores in 2 Unit Mathematics, no
other factors listed in hypothesis 1.1.3 were found to be significant. Follow up stodies
are warranted as they may help to identify which part(s) of the current 2 Unit
Mathematics syllabus help leamers to develop their skills in interpreting graphs and
tables.
Two of the independent variables listed in hypothesis 1.1.4 were related: age and TER.
The negative slope of the regression equation suggests that older preservice teachers
tended to score lower TER s than younger preservice teachers. Because the amount of
variation that can be attributed to this factor is small, it would be pmdent to obtain a larger
sample and to look at data from other universities before drawing any firm conclusions.
When the preservice teachers were interpreting graphs and tables, they had to process and
interrelate many different forms of information. This was a complex and demanding task
and created cognitive load as the leamer grappled with unfamiliar text, graphs and tables.
Another effect appeared to be that of split attention which may cause the leamer to be
disttacted by information that was peripheral to the task at hand. These findings suggest
that leamers need support that helps them to identify and process information that is
relevant to the task at hand. The cognitive tools developed for Study 2 were designed to
provide such support and the chapters that follow discuss preservice teacher use of these
tools.
141
Chapter 6: Study 2-Development and evaluation of the prototype The findings from Study 1 were used to guide the development of the cognitive tools
that supported the learner interpretation of graphs and tables. However, it was
important that the graphs and tables were presented in a real life context that included
supporting text as this is the way that we commonly encounter graphs and tables
(Janvier, 1978; Preece, 1985). Rather than develop one specific tool and test it in
isolation under so-called "controlled" conditions, it was decided to develop a suite of
cognitive tools that could be used in a more holistic situation where text, graphs and
tables were used together to present information about rainforest destmction.
The cognitive tools developed were designed to serve two broad purposes. First,
tools were developed to assist leamers to analyse information presented in text, graphs
and tables, and second, a tool was developed to assist leamers to synthesise
information presented in text, graphs and tables. The tools designed to help leamers
analyse information presented in graphs also need to subtly focus leamer attention
toward relevant local and global features. However, the tool can be self-defeating if it
is disttacting and causes split attention. Therefore simple balloon help was considered
as a means of attracting leamer attention to relevant local and global features in graphs.
Another tool developed to help reduce cognitive load was a simple sorting tool
designed to help leamers sort data presented in the table. The concept mapping tool
was designed to help learners synthesise information. It was developed so that
leamers could create a simple concept map that represented their understanding of the
information presented in the text, graphs and table.
Study 2 begins with a presentation of findings associated with the use of the prototype
of the concept mapping tool, a tool that helps leamers to constmct (synthesise)
knowledge. This is followed by a presentation of findings from the use of the
"Rainforest" prototype (that was supported with all of the cognitive tools).

142
Methodology - Study 2
During Study 2 a concept mapping prototype was trialled with 63 preservice teachers
enrolled in Year 3 of a Bachelor of Teaching (Primary) Degree. Interviews
transcripts, joumal entries and tracking data (which consisted of a software generated
summary file of the frequency and time subjects spent in viewing each individual
screen of the program) were gathered. The data were used to further refine the
cognitive tools which would then be used in Study 3.
Table 6.1 displays summary statistics for the preservice teachers who participated in
the trial of the prototype of the cognitive tools. All members of the group reported that
they were experienced with computers.
Table 6.1: Composition of the sample that used the prototype (N-63; 57 females, 6 males)
Preservice teacher experience with computers and high school education
Successful completion of an introductory subject in information technology
Uses a computer each week (at home, work or university)
Completed 6 years of high school English
Completed 6 years of high school Mathematics
Completed 6 years of high school Science
Number
63/63
63/63
62/63
47/63
34/63
Age range 20 to 48 years. Mean 25.6, S.D. 6.8.
Research questions - Study 2
A brief discussion of the methods used to gather and analyse data associated with each
research question follows. These methods are elaborated upon later in the chapter.
Question 2.1
Could the instmctional sttategies identified by researchers (Gunstone & White, 1992;
Holley & Dansereau, 1984; Camboume, 1988) m related fields be applied to inttoduce
leamers to the concept mapping tool?
Data from four sources were used: analysis of concept maps created by preservice
teachers; interviews conducted with preservice teachers; observations made by
experienced colleagues and field notes.

143
Question 2.2.
What effect does the concept mapping support tool have upon the way the leamers
stracture their knowledge?
Two approaches were taken to this question. The first was an approach that analysed
the maps and identified and discussed the changes. The second approach relied upon
interview data gathered firom a small sample (12) of preservice teachers after they used
the prototype. It was anticipated that this question would be more fully answered
when Smdy 3 was completed.
Question 2.3.
Did the cognitive support tools assist leamers to analyse information in text, tables and
graphs?
The following data were used to investigate this research question: joumal entties;
tracking data; interview transcripts; and brief observation notes written by the
researcher during and immediately after a session. The latter were made as the
opportunity arose and did not follow any structure. Instead they were brief
descriptions of events considered to be important in the context of this study.
Question 2. 4.
What evidence is there that these cognitive tools had an impact upon the concepts
developed by the leamers?
Once again multiple data sources were used to investigate this research question.
First, the concept maps were analysed and the changes that occurred were discussed.
Second, interview data were gathered from a small sample of preservice teachers (15)
after they used the prototype of the "Rainforest" software. Other data were obtained
from observations and field notes mentioned previously. The data from Study 2 were
designed to investigate how the concept mapping tool helped leamers to process
information presented in the form of text, graphs and tables. The data also indicated
which form(s) of information were used, and how the leamers used the concept
mapping tool to synthesise the information in a coherent cognitive stmcture. This
research question was fiirther investigated in Study 3.

144
Question 2.5.
Do the tracking files provide data which helps researchers to understand the way in
which the tools were used?
In order to investigate this question, data from a computer generated ttacking file of
leamer use of the software were analysed and then compared with data obtained from
interviews, journal entries and general observations. This research question was
further investigated m Study 3.
Variables selected during Study 2
The independent variables were attitude to computers as measured by Gressard and
Loyd's insttument (1985) and the other independent variables from Study 1 (age,
gender, marks from previous studies of English, Mathematics and Science, and
experience with computers).
The dependent variables consisted of the total time taken to use the package and the
frequency of refertals to the cards (this referted to as ttacking data).
The tracking data provided an overview of how preservice teachers used the software.
Follow up interviews were arranged with 12 pairs of subjects who were volunteers.
Attitude to computers
The instmment used was originally designed by Gressard and Loyd (1985). Gressard
and Loyd (1985) originally administered the instrament to 192 teachers who attended
professional development courses about computers. The age of these subjects ranged
from 22 to 51 years which is similar to the age range of the subjects of this study at
this institution (18 to over 40).
It is a Likert-type instmment that consists of thirty items which present positively and
negatively worded statements of attitudes toward computers and the use of computers.
The instrument was subjected to three validation studies which examined the rehability
and factorial validity, correlation among the subscales and the results from a pre
program and post-program study. The same instmment was used by Massoud (1991)
with a sample of 252 students and was validated with subjects who were adult college
students. The alpha reliability coefficients for the three subscales of computer anxiety.

145
computer confidence and computer liking were respectively .72, .82, .70, and .90 for
the total score.
In 1995 this instmment was trialled in a pilot study with the 63 subjects previously
mentioned and the test-retest reliabihty data based upon correlation of total scores was
.77, not as high as Massoud reported but still acceptable (Oppenheim, 1992, p. 129).
As they completed the trial survey subjects were asked to write comments next to any
questions they felt were ambiguous. Three questions were consistently identified as
ambiguous. The same questions were also identified as ambiguous by two fellow
researchers who read the questionnaire. It was decided to alter the wording of these
three questions. The changes are shown in Appendix 4. The questionnaire was
triaDed again and this time subjects did not identify any ambiguous questions. A copy
of this instrument is in Appendix 4.
Kolb's learning style inventory (1971)
A copy of this instmment is shown in Appendix 5. This appendix shows the
questions and the method used for scoring. The more recent version (1984) was not
used because of the cost involved. However the test-retest rehability of the instmment
used was .74 which is within an acceptable range (Oppenheim, 1992, p. 159).
The tracking data
The ttacking data consisted of a computer generated file that records details about how
learners use the software. The data gathered from the tracking file provided
information about which screens and buttons were chosen and time spent at each
screen.
When a user logs on to the "Rainforest" prototype a file is created with the user's
name and student number attached. As the user moves from card to card the program
records which card is used and the total time spent with that card. The data is then
stored as a file that is later converted to a comma-delimited file. This file is then
imported into a statistical apphcation package (StatView, Abacus Concepts, 1992) for
further analysis.
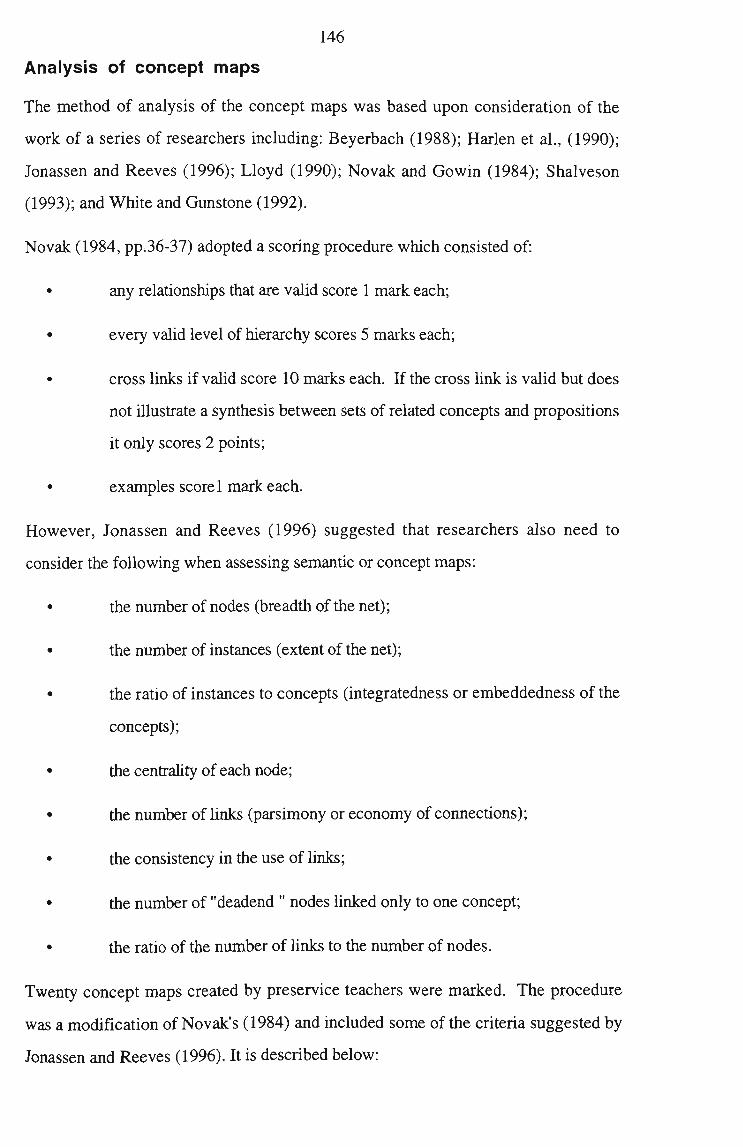
146
Analysis of concept maps
The method of analysis of the concept maps was based upon consideration of the
work of a series of researchers including: Beyerbach (1988); Harlen et al., (1990);
Jonassen and Reeves (1996); Lloyd (1990); Novak and Gowin (1984); Shalveson
(1993); and White and Gunstone (1992).
Novak (1984, pp.36-37) adopted a scoring procedure which consisted of:
• any relationships that are valid score I mark each;
• every valid level of hierarchy scores 5 marks each;
• cross links if valid score 10 marks each. If the cross link is valid but does
not illusttate a synthesis between sets of related concepts and propositions
it only scores 2 points;
• examples score 1 mark each.
However, Jonassen and Reeves (1996) suggested that researchers also need to
consider the following when assessing semantic or concept maps:
the number of nodes (breadth of the net);
the number of instances (extent of the net);
the ratio of instances to concepts (integratedness or embeddedness of the
concepts);
the centtality of each node;
the number of links (parsimony or economy of connections);
the consistency in the use of hnks;
the number of "deadend " nodes linked only to one concept;
the ratio of the number of links to the number of nodes.
Twenty concept maps created by preservice teachers were marked. The procedure
was a modification of Novak's (1984) and included some of the criteria suggested by
Jonassen and Reeves (1996). It is described below:

147
• each valid concept label scores 1 mark. A concept has been defined in the
context of this study as "anything that can be recognised, that is, that can
be attributed identity" (Holley and Dansereau, 1984, p23). Thus ideas,
objects, images, notions, conceptions, beliefs, events, features,
properties, and states are examples of concepts;
• each note that defines a concept scores 2 marks. A note that defines a
concept unambiguously describes its attributes;
• each valid single link scores 1 mark. A valid link is a line with an arrow
attached that shows that two concepts are related;
• each note that clearly describes or explains the link to which it is attached
scores 2 marks;
• each valid node - a concept that has valid links between two or more
concepts - scores 2 marks.
For example the simple concept map below shows a concept map of the water cycle.
The words on the links describe the nature of these links.
Figure 6.1: A simple concept map used to show how the marking scheme was applied (after White and Gunstone, 1992)
{ Water vapour J
evaporates to form
c^
on
Notes are phrases and sentences attached to links and concepts. They demonstrate
ftirther understanding of the concept or hnk.

148
The map in figure 6.1 displays 8 concepts (scores 8 marks), no concepts had notes
attached - zero marks were scored for this criterion, 10 valid links (scores 10 marks),
each valid node (7) scores 2 marks (14 marks for the nodes), each labelled link (10)
scores 2 marks (20 marks for the labels of the links). The total score is
8+10+14-H20= 52 marks.
Twenty concept maps constmcted during the first and last mtorial sessions were
scored. Two experienced science teachers who held undergraduate science degrees
independently applied the criteria described previously to score the same sample of
twenty concept maps. Their scores agreed for 14 of the twenty maps. The difference
between total scores for the other 6 maps was never more than 7 marks on any
occasion. The procedure was considered to be only fairly reliable and was not
adopted.
Shalveson (1993) and White and Gunstone (1992) report that some researchers use a
criterion concept map for the material to be mapped. Then they divide student map
scores by the criterion map score to give a percentage score which can be used for
comparisons. It is important to realise that with this procedure it is possible that some
students may score better than the criterion map and receive a percentage score that is
more than 100%. Rye (1995) reported that a criterion map could be used with success
when students studied the same topic (Global Atmospheric Change). In his study the
expert maps were used to identify centtal concepts that could be used with a technique
known as Pathfinder Network Analysis. This approach restricts the topic of the map
to one domain of knowledge but for this study preservice teachers were not restricted
in their choice of topics. Such an approach was not suitable in this context.
A statistical comparison test was considered, but rejected because there was a
rehability problem with scoring. Similar problems have been reported by Shalveson
(1993) and Kessler (1995). Furthermore even if statistical analysis indicates that an
improvement in scores is probably not due to chance factors, it does not indicate how
the improvements occurred and which aspects of the concept were better than the
previous attempt.

149
After this trial and further study of the literatiire it was decided that rehance upon any
such scoring system would be problematic. Extensive experience over a long period
of time led White and Gunstone (1992) to state that "our personal preference is not to
score concept maps" (p.39). Instead they argued for a more general approach that
looks at the detail contained in the maps, the variety of relationships (particularly cross
relationships) and links. More recent research by Shalveson (1993) reviewed the
methods used to score concept maps and he concluded that "the variation in concept
map assessments that we have described is enormous. Moreover these assessments
are unlikely to produce equivalent scores" (Shalveson, 1993, p. 18).
Because the total scores that can be obtained for a whole map are subject to variation,
it was decided to analyse and describe the main attributes of the concept maps
(concepts, links, notes, and hierarchal levels). This data could then be used to
compare maps and to make descriptions of general and specific changes. The method
for organising and analysing the data is similar to that reported by Beyerbach (1988)
who used frequencies and descriptions to compared the main atttibutes of concept
maps.
Joumal entries were also gathered from 12 pairs of subjects who were also
interviewed. The joumal consisted of series of open-ended questions (described in
Appendix 6) that asked subjects to work in pairs and reflect on the process.
Analysis of the quantitative data gathered
Regression analysis was used to test for significant relationships between the
independent variable of attitude to computers and the ttacking data. The data consisted
of responses to the "attitude to computers questionnaire" (independent variable) and
the tracking data (dependent variable) which contained user files that recorded the
frequency and time that leamers had spent using the various screens. Thus each
ttacking file recorded how many times a leamer had visited each screen and how long
they had spent there.
Two preservice teachers were used to trial the ttacking system. Their individual sets
of ttacking data were gathered in ten-minute trial sessions and these were used to
verify that the ttacking process was working properly. This was done by comparing

150
their computer-generated tracking data log to an observer-generated log of software
use. In both ttials the data was the same.
The "attimde to computers questionnaire" (30 questions) consisted of three subscales
(10 items each scale) that measure computer anxiety, computer confidence and
computer liking. Subjects respond to each item on a four point Likert scale worded
"strongly agree", "agree", "disagree" and "strongly disagree". The item responses
were coded so that a higher score cortesponds to a lower degree of anxiety and a
higher degree of confidence and liking. The total scores for each subscale can range
from 10 to 40, and the total for all three subscales can range from 30 to 120. Thus a
high score on any subscale or on the total scale indicates a more positive attitude
toward leaming about or using computers.
Data from journal entries and interviews
Joumals were filled in by 12 subjects who used the software. The following
questions were asked:
1. Comment on the instraction provided during the first tutorial session.
Specifically
• Did the instmction help you to understand how to use the
software?
• What aspects of the process helped you?
a. the demonsttation by the instractor
b. the practice session in the computer lab
c. working with a partner
d. all of these
e. others - please specify below
• Were there any aspects of the instraction that were confusing?
2. Describe any problems you experienced when using the software.
3. Please make any suggestions about how the software could be improved.

151
4. Are there any other comments that you want to make.
The following questions were asked of the subjects whose joumal entries were
analysed:
1, Describe what you did when you used the computer software to help you understand the
information in the graphs and the table, and the text.
2. Describe what you did when you used the computer software to help you develop your
concept map.
Development of the tools to support cognitive outcomes
It was important that the cognitive tools were presented in a real life context.
Therefore, it was decided to develop a suite of cognitive tools that could be used in a
holistic situation where text, graphs and tables were used together to present
information about rainforest destruction. Several commercial applications were
considered but none could be integrated into the context of this study (Appendix 11
contains a list of these software).
The concept mapping tool is discussed first as it was the first tool developed. When
the application opens, explanatory text and instmctions for logging on to the
application are displayed on screen. A copy of this screen is shown in Figure 6.2
below.
Figure 6.2: A plan of the opening screen of the prototype
Helpise ;DII ID Interpret gr&plu
Introduction This ptDgiam is design to lielp jou to diav concept maps. It consists of on-scraen •butCiiB That yon can click, on t) access Tools. The hutcns al-^ra. appear on the ngJit-hmid maigin of the screen and aie kbellad. For example £f you dick on ^ button teitielled labelled "Concept Map", jou access toob that help to create a concept map.
Instructions Tjrpe in your name and student numl)er in the space pnjvided and press "letuni".
Student Najne
Student Number

152
All user buttons were located along the right hand side of tiie screen and were
accessible only after tiie user logged on. If tiie user tried to chck on tiie buttons before
logging on a pop-up message reminded him/her to log on first. This logging-on
procedure created a user file that recorded their ttacking data as well as the concept
map created. The following descriptions explain the function of the five on-screen
buttons.
Buttons- function and description
Introduction:. The instractional text briefly explains how to get started.
Concept map. When the user clicked on the concept map button a pop-up palette
called concept tools appeared at the bottom of the screen. This palette consisted of six
buttons designed to help in the process of creating a concept map.
Figure 6.3: The original six buttons on the concept tools palette
liiDiiii Concept Tools i;i==iH;;;i;i i
|<ON<trT| ,
concept 1
^ i _^jeraser_J
f 1 help 1
•
print i
The six buttons on this palette have the following functions:
• concept allows the user to type concept labels and to move these labels in
two dimensional space;
• link allows the user to draw link arrows between concepts. Arrows
indicate the direction of these links;
• note allows the user to attach explanatory notes to the links or concept
labels. Therefore concepts and links can be explained;
• eraser allows the user to correct mistakes;
• help provides access to a simple help screen;
• print allows the user to print out the concept map and the notes.

153
The other on-screen buttons were
Help. When a user chcks on this button, a pop-up window provides instmctions
that explain how to use the buttons appearing on the start-up screen.
Save. This button allows the user to save the current map to the user's file.
Quit. As the user quits the application, the concept map is also automatically
saved, under the user's name, to a file server. The likelihood of
accidental loss of information is reduced.
Figure 6.4 shows a screen capture of a student concept map about the solar system.
After the preservice teacher logged on to the application, the concept mapping tools
appeared and the section of the screen to the left of the buttons was blank. She then
clicked on a button from the concept tools palette to begin constracting the map which
appears in this figure. The view shows that she created a small number of key
concepts and linked them. She was attaching notes when the screen capture was
made. The attached notes are displayed for clarification but can be hidden by closing
the window in which they appear. The double border surrounding the concepts
(asteroids, moons) indicates that they have attached notes.

154
Figure 6. 4: A concept map in the process of creation with the prototype
Development of cognitive tools used in the rainforest prototype
The cognitive tools described below were developed to assist learners analyse
infomiation presented in text, graphs and tables. Such tools included the balloon help
and sorting tools. Originally the analytical cognitive tools were developed separately
and briefly trialled before they were combined in the prototype. The prototype
designed to support the interpretation of graphs and tables contained the concept
mapping tool, but it also contained other cognitive tools as displayed on the screen
shown in figure 6.5. The figure also displays the initial screen where the user logs on
to the application.

155
Figure 6.5: The opening screen of the prototype of the support system to assist leamers to interpret graphs and tables
p.; ,-; - jmM
Helpiag ja*. to inteipiet gnplu
IntroductiDn Tlus progiam is desijpa 10 help you to understand giaphs. It consists of on-screen displays of graphs and tables plus orirscreen buttons that you can click on « access toob or more informatiDn. The buttons alvays appear o n ^ right-hand margin of the screen and are labelled. For example if you click on the button labefled "Grapil" youseeavie-wof thegra^ilirelatedlothe-Dpic-totyouaie sttidying. If you click on the button labelled "Concept Map", ycra access tools tliat help to create a concept map, j ,
IT Uistniclkins "Type in your name and student ntunber in the space provided and press "retarn".
Student Hame
Student Number
m^Mmm^^^
The functions of the buttons displayed are described below:
The introduction explains the purpose of the support system; text provides a context
for the information; questions are related to the information provided in the graphs and
tables (in the final version the questions were also provided on paper) and the glossary
provided further information about key terms. Figures 6.6 and 6.7 show the table
support and the graphing support tools. The functions of the other buttons have been
discussed previously.

156
Figure 6.6: The screen used to support the interpretation of tables
Click on the column headings in order to sort the data
Coimti7 Brazil Cambodia Central America Congo India Madagascar Nigeria Papua Ne V Guinea Phillipines Yiel]ciam Zaire
AnxLnal loss 9b 2.3 0.75 3.7 0.8 2.4 8.3 14.3 1.0 5.4 5.8 0.4
%left 77 56 18 90 10 39 39 85 20 23 80
Tears to end 43 133 27 125 42 12 7
100 19 17
250 1 IS
The screen used to support the interpretation of tables allows tiie user to sort any data
column (eitiier in alphabetical order or numerical order) by clicking on the top of the
column. In figure 6.6 tiie column labelled "Country" has been sorted alphabetically

157
i
Figure 6.7: The screen used to support the interpretation of graphs
:.-, . X ^ ^ - . ^ . v ^ . X , "«s4 ; ;
Disappearing Rainforests
TKailaia
IapuaH«w. G.
>i Hi^cria
B Ajuujallos; ^
O HaJagafcar
59? of Papua Nev Guinea's rainforest has already been destroyed.
Percent %
This graph is a bar graph. It displajTS the rate of rainforest destruction in selected countries. The number labelled at the end of the bars are percentages. The solid bars indicate the percentage of remaining rainforests depleted and the cross-hatched bars indicate the percent of the original rainforest left.
•ifsi
^
The screen used to support the interpretation of the graph allows the user to activate
balloon assistance by moving the cursor over the text attached to the graph. In this
figure the cursor is located over the data relating Papua and New Guinea, and the text
in the balloon further explains the number at the end of the bar.
Experimental procedure for Study 2
All subjects were given a period of direct instruction in a lecture theatre that contained
computer projection facilities. The concept mapping tool was presented and the

158
process of concept map construction modelled by the researcher. This was followed
up with a one hour tutorial session in the multimedia computing laboratory. This
laboratory consists of a room containing 14 Power Macintosh^M computers, plus one
demonstration machine linked to a projector. All computers had hard disc drives,
1.4Mb floppy disc drives and were linked to a file server.
At the beginning of the first mtorial session the researcher used computer projection
facilities to revise how to use the concept map creation tool demonstrated in the
previous lecture. The preservice teachers were then given the choice of working alone
or in pairs and all except three worked in pairs. Most felt that working in supportive
pairs helped to facihtate the task of constmcting their first concept map (which related
to the topic of Asttonomy). This topic was briefly presented in a previous lecture and
as an aid to memory, they were provided with a very brief list of key concepts
associated with the topic. Two copies of completed maps were printed at the end of
the tutorial session: one copy was kept by the preservice teacher and the other
collected for analysis. A debriefing session was held at the end of the mtorial session.
After analysis, the concept maps were returned during the following lecture and ways
of improving the maps were discussed. Once again the computer projection facihties
were used to model the process. The follow up tutorial was also held in the
multimedia computing laboratory and during the session the preservice teachers
revised and reprinted their maps.
After this session the maps were analysed and followed up as before. During the thttd
tutorial session, the preservice teachers were asked to complete a final draft of then-
concept map. When the preservice teachers completed the construction of their final
drafts of their concept maps the researcher interviewed twelve pairs of subjects about
their experience with the process of concept map creation. Their responses were
recorded on audio-tape and later transcribed for analysis. The follow up interview
began by asking subjects to:
Describe what you were thinking about as you used the computer software to make your concept map.

159
The responses to this question were used as a starting point to raise all issues about
this method of representing knowledge. At the conclusion subjects were given the
opportunity to offer any other comments that they felt were relevant.
Twelve volunteers agreed to keep joumals and these were analysed. The volunteers
were informed that their responses would help the researcher to understand how they
constmcted their concept maps, how they used the concept mapping tool, and their
general perceptions about the instruction they received. The following instructions
were given:
1. Comment on the instraction provided during the first tutorial session.
2. Describe any problems you experienced in using the software.
3. Please make any suggestions about how the software could be improved.
4. Please add any other relevant comments.
The procedure for analysis of journals was as follows:
1. search for key words related to the questions and underline;
2. select a relevant quote and count tiie instances that similar comments were
made;
3. use a colleague with a background in science education was used to re-
check the joumal entries and the quotes selected;
4. repeat the process when the colleague disagreed with the interpretations
made.
Finally, all pairs of preservice teachers were allocated another four one hour
computing laboratory sessions which they could use in their own time for the
completion of concept maps. Thus each subject received was six hours of formal
instraction, and anotiier four hours of computer laboratory time was formally allocated
to complete the maps.
As subjects used the software the researcher also made general observation comments
tiiat were recorded on a voice-activated micro cassette recorder. Later these comments

160
were summarised and used as a verification check on data gathered by other means,
and to identify issues tiiat needed follow up. Summaries of these general observations
were verified by two researchers who were experienced in computer education. On
two occasions they spent 60 minutes observing preservice teachers using the software
and verified the findings.
Use of all cognitive tools
During this part of Study 2 the subjects were permitted to remain with the same
partners as before (only three worked alone). The subjects who preferred to work
alone were three males who had advanced computing skills (they had completed part
or all of a computing science degree). This procedure was followed because it was
felt that it created conditions of low anxiety that would allow subjects to concenttate
on the task as well as provide useful feedback about the prototype as each partner
would be able to confirm the views expressed by his/her partner. This meant that for
Study 2 most of the concept maps were created by pairs of preservice teachers and
only three individual maps were recorded.
However, the aim of research question 2.3 was to find out if the cognitive tools
assisted leamers to interpret information on the form of text, graphs and tables.
Therefore, Study 2 was more concemed with the process than the product, and data
from pairs of students were just as useful as those generated by individuals.
Furthermore, the use of pairs enabled each partner to reflect on how the other used the
software and thus this sttategy provided useful data for interviews and joumal entries.
Results for Study 2: Learner use of the prototypes of the
cognitive tools
The concept mapping tool is discussed first as it was the first tool developed. The 63
subjects who used the concept mapping software were enrolled in Year 3 of a
Bachelor of Teaching (Primary) degree in 1995. Table 6.2 displays the descriptive
statistics for these subjects.

161
Table 6.2: Descriptive statistics for preservice teachers who used the prototype of the concept mapping tool
Gender
Female
Male
Mean age = 25.6
Number
57
6
SD = 6.8
Preservice teachers were allowed to work in pairs or alone. Most preferted to work in
pairs and their preference supports research by Ramsden (1992) which showed that
supportive pairs were beneficial to adult leaming and lowered anxiety levels.
General use of the tool
It was observed that the constraction of concept maps is a skill that initially requires
careful instraction and this supports the claims of Novak and Gowin (1984) and
White and Gunstone (1992). But, after the preservice teachers received instraction
that modelled the process and completed a one-hour practice session in the computer
laboratory, they needed httle support with the process. This observation supports the
research reported by Jonassen (1996). Indeed many subjects reported that they felt
comfortable with the process after one tutorial session.
The researcher and two colleagues who taught in information technology subjects
observed that the preservice teachers could easily navigate around the Macintosh^"^
user interface, and could use the software. Thus it appears that the software was easy
to use and the cognitive load associated with navigation was low. The observations
noted by the researcher showed that the mapping tool was easy to use and it seemed to
become transparent to the user. This allowed the preservice teachers to focus on the
cognitive processes involved in the constraction of their concept maps.
Working in pairs was convenient because it made the exercise less threatening and
also tended to encourage dialogue. Another benefit was time. Less laboratory time
was needed as on average 22 persons attended each tutorial session. Thus only three
one hour laboratory sessions were needed each week.

162
Use of specific features of the tool
The only concept map constraction tool that needed further demonsttation was the link
tool as some preservice teachers needed to practise the "chck and drag skills" requked
to draw links. To draw a link users must hold the mouse button down ("click") to
start the link and then keep the mouse button down as they drag it across the screen to
create a link line. Releasing the button ends the link. The buttons that were used as
concept labels were of a fixed size. Most concept names created did not fill up all the
available space, and this wasted a certain amount of screen space (Figure 6.4 is an
example). This could become a problem when creating large concept maps so buttons
that altered size according to the length of text were needed. Many preservice teachers
wanted to revise their maps in their own time but they did not have access to the file
server unless the researcher was present, so a "save to disc" and "load from disc"
feature was needed. The preservice teachers also wanted to save their notes as a
separate text file because they could use their own word processor applications to
revise notes away from the computing laboratory.
Another problem observed was the screen space taken up by the palette of concept
map constraction tools. While the palette could be moved out of the way, many
preservice teachers forgot that they could do this and as a result did not use the screen
space efficiently. It was decided that the palette or tools should be modified to be a
ribbon of tools that was fixed on tiie left hand margin of the screen.
Notes describing the functions of the tools were issued during the second week.
While most preservice teachers did not require the notes, several made the comment
that the notes may be helpful when they begin using the concept mapping tool. The
researcher and colleagues who participated in observation checks felt that notes might
be counter-productive as many preservice teachers leamt a great deal by self-
exploration and gained in self confidence with computers.

163
Interviews with preservice teachers who used the concept
mapping tool
The interviews provided data that could be used to tiiangulate the general observations
as well as supplying new perspectives on the use of the tool. The researcher asked
subjects to:
Describe what you were thinking about as you used the computer software to make your concept map.
The three subjects who worked alone were also interviewed (separately) but the 12
pairs were interviewed in pairs.
During these interviews, all three more advanced users claimed that they preferred to
work alone because they could explore the program in depth and at their own pace.
Analysis of field notes supports their claim as they took longer to complete the
program. Thus they were not just focusing upon the task of constracting a concept
map.
A comment from Robert (age, 24 who had completed two elective subjects in
information technology) was representative of the others:
I wanted to find out about how the program worked and to critique it as I have an assignment that asks me to critique some software...! find that I can't play around with the program if I work with a partner.
Thus Robert appeared to have another agenda besides the one set for him. Gordon
(age, 22) and Glenn(age, 26) were also experienced computer users and both
indicated that they wanted to test the program out to see if it had any 'bugs' (Gordon's
comment). While they were involved in the task of creating the concept map, they
also explored the organisation of the software.
Interview transcripts and joumal entties from the 12 pairs revealed that they were
more focused on the task and the comment from Kim (age, 22) and Sharon (age, 23)
is an example:
...When we were creating the concept map, we kept thinking about the way the map looked and if the parts linked together.
Other interview ttanscripts showed that besides concentrating on the task at hand,
preservice teachers were collaborating among thek peers and the following quote is
from Louise and Carla (in their early twenties).

164
The concept making tool was easy to leam. We probably didn't need to spend one tutorial practising as I was sure that I'd manage after the lecture...Louise and I didn't agree about where to put Gravity so we asked Nancy because she brought a book on Astronomy fi:om the library. We used this book to help us check our concepts and spelling - sorry we are not good spellers! (L C)
Thus Louise (L) and Carla (C) collaborated with a peer in order to settie a dispute
about 'gravity' and they asked Nancy who gave them a book to help them clarify their
ideas. Louise and Carla also found the tool easy to use and felt that the tutorial
session was not needed. This view is not supported by most preservice teachers as 27
pairs felt that the tutorial session gave them valuable experience in learning to
constract a concept map.
Those who worked in pairs also claimed that working with a peer allowed them to
'bounce' ideas off each other and to refine their concept map, and the following quote
is from two women in their thirties:
We wanted to make a good concept map because we will use it in our assignment...Jen thinks that we can use the same idea in Human Society and Its Environment... This computer program is good to work with and helps us to put our ideas together. (J F)
Improvements that preservice teachers made to their
concept maps
Concepts maps created during the second tutorial session were compared to those
created during the first session. Thirty-three concept maps were analysed. Thirty
were created by pairs and three were created by subjects working alone. Table 6.3
below displays the results of an analysis of these maps.
Table 6.3: Analysis of the concept maps
Feature
Concepts
Concept notes
Links
Link notes
Map 1 (33 maps)
2 linked concepts 33
3 linked concepts 31
4 linked concepts 12
> 4 linked concepts 3
mean no. of words 56
hierarchal links 17/33
clearly explains links in all instances
22/33
Map 2 (33 maps)
2 linked concepts 33
3 linked concepts 33
4 linked concepts 29
> 4 linked concepts 10
mean no. of words 164
hierarchal links 29/33
clearly explains links in all instances
28/33

165
In most cases, concept maps created in the second tutorial contained more concepts,
and 10 out of 33 were organised in branches that contained more than 4 linked
concepts. Only 3 of the first set of concept maps contained a branch with 4 or more
linked concepts. Other improvements noted were greater use of link notes to clearly
explain links, and more comprehensive descriptions in the concept notes.
The data relating to the concept maps may support tiie interpretation that the preservice
teachers were becoming more experienced in the process of concept map constraction.
The concept mapping tool may have assisted them in this process, but this
interpretation carmot be made without reference to other supporting evidence.
Journal entries of preservice teachers
The following comments are representative of the joumal entries.
...I like the idea of having time to practise with the program before we made our concept maps. (Pam- 4 entries mentioned the practice sessions).
...The computer projector was excellent! I could follow the instructions on my computer as you went through it. (Julie- 8 entries mentioned the projector).
Add a printed sheet at the start to explain how to use the program. This would make the program independent of the instructor (Robert- 3 of the 12 entries mentioned this).
Make the link arrows moveable (Gordon- 2 of the 12 entries mentioned this).
The note tools are very helpful and are one of the strengths (Murial- 10 of the 12 entries mentioned this).
The joumal entties support the data gathered from observations and interviews. None
of the joumal entties mentioned that the software was difficult to use and 7 entries
mentioned that they could use the software at home if their concept maps could be
saved to a floppy disc rather than to the network file server. At the time this was not
feasible because the program used HyperCard version 2.2 which was only available at
specified licensed sites at the university and most subjects did not have their own copy
of this software.
During a group debriefing session held at the end of the final tutorial session,
preservice teachers identified two important factors that they addressed in order to
improve their concept maps. These factors were content knowledge and experience in
constracting concept maps. Most preservice teachers reported that they used some
time during the week between tutorial sessions to develop more subject content
166
knowledge and to refine the hard copies of their concept maps. When they came to
the second tutorial session most brought a revised concept map and support materials
such as books and summaries. This pattem continued for the next week and it
appears that many preservice teachers were motivated to make a concerted effort to
improve their knowledge of relevant subject matter.
The improvements in the concept maps could be expected and may be atttibuted to a
number of factors including practice, peer help, mtorials, lectures and the effect of the
concept mapping tool. Also the process of identifying 'gaps' in content knowledge
may motivate preservice teachers to increase their subject matter knowledge. Finally,
the preservice teachers suggested that the concept mapping tool could be used to plan
instraction. They claimed that the processes involved in the creation of concept maps
not only helped them to map their current knowledge about a topic but to also identify
areas that needed improvement. This part of the process would help them to plan an
instractional sequence because the visual display allowed them to view the scope and
sequence of their topic.
Use of cognitive tools that helped learners to analyse rainforest
data
The same 63 subjects who used the concept mapping tool also used these analytical
tools. They kept the same partners, so 30 worked in pairs and 3 worked alone. The
preservice teachers were instracted to examine all features of the software and to
constinct a concept map that summarised what they had leamt. The data is organised
under tiie headings of ttacking data, interviews and joumal entries.
Analysis of the tracking data that recorded preservice
teacher use of the software
The tracking data was gathered with tracking software that operated in the
background. After a user logged on to the HyperCard™ application, the ttacking
software kept a log of the number of times buttons (which linked to a particular form
of information) were accessed and tiie total time the user spent looking at each form of
information.

167
Table 6.4 displays the summary statistics for the tracking data gathered from 63
subjects who use the prototype of the cognitive tools. The data shows that tiie mean
time was 38.9 minutes and the total time varied from a minimum of 18.8 minutes to a
maximum of 84.4 minutes. Those who took longer than 60 minutes discussed
aspects of the software as they used it. Therefore they could have completed the task
in a shorter time, but their comments were valuable data so the researcher did not
remind them to stay on task. Instead he noted their names so that their tracking files
could be identified.
Table 6.4: The summary statistics from the tracking data from the prototype
Mean Time
Standard Deviation
Minimum
Maximum
38.7
21.
18.8
83.8
Table 6.5 displays the data from all ttacking files. It shows number of times that
subjects viewed a specific screen and in the column labelled 'time' the total time in
seconds spent viewing the screen is displayed. Columns also display the total time
subjects spent in using the software during this trial session, and the total number of
referrals to the on-screen cards made by each subject.
The column headings refer to specific screens. The label 'Text' refers to the text
screens; 'Quests' refers to the screen that displays the questions about the rainforest
data; 'Table' refers to the table displayed on screen; 'Graph 1' refers to the first graph
displayed; 'Graph' 2 refers to the second graph displayed; and 'Cone, map' refers to
the screen that contains the concept mapping tool. Examples of these screens have
been shown earlier in this chapter.

168
Table 6.5: Summary of tracking data
Initials
AB
AJ
AP
AH
AD
CM
JF
DJ
GA
HW
JL
JV
JS
JM*
JW
KC
LC
LE
LW
MK
MB
MK
MG
MP
NU
NV
NG
PO
m PS
RS*
SA*
SP
Text freq
2
7
5
5
4
8
8
8
4
8
14
8
8
15
8
4
7
12
6
7
9
4
7
8
1
8
12
7
1
4
8
7
12
Time mins
10.8
6.9
2.2
1.7
10.7
22.3
70.1
27.3
11.5
24.7
51.3
7.4
11.1
52.4
13.1
5.8
21.3
21.6
24.3
29.0
12.1
14.3
6.6
20.2
6.8
21.5
12.6
11.7
2.2
0.9
51.0
38.4
8.6
Quests freq
3
2
3
2
2
2
3
11
2
2
8
7
3
5
1
1
3
4
5
6
5
2
5
4
1
4
4
2
4
3
7
11
4
Time mins
1.0
0.7
2.3
1.5
0.6
0.9
0.9
7.5
4.2
0.7
3.9
2.1
2.1
2.5
2.1
0.6
1.5
2.6
2.0
2.4
4.7
2.1
2,2
2.6
1.8
2.0
4.5
1.6
2.0
0.8
4.1
9.9
1.6
Table freq
1
1
2
1
1
1
2
8
2
1
5
7
2
5
1
2
3
2
1
1
1
1
1
4
1
5
5
1
2
1
3
12
4
Time mins
1.7
1.1
1.0
0.9
1.4
1.8
1.7
6.4
4.3
0.7
2.9
3.1
2.9
3.3
0.6
2.0
4.1
2.3
2.2
1.2
3.2
0.7
1.6
5.9
1.3
4.1
2.5
0.8
9.6
4.1
4.1
4.6
2.5
Graph 1 freq
1
1
1
1
4
2
2
5
2
1
6
1
1
6
1
1
2
1
1
2
3
4
2
2
1
8
5
1
2
1
5
4
6
Time mins
1.4
3.8
1.7
1.3
2.4
4.3
3.4
2.1
2.0
0.4
2.1
1.2
0.1
3.7
3.5
2.1
2.3
3.1
1.3
3.4
1.9
3.0
2.3
3.2
0.8
6.5
4.0
2.1
1.0
2.1
2.3
1.7
4.0
Graph 2 freq
1
1
1
1
1
2
2
4
1
1
9
2
1
4
2
1
3
2
1
1
1
3
1
4
1
4
6
1
1
1
4
2
6
Time mins
2.1
5.8
3.0
3.4
0.5
0.6
1.2
1.5
0.2
2.6
5.5
0.4
0.5
4.8
6.4
5.4
2.7
3.7
0.6
0.3
0.9
2.2
2.8
1.9
2.3
3.1
12.9
0.9
3.7
5.4
5.0
3.4
3.8
Cone. Map
1
1
1
1
1
2
1
4
1
1
3
1
1
6
1
1
1
1
1
1
1
1
1
3
1
1
4
2
2
1
4
4
2
Time mins
3.9
5.5
8.8
10.6
35.2
20.0
2.1
3.3
3.9
5.4
7.4
6.9
9.5
16.1
5.2
3.9
7.2
16.9
7.2
8.9
3.9
5.5
3.9
18.5
7.2
5.7
6.0
2.3
2.1
5.6
17.2
24.2
4.2
Total time
20.7
23.7
19.0
19.3
50.7
49.9
79.2
48.2
26.0
34.5
73.1
21.1
26.2
82.7
30.8
19.8
39.0
50.2
37.6
45.2
26.8
27.8
19.3
52.3
20.3
42.8
42.5
19.3
20.6
18.8
83.8
82.0
24.7

169
The frequency distribution of the total time to complete the activity is shown in table
6.6.
Table 6.6: Frequency distribution of the total time taken to use the prototype (N=33 groups)
Bar:
1
2
3
4
5
6
7
8
9
10
From: (>)
18
25
32
39
46
53
60
67
74
81
X i : Tot time
To: (<)
25
32
39
46
53
60
67
74
81
88
again
Count:
12
5
2
4
5
0
0
1
1
3
Percent:
36.4%
15.2%
6 . 1 %
12 .1%
15.2%
0%
0%
3%
3%
9 . 1 %
-Mode
This was the first time that they had used the software that contained the graphs and
the tables. The 5 preservice teachers who spent more than 61 minutes using the
software experimented with the software and spent additional tune discussing possible
improvements with the researcher.
Journal entries from preservice teachers
Text from the 12 joumal entties were underlined and coded under the categories of
text, table and graphs, questions and general comments.
Tools that assist in the analysis of information
The joumals mentioned that the text was easy to understand and interesting (7 entries)
but the size of the font (12 point palatino) should be increased to 14 point palatino (4
entties from mature age preservice teachers - age >35). "We older students with
failing eyesight, need bigger print" (MG).
Other joumal entties mentioned that the glossary was a useful feature but felt that
actual words should be directiy linked to the glossary rather than via an on screen
button labelled "glossary". The glossary contained pictures that illusttated the terms
and the opinions expressed in the joumal entries were divided about this feature.

170
Three specifically mentioned that it was a useful feature but another four mentioned
that the pictures did not add any meaning to the words.
The table sorting tool was considered to be a good support tool but again the size of
the font was criticised (4 entties). Also the balloon help that provided text description
of specific numbers on the graphs was considered a good support feamre (8 entries)
but the following criticism was made:
I wanted to know where the countries were located but you didn't provide a map. This was frustrating (MK).
The questions provided
The quote from AB's joumal follows and shows how she and her partner answered
the questions:
B. and I read the text and then looked at the questions. Then we started to read the text again but we decided that we didn't have to do this, because it looked like the graphs and table would tell us about the rainforest losses...When we did our concept map we decided to do it out of our heads rather than look back at die screens. I know this was lazy on our part...(AB).
The questions focused upon finding and comparing factual information and could be
answered by referring to the graphs and/or the table. Thus these preservice teachers
did not need to use the text as a source of information.
Three joumal entries mentioned that they found the questions difficult to use because
they were on a separate screen. Once again the size of the font was criticised and the
following quote illusttates this point of view:
...If we have to go backward and forward, we get impatient... (AB).
To overcome this problem it was decided that the questions would be presented on
paper as well as on screen in the final version.
General comments made by preservice teachers
The joumal entries showed that most subjects (8/12) referred back to the text, when
constracting then: concept map, but only one mentioned referring back to the graphs.
The following quote from JS's joumal (time taken = 26.2 minutes) indicates how one
pair of students used the software. They focused on the constraction of their concept
map and did not answer all of the questions.

171
We didn't have any really serious problems, except when we tried to save our map on to a floppy disc. We had forgotten that it was saved on the network disc and we were worried that our work was lost...We asked M. and she showed us where our map was saved...
We were happy with the look of the printed map we made. We were sure that we had used the program properly, but we didn't answer all the questions.
However, another pair of subjects took their time to review the information presented
and they claimed that this helped them to gain a better understanding of the
information presented and to constract a good concept map. They (L,E) used the
software for 52 minutes and stated:
...E and I wanted to produce a really good concept map so we took our time and went back to the screens as many times as we wanted. This way we were able to find some more information to put in our concept map...
Interview transcripts
Subjects whose joumal entries were analysed were asked to:
1. Describe what you did when you used the computer software to help you understand the information in the graphs and the table, and the text.
2. Describe what you did when you used the computer software to help you develop your concept map.
Seven pairs of subjects mentioned that they found the balloon help on the graph to be
useftil. Six pairs mentioned that the sorting tool for the table was a "good idea" (LE)
and thought that it made it easier to understand the table.
The interview data showed that there were few problems associated with leamer use
of the software and hardware. However a number of design improvements were
suggested by the subjects. These suggestions included: the location of the questions;
the addition of a map to show the location of the countries described in the text; the re
arrangement of buttons to take up less screen space; the inclusion of a button that
switched the balloon help on and off; and the provision of a one page summary of
simple user instractions rather than three pages of instractions.
Summary of Study 2: Use of the prototypes of the cognitive
tools
The data indicated that the preservice teachers did not have difficulty in using the
software. The cognitive tools designed for analysis of information (linked to the text,
graphs and table) required minimal instruction and most preservice teachers

172
understood how to use them after one demonstration. All that was needed after this
instraction was a summary sheet of instraction to serve as a reminder.
The concept mapping tool was a more complex tool to leam as it also involved
learning a procedure, but a one hour demonstration followed by a one hour
tutorial/practice session was all that was needed for preservice teachers to become
independent users of the tool. Indeed many did not need the additional hour of
practice.
While it may have been easy to leam to use the concept mapping tool, the cognitive
processes involved in synthesising information are more complex and require practice.
Thus use of the concept mapping tool may soon become obvious, but the process of
synthesising knowledge into a powerful integrated stracmre takes time to leam and
requires the leamer to spend time away from the computer to find more information
and to constract meaning.
The use of computer projection facilities to demonstrate the use of the tool to model
the concept mapping process proved to be a powerful way to inttoduce the tool to a
mass audience. In particular the preservice teachers liked the process of joint
constraction. During this process the researcher and the audience jointiy constracted a
concept map. The researcher "thought out loud" (articulated his thoughts) as he
created a specific concept map suggested by the preservice teachers. Throughout the
process the preservice teacher audience were encouraged to assist and to make
suggestions that improved the concept map. The benefit of this approach was that it
made explicit the cognitive processes used by the demonsttator.
The data also identified specific improvements that could be made to the tools and in
the procedure. The improvements accomplished were to:
• increase the size of the font of the text to 14 point;
• directly link key words in the text to the glossary. It was decided that
"hot" words would be identified by red letters and the user could click on
"hot" words in the text to link to fiirther information in the glossary;
• increase the size of the font of the text in the table;

173
locate questions adjacent to relevant text, table or graphs, or provide a
separate question sheet. However, the location of questions next to
specific information sources created three problems. First it forced
questions to be worded so that they related to the specific form of
information. Second the question took up valuable screen space. While
answers could be typed in and saved, too much screen space was
occupied. Therefore a separate sheet of paper was provided as well as on
screen questions already provided;
reword questions so that the user is forced to access different forms of
information presented. Users could access a variety of information
sources in order to answer some of the question. This feature is designed
to encourage deeper processing of the information presented;
use of balloon help to display a map which shows the location of the
countries listed along the axes of the graphs;
re-arrange buttons to take up less screen space - this feature is designed to
create screen space and to make navigation a Uttie easier;
include a button that switched the balloon help on and off. This feature
allows leamers to decide if they want to use the balloon help;
revise the concept buttons so that the size altered to suit the length of text
in the concept name. This feature saved screen space;
revise the shape of the concept tools palette so that it is a ribbon located
along the left hand margin of the screen. This feature saved screen space
and was simpler to manage than a moveable palette. Figure 6.8 shows
the redesigned tools palette.

174
Figure 6.8: The redesigned palette of concept map construction tools
|<»>4<[fT|
concept j
link
0 note
^r^ser
f help
VJEEII load
save
provide 'save to disc' and 'load from disc' functions for the concept
mapping tool. This feature will allow users to develop their maps outside
of formal tutorial times;
save the concept notes and link notes as a simple text file so that users can
take these home and revise them with their own word processor
application;
make the arrow links in the concept map moveable. This feature was
trialled but not used as the re-arranged map still needed alteration because
the moved links and concepts often overlapped with other hnks and
concepts. Therefore some still had to be deleted and redrawn . This was
particularly so with large and complex maps;
provide a one page summary of simple user instractions. This feature
provides a one page overview of the software.

175
Stiidy 2 investigated preservice teacher use of the cognitive tools developed. The data
suggests that the instractional sttategies employed were effective and tiiat the software
was easy to use.
As the preservice teachers became more familiar with the concept mapping tool and
with the procedure of concept mapping, their maps became more organised and more
complex. They created more links among concepts and made more extensive notes
that explained their concepts and the Hnks they created. This may be an indication that
the preservice teachers were beginning to use the concept mapping tool to restracture
their knowledge into more powerful, integrated frameworks.
The preservice teachers found that it was easy to use the cognitive tools designed to
assist them analyse the information about rainforest destraction. In most cases only
minimal instraction (a single demonsttation) was required. The data from interviews
and joumal entries suggests that the glossary, table sorting tool and the balloon help
feamres were used, and these tools helped the preservice teachers to gain a better
understanding of the context of the information presented.
While some of the preservice teachers went back to graphs and tables when
constracting their concept map about rainforest destraction, the majority referted to the
text and the glossary. However, the sample interviewed was small and further
investigation of this aspect is needed. At this stage of the study it appears that the text
and the glossary were the main sources of information used when preservice teachers
constincted their concept maps.
The ttacking data provided information about the time and frequency of use of the
cognitive tools. The data showed that it would be dangerous to rely solely on this
information as misleading results can occur when leamers are off-task. Therefore, it
is important that an observer be present when the software is used because any
irregularities in the use of the software can be noted.
Study 1 had identified cognitive sttategies that leamers use when tiiey mterpret graphs
and tables, and consequentiy the prototype analysis tools were designed to support
these cognitive strategies. Both Studies 1 and 2 were used to guide further
improvements in the design of the cognitive tools. The cognitive tools assisted some

176
leamers to interpret text, graphs and tables. Study 3 addresses this issue in more
detail and also reports on preservice teacher use of the concept mapping tool is smdied
in more extensively.

177
Chapter 7: Study 3-Use of the concept mapping and information handhng cognitive tools
Study 3 was designed to investigate preservice teacher use of the redesigned cognitive
tools and concept mapping program. Smdies 1 and 2 results were used to guide the
improvements that were made to the cognitive tools and these new features are briefly
described in table 7.1.
Table 7.1: New features of the improved version of the rainforest program
Feature
On/off button for balloon help
Map link
Revised palette of concept mapping tools
Expanding box around concept label
Horizontal arrangement of the buttons
Save to disc function
Function
turns balloon help on and off
shows the location on a world map of the countries listed in the graphs and tables
the tools buttons are arranged in a left to right order that mirrors the way most subjects used the tools in the trial version of the prototype
places no restriction on the size of the concept names, more efficient use of screen space
this creates more screen space for the concept map
allows subjects to save their concept map to a floppy disc, so that they can keep a copy of their work.
The improved version of the application is illusttated m the following captured screens.

178
Figure 7.1: The revised opening screen
Figure 7.1 displays the revised opening screen and the relocation of the on screen
buttons. The revised concept mapping tool is shown in figure 7.2. The palette in the
upper right hand comer was eventually altered to a vertical ribbon that was permanently
located along the left-hand border of the screen.
Figure 7.2: The revised concept mapping tool

179
The revised tools for interpreting tables are shown in figure 7.3. It shows how the size
of the font was increased and the amount of data increased. The second left-hand column
has been sorted and countries re-named according to the 1994 edition of tiie Times Atias
of the World (Time Books, 1994).
Figure 7.3: The revised display of tabular information
M^^^ ::^?Tf.<asw;^p^3?"

180
The revised tools for interpreting graphs are shown in figure 7.4. It shows how the
balloon help feature displays the location of a country when the cursor is located over the
name of the country. In this figure the location of Zaire is displayed.
Figure 7.4 : The revised balloon help for the graphs
,4^e,rate oC^^y :.J:-i:,\>- c tp
sappeanng Rainforestss'/J.-^ - '«««i»^ ~* £^
Research questions and hypotheses - Study 3
The methods used to gather and analyse data associated with research questions 3.1, 3.2
and 3.3 have already been described in Chapter 6. These questions were:
Question 3.1.
Could the instractional strategies identified by researchers (Gunstone & White, 1992;
Holley & Dansereau, 1984; Camboume, 1988) in related fields be apphed to effectively
inttoduce leamers to the concept mapping tool?
Question 3.2.
What effect does the concept mapping support tool have upon the way the leamers
stracture their knowledge?

181
Question 3.3.
Did the cognitive support tools assist leamers to analyse information in text, tables and
graphs?
Research questions 3.4, 3.5 and 3.6 focused upon leamer use of the cognitive tools and
the results are presented later in this chapter.
Question 3.4.
What impact did these cognitive tools have upon the concepts developed by the leamers?
To investigate this question it was necessary to draw upon techniques that allow the
researcher to find out what concepts have been developed and which forms of
information were accessed. Therefore data from concept map analysis, interviews, and
preservice teacher tracking files were used. The concept maps were analysed first to
identify any differences in the way the maps were constructed. Any pattems that
emerged were compared and then the data were compared with data from other data
sources such as the ttacking files and the interviews. A certain amount of re-analysis of
the data was anticipated as emerging trends would force re-examination of specific
aspects of the data.
Question 3.5.
Do ttacking data provide insights about the way in which the tools were used?
The tracking data were collected automatically after the user logged on to the software.
The data were displayed as a spreadsheet table which indicated the total time and the
frequency that a user viewed each screen. These data were compare with data from other
sources in order to substantiate whether the primary data alone can provide reliable
information to instractors.

182
Question3.6.
How did the leamer access information within the apphcation?
Again multiple data sources were used. Tracking data were used to describe the
frequency and time that the leamer spent processing the various information sources: the
ttacking data recorded; the total time spend at each information screen; and the number of
times each screen was accessed. This data was compared with interview ttanscripts and
with data from the analysis of concept maps.
Hypothesis 3.6.1
The independent variables of positive attitudes to computers, male gender, a younger age,
and preferred leaming style will predict greater time spent in using specific information
screens .
Hypothesis 3.6.2
The independent variables of positive attitudes to computers, male gender, a younger age,
and preferred leaming style will predict higher frequency of subject referrals to specific
screens of information.
Experimental procedure - Study 3
During this study Year 3 preservice teachers (n=80) used the rainforest apphcation. They
used the concept mapping tool before they used the information relating to rainforest
destraction. Because individual concept maps were required preservice teachers had to
work alone when they used the improved version of the software.
The improved version of the application was used over a five week period. During this
time preservice teachers received four formal lecture/demonsttations and five one-hour
tutorials. As each tutorial group consisted of 12 to 14 preservice teachers, 6 hours of
laboratory time were required each week for the 80 subjects. The computing laboratory
was also available for further use for 6 hours each week. Table 7.2 describes how the
formal instraction time was organised and when the concept maps were collected.

183
Table 7.2: Organisation of instruction and collection of data
Week
1
2
3
4
5
Lecture
Introduction to the tool and joint construction of a concept map about astronomy
Feedback on practice maps
Description of planning task- joint construction of an example
Feedback on map 1
No lecture about concept mapping
Tutorial
practice
further practice
construction of map 1
map 1 revision,
complete map 2
Data collected
journal entry, practice maps
joumal entries
map 1, joumal entries
joumal entries
map 2, joumal entries
Preservice teachers were instracted in the use of the concept mapping tool. This ensured
that each subject who used the improved version of tiie rainforest application was familiar
with the user interface and had six hours of formal instraction in concept mapping
procedures. During the final tutorial session subjects were asked to use any of the
cognitive tools available to help them to process the information in the text, graphs and
tables presented. All subjects were instracted to use tiie concept map tool to create a map
of their understanding of the information presented on the screens. While they were
completing this task, tiie tiacking software monitored subject use of the software, and tiie
researcher made notes of any events that needed to be followed up with interviews. At
the end of the session all completed concept maps were saved to each subject's disk file
and later printed out by the researcher. Any subjects who needed more time to complete
their concept map had the opportunity to continue as tiiere were four spare computers
available in an adjacent multimedia production room. If this was inconvenient subjects
could also come back at another time as the ttacking program could accumulate data from
multiple fUes of single users.
Results from Study 3: Researching use of the improved
cognitive tools
Use of the improved concept mapping tool
The concept mapping tool was used to constract concept maps about a science topic
chosen by preservice teachers. The map had to include concepts tiiat were suitable for tiie
primary school class that tiie preservice teachers would instinct later in the year. Also
instractional activities had to occupy approximately 15 hours of instraction time. Thus the
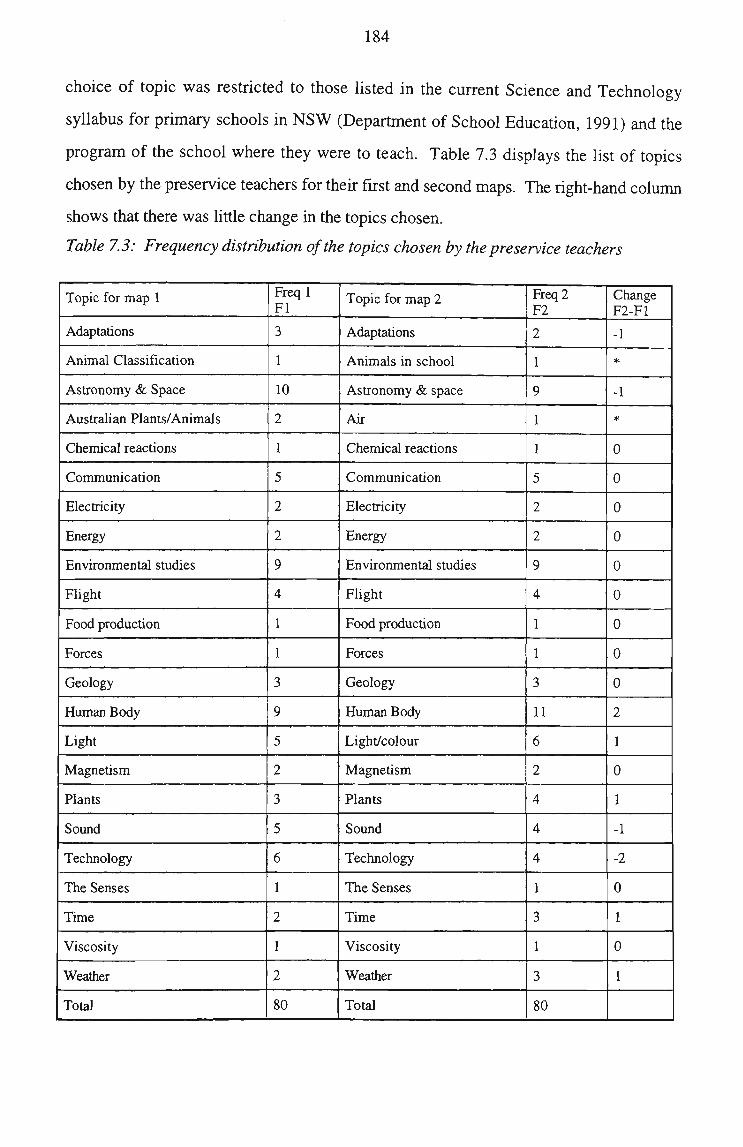
184
choice of topic was restricted to those listed in the current Science and Technology
syllabus for primary schools in NSW (Department of School Education, 1991) and the
program of the school where they were to teach. Table 7.3 displays the list of topics
chosen by the preservice teachers for their first and second maps. The right-hand column
shows that there was little change in the topics chosen.
Table 7.3: Frequency distribution of the topics chosen by the preservice teachers
Topic for map 1
Adaptations
Animal Classification
Astronomy & Space
Australian Plants/Animals
Chemical reactions
Communication
Electricity
Energy
Environmental studies
Flight
Food production
Forces
Geology
Human Body
Light
Magnetism
Plants
Sound
Technology
The Senses
Time
Viscosity
Weather
Total
Freq 1 Fl
3
1
10
2
1
5
2
2
9
4
1
1
3
9
5
2
3
5
6
1
2
1
2
80
Topic for map 2
Adaptations
Animals in school
Astronomy & space
Air
Chemical reactions
Communication
Electricity
Energy
Environmental studies
Flight
Food production
Forces
Geology
Human Body
Light/colour
Magnetism
Plants
Sound
Technology
The Senses
Time
Viscosity
Weather
Total
Freq 2 F2
2
1
9
1
1
5
2
2
9
4
1
1
3
11
6
2
4
4
4
1
3
1
3
80
Change F2-F1
-1
*
-1
*
0
0
0
0
0
0
0
0
0
2
1
0
1
-1
-2
0
1
0
1
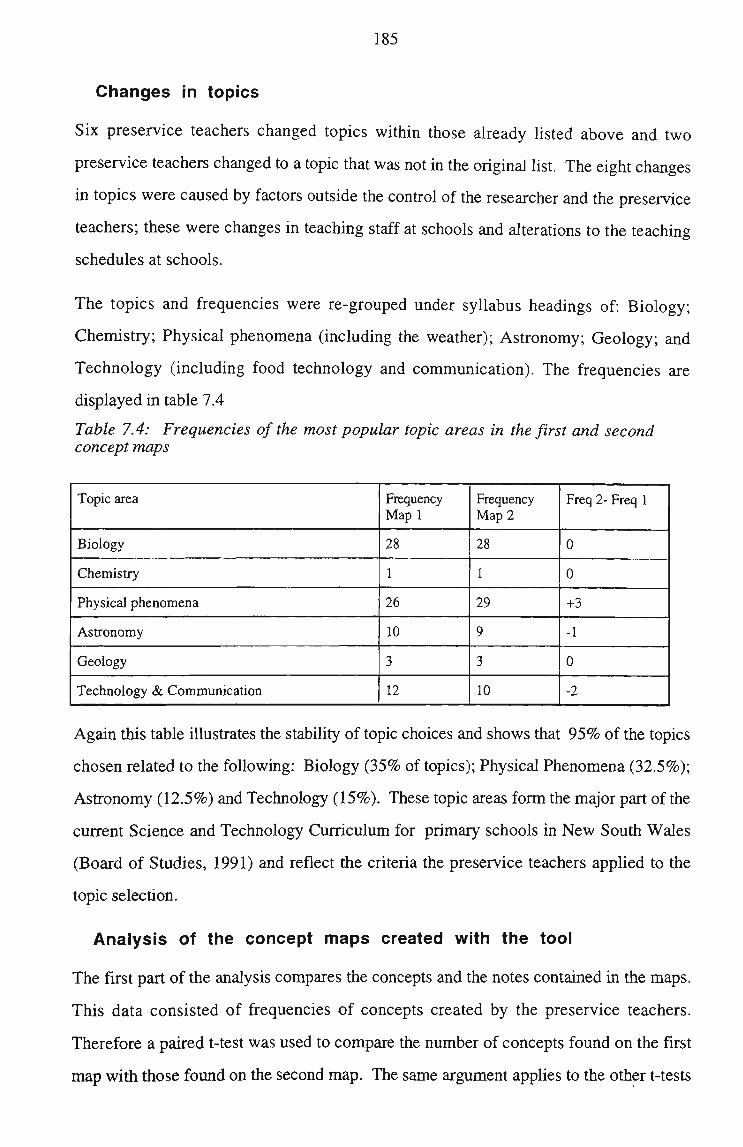
185
Changes in topics
Six preservice teachers changed topics within those already listed above and two
preservice teachers changed to a topic that was not in the original Ust. The eight changes
in topics were caused by factors outside the conttol of the researcher and tiie preservice
teachers; these were changes in teaching staff at schools and alterations to the teaching
schedules at schools.
The topics and frequencies were re-grouped under syllabus headings of: Biology;
Chemistry; Physical phenomena (including the weather); Astronomy; Geology; and
Technology (including food technology and communication). The frequencies are
displayed in table 7.4
Table 7.4: Frequencies of the most popular topic areas in the first and second concept maps
Topic area
Biology
Chemistry
Physical phenomena
Astronomy
Geology
Technology & Communication
Frequency Map 1
28
1
26
10
3
12
Frequency Map 2
28
1
29
9
3
10
Freq 2- Freq 1
0
0
+3
-1
0
-2
Again this table illustrates the stability of topic choices and shows that 95% of the topics
chosen related to the following: Biology (35% of topics); Physical Phenomena (32.5%);
Asttonomy (12.5%) and Technology (15%). These topic areas form the major part of the
current Science and Technology Curriculum for primary schools in New South Wales
(Board of Studies, 1991) and reflect the criteria the preservice teachers applied to the
topic selection.
Analysis of the concept maps created with the tool
The first part of the analysis compares the concepts and the notes contained in the maps.
This data consisted of frequencies of concepts created by the preservice teachers.
Therefore a paired t-test was used to compare the number of concepts found on the first
map with those found on the second map. The same argument appUes to the other t-tests

186
employed to analyse similar data in this section of the chapter (Howell, 1992, pp. 189-
190).
Eight data sets were eliminated from the analysis because it would have been invalid to
compare the first and second maps of the 8 preservice teachers who changed their topic
(in these cases the second maps contained a similar numbers of concepts to the first).
While tiiere was a slight increase in the number of concepts listed on the maps, tiie results
of a paired t-test show that the difference is not statistically significant at the .05 level of
significance (t=-1.7, df=71, p=.095). However, the addition of more concepts on a map
is not necessarily an mdicator of a better concept map as it is more important that concepts
are organised and linked into powerful integrated frameworks (Jegede, Alaiyemola, &
Okebukola, 1990).
It may be more important to examine the notes created by the preservice teachers as the
number of concept notes and the link notes were far greater in map 2 than in map 1.
Table 7.5 summarises the descriptive statistics associated with this data.
Table 7.5: Summary statistics for the concept notes and link notes associated with concept maps 1 and 2
Key Cnotesl=concept notes & link notes in map 1, Cnotes 2=concept notes & hnk notes in map 1
Mean:
2.7
Minimum:
0
Mean:
12.4
Minimum:
3
Mean:
.7
Minimum:
0
Mean:
5.7
Minimum:
0
Std. Dev.:
2.6
Maximum:
10
Std. Dev.:
5.7
Maximum:
33
std. Dev.:
1.3
Maximum:
6
std. Dev.:
5.5
Maximum:
22
X l Std. Error:
: Cnotesi Variance:
.3
Range:
6.7
Sum:
10
X2 Std. Error:
197
: CNotes2
Variance:
.7
Ranoe:
32.7
Sum:
30 .
X3 std. Error:
893
: Lnotesi
Variance:
.2
Range:
1.8
Sum:
6
X 4 std. Error:
50
: Lnotes2 Variance:
.6
Rat>ge:
29.8
Sum:
22 410
Coef. Var.:
94.4
Sum of Sqr.:
1013
Coef. Var.:
46.1
Sum of Sqr.:
13397
Coef. Var.:
194.3
Sum of Sqr.:
164
Coef. Var.:
95.9
Sum of Sqr.:
4452
Count:
72
# Missing:
0
Count:
72
# Misstnq:
0
Count:
72
# Missing:
0
Count:
72
# Missing:
0

187
A paired t-test showed that there was a statistically significant difference (t=12.4, df=71,
p=.0001) between the number of concept notes attached to each map. Similarly, a pau-ed
t-test showed that a statistically significant difference (t=7.4, df=71, p=.0001) m the
number of hnk notes attached to each map. This may be a better measure of the quahty of
the maps.
The number of cross links was also compared and again there was a statistically
significant increase in the number of cross-links in the second map (t=2.2, df=71,
p=.0292). The levels of hierarchy were also compared and again there were significant
increases in the number of levels of hierarchy (t= 4.9, df=71, p=.0001).
The statistical tests on data that compared the first and second maps showed the
improvements observed were unlikely to have occurred by chance. The improvements
were: an increase in the number of concept notes and link notes; an increase in the
number of cross-links; and an increase in the number of levels of hierarchy. These
increases indicate that the preservice teachers improved in their ability to constract
concept maps. Several factors would have contributed to this improvement and these
include further practice with the tool, additional instraction in concept map constraction,
help from peers as well as research away from the computer.
In the past, researchers such as Novak and Gowin (1984) have compared total scores
allocated to each map, but the concept mapping tool used in this study allows users to
include attached notes and this adds another dimension. Therefore it may be more useful
to consider each feature separately rather than in combination. The notes, in particular
need further analysis and during this study two approaches were used. One was to
simply count total words written in the notes created for the first concept map and
compare it to the total for second concept map. The second approach was to examine the
content of the notes.
A paired t-test was used to compare the total words written in the notes attached to
concepts in concept map 1 to those in concept map 2. The results were again significant
(t=l 1.4, df=71, p=.0001). A similar result was obtained when the total words written m
the link notes in concept map 1 were compared with those in concept map 2 (t= 6.3,
df=71, p=.0001). While the results of this analysis show that the increase in the number

188
of words contained in notes was statistically significant, this analysis does not measure
any improvement in the content of these notes.
When the contents of the notes were examined, the following improvements were noted.
The concept notes attached to map 2 contained accurate definitions (95% of maps for map
2; 83% for map 1), and outiines of insti^ctional activities that could be used to explain tiie
concepts to children (89% of maps for map 2; 57% for map 1). The Imk notes provided
information about one or both of the two concepts linked (32% of maps for map 2; 13%
for map 1), or explained the link (58% of maps for map 2; 12% for map 2). Link notes
were not as lucid as the concept notes and this finding supports the claims of White and
Gunstone (1992) that students find it difficult to write links and it takes longer to acquire
the skill of writing good Unk notes.
Interview data about the use of the concept mapping tool
Two interviews were conducted with fourteen preservice teachers. Their ages ranged
from 22 to 48 years and represented a cross-section of the ages in the cohort. The first
took place within a week of completing the first concept map and the second occurred
within a week of completing the second concept map.
Before the interviews the preservice teachers were advised that they should bring their
printed concept maps and any reminder notes to the interviews as they would be
discussing the concept maps they created and how they used the concept mapping tool.
A copy of the interview questions appears in Appendix 7.
The interview ttanscripts were coded and common themes collated. Then instances in the
ttanscripts were identified and illustrative quotes collated. The common themes that
emerged from this process are discussed under the headings of: initial concems, use of
the tool to construct concept maps, revision of concept maps, and other uses of the
concept mapping tool.
Initial concerns
When the students began creating their concept map they had concems about what a
concept map is, how to constract a concept map and about the technology they were to

189
employ. These concems are discussed under these headings and relevant quotes from the
interview ttanscripts are used to illusttate these issues of concern.
What is a concept map?
The quote from Ruth (aged, 30) is typical of the sttidents (2 of the 14 interviewed) who
had past experience with the less formal procedure of "mind mapping" (Buzan, 1995).
She stated "I'm not really sure, everyone seems to have a different view of what a
concept map is about." While Ruth claimed that "everyone seems to have a different
view", further discussion revealed that she was comfortable with the process of mind
mapping, but found the rales of the concept mapping process more resttictive. However
those students (12 of the 14 interviewed) who were not familiar with other semantic
mapping procedures readily accepted the concept mapping procedure presented and were
more certain about what they had to do. This is an example of where prior leaming
experiences may initially interfere with new learning experiences.
How to construct a concept map
Again Ruth (aged, 30) who had prior experience took a different approach to the
constraction of her concept maps. She stated that "I tended to bury a lot of the
information in the notes and I felt... all of the concepts are buried in the notes". While
her method of constraction was different to those used by many of her peers, close
analysis of her attached notes showed that she had a high level of understanding of her
preferred topic "The Human Body" (Ruth is a qualified pathologist). Other preservice
teachers copied the approach demonsttated in lectures and tutorials and spread their
concepts into neat spatial artangements on the computer screen, but these maps contained
no more detail and demonsttated no greater understanding than Ruth had. She had used
the concept mapping tool in a different way, but was as successful as the rest of her
peers. Ruth's prior experience probably influenced the way in which the tool was used,
but this did not affect the final outcome. Her knowledge was just organised in a different
way.
Concerns about the technology
Many students expressed concems about the technology and these related to two issues
the use of an unfamiliar computer system (even though all had completed a 15 week
190
subject with the same computer system), and anxiety associated with the use of
computers.
The fear of technology is expressed by Sally (aged, 20) who stated:
a lot of people (students) are scared of computers and even if it is something
simple they want to be reassured that they're doing it right because they're scared
that it's a big technological thing and it's going to jump up and bite them.
Val (aged, 35) stated that "Initially I found it a little daunting because I am not familiar
with the Macs" but later in the interview she stated:
that it really is something that we ought to be forced to do in more things. Whether
or not we like it or are comfortable with it, I think it is the way of teaching and
whilst I would certainly be more comfortable doing it at home, I think it is a
necessary part of our teaching way.
Thus she was prepared to work outside her zone of comfort as she could see that it would
benefit her in the fiiture.
Younger preservice teachers also expressed similar concems and Danielle (aged, 20) said:
I had reservations before I began because I don't like computers and I'm well known
for that, but the spatial concepts really appeal to me and the note behind them.
Like Val, Danielle overcame her initial fears and found that she could effectively use the
software.
Once the initial concems were put to rest, the students were able to concenttate on the
process of constracting their concept map and as Helen (aged, 28) stated:
I thought I would have problems because I am technophobic, I'm scared, and if I
have my way, I would rather usually write or go to the bookshelves in the library
rather than use a keyboard.
At the end of the interview, however, she stated "I've enjoyed it.... I'm just not so
technophobic now."

191
Use of the tool to construct concept maps
The interview transcripts revealed that two basic approaches were used. The first
approach was to start with a main concept at the top or on the left hand side of the screen,
"brainstorm" as many concepts as possible and locate them anywhere on the screen.
Later these concepts were rearranged into a pattem that had meaning for the student.
Then links were drawn among concepts; finally notes were added. Ten of the 14
students interviewed used this approach. All of these students had preferred leaming
styles that were either accommodators (doing, involved, impatient, people) or divergers
(imaginative, emotional people). Further investigations with a larger sample would need
to be made to further clarify this issue about any relationship between preferted learning
style and the way learners constract concept maps
As Sally (aged, 20) said:
I created a box with the idea in it and then I had a few more ideas that were related
to that so I just created a lot of concepts on the page, not necessarily in any
particular order and then I moved them around so that they were in some sort of
sequence and by moving them around, I think, I kind of decided that some of them
needed to change so I erased those concepts and put in new ones that were better
related to the topic and then I kind of put links in and then the notes.
Figure 7.5 shows Sally's map. Her concept map contains concepts and names of people
as well as some questions. It is spatially organised and contains notes which explain her
concepts and links.

192
Figure 7.5: Sally's concept map
(COrt Cloud )i
farriat is a Lomet ./j
\ i finiiere Do tomets Come FromJI r
fi^omets and HurQaD_Hii|gjr^
[(Halleus Lometjl
Ipomets g Meteorj}
(lUtiat IS a Meteorite?)j
UJhere Do They Come From^
t ^
LUho was Halley? Schumaker Leu!
fCEHDloration ot comets)]
Famous Comet Spotters
lijaJOigJiJi: N3 impact upon ^ Eaxth^ lo$s of lif e| 1
Galileo Probe [Uoyager1 & 2 f)
Comets and Planets Don't MiK
Mary B (aged, 38) used a similar approach to Sally and said that she:
"..started with the concept tool first. I put them where I thought they would better
connect. Then I used the link tool. I've sort of gone back and forth a lot."
Again her map contains comprehensive notes that relate to her links and concepts.

193
Figure 7.6: Mary's concept map
((Thrust))
Wind ismfKTWTig aij . It is eneigy which is am essential element in flight,
:i;DJ::=jjjnili:Hi;jiljJiJHJ5 A i rcra f t s; * Fiistdesigisof Aiicitaftweie attempted aitei obseivaticm ofbiids in f l i ^ t . * Desigo and Make i- Use a variety of mateiials and test pioceduxes foi the following. Piedict outcomes. - Propellois/Rotois (paper helicopter) -Jets (balloon on wire) -Flaps (paper/cardboard aira:aft) -Wings (test several paper designs tied to wire on chair legs - use fan to blow air)* Observe and record results.* Re-adiust/itnprove designs •* Research
[shape]
l;Dg:=iJ:!=;;i Hot air Bxpands/iises creates lift
affects flying and influences airspeed and fuel efficiency
ijJDJNJ Air resistance giiji slows down aizaaft and creates drag. Modem aircraft are designed to reduce ditag.
o
Students who used the second approach arranged a few concepts around their main
concept and then added notes and links, then more concepts and links. At first glance, it
appeared to be less efficient but the maps produced were as comprehensive as those
produced by the first approach. Two of the 14 smdents interviewed used this approach.
Kerry W. (aged, 35 ) said:
I wrote the first concept, typed in the first few concepts and then I wrote notes. I
typed in some more concepts, modified a few to make it clearer, made the concepts
more clear and then I came back and put the links in and I thought about wording
the links and then I thought, no that's something that I have to go home and have a
good think about, so then I started writing the notes, typing the notes out.
Figure 7.7 shows her concept map and shows that the notes behind the concepts were
comprehensive. Kerry and Julie were the only two preservice teachers interviewed who
constracted their concept maps by arranging clumps of concepts around their main
concept and then adding notes. It was noted that both had the same preferted learning

194
style (Assimilator - conceptual, less practical people). Once again fiuther investigation of
this issue with a larger population is wartanted.
Figure 7.7: Kerry W's concept map
"^^ CCInuestiq^tinqjReTuse In Our EnuironmeiTn]
can be classified as Q.
\.|;iD:glljyiJ=;jj N2 HSJJjjjJsHiJiJjJi
sDHgillJ Man-Made Refuse I
tCRecuciable H e t u ^
Materials that do not readily decompose and so need to undezgp the process of commercial recycling-ACTIVITY! n II iM '
can be classified as
tNon-Recucled RetusepJ
gfrnastTi F H Q J I B "
roecomposition)! ^ \ t.^^^^
,-^ ,. [(Creek Pollution )j
^fUeusable Refuse^
m ri;iiiiiiihiiiiiii;nTinranTT7ii
iiOliisJ Composting ii
fiHnjTEanm
\ . , ^ f f r r fects on Plant Life )
A natural biological process in which bacteria, fungi, yeasts, slime moulds, worms, beettles.andbug?
I 1 [ninnpmiimTmnHiFM
jljjjijnjijji: Decomposition iinn-iiiJi Naturally occurring items break down naturally by decomposers such as fungi/ bacteria, and small animals. The elements in the environment help to speed up this process. ACTIVIT'Y: The decomposition experrmemt described f orTnan-made refuse will illustrate this concept as well.
[(Glass Recuclinq )i
The method used varies a great deal but the different methods did not necessary lead to
very different outcomes.
Thinking processes
Many students realised that the concept mapping tool was a thinking tool and as Helen
(aged, 28) said:
I started to create a concept and tried to actually use the tool to make the join, the
line, the links. Later on I realised it would be better just to get it all out of my
brain and then arrange it, use the tool.
The following quote from Leanne (aged, 35) shows that she took a similar approach and
said:

195
well I basically sort of just dived in and I knew, because I had my topic sort of in
my mind and I hadn't done anything on paper whatsoever so I walked in there
basically with an idea in my head and went to work and sort of exploded this
concept map about my topic of communication.
Later in her interview Danielle (aged, 20) summarised this aspect of the tool when she
said that" It helps me clarify my own thoughts ...". For her, use of the computer-based
tool seemed to become obvious and the technology moved into the background as she
used the tool as a thmking tool.
Features of the tool that helped them to construct their maps
The preservice teachers described various features of the concept mapping tool that they
felt helped them to constract their concept maps. These features are discussed in the
following section.
Hidden notes
The feature of the hidden notes behind concepts was mentioned in four interview
transcripts. As Adele (aged, 20) stated, "The notes are good cause you can have it
behind there without having paper all over the place." Mary (aged, 38) agreed with her
but pointed out that," I liked the way that when you had a note behind it, it had a double
band around it." She liked this feature because when she came back to use the application
again she could see at a glance which concepts and links had notes attached. All of the
students interviewed liked the note feature because it left room on the screen to add more
concepts, and as Ruth (aged, 30) said "there's heaps of room...".
Sally (aged, 20) probably best summarised the benefits of this feature when she stated:
It's a very neat way of getting the notes behind the concepts. I really liked that idea
so that you could have the information about it and the thing of being double lines
when it's got a note behind it because then I can say OK, that's the concept that I've
been working on. OK, here's another concept which I haven't done anything on yet
which I have forgotten about. Whereas if you are writing with pen and paper and
you've got the notes on a separate sheet and you've got the concepts on another, it's
not so easy, it's not so visually clear, straight off.

196
Other features mentioned were the ease of use and appeal of tiie final printed copy. As
Adele (aged, 20) said ," ...it'd be easier...that's why the print out's good because then
you can see what you've written" and Kerry (aged, 35) agreed when she said
"...certainly looks better... it's more presentable.
Barbara (aged, 48) said that:
it was really self explanatory once you got involved in it so it was just a matter of
choking on concept and actually making the concept itself and then as I said it was
pretty simplistic to just go through all those things. The hardest part for me was
figuring out what I was going to do.
Kerry's (aged, 35) transcript supported Barbara's comment when she said:
the tool bar is good instead of having to use a pull down menu. Just having it there
to click on is heaps easier than having to pull down all the menus and trying to
work out where it is. It's less, it's harder to make a mistake really because you've
got that big box to click on.
Another feature mentioned in 7 of the 14 transcripts was that it was easy to edit and revise
their maps. As Val (aged, 35) stated:
I'm more comfortable with a pen and paper but I'm not sure whether it would be
time effective. The beauty of this thing is that you can put it on, rub it out,
change it around as many times as you want to.
Revision of concept maps
As the students became more experienced they realised that they needed time to revise
their concept maps and some of this time had to be spent away from the computer. The
following approaches emerged from the tianscripts: the use of pen and paper at home (5
tianscripts); writing over a curtent print out of the map (5 transcripts); nartowing down
the maps and making the concepts more specific (11 transcripts).
One reason for using pen and paper at home was lack of access to a suitable computer (8
tianscripts) and as Kerry S. (aged, 20) stated, she worked at home and hked to:
197
write in link notes at home so when I get into the computer room it doesn't take
me as long to do it because access is a bit hard but if I had it at home I wouldn't
have used pen and paper I would've just done it straight on there.
Juhe (aged, 32) felt that she needed to work at home and that:
the final product was a result of like numerous and I mean numerous pen sessions
where I was sitting down with paper and mapping out where I wanted to go. When
I look at like the final product and the first one I did, it's, they're chalk and cheese
because the first one was really where I wanted to be at the end and I had to work
backwards and start from the beginning and work to where I wanted to go... it took
me a lot of time at home sitting with numerous amounts of scrap paper and
working out where I wanted to get to because I think I knew too much about the
subject in the beginning .
Julie chose the Human Body as her topic as she is a qualified nurse. However, she soon
found that when one has a great deal of knowledge about a subject it can be difficult to
present it as a manageable whole to others.
While Leanne (aged, 35) also invested a great deal of time at home revising her map, she
reahsed that if she had access to the hardware and software at home the task would have
been easier. She stated:
I did it with pen and paper but what I found was I had to have a piece of paper for
this note and then some piece of paper for link notes and a piece of paper for this;
whereas if you're actually doing it when you're at the computer you haven't got all
these sort of things. When I was trying to just input it onto the concept map I
worked on the text in particular, but when I went to input it I sort of was still
rifling through sheets of paper here and there and trying to find notes ... The tool
keeps it nice and neat and you know where everything is and you can go from one
to the other and check back and that and it's very simple, it stays organised for you.
Ruth (aged, 30) came into the computer room on many occasions and revised her map in
this room. She stated :
198
You just zip it around and change a whole idea there and then because I find as
you're developing a concept map you start off small and the more comfortable you
get with it you just keep going broader and broader and you get better ideas. The
first part you always start off, you go, 'Oh yuk, cross that out and start again'.
Whereas this it's an evolving thing all the time. You're updating it all the time and
it's getting better and better whereas paper because it's restrictive you tend to be
restricted cause you can't be bothered having this mess everywhere but you just tend
to go in the direction that you first thought of whereas this way you can change on
the spot.
Danielle (aged, 20) also went to the computer room to revise her map and said that:
after two weeks of using this tool to revise my map I really quite like it, because
the concepts can be moved around and you don't have to rub out and take extra
effort. It's just easy to manipulate what's going on so I wouldn't use a pen and
paper at all.
Narrow down concepts and revising deflnitions
Ten of the 14 interview transcripts mentioned the need to narrow down their concept
maps to a more manageable size and to re-name concepts so that their meaning is clearer.
During her revision process Loretta (aged, 32)"... changed the names of the concepts to
be more scientific rather than general terms." She felt that these changes developed her
map into a more powerful and integrated representation of the knowledge that she wanted
to teach to children. Adele (aged, 20) also narrowed down her concepts and she
described how she achieved this.
First off I wiped out the longitudinal waves and speed of sound and then I put some
notes behind the how sounds travel and sound vibrations ones and I was trying to
modify it so it's more suitable for teaching than to teachers which I was really
doing last week cause I was just getting it out of a book. I'd narrowed down the
main concepts.
Figure 7.8 shows Adele's map undergoing the modifications she discussed.
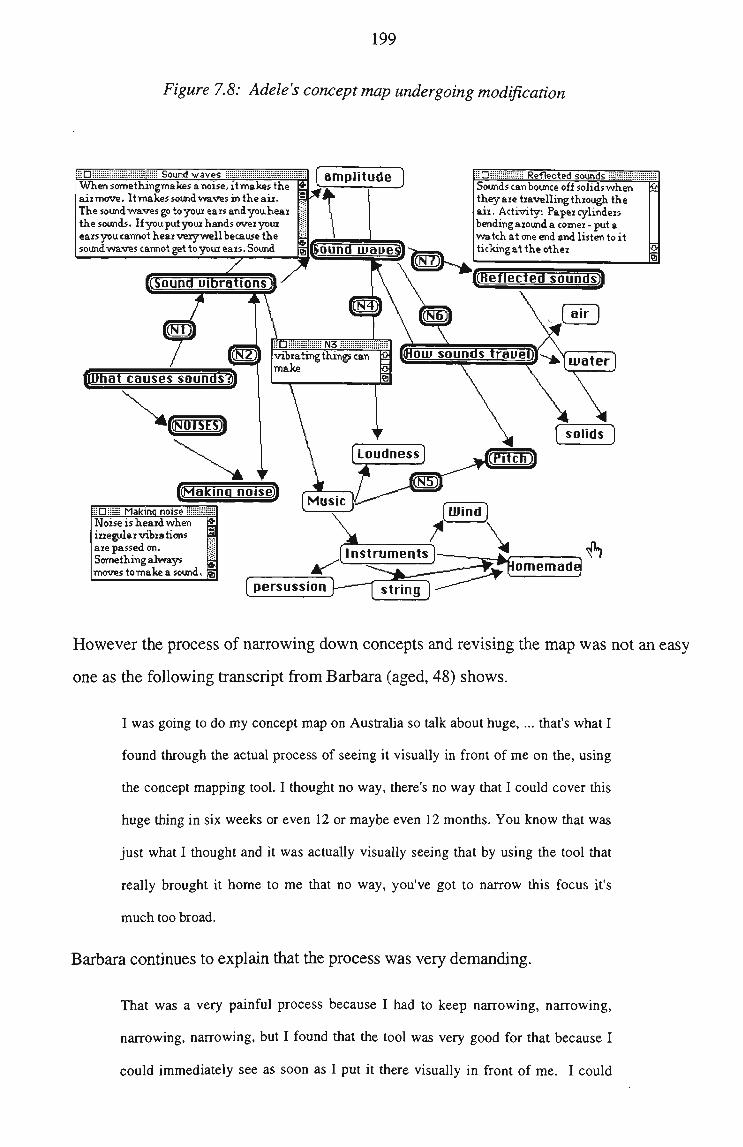
199
Figure 7.8: Adele's concept map undergoing modification
D Sound waves When somethmgmakes a noise, it makes the S air move. It makes sound waves in The soundwaves go to your ears andyoi the sounds. If you put your hands aval ears you cannot hearverywell because soundwaves cannot get to your ears • Sound
(f founTuiEraflon^ :i:i^—y^
:HDiJ:;:;=a;=IJ:=; Reflected sounds; Sounds can bounce off solids when they are travelling throu^ the air. Activity. Paper cylinders bending around a comer - put a watch at one end and listen to it ticking at the other
[(Heriecteo soundsil
Cuhat ca'usefsoundsTJ
vibrating things can make
a f^ouj sounds traueJ^h^^ ^_-n
Noise is heard when irregijdar vibrations are passed on. Something always •moves to make a sound. |B ^
[instruments]
persusslon ]•—-^ string ] omemadq
o
However the process of narrowing down concepts and revising the map was not an easy
one as the following transcript firom Barbara (aged, 48) shows.
I was going to do my concept map on Australia so talk about huge,... that's what I
found through the actual process of seeing it visually in front of me on the, using
the concept mapping tool. I thought no way, there's no way that I could cover this
huge thing in six weeks or even 12 or maybe even 12 months. You know that was
just what I thought and it was actually visually seeing that by using the tool that
really brought it home to me that no way, you've got to narrow this focus it's
much too broad.
Barbara continues to explain that the process was very demanding.
That was a very painful process because I had to keep narrowing, narrowing,
narrowing, narrowing, but I found that the tool was very good for that because I
could immediately see as soon as I put it there visually in front of me. I could

200
immediately see, that no, no, there's too much here, I've got to get further into
this and narrow it down further. So I thought that was excellent for that because I
am visual so I need to be able to see that.
In the end she was satisfied with her final map but it took her a great deal of effort.
Barbara worked informally with Ruth who also made use of the computer laboratory in
her spare time to revise her maps. Like Ruth, Barbara was familiar with the process of
mind mapping which uses a much less disciplined approach to the creation of semantic
networks. It appears that she had more difficulty narrowing down her concepts because
she was more comfortable with this less formal procedure. The process of forcing
students to produce a map that included concepts that were suitable for primary school
and could be dealt with during approximately 15 hours of instraction may have forced
her to become more selective in her choice of concepts and to integrate them into a more
powerful and comprehensible framework. Figures 7.9 and 7.10 show Barbara's first
and second maps. It can be clearly seen she nartowed down the focus of her map.
Figure 7.9: Barbara's first map
(^EiUCOMERS
HISTORV
IjaiinHHiiillJI; N1 There are nnany races 2 of people living and workingwithin Australia, The govemrnemt policy of Multiculturalism encourages these races to live and work in harmony.
CORSTRL
iD:IIJII;JiJJili;JiJ:ii;:Ji AUSTRALIA; Largest island continent in the world. Only continent that is governed by a sin^e government body. Situated in the southern Pacific Ocean within the region known as South East Asia,
[INDIGENOUS
[INTRODUCED
>1flMMRL^
Q
RAINFOREST 1
y \
[UEGETBTION]
[GRBSSLRNDS]
J:asi;;a:lliHiga ANIMALS W There are many unique animal species found within Australia, They can be broadly categorised into mammals and
DESERT]

201
Figure 7.10: Barbara's second map
iiiDliJinnniiHinH introduced i The term introduced species refers to the animals that have heenbrougjht into Australia, either i'ntentionally or accidentally. Becausemanry of | S /
:J:Dii:i:=; animals at mu place jlgHllJlil!
tCanimals at mu p i a ^ ^
This unit looks at the types of 12 animals both introduced and native that would be present within either the home or school environment,
[Cintroducedj]
introduced animals and native animals have the same needs g
these are found around |S my house and sometimes in nry house g
possums] lizards j
birds ]
[(ban p e t ^ . [ solutions ]
introduced animals cause problems % from native animals because they * compete with them for scarce
III nil LN4J what happens if we o | p ^
keep pets in doors^ make natiue animals our pets ]
Six transcripts mentioned the need to see the on-screen display of the concepts and how
this visual display assisted them to see faults in their maps. As Kerry S. (aged, 20) said:
I feel it made my uiut better because the visual aspects made me see that I wasn't
using everything to do with electricity.
Sally (aged, 20) changed the arrangement of her concepts several times before she was
satisfied. She stated:
I keep changing where my main concept was from the top to the side and back
again, because I just want to have it so that it looks, so that I can follow it with
my eyes so that I can see the sequence that I'm talking about. I want what's on the
screen to look hke what's in my brain.
Leanne (aged, 35) also altered the stracture of her map and described these changes as
follows.

202
I've gone from having my main concept at the top and working down to having my
main concept at the side and sort of having a top half and a bottom half and I found
I could organise my concepts better by changing the overall format. I've also
changed the names of some of the concepts to what I consider to be more related to
the activities and the content when I've tried to explain them.
The challenge of writing link notes
Four of the transcripts mentioned that the link notes were often difficult to write and
added another layer of complexity. As Kerry (aged, 20) states:
I thought it was all perfect and then when I was actually writing die hnk notes that
just didn't make sense having the arrow that way because you can't explain it.
She then continued to describe the revisions that were needed when she stated:
I had to look up some things but it makes you really think how to write short link
notes as well but how to make the concept links clear. It's hard to explain how they
link.
These findings support the previous work of White and Gunstone (1992) who asserted
that the writing of links was one of the most 'irksome' tasks for leamers.
Time to think about the map and preparation
The more conscientious students took time to develop their maps and to find more
resources so that they could come to the computer room well prepared. This meant that
they could efficiently use their time when they were in the computer room. As Loretta
(aged, 28) states, "It took time to develop the actual concepts but not the actual concept
map itself.". Kerry (aged, 20) elaborated on this point when she stated, "You've got to
do some work before you go there." Also she asserted that "you have to know
everything to put in the concept map so really it's prerequisite knowledge for what you're
going to do in a teaching unit."
Sally (aged, 20) also spent time gathering information from a variety of sources and she
described how she did this.

203
I've spent a little bit of time especially when I went home and I got to look at my
books on my bookshelf so I found a really good space atlas and a few other things
and I work at the Science Centre where they've been playing a comet video, a video
about the history of Halley's comet. So I've been paying attention to that so I'm
more conscious of things about comets at the moment and I specifically look for
information on comets although not so much meteors because they're a bit harder
to get information on.
Others liked to work at home and to spend time away from the computer laboratory. Five
tianscripts from mature age students (aged 32 and over) mentioned this point. The
following transcripts from Val (aged, 35) and from Kerry W. (aged, 35) are examples.
Val said, "I would have preferted to have done this at home in the privacy of my own
scene with my own known ways of doing things. " Val went home and did some
homework and stated:
I got to some fairly solid ideas I thought that I was comfortable with. Then I
brought my notes in this morning and worked on a concept map. Other than the
physical setting out on the page, I am not unhappy with it.
Kerry also wanted also to work m this way and said:
I'd like to take it home because I need, I really need to diink before I can sit. Like
an hour's not long enough to sit there and do what we have to do and when you
finally sit down and your thoughts have melded and you're ready to type, nearly
time to go. So I'd rather spend a lot more time sitting Uiere with it, over 2 or 3
hours and a bit more quiet at home would be best.
Barbara (aged, 48) revised her map at home as well as in tiie computing laboratory. She
liked to work witii pen and paper as well as tiie computer because she felt tiiat:
There's something that happens between my head and my hand that helps me and
it's probably a psychological thing. It just helps me, I feel comfortable. I mean
that's my era, pen and paper so I feel comfortable doing things...when I sat down
with pen and paper, I thought, aha, this is the way the arrows go and because
sometimes that was a problem for me.

204
Barbara continues:
If I had it at home (the hardware and software) I would have used it. I wouldn't have
bothered about pen and paper as much.
She was more comfortable with pen and paper but spent extra time in the computer
laboratory with Ruth so she was not entirely dependent upon one mode of operation.
She moved back and forth between tiie computer and pen and paper. This is similar to
the way in which many writers use word processors. That is, they print a draft copy of
their work and then edit the paper version before they retum to the on-screen version.
Other uses of the concept mapping tool
Several other uses of the concept mapping tool were suggested by students and these
included use as a curticulum planning tool that can assist teachers to plan units of work
and use as a device for assessing children's ideas about topics taught or about a topic that
is about to be taught. A common idea mentioned was the use of the concept mapping tool
to help leamers make visual displays of their ideas about curriculum topics.
For example Ruth (aged, 30) suggested that:
Rather than just a concept map, I could see that the application might cover a unit
eventually, rather than just as the definition type map of the concept.
Danielle (aged, 20) took this point further when she said, " so I'd use this not only in
planning but in implementing a unit".
Leanne (aged, 35) argued that:
it's certainly an effective tool for using to plan a unit because it makes you identify
all the concepts that are involved, it makes you think of how you can teach them.
Later in the interview she explained how she used this tool to help her to constract a
teaching unit.
I haven't actually started writing up any of the unit yet but it's not going to be
difficult because I've done it all, if you know what I mean. It's all, in order to get
this concept map working right, you have to go through all those things, what are
the outcomes on, which skills, which processes does this activity address, am I

205
addressing designing and making using technology and investigation? Am I doing
all the things required by the syllabus. You look at what concepts and how you're
going to teach diem, but you've also got to look at whether die activities diat you
planned are achieving the broad syllabus sort of outcomes... I think I'll have one
really good unit.
Leanne (aged, 35) also thought that it would be a good tool to use with children. She
explained that it:
... gives them a way of recording their thoughts. If you don't, there's no way for
you to capture them, you can lose diem. And so this is one way of recording them
particularly if you're introducing a big topic and want to get dieir initial responses
to it and then maybe look at where their interests lie; or where there's holes or
where there's misconceptions. A lot of the time particularly when you're looking at
scientific concepts, they might have some really way off ideas on how things fit in
together and you can identify those so that then you can address them in your
teaching.
Leanne's ideas show that she understands that students have misconceptions and it is
important for teachers so be aware of these and to address them in planning leaming
activities. She views the concept mapping tool as an effective way of recording
children's ideas.
Barbara (aged, 48) also feels that the tool could be applied to children and states that:
it's just a way to ask people to put on paper, to put their brain on paper for you I
suppose and then you can develop something that assists the bulk of the kids or
you can develop a range of activities that will assist different ways of thinking
because it's all valid, it's just different and there's nothing wrong with different. If
the teacher doesn't know how people are thinking, you can't cater for that
However, she recognised that it took a great deal of effort to achieve satisfactory results
and she states that:

206
this has been a very stretching sort of an exercise and tiiat's a good diing and if diat,
if you could do that in the classroom, I think there will be all sorts of benefits
because it doesn't only apply to science obviously.
Helen (aged, 28) held similar views to Barbara and said that:
I would say use it as a beginning and end thing to see where we are at the
beginning to see where we're going and then die children could add on any htfle side
tracks that they might have.
Later she said, "I think concept mapping's a great idea because it just gets you, it forces
you to put the ideas from your head onto paper or onto a computer screen."
The use of the concept mapping tool as a curriculum planning tool has been reported by
Ferry (1996) and the use of concept mapping as a tool to "probe understanding" has been
reported by White and Gunstone (1992).
Summary of the data relating to the use of the improved
version of the concept mapping tool.
The statistical data showed that 90% of preservice teachers did not change the topic of
their second map and this may indicate that they were committed to producing a good
map about their chosen topic. This interpretation is supported by the fact that the topic
chosen by each preservice teacher was to be the focus of a science unit to be taught in a
primary school later in the year. When the first and second concept maps were compared
the following improvements were identified: greater use of link notes and concept notes;
increases in cross-links; and increases in levels of hierarchy. However, the number of
concepts on the maps did not show a significant increase and this is interpreted as an
indicator that the preservice teachers concentrated on refining concept names and on
improving the stracture of their maps so that the second map formed a more powerful
integrated framework of concepts.
The interview data supported the interpretation of the statistical data. There were initial
concems over the concept mapping process and the use of the concept mapping tool, but
the instractional process helped to allay these fears, especially those associated with the
207
use of computers. Indeed the technology soon became transparent and the preservice
teachers could then focus on the constiaiction of then concept maps.
As the preservice teachers became more familiar with the software and the process of
concept mapping, they began to use the tool in different ways. Some preferred to use a
brainstorm approach and put all of the concepts on the screen first before rearranging
them into a hierarchical framework that illustrated their understanding of the relationship
among the concepts. Then they added links and notes. Another group preferted to work
in "chunks" and they added a few concepts at a time. These were organised into a
meaningful framework that contained links and notes. They then added more "chunks"
to this framework. A small number also used the tool to add concepts, notes and hnks in
a more random fashion. However, in most cases there was littie difference in the final
map produced. It appears that the concept mapping tool helps them to visually organise
knowledge and this may have been one of its strengths. The hidden notes were
considered a strong feature of the tool as the notes allowed the preservice teachers to add
another dimension to their maps. It was also noted that the way in which the preservice
teachers used the tool to constract their concept maps may be related to their preferted
leaming style.
When preservice teachers revised their maps they took time away from the computer to
gather more information. Also they mentioned that thinking and preparation time were
important parts of the revision process. Most preservice teachers used pen and paper to
revise their map and often they wrote over print outs of earlier versions of maps. This
stiategy is similar to the way many people work with word processors as often they edit
printed drafts away from the computer (Hedberg, 1990b). However, those that had
access to the computing laboratory did most (but not all) of their revision on screen.
The preservice teachers mentioned that they revised their maps by adding more notes and
hnks (which they often found challenging). Considerable time was spend in "nartOwing
down" their maps because their original maps contained concepts that were too broad.
Thus, many concepts were re-named to be more specific in meaning. Also concepts were
spatially reorganised into more integrated knowledge stractures.

208
The preservice teachers suggested several other uses of concepts maps in school settings
and this response is interpreted as an indicator tiiat they value the concept mapping tool as
a flexible cognitive tool that has application in classroom settings. In the conclusion to
his study Rye (1995) reported that the stiidents involved also valued concept mapping "as
a tool to think and remember" (p.271). Thus, concept mapping tools appear to be valued
by both learners and instractors.
Use of the improved cognitive tools that assisted leamers to
analyse graphs and tables
This section of the results looks at the ways in which information about rainforest
destraction was accessed and how the preservice teachers used the cognitive tools that
were available to assist them to analyse and synthesise information presented in text,
tables and graphs. It begins with the data from the tracking program and is followed by
interview data, and then by detailed analysis of the concept maps produced.
The information about rainforest destraction was used over 2 weeks. During this time
preservice teachers received 2 formal lecture/demonstrations and used the software during
a one hour tutorial session. Table 7.6 shows how the formal instractional time was
organised and when the data were collected.
Table 7.6: Organisation of instruction and data collection
Week
1
2
Lecture
Introduction to the software 1
30 minutes
Introduction to the software 2
30 minutes
Tutorial
None
practice-10 minutes
use- 50 minutes
Data collected
No data collected
tracking data
joumal entries
concept maps
The data from the tracking program
Table 7.7 displays the average frequencies and times spent at the various sources of
information. The standard deviations, and maxima and minima are included so the reader
can appreciate the wide variation in use of these sources of information.
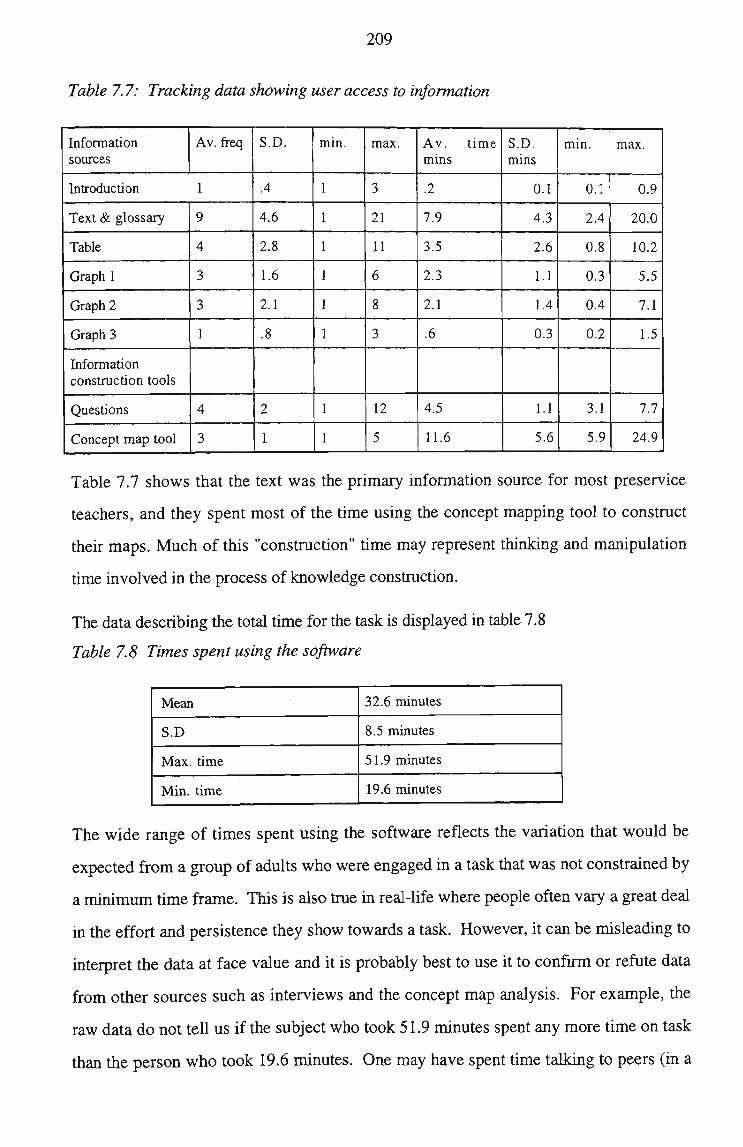
209
Table 7.7: Tracking data showing user access to information
Information sources
Introduction
Text & glossary
Table
Graph 1
Graph 2
Graph 3
Information construction tools
Questions
Concept map tool
Av. freq
1
9
4
3
3
1
4
3
S.D.
.4
4.6
2.8
1.6
2.1
.8
2
1
min.
1
1
1
1
1
1
1
1
max.
3
21
11
6
8
3
12
5
Av. time mins
.2
7.9
3.5
2.3
2.1
.6
4.5
11.6
S.D. mins
0.1
4.3
2.6
1.1
1.4
0.3
1.1
5.6
min.
0.1
2.4
0.8
0.3
0.4
0.2
3.1
5.9
max.
0.9
20.0
10.2
5.5
7.1
1.5
7.7
24.9
Table 7.7 shows that the text was the primary information source for most preservice
teachers, and they spent most of the time using the concept mapping tool to constract
their maps. Much of this "constraction" time may represent thinking and manipulation
time involved in the process of knowledge constraction.
The data describmg tiie total time for tiie task is displayed in table 7.8
Table 7.8 Times spent using the software
Mean
S.D
Max. time
Min. time
32.6 minutes
8.5 minutes
51.9 minutes
19.6 minutes
The wide range of times spent using the software reflects the variation that would be
expected from a group of adults who were engaged in a task that was not constrained by
a mmimum time frame. This is also trae in real-life where people often vary a great deal
in the effort and persistence they show towards a task. However, it can be misleadmg to
interpret the data at face value and it is probably best to use it to confirm or refute data
from other sources such as interviews and the concept map analysis. For example, the
raw data do not tell us if the subject who took 51.9 minutes spent any more time on task
than the person who took 19.6 minutes. One may have spent time talking to peers (in a

210
productive or non-productive manner), while the other focused entirely on the task at
hand.
Regression analysis of the relationship between the number of times a person looked at
tiie sources of information (independent variable) and the total amount of tune spent using
the application (dependent variable) showed that the relationship was significant
(F(l,79)=39.34, p<.00001, r2=.335). Thus changes in the independent variable
(frequency) could account for 33.5% of the variation in the dependent variable (time).
However the relationship is more complex than simple frequency and other factors such
as motivation, time off task, thinking time and navigation need to be considered. Caution
in interpretation is needed as all that can be really stated is that the frequency of use may
predict the time a person spent using an information source.
Regression analysis of the relationship between frequency of use of the concept map tool
(independent variable) and the time spent using the tool (dependent) variable showed that
the relationship was not significant (F(l,79) =.472, p=.49). One interpretation of this
finding is that the concept mapping tool was a knowledge constraction tool and
preservice teachers would normally use it for a sustained period of time. Therefore they
would only temporarily exit the tool to seek out some specific mformation that they
needed and then retum to complete their task. Interview transcripts discussed earher in
this chapter support this interpretation.
Table 7.9 below displays the results of regression analysis for the other variables.
Table 7.9: Regression analysis for the relationship between frequency (independent variable) and time (dependent variable) for the various sources of information
Source of information
Text
Table
Graph 1
Graph 2
Graph 3
Questions
df
79
79
79
79
79
79
F
132.9
175
76.3
56.9
29.1
13.3
P
.0001
.0001
.0001
.0001
.0001
.0005
r2
.6
.7
.5
.4
.3
.1

211
The table shows that the relationships between these variables were significant and the
variation in the frequency of use predicted the total time they spent using the source of
information (see the r^ column). However, as discussed previously, caution is needed in
interpreting these findings. All that can be confidentiy stated is that a relationship exists
but there are other factors involved.
Investigation of Hypotheses 3.6.1 and 3.6.2
Multiple regression analyses were used to ascertain if there were any relationships among
the independent variables of attitudes to computers, gender, age, preferred leaming style
(based upon Kolb's four learning styles), and the dependent variables of the time spent in
using specific screen of information, and frequency of subject refertals to specific screens
of information.
The independent variables
The descriptive statistics for age and gender are displayed in table 7.10 below.
Table 7.10: Descriptive statistics for age and gender
Age
Gender
mean
24.1
females
N=68
S.D.
6.1
males
N=12
Minimum age Maximum age
19 |48
The attitude to computers instrament contained 30 items. Fifteen were positively
worded, and 15 negatively worded (these were reverse scored). There were four Likert
ratings associated with each question. These ratings were labelled stiongly agree, agree,
disagree and stiongly disagree. Each subscale consisted of 10 items 5 were positively
worded and 5 were negatively worded. The test-retest reliability was .78 which is
acceptable (Oppenheim, 1992). Table 7.11 displays the summary statistics of the
responses to this instrament. A high score is equivalent to low anxiety.

212
Table 7.11: Responses to survey on attitude to computers
Scale Mean
Computer anxiety 34.5
Computer confidence 30.4
Computer liking 27.7
Combined 92.6
S.D.
4.1
4.7
4.7
12
Minimum
23
21
15
59
Maximum
40
40
35
113
The maximum scores for each subscale is 40 and the minimum is 10. The maximum for
the combined scores is 120 and the minimum 30. The mean score for computer liking is
lower than the other scales and a paired t-test showed that the differences were
significant. Table 7.12 below summarises the results of these analyses.
Table 7.12: Paired t-test results for subscales
Scales compared
computer anxiety - computer liking
computer confidence - computer liking
df
79
79
t
16
6.2
P
.001
.001
The significant difference in the subscales suggests that the preservice teachers may claim
to be confident with computers and claim not be anxious but this does not mean that they
like using them or like computers. Indeed this finding is supported by Danielle (aged,
20) who in her interview tianscript mentioned that she does not like computers but feels
that she is a competent user.
Responses to Kolb's leaming style instrament (displayed in table 7.13) can be plotted on
a four quadrant map and the dominant quadrant identified (see Figure 7.11 on the
following page).
Table 7.13: Responses to Kolb's leaming style inventory
Quadrant
1-accommodator
2-diverger
3-assiinilator
4-converger
Total
Number
31
29
12
8
80

213
Figure 7.11: The four quadrants associated with Kolb's theory of experiential leaming
Acitive experimentation
Accommodator Doing involved impatient people
Quadrant 1
i h 1 I I 1 1 1 1 1 1 1
Quadrant 4
Converger Unemotional things oriented people
Concrete experience
20 _
18 _
16 _
14 —
12 —
10 —
t .1 . . 1 1 1 1 1
Diverger Imaginative emotional people
Quadrant 2
i l l ! 1
Quadrant 3
Assimilator Conceptual less practical people
Reflective observation
Abstract conceptualisation
Most responses indicated that their preferted leaming style was in quadrant 1 or 2. A
retest taken after one month showed that the cortelation between preferred quadrants from
one test to the next was .72. This figure is similar to the test-retest reliability figures of
.73 quoted by Sewell (1986).
As the test-rest reliability is barely acceptable (Oppenheim, 1992), caution is needed in
interpreting these findings. The distribution of the majority of responses among
accommodators and divergers may relate to career choice as research by Kolb and
Goldman (1973) found that the preferred learning styles of students who planned to
graduate in a major field matched their field of smdy. Furthermore, recent research with
preservice teachers (Reiff and Powell, 1992) supports the interpretation that the majority
of preservice education students are likely to have a preference towards leaming that is
based upon active experimentation and concrete experience. Also Ellsworth (1990)
reported that concrete experience and active experimentation leamers are more likely to be
comfortable with electronically mediated leaming. The data from this study do not
support either of these researchers as regression analysis of the relationship between the
independent variable of leaming style and dependent variable of attitude to computers

214
score showed no significant relationship (F(l, 79) = 1.7, p=.202). The interview data
suggested that some preservice teachers have preferences for specific forms of
information, but this may not be associated witii any of the previously mentioned factors.
The absence of a significant finding for the independent variable of leaming style may
still warrant further investigation as some researchers (Ellsworth, 1991; Reiff and
Powell, 1992) have reported significant findings in different contexts.
Table 7.14: Preferred leaming style of preservice teachers interviewed and the information sources they preferred to use
Name
Danielle
Mary
Sally
Adele
Julie
Ruth
Val
Barbara
Kerry S
John
Chris
Joanne
LeanneV
Helen
KenyW
Melinda
Loretta
Leanne
Kolb Quadrant
1
2
1
2
3
2
1
2
1
1
2
2
2
2
3
1
1
4
r'referred forms of information 1-most preferred.
1 text, 2 graphs
1 text, 2 tables
1 text, 2 either graphs or tables
all
1 text, 2 graphs
1 text ,2 either graphs or tables
1 text, 2 graphs
1 text, 2 graphs
1 graphs & table
all
1 text, 2 graphs
1 text, graphs
1 text, 2 graphs
1 text, 2 graphs
1 text, 2 tables
1 text, 2 graphs
1 tables, 2 graphs
1 text, 2 graphs
Relationships among the independent variables
It has already been shown that there was no significant relationship between leaming
style and attitude to computers. Multiple regression was used to determine if there were
any relationships between the variables of age and gender, and the variables of leaming
style and attitude to computers. No significant relationships were found and the
summary statistics are reported in table 7.15.

215
Table 7.15 Summary statistics for multiple regression analysis of relationships among variables
Independent variables
gender, age
gender, age
Dependent variable
leaming style
attitude to computer
df
79
79
.023 .97
.87
Table 7.16 displays the results of multiple regression analyses used to ascertain if there
were any relationships among the factors of gender, age, total score on attitude to
computers scale and preferred leaming style (based upon Kolb's four leaming styles),
and the dependent variables of time spent using specific information screens and
frequency of use of specific screens of information. It shows that there were no
significant relationships among these dependent and independent variables.
Table 7.16: Results of multiple regression analysis of other factors examined
Independent variables (listed below)
gender, age, attitude to computers, preferred leaming style
as above
as above
as above
as above
as above
as above
as above
as above
as above
as above
as above
as above
as above
Dependent variable
time using text
frequency of use of text
time using table
fi-equency of use of table
time using graph 1
frequency of use of graph 1
time using graph 2
frequency of use of graph 2
time using graph 3
frequency of use of graph 3
time using questions
frequency of use of questions
time using concept map
frequency of use of concept map
df
79
79
79
79
79
79
79
79
79
79
79
79
79
79
F
.6
.3
1
1.7
1.9
1
.3
.6
.23
.22
.21
.22
.7
1.4
P
.7
.9
.42
.15
.12
.39
.86
.66
.9
.8
.9
.9
.56
.23
The independent variables were gender, age, total score on attitude to computers scale
(scores can range from 30 to 120) and preferted leaming style (based upon Kolb's 4
leaming styles - a category of 1, 2, 3, or 4 for each person).

216
Thus hypotheses 3.6.1 and 3.6.2 were not supported no relationships were found among
the independent variables of attitudes to computers, gender, age, preferred leaming style
(based upon Kolb's four leaming styles), and the dependent variables of the time spent in
using specific screen of information, and frequency of subject referrals to specific screens
of information.
Summary of findings associated witii the tracicing data and the
independent variables
The tracking data can be used with other forms of data (such as observation and
interviews) to verify or refute findings, but use of the data in isolation is problematic.
While the data serve to identify which information was accessed most often and for the
longest time, it doesn't indicate what the preservice teachers did when they were using
the information. Also the data may indicate the range of times that preservice teachers
took to use the software but it cannot distinguish non-serious attempts. However it may,
when combined with other data collected (such as the completed concept maps and the
interviews), provide a clearer picture of how the information was accessed.
The data collected from the attitude to computers questionnaire showed that preservice
teachers scored lower on the computer liking sub-scales than on the computer anxiety and
computer confidence sub-scales. One interpretation is that preservice teachers don't have
to like computers m order to be comfortable and confident with them. The distribution of
preservice teachers' leaming styles reflects the findings of other researchers. However,
no significant relationship was found between leaming style and preferted form of
information.
Interviews with preservice teachers who used the cognitive
too ls
Interviews about the use of the HyperCard^™ software relating to rainforest depletion
were conducted. A copy of the interview protocol is included as Appendix 8.
The rainforest application contained several forms of information that were supported by
a cognitive tool that could be used to assist leamers to process the information presented.
The preservice teachers interviewed were those interviewed about their use of the concept
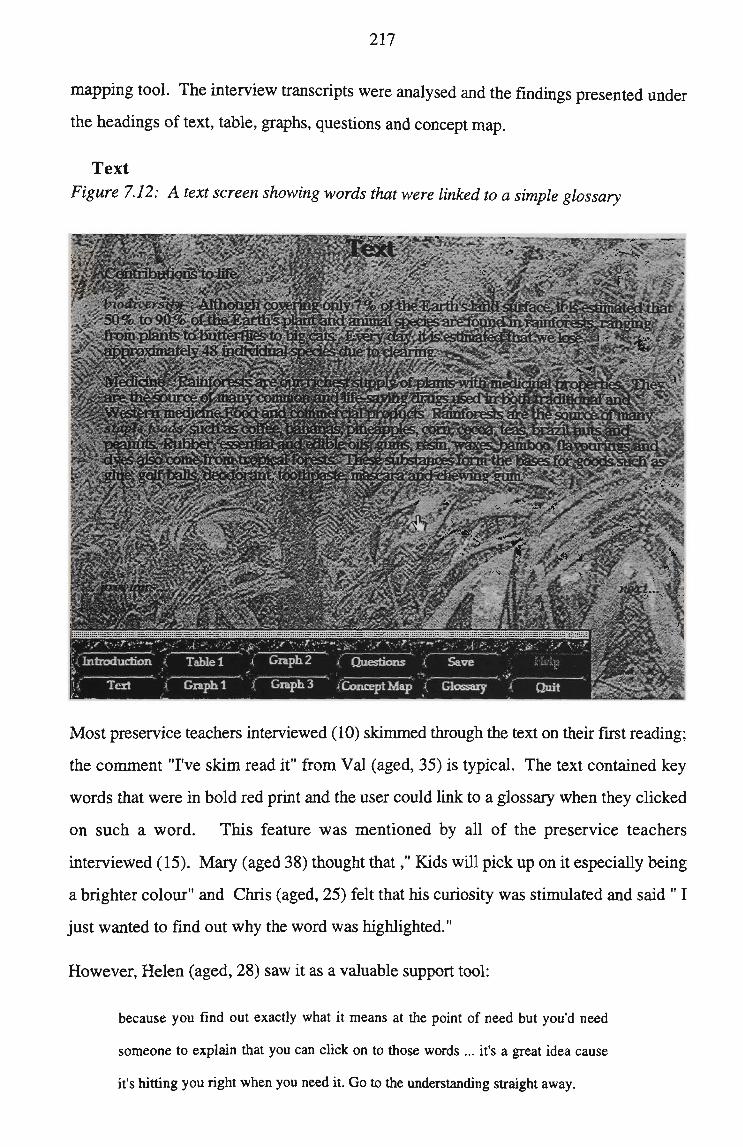
217
mapping tool. The interview transcripts were analysed and the findings presented under
the headings of text, table, graphs, questions and concept map.
Text Figure 7.12: A text screen showing words that were linked to a simple glossary
Most preservice teachers interviewed (10) skimmed through the text on their first reading;
the comment "I've skim read it" from Val (aged, 35) is typical. The text contained key
words that were in bold red print and the user could link to a glossary when they clicked
on such a word. This feature was mentioned by all of the preservice teachers
interviewed (15). Mary (aged 38) thought that," Kids will pick up on it especially being
a brighter colour" and Chris (aged, 25) felt that his curiosity was stimulated and said " I
just wanted to find out why the word was highlighted."
However, Helen (aged, 28) saw it as a valuable support tool:
because you find out exactly what it means at the point of need but you'd need
someone to explain that you can click on to those words ... it's a great idea cause
it's hitting you right when you need it. Go to the understanding straight away.

218
Julie (aged, 34) agreed and stated "absolutely. I mean if kids were using tiiat, and if tiiey
knew that they could simply click on a word in there and they've got it explained to them
stiaight away, they'll leam."
Melinda (aged, 34) claimed that such a tool "saves looking up dictionaries ..." and
Loretta (aged, 28) felt that it was useful "for people with English as the second
language."
Eight respondents mentioned the use of the glossary when they constracted their concept
maps. As Chris (aged, 25) stated, "much information came from the text, mainly the
highhghted words."
Table
The table displayed a set of figures relating to rainforest depletion. The figures in each
column could be sorted in ascending order when the user clicked on the words in the
heading. All preservice teachers mentioned this feature and most realised that it was a
tool that helped them to process information. As Helen (aged, 28) said "it stops you
from having to do it in your head". Kerry (aged, 20) straggled to explain the same idea
as her tianscript shows.
It does in the way that you get, instead of having to mentally visualise it... sort it
in their own heads like right in front of you. It's easier to picture really, to
understand.
Julie (aged, 34) explained it as follows:
It un-jumbles it and I think that makes it clearer to be able to understand it and
accentuates it. When you see years to end seven, if you relate that to a child,
because that's before you were even out of high school, Nigeria's forests will be
finished and they can understand that.
Loretta (aged, 28) also discussed the sorting feature but she had a goal in mind as she
wanted to use the information to answer questions. She stated:
I sorted the majority of them. Some of them I had to sort so I can answer the
questions. It was easy for me to answer the questions if I sorted these columns.

219
However, 5 respondents mentioned that the sorting tool could also be used to test
hypotheses and as Mary (aged, 38) said "you could start asking 'what if?' questions".
Thus, the sorting tool has wider uses than just simple information processing and this
feature could be explored during future research projects. It is recognised that other
applications such as spreadsheets can also sort columns.
Graphs
The graphs contained balloon help that was activated when the cursor was located over
the names on the axes labelled "countries" and the numbers at the end of the bars in the
graphs. The balloon help on the axes labelled "countries" provided a small coloured map
that displayed the location of the country in its home continent. The balloon help on the
numbers provided additional explanatory text about the numbers. If the user wanted to
disable this feature, (s)he could click on a button labelled "balloons off.
The balloon help on the axes was considered to be an excellent feamre but an unexpected
comment was that of Chris (aged, 25) who admitted that:
I'm terrible at trying to find where the places are like, I can't remember where they
are. Yeh, I think when I first saw it I thought it was a great idea just because I'm
not too familiar where they're supposed to be, especially Madagascar, Cambodia.
Some of the lesser known places, I wouldn't have a clue where they are.
Another student (Kerry, aged, 20) admitted that many of her peers would "want a world
map because we don't know where continents are in relation to Australia." Kerry
reinforced this view when she said "I can see the picture of Zaire there (points to a map of
Africa). I don't know in relation to the rest of the world where it is." Juhe (aged, 34)
supported Kerry's view when she said:
I like that because I don't think the children today know or even a lot of adults
know enough about world geography and where places are and I just think that's
fabulous especially ones that relate back to Australia.
Sally (aged, 20) also liked the balloon help and said:
I already know where most of these countries are already but it's interesting to see
that most of them are pretty here, oh, in fact they're all exclusively in either Asia

220
or Africa except Central America or Brazil. So there's none in so called First World
countries at this point.
Afterwards she realised the theme was "disappearing rainforests" and the data related to
countries (mainly the exploitation of third world countries) whose rainforests were
rapidly disappearing.
Again, Loretta (aged, 28) saw another use for this tool when she stated "I'd even use this
with children that weren't even leaming about the rainforest. If they were just leaming
perhaps the countries."
Most preservice teachers mentioned that the balloon help for the numbers provided useful
explanatory text. Some (4) thought that the text reinforced what the graph displayed and
others felt that it did more than this because it provided additional information. For
example Leanne V. (aged, 20) felt that it "reinforces what they're actually saying in the
figures" and Chris (aged, 25) supported this view when he said:
It does make the graph more readable, like more user friendly type of thing. And in
mine it just highlights what die graph's saying but in a vmtten term radier dian a
visual term.
Others such as Juhe (aged, 34) felt that the text added to the meaning and she stated that:
You might just think ten percent is being cleared but when you read the text it says
ninety percent of India's rainforest is already being destroyed so tiiat means if tiiere's
only ten left it just reinforces what the graphs mean.
Sally (aged, 20) took a similar point of view and said:
It's just another way of representing diat information to say ok, we've got eighty
five percent left which means that fifteen percent have been destroyed. Yeh, it's
another way of diinking about it which we don't always do.
Loretta's (aged, 28) comment supported all of these arguments when she said:
What that number actually means rather than them having the number there (she
points to 14.3%), I mean so what, what does it mean? But when it pops up it

221
actually tells me what it means. It does tell me how much rainforest is actually
being destroyed which is really good.
Questions
Table 7.17 displays the questions asked about the data. The questions were designed to
encourage preservice teachers to access all of the information. The table also shows the
number of cortect responses and the source of the answers.
Table 7.17: A list of the questions
Q
1
2
3
4
5
6
7
Text
Are those countries listed mostly industrialised or third world countries?
Which country has the largest percentage of tropical rainforests left? Will this rainforest last longer than in other countries?
The present annual loss of rainforest world wide is 1.8%. The total area of rainforest removed each year is 140 000 km^. How many times would Tasmania fit into this area?
Which countiy removed the most rainforest and what percentage is now left?
For some countries the " loss of forest" problem is not seen as an immediate problem and it is put far into the future. They see themselves with a current large debt and need to educate and feed their people. So the rainforest is seen as a 'resource' to be developed. Which countries seem to be in this position?
But for other countries the rainforest will disappear in a very short time. This problem is urgent. Which countries are these?
If the present rate of depletion continues, which counties would not have a rainforest by the year 2020? (The figures are from 1990).
No. of correct responses
69
64
68
66
69
78
64
Source of answer
text
graph or table
text
graph or table
text and graph or table
text and graph or table
graph or table
One explanation for the greater number of ertors for questions 2 and 7 may be that both
required preservice teachers to compare and order figures, and this created additional
cognitive load.
The questions were devised to encourage leamers to find information from the text and
from either the graphs or the table. Some of the preservice teachers realised that this was
the case and as Kerry (aged, 20) said:
the questions were a good way of making sure that one that you looked everything.
You didn't, you'd seen everything that you didn't just flick sti-aight dirough

222
everydiing and said oh yeh, I know diat, I know diat, I know diat. They made you
look at certain tilings as I said before the table and graphs.
The questions were supplied on a separate sheet of paper as this avoided tiie problem of
flipping back and forth to the questions while accessing the information, but the
preservice teachers were required to type answers into the on-screen spaces. These
answers were saved in a file under the user's name when (s)he quit the software.
Most questions were worded in such a way that they required the preservice teachers to
read the text and the table or graphs. Preferences emerged. Leanne W. (aged, 35)
preferted the graphs as a primary source of information and stated:
I initially used graphs because I feel like 1 can interpret graphs reasonably well and I
quite enjoy interpreting graphs. So I was tending to look at die graphs. Then I
actually found the table was easier but I enjoyed the look of the graphs.
Later Leanne mentioned that she didn't need to refer back to the text because she could
remember the parts needed to answer the questions.
Helen (aged, 28) used the text as her main source of information when answering the
questions and she said:
I used the text because I'm a text, I'm a word person, I'm a reader but I backed it up
with, if I've got two sources, I'll always back it up so I check because I don't trust
myself. So knowing there was a graph I'd read it come to an answer and then check
with the graph.
Where possible Helen used the graphs as a means of verifying the information she
obtained from the text. Others used the table and Loretta (aged, 28) used the table a great
deal. She stated that her reason for doing this was "I wanted to get through it quickly".
Her answers were cortect except for one and this may reflect her undue haste. By way of
contiast Leanne (aged, 35) preferted the graphs to the table and stated:
I diink the graphs are like set out easier to read dian the table where it's got every
single one of them on there. That's just breaking it up instead of a whole bunch of
numbers ...

223
Keny W. (aged, 35) used both graphs and the table and stated tiiat:
I use the graphs and tables because they present a bigger picture. You didn't have to
scroll dirough them like the text to look for the type you wanted.
All of these comments show that presen^ice teachers prefer to work with different forms
of the same information and it is sensible to allow them to access the forms of
information that they are most comfortable with.
Others used a mixture of strategies and Kerry W. (aged, 35) explained that:
the texts to start off widi gave the information in your head, basic knowledge to fit
the graphs into. If you didn't know about rainforests dien the graphs would mean
nothing to you.
For Kerry the text provided a context for the information displayed in the graphs and
table. Julie (aged, 34) described her approach as a mixture and stated that "I used a
mixture, because there was a lot of text to try and take in. That's where the graphs
helped." She found that the graphs provided a visual representation of much of the
information presented in the text and made it easier for her to integrate the information
into a meaningful whole.
Concept map
All preservice teachers were asked to use the concept mapping tool after they had looked
at all screens and answered the questions.
The concept mapping tool is designed to synthesise information gathered by leamers into
a powerful integrated network. Several stiategies were used but most preservice teachers
referted to the text as their primary source of information and to the graphs or the table as
a secondary source of supporting information. Eight of the preservice teachers
specifically mentioned the text and in particular the glossary words. As Chris (aged, 25)
said, "All of my information came from the text, mainly the, the highlighted words."
Melinda (aged, 34) took the same approach and she said that:
I referred back to the highlighted words because I thought well they're more likely
to be the key concepts. But yeh, I suppose initially it came from my head but tiien

224
I wanted to include the things that you had highlighted as well. So it was a
combination of them both."
In her case she just artanged on the screen the concepts that were "in her head". Then
she referred back to the text. However, Melinda came to this task with a high level of
background experience, she had completed three university subjects in environmental
education and was a member of a local landcare group. Therefore she may not have
needed to access all of the information. Leanne (aged, 31) did not have the same amount
of background experience to draw upon and she used a different strategy. As she states
"I sort of acmally I went back and made notes. I did acmally write on a piece of paper."
Julie (aged, 34) also took a similar approach and as she said:
I jotted down my major points. I had a piece of paper next to me and then I just put
them down onto the map where I wanted to put them.
She was then asked by the researcher which information sources she used for her ideas
for the concept map.
Her reply was:
I got them from the text. I mainly went through the text and looked at main
headings and I thought well they would be your major concepts that you'd want to
get across... I also went to graph 2 to check some figures on the rainforest but I
didn't include them on my map.
Joanne (aged, 20) used the text in a similar way to Juhe and also referted to the graphs as
she stated:
The text helped me with some of the concepts and if I were doing more notes, like I
would like to put notes behind everything and I would go to the graphs and like
some of the numbers that go behind there like the greater depletion.
Ten of the preservice teachers also mentioned that they used the table to check on trends
in figures and Loretta (aged, 28) summed up this position when she said," I think I like
using tables because it tells you the exact figures..." She continues and explains that she
was also thinking about the concept map while she was answering the questions and
stated:

225
I was thinking about the whole thing. However, while I was answering the
questions and going to the tables, I was also writing notes down on a piece of
paper. When I went to develop my concept map I had my notes on a piece of paper
so I didn't have to go back.
While Loretta made more use of the table she also made use of the other information
sources.
Because all preservice teachers accessed all sources of information before they
constracted their concept map, they may not have needed to access all of the information
again. Instead they only had to access the information that they needed to complete their
map. In Adele's (aged, 20) case she needed to access all of the information and as she
stated:
I think they're all needed to make the map ... because that helps you understand all
three parts, all parts really because you're looking at the text and by putting it in
tables that helps you understand that and then graphing it helps you get a visual
picture I guess.
John (aged, 21) explained that he also used all forms of information. He said:
I used the text, tables, graphs. I'm one of these people tends to do things with pen
and paper first ...everything from essays down to diagrams. I scribble tilings out, I
erase them, I like to have something almost that's final before I go up to the
computer. Now with this program I'm able to muck around with it. Just now I
went through the information and flipped back to my map.
Later he explained that he constracted his final map on the screen without the use of pen
and paper and this was unusual for the reasons he mentioned above.
These comments demonstrate that the preservice teachers accessed different forms of
information in order to constract their concept map. The reasons why they accessed
these different forms of information varied but some important reasons may relate to:
leamer preferences for specific forms of information; leamer efficiency in processing the
information needed; and previous experience with the subject matter. These issues wiU
be discussed in detail in tiie next chapter.

226
The beneflts of the concept mapping tool
At the end of each interview each student was given the opportunity to add further
comments about what they had done. Most of the comments focused on the use of the
concept mapping tool to synthesise information into a meaningful framework. As Juhe
(aged, 34) stated:
It makes it all concise. You can see, its a good summary too, without going into
reams of writing which doesn't always appeal and you can just put down the main
ideas, those ideas may jog your memory.
Sally (aged, 20) expressed it in a different way when she said:
A concept map actually forces you to think to link the concepts together so if you
have the concept map it's actually easier than a summary because you can see the
ideas and how they can link them together.
Leanne W. (aged, 35) agreed with Julie and Sally's point of view but showed that she
understood the particular importance of links in the constinction process when she stated:
I think the concept mapping tool is extremely good... it's such an effective way of
summarising information. Another thing about them that I've developed is this
thing about the importance of the links. Where you actually draw your links
between concepts is as important as the actual concepts themselves because if you
can't show how concepts relate to each then things get confused. For me now it's a
matter of building on a known concept and extending it by developing and showing
and displaying a link and that leads you on to an understanding of another concept.
Leanne developed an understanding of the importance of links and, though she straggled
to express it, she understood that the concept mapping tool could be used to build
knowledge.
Later in the interview Leanne revisited a theme she mentioned in a previous interview
when she stated that concept maps "help you to see what you know and I'm not talking
as an assessment tool so much as just an insight into what kids are thinking." Also she
sees the value of talking to children about their concept maps when she says, "unless the
child is there to explain where they're at you can lose a lot of their thinking."

227
Helen (aged, 28) had similar ideas to Leanne but expressed it more succinctiy when she
said:
I like the idea of doing a concept map at the end because you can see what you've
understood, you've put it there so I've latched onto the concept maps for pre and
post instruction and I can see I'm leaming.
Others thought tiiat it could be a useful assessment and evaluation tool for teachers and as
Julie (aged, 34) stated, "It's a really good evaluation, assessment type tool". While this
was not the aim of the research project, it does illustrate that the preservice teachers were
thinking about how to apply the tool in different contexts.
Social interaction
Five preservice teachers mentioned the need to talk to peers while they used the computer
to constract their concept maps about the rainforests. As Leanne W. (aged, 35) states:
The sort of social interaction while you're actually engaged in is important. Every
time I was in the lab. I felt this need to sort of talk to people while I was making
my map which is sort of against all the criticisms they make of using computers.
They criticise computers because they can be detrimental to social interaction
between kids...
She continued and said:
I felt this need to actually talk to other people while I was doing my map. I talked
with friends or anybody who was around ... I thought that this is not an anti-social
learning activity. It is definitely something where you do interact with others and
you're looking at what they're doing and they're looking at what you're doing and
you're asking them what they think about what you're doing. All the time your
comparing the concept mapping that you make with others because everybody's
coming from different angles.
This tianscript illusfrates the misconceptions that Leanne has about the antisocial nature of
computers in classrooms. Further research into this issue is justified as the stereotyped
image of the isolated person working alone at a keyboard may have a sttong influence on

228
how preservice teachers think children will use computers in classrooms (Tiemey,
Kieffer, Stowell, Desai, Whalin, Moss, 1992).
Two final quotations from two women (who have school age children) illustrate the
variety of views about how children could use such materials. Mary (aged, 38) stated:
Well I took a copy (of the software) home; my daughter was playing widi it too.
My son's now trying to make his own map so they are interested in it.
The children are 7 and 11 years old, respectively.
Val (aged, 35) had a very different view and stated:
I wouldn't conceive that you would get many children from middle primary
(children under 10 years of age) and below who have got the typing skills, the
computer technology, literacy to be able to do this.
Her children are 9 and 12 years old. Thus even though Val had successfully used the
cognitive tools she showed that she had doubts about the ability of younger children to
use the technology. Unfortunately such attitudes are prevalent and can limit much of
what occurs with computers in classrooms.
Analysis of data from the concept maps about rainforest destruction.
The purpose of this part of the study was to analyse the concept maps that the preservice
teachers constracted after they had accessed all of the information about rainforest
destraction.
When the preservice teachers began to use the tool to constract their concept map about
rainforests they were advised to constract it the way that they normally would. They
were not expected to produce a perfect map but were advised to concenttate on producing
one that would show what they understood about the information provided.
How the data were organised.
The method for organising and analysing the data is similar to that reported by Beyerbach
(1988). In her study, she created an alphabetical list of the concepts created by her
subjects and then tabulated the frequency of these concepts in the maps composed by her
subjects.

229
During this stiidy all concepts listed satisfied the original definition of a concept (see
Chapter 2). Ffrst concepts displayed on the concept maps were noted, tiien those written
in attached notes were added. An alphabetical list was then compiled. The original hst
consisted of 80 concepts but 5 were grouped with others because they were synonyms
and one was eliminated as it was considered tiivial. This left a total of 73 concepts in tiie
list. To check the validity of this approach a sample of 40 maps was given to a colleague
who was qualified in science education. He made an independent list of concepts from
these 40 maps (15 with notes and 25 without notes) and his list was then compared to
that of the researcher. His list contained 70 concepts compared to 63 in the researcher's
list. When the researcher and the colleague discussed synonyms the differences reduced
to four concepts: "ecosystem" and "environment", "debt" and "poverty". They agreed
that these concepts should remain separated. The final list of 74 concepts was referred to
two independent researchers who were experienced in environmental education. They
felt that the concepts in the list were relevant to the topic of disappearing rainforests and
concepts were appropriate.
The data were recorded on spreadsheet and concepts written on to the main map were
distinguished from concepts entered in the notes. Totals were obtained for individual
maps and frequencies for individual concepts obtained.
The concepts displayed on the maps Table 7.18: Summary statistics for the concepts displayed on the maps and notes
Mean
Median
Mode
Standard Deviation
Variance
Range
Minimum
Maximum
Concepts on Maps
11.2
11
12
3
9.17
14
6
20
Concepts in notes
5.5
5.5
5
2.7
7.4
10
1
11
All concepts
13.7
14
14
3.2
10.4
15
6
21
The mean was 11 and the standard deviation 3. The range is 14, from a minimum of 6
concepts to a maximum of 20. However the analysis only considers concepts displayed

230
on the map. When tiie concepts displayed in the notes are mcluded tiie distribution in the
right-hand column appears. The mean is now 14 and the standard deviation is still 3, and
the range is similar. The data shows that it is also important to consider the attached
notes when analysing concept maps created by this tool. Thirty four preservice teachers
attached notes to concepts and/or links. Table 7.18 shows that the mean of concepts that
were written in these notes was 5 (S.D. 2.7). The large range may indicate that there
were large differences in how and when the tool was used.
Since leamers may use the concept mapping tool in a variety of ways to stracture theu-
knowledge, any assessment procedure will need to consider this. Certainly any simple
system of counting concepts and hnks drawn on a map is likely to be inappropriate.
Where the preservice teachers wrote their concepts
The number of preservice teachers who attached notes to their concepts was thirty-four
(42.5%), but it is likely that the notes would have been more extensive and more
preservice teachers would have attached notes if they had the opportunity to spend more
time constracting the map. However, the aim of this part of the study was to find out
how the preservice teachers began to constract their concept maps with the tool rather
than to attempt to produce perfect maps.
Table 7,19 displays the frequency and location of the concepts. 17% were written in the
notes and 83% were written on the map.
Table 7.19: The location and frequency of the concepts listed by the preservice teachers.
Location of concept
on map
in notes
Total
Total frequency
914
181
1095
%
83
17
100
This data indicates that, when given free choice, a significant number of the preservice
teachers included concepts in their attached notes. This is to be expected as the concept
mapping tool is used in different ways to pen and paper. Since the data from Table 7.18
shows that the number of attached notes varied from 1 to 11, then it appears that the way

231
in which the concept mapping tool was used varied a great deal and this finding supports
the findings from Study 2.
Sources of the concepts written in the concept maps and notes
Table 7.20 displays an alphabetical list of all concepts and tiiek frequencies.
Table 7.20: An alphabetical list of concepts and their frequencies
Concept name
acid rain
altematives
amount of rainforest (%)
animals
balance
biodiversity
canopy
cash crops
cattie grazing
classification
climatic change
conflict of needs
conservation/preservation
countries
debt
depletion/destmction
development
ecology
ecosystem
education
endangCTsd
environment
erosion
exploitation
exports
extinction
Feq. map
1
4
7
39
3
39
1
13
2
1
1
3
12
11
18
57
1
5
3
1
2
39
6
26
14
13
Freq notes
0
0
0
6
4
3
0
8
0
0
0
0
1
1
7
3
0
1
4
0
1
1
0
2
6
0
Total
1
4
7
45
7
42
1
21
2
1
1
3
13
12
25
60
1
6
7
1
3
40
6
28
20
13
Attributed source
prior knowledge
all
graphs, table
text
text
glossary, text
prior knowledge
text
text
all
prior knowledge
prior knowledge
text
all
text
text
text
text
text
prior knowledge
text
glossary/text
prior knowledge
text
text
all
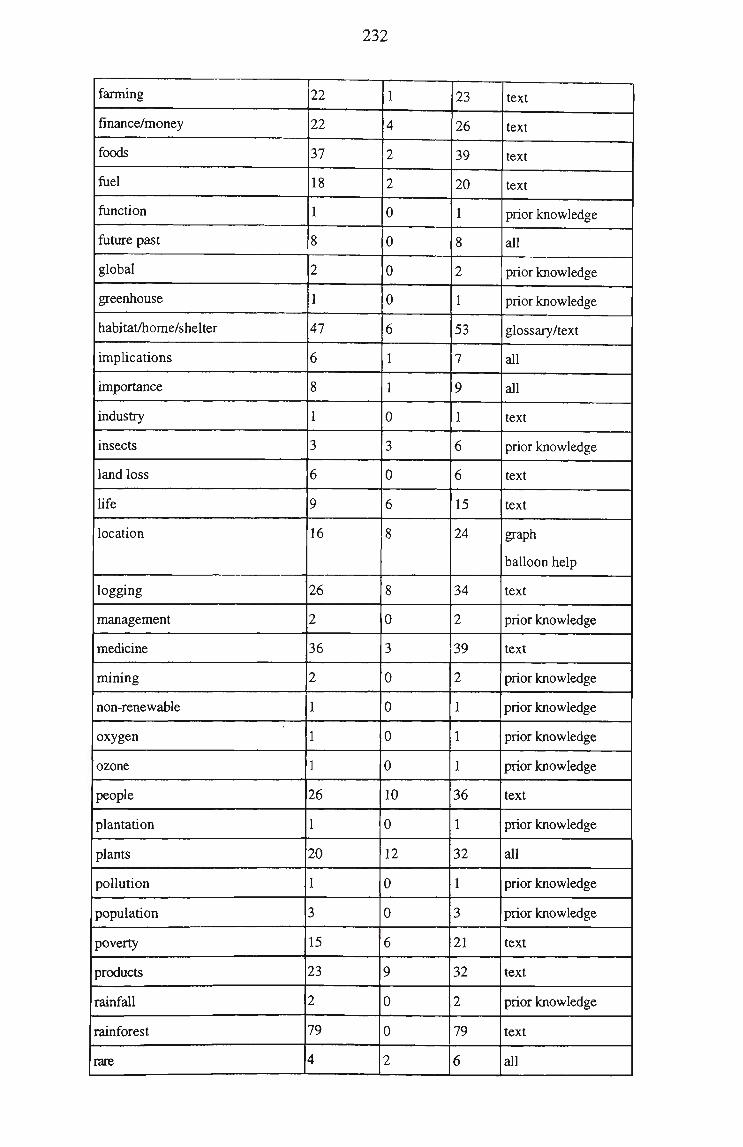
232
farming
finance/money
foods
fuel
function
future past
global
greenhouse
habitat/home/shelter
implications
importance
industry
insects
land loss
life
location
logging
management
medicine
mining
non-renewable
oxygen
ozone
people
plantation
plants
pollution
population
poverty
products
rainfall
rainforest
rare
22
22
37
18
1
8
2
1
47
6
8
1
3
6
9
16
26
2
36
2
1
1
1
26
1
20
1
3
15
23
2
79
4
1
4
2
2
0
0
0
0
6
1
1
0
3
0
6
8
8
0
3
0
0
0
0
10
0
12
0
0
6
9
0
0
2
23
26
39
20
1
8
2
1
53
7
9
1
6
6
15
24
34
2
39
2
1
1
1
36
1
32
1
3
21
32
2
79
6
text
text
text
text
prior knowledge
all
prior knowledge
prior knowledge
glossary/text
all
all
text
prior knowledge
text
text
graph
balloon help
text
prior knowledge
text
prior knowledge
prior knowledge
prior knowledge
prior knowledge
text
prior knowledge
all
prior knowledge
prior knowledge
text
text
prior knowledge
text
all

233
reasons
regeneration
renewable
resources
species
staple food
sustainable
third world
timber
time/ rates of destruction
types
uses
value
vulnerable
western world
6
1
7
18
11
14
1
33
11
13
3
5
2
9
8
0
0
0
13
5
4
0
7
10
6
0
0
0
4
0
6
1
7
31
16
18
1
40
21
19
3
5
2
13
8
text
all
all
text
text
glossary, text
all
text
text
graphs, table
prior
all
all
all
all
The final third column lists attributed sources of the concepts listed. The procedure
described below was adopted when creating this column. It is acknowledged that the
procedure is crade and can only be used as a general guide. Concepts that only matched
specific words in the text (included the text in the questions), glossary, table or graphs
were atttibuted to that source. Concepts that matched specific words found in the text,
table, and graphs were attributed to any of these sources and labelled as "all". Concepts
tiiat were not related to any of the sources provided were attributed to prior knowledge.
Table 7.21 syntiiesises this information into four sources: text and glossary, graphs and
table, a combination of the previous two sources and previous knowledge.
Table 7.21: A synthesis of attributed sources of information used by preservice teachers when they constructed their concept maps
Source
The text (questions) and glossary
The graphs and table
A combination of any of die above diree sources
Previous knowledge about the subject matter
Percentage
80%
5%
12%
3%

234
This crade analysis serves to demonstrate that while the text was an important source of
information when preservice teachers constracted their concept maps, it was rarely used
as the only source of information.
Summary
The investigation of preservice teacher use of the redesigned concept mapping tools
fiirther demonstrated that the instractional strategies identified by Gunstone and White
(1992); Holley and Dansereau (1984) and Camboume (1988) could be used to inttoduced
leamers to the process of concept mapping and to the supporting cognitive tools. The
process of concept map constraction was complex and forced the preservice teachers into
a cycle of constraction of knowledge stractures, appraisal of these sttxicmres (usually
with peers) and further modification. However, the tool was easy to use and preservice
teachers could easily modify their concept maps. Hence, the tool enabled them to focus
on the concepts and ideas they were constracting rather than on the mechanics of
involved in drawing or modifying their maps.
The majority of preservice teachers interviewed employed similar constraction methods.
Initially they used the concept tool to create their concept names; then they used the other
tools to modify and spatially artange the concept names into a meaningful pattem. The
interview data also showed that further investigation of the relationship between preferted
leaming style and the way in which leamers use the concept mapping tool to constract
their maps might be justified as a relationship was observed between preferted leaming
style and the method of use of preservice teachers to constract their concept map.
However, with such a small sample other factors need to be considered: it may have been
more convenient to keep using the concept tool to generate concepts rather than learning
to use other tools.
Analysis of the maps constracted by the interviewees revealed that the quality of the map
produced did not relate to the constraction process employed. As the tool could be used
in different ways, differences in constraction methods reflected differences in the way
leamers prefer to constract their knowledge. Further research may clarify whether
differences in the way leamers constract concept maps might relate to preferted leaming
styles. It is likely that leaming styles do not affect outcomes in isolation, as the different

235
methods of concept map constraction may also be a consequence of leamer use of a
flexible concept mapping tool that simply allows them to use different map consttiiction
methods.
The cognitive tools that assisted leamers to analyse information in text, tables and graphs
were found to be easy to use and helped preservice teachers by: reducing cognitive load
associated with the sorting and comparing of numbers in columns; and by providing
additional information which assisted in information analysis and encoding, such as the
location of the counties mentioned in the text, graphs and table. Some preferences for
specific tools were noted (for example some preservice teachers preferted to consult the
table rather than the graphs) but no pattem that related to preferted leaming style was
observed.
When smdents constracted their concept map about rainforest destraction, preferences
did emerge. The text and glossary were the main sources of information used, but in
most cases this was supported with information from the graphs or the table. Again the
pattems of use were not related to preferted leaming style.
The concepts that appeared on the maps came from the text and the glossary, but the
supporting information found in the notes and the interview responses suggest that the
other information sources were used as supplements. For example, several preservice
teachers interviewed preferted to supplement the information obtained from text with
another source such as a graph or a table because they could add specific facts to their
concept notes. Some of the mature age preservice teachers commented that the balloon
help alerted them to the fact that several countries would have virtually no rainforest left
by the time their children were adults and they felt tiiat it was important to emphasise this
issue when they constracted their concept map. Thus the various cognitive tools
influenced the content and the overall themes contained in the concept maps. In the case
of the graphs and table the influence of the tools was more subtie as revealed during
interviews.
By way of comparison the interpretation of the tiacking data gathered was problematic
and the data could not be used to provide insights about the way in which the tools were
used without triangulation from other sources. The data did provide information that

236
could be used to verify information from interviews and could be used to generate
additional interview questions to identify aspects of leamer use of the software that could
be investigated further by other means. The tracking program may have indirectly
assisted in motivating preservice teachers to stay on task as all were aware that the
tiacking program was operating every time they logged on to the software.
The tracking data were also used with the interview transcripts, survey information and
the analysis of the concept maps to describe how the preservice teachers accessed
information within the rainforest software. First, it was found that the factors of positive
attitude to computers, male gender, a younger age, and preferted leaming style were not
predictors of the frequency and time preservice teachers spent accessing specific
information screens. Second, while it was found that preservice teachers initially focused
on the information in the text and the glossary (as this information provided a context for
the information presented as a table or graphs) later they accessed some of the additional
information to supplemented the text and add meaning to the context. When they
accessed the screens containing the graphs and table, they used the cognitive tools and the
resulting interviews suggested that these tools helped them to process specific
information that was personally relevant. Thus the cognitive tools played an important
role in subtiy focusing leamer attention toward information that supported the theme of
rainforest destraction.

237
Chapter 8: Discussion and Conclusion As discussed in Chapter 1, leamers who successfully interpret graphs, text and tables
link the various types of information presented to their semantic memory and they
constract meaning by relating the features of the graphs and tables to the context
described by supporting text (see Figure 1.1). Throughout, this process the prior
knowledge of the leamer continuously interacts with the interpretation process.
Study 1 showed that the process of interpreting graphs, tables and related text is complex
and creates a high cognitive load for the leamer. The cognitive tools designed and
evaluated during Studies 1 and 2 provided leamers with support that may have reduced
the cognitive load associated with processing information from the different sources of
information. This chapter is organised into a discussion section and a conclusion that
relates the findings from the studies, the literature review and research methods
employed. It concludes the study by discussing issues that need further investigation and
makes suggestions for future studies. Also, it discusses the use of cognitive tools to
support education and leaming.
The following section is organised around three major issues that relate to the research
questions. These issues are: learner interpretation of graphs and tables; introducing
leamers to cognitive tools; and the impact of the cognitive tools upon the leamers.
Learner interpretation of graphs and tables
Question 1. What factors affect the ability of various groups of preservice teachers to
interpret a set of graphs and tables?
Two approaches were taken to this question. The first approach was a quantitative
approach that formulated and tested hypotheses. The second used a quahtative approach
that rehed upon interview data.
The quantitative data indicated that there were significant differences between the abiUty
of preservice science teachers (science graduates) and preservice primary teachers to
interpret the graphs and tables contamed in the test. This difference could be expected

238
because the science graduates had greater experience with the context and the skills
involved and would have a far greater background knowledge to draw upon.
The absence of difference in scores between Year 1 and Year 3 preservice teachers
suggests that two more years of tertiary education had not changed the ability of the Year
3 preservice teachers to interpret graphs and tables. Their scores also indicate that the
skills of interpreting graphs and tables are not highly developed in many preservice
primary school teachers and more emphasis needs to be placed upon this skill. While
similar results may be obtained at other institutions, further smdies with larger samples
are needed before any wider generalisations can be made.
Regression analysis of the scores obtained by preservice teacher subjects enrolled in Year
1 on the graphing and tables test (dependent variable) were not related to any of the
independent variables of gender, age, previous scores in english and science tests,
previous experience with computers, and leaming style. However, Higher School
Certificate Maths scores were found to be a significant factor and 20% of the observed
variation in test scores could be attributed to 2 Unit Mathematics scores. This finding is
consistent with those of previous studies which also showed that there was a relationship
between leamer experience in mathematics and ability to interpret graphs (Janvier, 1978;
Preece, 1985). Further research is needed to identify the specific mathematical
knowledge and skills (beyond basic familiarity) that may help preservice teachers to
improve their ability to interpret graphs and tables.
From 1996 all preservice teachers in New South Wales were required to have studied
mathematics in senior high school, and tiiis additional experience may have an effect
upon their ability to interpret graphs. However, research by Crawford (personal
communication, April 17th, 1996) suggests that forcing preservice teachers to study
matiiematics is unlikely to lead to any improvement. An altemative stiategy is for higher
education institutions to become pro-active and take more responsibility for developing
these skills. There are several ways in which this could be done, but a discussion of
tiiese stiategies is beyond the scope of tiiis study.
There were limitations with this analysis as it gave no indication about the sttategies the
preservice teachers used when they were interpreting graphs and tables. The interviews

239
with preservice teachers allowed the researcher to gain further insights into how they
went about interpreting specific information in the fonn of text, tables and graphs and
these will be discussed in association with research questions 2 and 3. Thus, questions 2
and 3 are discussed together.
Question 2. What cognitive strategies do preservice teachers employ when they
interpret graphs and tables?
Question 3. How do the identified cognitive strategies compare with those strategies
identified by other researchers?
The findings showed that context always plays an important part in the interpretation of
graphs and tables. Commonly used terms such as "element", "velocity", "viscosity" may
not be understood by the reader and this makes it difficult if not impossible for the reader
to understand the context. The research of Janvier (1978) and Preece (1985) found that
understanding the context was essential to the successful interpretation of graphs and that
there can be no interpretation without an understanding of "the underlying situational
background" (Janvier, 1978, p.3.6).
Often scientific terms have very specific meanings that may differ from common usage
and when these key terms are understood leamers have a better chance of interpreting
graphs and tables. This finding guided the development of the glossary tool that was
designed to provide further understanding of important terms used in the text, graphs and
tables.
The interview ttanscripts showed that one of the problems associated with comparing
data in tables is cognitive load and this supports the findings of researchers such as
Sweller (1988, 1994), Sweller and Chandler (1991, 1994), and Winn (1987). These
researchers make specific suggestions about how to organise tables so that the data is
artanged in logical and meaningful "chunks" (Yates and Mom-sund, 1989) that reduce
cognitive load. Hence the reader can avoid the problem associated with re-sorting values
"in their head". This finding guided the development of the cognitive sorting tool which
allowed leamers to click on a column heading m order to sort values presented in a table.
Thus, some of the cognitive load associated with sorting values was tiansferted from the
leamer to the computer.

240
When the preservice teachers were requured to examine and interpret graphs they divided
their attention among local and global features. Again tiiese findings support those of
Sweller (1988, 1994), Sweller and Chandler (1991, 1994), Janvier (1978) and Preece
(1978). Chandler and Sweller (1991) suggested that if examples are reformatted to avoid
spht attention then cognitive load is reduced, and this makes the task of mental integration
easier. This may explain why some of the preservice teachers failed to integrate all of tiie
information. Since mental integration is likely to be cognitively taxing, it is important to
save leamers from unnecessary mental activity as they process new information.
However, where mental integration is necessary, conventional instraction may be better
replaced by integrated instractional formats such as those used in this study. The
cognitive tools developed to support the interpretation of graphs and tables were an
attempt to meet these needs. For example, the balloon help in the form of text and maps
only appeared when the cursor was located over a particular value or country. Thus, the
leamer could conttol when the information appeared and only had to pay attention to this
support when they required it.
Furthermore, the stiategies observed and the interview ttanscripts support the model of
processes involved in the interpretation of graphs presented in Figure 2.2 (Janvier,
1978). Such strategies involved reading and interpreting numbers, text and charts,
especially key words and terms; labels on axes; rises and falls, and changes of slope on
graphs. When a leamer is first given a graph to interpret, (s)he starts with either the
situation (the context described by the associated text) or the graph. As attention is
focused on the graph, its features become meaningful and provide the leamer with greater
understanding of the original situation presented in the text. Gradually the original
situation is referted to less and less and becomes integrated with the graph which
becomes the principal conveyer of meaning. Janvier studied the coordination between the
situation (text) and the graph and found that the coordination between the two modes of
information presented required leamers to simplify and memorise one or both. Pure
visual simplification appeared to be insufficient and "verbal" summaries spelled out
during the checking of a hypothesis appeared to literally replace the graph, but it was also
necessary for various global features such as rises and falls, and local features such as

241
specific labels on axes to be handled in order for the inteipretation process to be
successful.
During the study some of the preservice teachers misinterpreted the graphs because they
did not recognise that a relationship existed between a global feamre (eg. a rise or fall or
change in slope) to a specific local feature (eg. a specific value or label on an axis). This
may have occurted because they were experiencing cognitive load associated with split
attention (Sweller and Chandler, 1994). This appeared to happen when they were unsure
about which part of the graph they should pay attention to. However, once tiieir attention
was dkected to the relevant local or global feature most preservice teachers could choose
the cortect answer. One explanation is that context-specific support (such as balloon
help) may help to reduce cognitive load by directing leamer attention to contextually
relevant features of the information. This situation is likely to be context specific as more
complex interactions occur when the text is complex and leamers have to interpret text
and graphs.
Other common ertors such as misreading labels and numbers on axes, and the failure to
comprehend legends, may also be associated with cognitive load but further research is
needed to clarify this aspect of the stody.
Whilst it is not possible to make generalisations from one person, the sttategies employed
by the best science graduate indicated that she spent less time than the other students in
dividing her attention between the different forms of information. She spent longer
reading questions but did not have to refer back to them. Her comments showed that she
had a very good understanding of the context of each question (which she comprehended
from the associated text) and this helped her to quickly identify which parts of the
mformation were relevant. It appears that she had the background knowledge and skills
needed to quickly assimilate the information presented and to analyse it in such a way that
she reduced the cognitive load associated with split attention (Chandler and Sweller,
1991). This aspect of the smdy could be followed up in future studies.
As stated previously, the findings from Study 1 guided the development of the cognitive
tools that supported leamer interpretation of graphs and tables. Graphs and tables were
presented in a real life context that included supporting text as this is the way that we

242
commonly encounter graphs and tables (Janvier, 1978; Preece, 1985). Rather than
develop one specific tool, it was decided to develop a suite of cognitive tools tiiat could
be used in a more realistic situation where text, graphs and tables were used together to
present information. The cognitive tools developed were designed to serve two broad
purposes. First, tools were developed to assist leamers analyse information presented in
text, graphs and tables, and second a tool was developed to assist leamers synthesise
information presented in text, graphs and tables.
Introducing learners to cognitive tools
This section focuses upon how we can inttoduce leamers to cognitive tools that function
as mindtools (Jonassen, 1996) and relates the findings to a theoretical model of leaming.
Thus the discussion focuses upon research question 4.
Question 4. Could the instractional strategies identified by researchers in related fields
be apphed to effectively intioduce leamers to the concept mapping tool?
While learners have found the concept mapping cognitive tool easy to use, the
employment of concept mapping to synthesise information is a process that is developed
over time and a basic understanding of the procedure involved does not guarantee that
leamers will produce concept maps that contain powerful, integrated networks. Time is
needed to develop the skills required, to generate and interpret concepts, link and notes.
Hence, the separate use of the concept mapping tool prior to its employment with the
rainforest destraction data probably made it a more effective tool.
The concept mapping tool was used over five weeks. During this time preservice
teachers received four formal lecture/demonsttations and five one-hour tutorials. The
computing laboratory was also available for further use for six hours each week.
Several factors appear to have contributed to the effective intioduction of the concept
mapping tool and these may be understood in relation to the major features of
Camboume's model of leammg (1988, 1995) as discussed in Chapter 2. These features
are immersion, demonsttation, expectation, responsibility, employment, approximation
and response. These are discussed and related to the research question.
243
Immersion
The term immersion is used to describe the exposure to the process of concept mapping.
This exposure should be "whole, usually meanmgful and in a context which makes sense
or from which sense can be constraed" (Camboume, 1985, p.34). It follows that the
process of concept mapping should be presented as a meaningful whole rather than as a
sum of a number of isolated entities. Also the process of concept mapping needs to be
seen as part of the whole process of information constraction about a particular topic
rather than as an adjunct.
During this study concept mapping was employed as a sttategy to encourage learners to
display and link information. The process of concept map constioiction should encourage
leamers to process information and present it as a meaningful spatial map. This sttategy
may encourage leamers to become immersed in the total context rather than in discrete
parts of the whole.
Demonstration
Camboume described two forms of demonstration: actions (eg. demonsttation of how to
constract concept maps) and artefacts (eg. examples of good concept maps) and he
believed that "demonsttations are the raw material of nearly all leaming, not only in
language" (p.34). Camboume claimed that leaming only occurs when engagement
occurs and this happens when the following criteria are met:
1. the potential leamer sees the demonsttation as achievable and themselves as
being able to do it;
2. the demonstration witnessed will somehow serve some future purpose in
their hves;
3. when they attempt the demonsttation there will not be any unpleasant
consequences.
There is a parallel between Camboume's criteria and the suggestions made by White and
Gunstone (1992) about how to inttoduce concept maps to leamers. Durmg this study the
demonsttation process appeared to have a positive effect in allaying initial fears concemed
with the use of the software and the process of concept mapping. In particular, the

244
employment of a computer projector in a mass lecture theatte and in tutorials allowed the
researcher to employ a teaching process where the researcher and the audience jointiy
constracted a demonsttation concept map. Also the artefacts (student maps) displayed in
follow-up lectures and tutorials served to reinforce the notion that the leamers were
capable of using the software and employing the skills required.
Expectation
"Expectations are subtie and powerful coerces of behaviour", (Camboume, 1988, p.35)
and can work for or against leaming. In the context of this study the leamers needed to
have an expectation that the concept mapping procedure had apphcation in a variety of
contexts that were meaningful to their lives. Therefore the researcher needed to provide
examples from a variety of meaningful contexts during a period of direct instraction. The
use of the tool as a means of planning instraction is an example of how this was done in
this context. The preservice teachers knew that they would be planning instractional
units in many of their subjects and that they needed to develop these skills. The concept
mapping tool provided them with an opportunity to develop and refine skills that they
would use many times in their professional careers.
Responsibility
The responsibility for supplying demonstrations and for providing the climate for
demonstration lies with the instractor. However, leamer responsibility also has two
levels: firstiy, (s)he is expected to become proficient in tiie total task; and secondly, (s)he
is expected to make the decisions about tiie most useful aspect with which to engage from
tiie current demonsttation. When teaching students to constinct concept maps. White and
Gunstone (1992) suggested that teachers provide a demonsttation of a possible layout the
first time. This was done in this study and in subsequent lessons the mass demonstration
was replaced by short, varied individual demonstiations that were used to show that
there is not a single cortect answer to the task. During this study the feedback sessions
were of particular importance as it was during these times that the researcher was very
careful to demonsttate different approaches to the same task and to emphasise that there
can be multiple representations of the same domain of knowledge.

245
Employment
Leamers need time and opportunity to use, employ and practise in a non-artificial way.
They need to have time and opportunity to work with others as well as time alone to use
what they have been leaming. When instiiicting leamers to constract concept maps it is
important to recognise that leamers will need time to work with peers and to work alone.
Researchers such as White and Gunstone (1992) and Harlen (1992) mention the need for
this to occur when leamers are instracted in the constraction of concept maps. The
findings from tiiis stiidy support this point as the interview ttanscripts clearly demonsttate
that the tune at the computer was often only a fraction of tiie thinking tune that was used.
Approximation and feedback (response)
It is claimed by Camboume that the willingness to accept approximations "is absolutely
essential" (p.38). When he models how "leaming to mean" proceeds he claims that the
cycle of hypothesise, test, modify hypothesis and successive approximation takes place.
Such a cycle occurted during the constraction of concept maps as leamers needed time to
use and re-use a newly developed skill, and to reflect upon the knowledge stractures they
create. It was found that during this phase of 'use', leamers need to receive feedback
about their performance, and it was important for the researcher, peers and other
colleagues to provide both formal and informal feedback. Some of the interview
transcripts mention the need to discuss their work with others and how this aspect of
computer use had not occurred to them in the past.
This aspect of the study supports previous research conducted by Roth (1994). His
study examined student collaboration during the process of concept map constraction and
his findings suggested that the processes of discussion and negotiation may be more
beneficial to leamers than the final product (Roth, 1994). Therefore, another area of
investigation may be to further explore the discussion and negotiation processes that
occur when leamers are artanged in small collaborative groups to constract concept
maps.
The approach adopted during this study was also sunilar to those recommended by White
and Gimstone (1992) when they suggested an approach for teaching children to constract
concept maps. Their steps also parallel tiiose of Novak and Gowin (1984), Holley and
246
Dansereau (1984), Jonassen (1996) and Heyrie (1996). It appears that basic instiiictional
procedures are effective, but more basic research is needed before a theoretical
understanding of the practice emerges.
During this study Camboume's model of learning was used to guide the strategies
employed when leamers were instracted to create concept maps and the findings support
this application. In Piagetian terms these principles may be thought of as providing
optimal conditions for learner assimilation and accommodation of new information.
However, it needs to be recognised that Camboume's model is not the only model that
could have been applied and others could have been used to provide guidance and
theoretical support for the study.
Kolb's experiential leaming model describes a process through which the four modes of
human experience (concrete experience, reflective observation, absttact conceptualisation
and active experimentation) are engaged at various levels of complexity to create more
complete levels of understanding. His model is based upon four major assumptions:
1. leaming is a continual process and not an outcome;
2. leaming is grounded in personal experience;
3. leaming requires the resolution of conflicts between dialectically opposed
modes of adaptation to the world;
4. leaming involves transactions between the individual and the environment
whereby experiences are ttansformed into knowledge and actions.
Kolb's theory is a holistic theory and it is grounded in the idea that individuals attain
higher levels of cognitive complexity through the integration of preferted and less
preferted modes of adaptation to then personal cu:cumstances. His model was mttoduced
in Chapter 2 but its operation is summarised in figure 6. This shows a cyclic process in
which the leamer assimilates experience to create concepts which can be used to generate
further experiences and concepts (called accommodating concepts). The process of
concept map constiruction relates to this model in many ways and fiuther research may
further elaborate on the application of Kolb's model of learning to the process of concept
map constraction with cognitive tools.

247
Figure 8.1: Kolb's Model of Leaming
Concrete experience
Accommodating concepts through experiences
back to an ever renewing focus
Active experimentation
thinking and manipulating
Assimilating experience into concepts
experiences and feelings
Reflective observation
standing back, examining and comprehending
Abstract conceptualisation
Camboume's model uses terms such as ttansformation, discussion and reflection, and
application which together describe in Piagetian terms the processes involved in
accommodation or what Kolb's model shows as the accommodation of concepts through
experiences. Camboume believes that all of the processes of transformation, discussion
and reflection, and application are interwoven and interact with each other. However, we
need to be aware of what these processes are in order to provide optimal conditions for
leamer accommodation. Transformation is part of this process and occurs when leamers
take something demonstrated by another and make it part of their own understanding
and/or skills. The findings here suggest that this did occur and that the process was
enhanced through discussion with others. This supports Camboume's assertion that
"leaming, thinking, knowing and understanding are significantiy enhanced when one is
provided with opportunities for 'talking one's way to meaning,' both with others and
with oneself (p. 188). The findings also cortoborate the four basic assumptions that
support Kolb's model of leaming discussed previously. That is, leaming is grounded in
personal experience that often requires the resolution of conflicts between dialectically
opposed modes of adaptation to the world and often this process involves ttansactions
between the individual and tiie environment (both physical and social) whereby
experiences are ttansformed into knowledge and actions.

248
Camboume believes that apphcation involves problem solving and the findings from this
study suggest that there is a mufti-layered relationship among application,
discussion/reflection, and transformation when leamers are engaged in the process of
concept map constraction. Such a process has been discussed in other contexts by a
variety of researchers (Braner, 1966; Wittrock, 1990; Woolfolk, 1990; Vygotsky, 1978;
Kolb, 1984). This process of transformation leads to the constraction of new
understanding or knowledge, or the mastery of new skills. Finally, the new knowledge
can be reflected upon and further ttansformed. Such linguistic interactions are frequentiy
described in association with accommodation (von Glaserfeld, 1995, p.66).
The findings from this study suggest that there are established procedures that we can
employ to effectively introduce leamers to cognitive support tools that synthesise
information but the process needs to be supported by sound educational theory that
relates to the context in which the tools are applied. It is not just a matter of designing a
suitable tool and then handing it over to the leamer to use.
The impact of cognitive tools upon learners
This section discusses the findings that relate to the ways leamers used the cognitive
tools.
Question 5. What effect does the concept mapping support tool have upon the way the
leamers stracture their knowledge?
Two approaches were taken to this question. The first approach analysed the maps and
identified and discussed the changes. The second approach rehed upon interview data.
The findings associated with the analysis of the concept maps and interviews showed that
the leamers used one of three strategies to constract their concept maps. Some 70%
preferted to use a "brainstorm approach" and put all of the concepts on the screen first
before reartanging them into a hierarchical, integrated framework that represented their
understanding of relationships among the concepts. Then they added links and notes.
Another 25% preferted to work in "chunks" and they added a few concepts at a time.
These were organised into a meaningful framework that contained links and notes. They
then added more "chunks" to this framework. A small number (5%) also used the tool to
add concepts, notes and links in a more random fashion. In most cases there was littie

249
difference in the quality of the final map produced, but the appearance may have been
different as the hidden notes feature allowed leamers to put notes behind concepts and
hnk notes. Thus concepts were sometimes embedded in other concepts. It appears that
the concept mapping tool helped leamers to visually organise knowledge and this may
have been one of its strengths. Because the tool could be used in a variety of ways, it is
not surprising that leamers took advantage of the flexibihty. Often at first glance two
concept maps may look very different, but when the underiying stincture and content
contamed in the notes were examined, a very different perspective emerged. The tool had
just been used in a different way.
The hidden notes were considered a strong feature of the tool as it allowed tiie preservice
teachers to add another dimension to their maps. Since the notes attached to link labels
and concepts could be hidden, this made more screen space available. This feature
appeared to have two positive effects. First there was more room to create fairly
extensive maps on one screen. This is an advantage as leamers can see on screen a map
of all concepts and links (one disadvantage of computer based mapping programs such as TTV/f T\/l
SemNet and to some extent Inspiration is that they use a great deal of screen space
and the leamer only sees a section of his/her map at any one time). While the software
used in this study overcame this problem to some extent, it is not claimed that the curtent
version is otherwise superior to these applications as they have other strengths. The
second effect was that the hidden notes allowed leamers to stracture their knowledge in
different ways. For example some created maps that filled the screen with concepts and
then added a small number of notes to their links and concepts. Others created fewer
concepts on screen but produced extensive notes that contained subordinate concepts.
Both approaches are valid as the final outcomes in each case may demonstrate similar
understandings.
The size of the screen is a hmitation and it was tempting to create a software application
that could have multiple dimensions. Leamers would then be advised of then: position
through navigation prompts. However, this adds another layer of complexity and would
place an additional cognitive load on the leamer. Only one of the interview ttanscripts
mentioned limitations associated with screen size and none of the field notes of the

250
observers commented on this problem. However, it would be an issue if leamers were
creating very extensive concept maps.
The tool allowed leamers to create then maps in a variety of ways and probably this made
it easier for leamers to use. Some other tools (eg. SemNet™) that were ttialled placed
restrictions on how leamers could create their maps and initially. This appeared to limit
the way leamers use the tools to stracture knowledge. A useful follow-up study would
be to compare the ways in which leamers used different mapping tools to stracture their
knowledge as the findings from this smdy seem to indicate that, initially, tools that can be
used in different ways to make the task of concept map creation easier. However, over
time leamers may adjust to less flexible tools and eventually use these tools efficiently to
create concept maps (Jonassen, personal communication, September 6th, 1996).
Question 6. Do the cognitive support tools assist leamers to analyse information in
text, tables and graphs?
The cognitive tools designed to assist leamers analyse information in text, graphs and
tables were the glossary, the questions, the sorting tool and the balloon help. The data
suggests that the cognitive tools did help leamers to analyse information presented in text,
graphs and tables. The use of the tool appeared to be idiosyncratic and varied with the
individual and the context of his/her situation.
The most valuable data associated with preservice teacher use of these features came from
the interviews conducted with subjects as they worked through the software for a second
time. Prior to the interviews the preservice teachers had used the software to answer
questions and to constract a concept map that synthesised the information presented.
Thus they came to the interview with previous experience that they could draw upon as
they once again worked through the software. The cognitive tools will now be discussed
separately and finally a summary will synthesise this section of the discussion.
The glossary words
The text contained key words that were in bold red print and the user could link to a
glossary when they clicked on such a word. This feature was mentioned by all of the
preservice teachers interviewed and most explained that the brighter colour stimulated

251
their curiosity. Because support was provided at the point of need, this tool can be
thought of as a performance support tool as defined by Gery (1991).
The glossary tool avoided the need to look up the meanings of words in a dictionary.
Also, as one preservice teacher involved in the study stated it could be used as support
"for people with English as the second language." Thus the glossary helped leamers to
understand key words which then allowed them to understand the context (or as Janvier,
1978 states, "the situation") associated with the graphs and tables. Another use of tiie
glossary was to help leamers identify key concepts when they constracted their concept
maps and eight interview transcripts mentioned the use of the glossary in this manner.
Thus the glossary was used as a support tool to help leamers understand key words in
the text and in the process of knowledge constraction when leamers began to construct
their concept maps. Further development of this tool could include links to graphics that
provided visual iUusttations of key terms.
Table
The table displayed a set of figures relating to rainforest depletion. The figures in each
column could be sorted in ascending order when the user clicked on the words in bold
red in the heading. Again all preservice teachers mentioned this feature and most realised
that it was a tool that helped them to process information. The following quotation
supports the contention that the tool served to reduce cognitive load (Sweller, 1994,
Sweller and Chandler. 1991):
"It does it in the way that you get, instead of having to mentally visualise it... sort it in
their own heads like right in front of you . It's easier to picture really, to understand."
However, the sorting tool could also be used to test hypotheses and several of the
preservice teachers saw this as an additional use of the tool.
Graphs
The graphs contained balloon help that was activated when the cursor was located over
the names on the axes labelled "countries" and the numbers at the end of the bars in the
graphs. The balloon help on the axes labelled "countries" provided a small coloured map
that displayed the location of the country in its home continent. The balloon help on the

252
numbers provided additional explanatory text about the numbers. This form of help is
once again, "just in time" or a performance support tool (Gery, 1991).
The balloon help on the axes was considered to be an excellent feattire, but it is possible
that the balloon help could act in reverse and instead of supplying information at the time
of need, it could have diverted the leamer's attention from the global feahires. This could
have created additional cognitive load (Sweller, 1994; Chandler and Sweller, 1991). The
interview transcripts do not support this interpretation, but further investigation of this
aspect of the study is wartanted.
Most preservice teachers mentioned that the balloon help for the numbers provided useful
explanatory text and the text reinforced what the graph displayed. Others felt that it did
more than this because it provided additional information. Therefore the balloon help did
help leamers to analyse the data presented m the graphs, but one aspect that needs further
investigation is any relationships that may exist between the form of help provided and
the leamer's preferted style of leaming.
An unexpected outcome was that many of the preservice teachers admitted that they didn't
know where continents and countries displayed in the balloon help were in relation to
Austtalia. This finding needs further investigation with a larger sample as it may be a
factor associated with this group of students or it may reflect a more general lack of
geographic knowledge.
The questions
The questions were devised to encourage leamers to find information from the text and
from the graphs and the table. They were supplied on a separate sheet of paper, this
avoided the problem of flipping back and forth to the questions while accessing the
information.
To answer questions, preservice teachers could rely on memory but most questions
required looking at text and the table or graphs. Some preservice teachers preferted the
graphs as a primary source of information while others preferred to use the table or text.
The reasons for these preferences are not entirely clear, but they may be related to past
experience as several interview ttanscripts revealed that the preferted form of mformation
was usually the one that the leamer was "most comfortable with". For example Helen

253
used the text as her main source of information and explained that, "I used the text
because I'm a text... a word person, I'm a reader ..." but she also used the graphs as a
means of verifying the information she obtained from the text.
The primary fimction of the questions, however, was to encourage leamers to process the
information provided and to take the task seriously. It may have been easier to position
the questions adjacent to the screen which contained the relevant information, but this
would have encouraged leamers to rely upon one form of information rather than use the
other forms available.
The cognitive tools were used by leamers to assist them to process information and their
effectiveness varied according to idiosyncratic factors associated with the leamer
preferences and the way in which the tools were presented to the learners. Also the
leamers realised that the tools could be used in ways that the researcher had not
anticipated. This aspect of the study describes a finding that is typical in educational
settings: that leamers are likely to devise unintended ways of using cognitive tools.
Question 7. What evidence is there that these cognitive tools had an impact upon the
concepts developed by the leamers?
This part of the study examined the ways in which information about rainforest
destraction was accessed, what cognitive tools were used and whether this information
had an impact upon the concepts developed by the preservice teachers. The interview data
indicates that the preservice teachers accessed different forms of information in order to
constract their concept maps, but the analysis of the stracture and content of their concept
maps showed that they did not appear to be related to the forms of mformation accessed.
Further research is needed in order to ftilly understand this aspect of the study.
The ttacking data showed that when the preservice teachers were developing their concept
maps associated with rainforest destraction more time was spent using the text and
glossary than any other information source. Interviews supported this interpretation of
the tracking data and revealed that the glossary was often used as a first source of
concepts and then other supporting information was gathered from the text, table and
graphs. The graphs and table were accessed for shorter periods of time as often they
were used to clarify and verify information or concepts. Those who accessed the table

254
used the sorting tool to re-examine trends, in particular the "years to end" column.
Similarly the "years to end graph" attracted more attention than the otiier graphs and the
balloon help was used by those who accessed this source (13/15). The interview
ttanscripts indicated that the preservice teachers wanted to view tiie information because it
related to events that would happen within the leamer's hfe span.
The tracking data files containing time spent and frequencies of using specific cognitive
tools reflect the wide variation that would be expected from a group of adults who were
engaged in a task that was not constrained by a minimum or maximum time frame.
However, time can be a misleading variable if it is used in isolation. For example, the
raw data does not tell us if the preservice teacher who took 50 minutes using the concept
mapping tool spent any more time on task than the preservice teacher who took 30
minutes as (s)he may have spent time talking to peers while the other focused entirely on
the task at hand. Therefore interview data and general observations are needed to verify
the tiacking data and to clarify any discrepancies.
Interviews provided insights into why different leamers preferted to access different
forms of information. These are related to leamer preferences for specific forms of
information, learner efficiency in processing the information needed, and previous
experience with the subject matter. Furthermore, interviews supported the interpretation
that some but not all leamers have preferences for specific forms of information such as
text. However, analysis of the concept maps did not identify any differences in map
content or structure that could be related to these preferences. Three possible
explanations are discussed below.
First, the concept mapping tool allowed leamers to constract knowledge stractures that
appeared at first glance to be very different, but further analysis of the content in the
hidden notes often showed that the stractures were similar. Thus the differences in the
constracted concept maps were related to the way in which the leamers used the concept
mapping tool to constract their maps.
Second, while leamers took different pathways through the information that they needed
for the constraction of their concept maps, often the concept maps they developed to
represent their understandings were similar. Some of the interviews suggested that the
255
form(s) of information accessed at a particular time related to the information needed,
ease of access, ease of processing of the data required, and/or leamer preferences for
specific forms of information. The similarities in the maps constracted indicate that the
various forms of information presented to leamers helped some to develop similsu:
knowledge stractures. Furthermore, leamers may constract better concept maps when
they have access to information that is presented in a variety of forms as this allows them
to compare and contrast the different forms of information. Certainly some of the
interview transcripts indicated that learners accessed the different forms of information
for these purposes.
Third, it is possible that most preservice teachers could have come to the task witii a great
deal of background knowledge about the topic (eg. some may have studied the topic in
Geography m senior high) and didn't need to use the supporting information. However,
only two of the preservice teachers interviewed indicated that they had previously studied
the topic.
One factor that may influence the way in which leamers access uiformation and constract
their concept map is preferted leaming style. While the data from this study did not show
that the concept maps created by the preservice teachers were related to thek preferted
leaming style, further investigation is wartanted as some other researchers (Schreiber and
Abegg, 1991; Reiff and Powell, 1992) have reported significant findings in different
contexts. However, a recent study reported by (Kessler, 1995) failed to replicate their
work when he exammed the relationship between cognitive style (as measured by Kolb's
instrament) and total concept map score (based upon the criteria of Novak and Gowin
(1984). Thus the findings from this study and other recent studies have failed to clarify
whetiier a relationship does exist between tiie scores leamers receive for the concept maps
they consttuct and tiieir cognitive style. This is not surprising given tiie problems that
Shalveson (1993) reported with the metiiods used to score concept maps. Such problems
related primarily to the reliability and validity of the numerical scoring methods adopted
by researchers.
During this study interviews were also used to ascertain whether there were any
relationships between a leamer's leaming style and the form of information they preferted
to use when they constincted then: concept maps. While no relationship was found, it

256
needs to be kept in mind that the sample interviewed was small and a larger sample may
yield different results. At this stage it is pradent to state that during this stiidy no
relationship was observed among leaming style (as measured by Kolb's inventory), the
form of information accessed and the final stracture of the concept map was observed,
but the issue warrants further study. Also it may be useful to investigate whether
preferted leaming styles are related to the procedures leamers use when they constract
concept maps.
Question 8. Do the tracking data help researchers in understanding the way in which
the tools were used?
The ttacking data was collected automatically after the user logged on to the software.
This allowed the researcher to collect a large amount of data automatically, but in this case
a large volume of reliably collected data does not necessarily equate with easily
interpretable information. As previously stated, we cannot be sure that the preservice
teacher who took 50 minutes using the concept mapping tool spent any more time on task
than the preservice teacher who took 30 minutes. However, when observations and
other data sources are used to vahdate the ttacking data, the information becomes useful.
For example, the tracking record of events showed short-term access (eg. 40 to 80
seconds) to graphs and tables. Interviews and observation records about such short-term
events confirmed that leamers were accessing specific data in the graphs and tables that
related to the text or their concept map.
Consideration was given to generating maps of leamer audit ttails (Williams and Dodge,
1993; Misanchuk and Schwier, 1992) but it was felt that the use of multiple data sources
such as interviews would be more helpful for the purposes of this study. In fumre
studies maps of audit ttails may be used to supplement other sources of data.
Question 9. How did the leamer access information?
The findings showed that there was no relationship among any of the following
independent variables of attitudes to computers score, gender, age, preferted leaming
style, and the dependent variables of time spent in using the apphcation and the frequency
of subject refertals to specific screens of information. As discussed previously, this sort
of information is not that useftil unless it is supplemented with data from other sources.

257
Interviews confirmed that the total time preservice teachers spent accessing specific forms
of information reflected the relative importance of the information source in assisting
leamers to constract their concept maps. For example, the text was accessed for longer
periods of time than the graphs or tables and this preference for text-based information
probably reflects the demands of the knowledge constraction task that the leamers were
engaged in, and preferences associated with their tertiary studies. However, other forms
of information were accessed when needed. The interviews indicate that this usually
occurred when specific facts were needed to illusttate a concept or to explain a link.
There were exceptions though, and the transcript of Loretta, for example, showed that
she spent much of her time in reading, sorting and interpreting the table as she felt that it
was easier for her to process information that was in this form.
At this stage the findings relating to this research question can be discussed. First,
leamers accessed their primary source of information for longer periods of time and more
frequentiy. Few accessed all other forms of information as they constracted their concept
maps; instead they briefly accessed specific forms of information needed to supplement
the information contained in the concept map that they were constracting. Second, the
form of information accessed to supplement the primary information source appeared to
reflect the leamer's preferted form of information (as indicated during interviews).
Conclusion
For almost two hundred years authors have recognised that enormous amounts of
information could be presented in graphs and tables, and in 1801 William Playfak wrote
that graphs and tables could represent:
" ... as much information may be obtained in five minutes as would requke
days to imprint on memory , in a lasting manner, by a table of figures"
(Playfair, 1801b, p.l2).
More recentiy Weinttaub (1967) asserted that graphs and tables have an increasing role in
our society and "... often distil a wealth of information into a small amount of space "
(p.345).
The notion that we can assimilate the wealth of information displayed m a graph or table
"at a glance" and tiiat much information can be "imprinted" on memory can be misleading
258
as researchers inform us that humans frequentiy find it difficult to process the multiple
forms of complex information contained in graphs and tables (Janvier, 1978, Preece,
1985; Chandler and Sweller, 1991, 1994). ft is paradoxical that the sttength of
information displays presented in the form of graphs and tables can also be their
weakness.
During this study, cognitive tools were developed to act as mental devices to support,
guide and extend the thinking processes of leamers so that they could more easily
understand information presented in text, graphs and tables. The tools were extemal to
the leamer and computer-based. It is now appropriate to conclude this study with some
discussion about some general imphcations that have emerged.
Investigating learner interpretation graphs and tables
The findings from this study support the research findings reported by previous
researchers who used similar techniques (Janvier, 1978; Preece, 1985). More extensive
research is needed into cognitive load theory (Chandler and Sweller, 1991,1994) as this
is a promising avenue of research that may be related to cognitive tools. In particular, we
need to understand how we can reorganise graphical and tabular forms of information so
that it is in a form that reduces cognitive load. Furthermore, research techniques that
provide a rich source of data such as video recording of leamers, and interviews that are
combined with computer-based ttacking of leamer interactions with graphs and tables
could be used to help to develop further understanding of the causes of cognitive load.
It may be fraitful to investigate multiple mechanisms for reducing the same source of
leamer cognitive load as the form of support provided may relate to the leamer's
cognitive style. Furthermore, it may be productive to further investigate how "mental
integration" (Chandler and Sweller, 1991, p.330) may be supported with other mindtools
(Jonassen, 1996).
How to Introduce learners to cognitive tools
The way that we commonly encounter graphs and tables is in association with text and
typically this occurs in a newspaper, book or magazine. Therefore we can expect that the
context and the prior knowledge of the leamer will have an effect on the interpretation of
graphs and tables (Janvier, 1978; Preece, 1985). The cognitive tools were developed to

259
provide support in a leaming environment that reflected the context where leamers
usually encountered text, graphs and tables.
It was important that a more complex cognitive tool like the concept mapping tool was
inttoduced first so that leamers were proficient m its use before they used it in a different
context. The methods adopted to introduce leamers to the concept mapping tools were
well established by other researchers and this study showed these procedures were
apphcable in a different context.
To introduce each tool separately over a period of weeks would have been time
consuming and it is uncertain if this would have been of any benefit. However, a fumre
smdy could compare how different introductory procedures affect leamer use of simple
cognitive tools.
The supporting theory adopted was based upon Camboume's model of leaming (1988,
1995) and the key ideas associated with his theory appear to support the instractional
sequence chosen. Two key points that emerged. First, the concept mapping tool was
employed in a context that was meaningful to the learners and this promoted
"engagement" (Camboume, 1988). Second, the concept map produced was relevant to
an important task that occurred later in the year (a knowledge map related to an
instractional unit). This is an important point as leamers are more likely to be focused on
a task if they believe that the task is relevant to their lives. An important piece of
theoretical research would be to attempt to apply Camboume's or other suitable models
such as Kolb's to other visual and mindtools (Hyerle, 1996; Jonassen, 1996).
Learner use of cognitive tools
During this study the cognitive tools were used by leamers to analyse and to synthesise
information. The cognitive tools used for analysis were designed to be activated at the
moment of need and to reduce cognitive load associated with the processing of
information that was presented in a variety of forms. It may have been important for the
leamer to be able to de-activate these tools as Chandler and Sweller (1991) report that
"the isolation and elimination of redundant sources of information are preferable" (p.
330), particularly where mental integrations of information occur. It would also be
useful to compare the effects of cognitive tools (such as balloon help) under varying

260
conditions of availability such as: unavailable; permanentiy available; available when
activated by the leamer.
The concept mapping tool was a knowledge constraction tool that synthesised
(integrated) the various forms of information in a knowledge map. It is a tool that is
compatible with a constractivist approach to learning (Jonassen, 1996; Hyerle, 1996).
This tool, and others like it, provide researchers with concrete examples of computer-
based constractivist leaming environments. The ease of use of the tool and the flexible
ways in which it can be used creates a research environment that may be suitable for
exploring the effects that factors such as cognitive styles, leaming modalities, cultural
differences, language differences, communication styles, and multiple intelligences may
have upon the knowledge stractures that leamers create.
Finally, concept mapping engages leamers in higher order thinking skills such as critical
thinking, creative thinking and complex thinking (Jonassen, 1996). Further research is
needed to understand how these higher order thinking skills interact with each other when
leamers are actively engaged in the process of concept map constraction . The findings
may help researchers to develop more effective instractional processes and cognitive
tools.
Learner construction of knowledge with cognitive tools
When leamers constract a concept map they are required to identify important concepts in
the content domain, spatially arrange them, link them and attach explanatory notes. The
order in which these processes occur varies according to leamer characteristics and
limitations associated with the concept mapping tool being used.
Jonassen (1996) describes in more detail a similar sequence, but adds that while linking
is going on, new concepts are being added to the map as these explain existing concepts.
These concepts are linked and then additional concepts are added to explain them. "This
process of augmentation continues until the builder feels that the domain is explained well
enough" (p.98). He contends that "this process mirtors to some degree the natural
pattern of knowledge acquisition" (p.98). This idea of accretion of concepts was
mentioned by Norman in 1976, but now we have the opportunity to use computers and
video technology to closely monitor the process of concept map constraction. This

261
infortnation may help us to develop a much deeper understanding of tiie mental processes
involved.
During this study leamers appeared to use one of three strategies to constract their
concept maps. Some preferted to put all of the concepts on the screen before reartanging
them into a hierarchical, integrated framework before they added links and notes.
Another group preferted to work in "chunks" and they added a few concepts at a time. A
small number added concepts, notes and links in a more or less random fashion.
However, there was littie difference in the quality of the final map produced.
Further investigation of the process of knowledge constraction with concept mapping
tools is justified as different pattems of knowledge acquisition may be related to the
specific characteristics of the leamers. During this study, no such evidence was observed
and a reason may be that the leamers were not forced to focus upon a narrow domain of
knowledge. A study that focused upon a very nartow domain of knowledge acquisition
(eg. electromagnetic induction) may produce different results. Finally it needs to be
acknowledged that the leamers may have used the concept mapping tool in different ways
because it allowed them to employ a variety of methods of knowledge constraction.
The data on collaboration during the process of concept map constraction suggests that
the processes of discussion and negotiation may be more beneficial to leamers than the
final product (Roth, 1994). Therefore, another area of investigation is to further explore
the processes that occur when leamers are artanged in small collaborative groups to
constract concept maps. This investigation could be further extended to cross-cultural
collaboration via the intemet.
This study examined leamer use of cognitive tools in a narrow context and the discussion
that follows expands upon this context. While a certain amount of caution needs to be
exercised when extending the findings to other contexts, it still is important to explore
future applications of the research.
Curtently there are many computer-based visual tools available and all have their
stiengths and weakness. As computer technology improves it will become even easier
for a leamer to add more graphics and colour images to concept maps and further
development of these tools will lead to seamless links to the intemet where leamers in

262
different locations may collaborate to build shared knowledge stractures. Indeed at this
point in time one could conceive of the intemet as an enormous, dynamic knowledge
stinctiire that represents some of the personal and shared knowledge from over 60 million
leamers! Such a map is too big to be useful until leamers become successful navigators
and explorers, or "infotectives" (McKenzie, 1996). This stracture will then become a
valuable leaming tool, providing leamers have the tools to constract meanuig from the
information they find. Once again it may be the collaboration procedures that leamers
use in building their knowledge stractures that prove to be more important than the
product.
However, a word of caution needs to be voiced as the next generation of visual tools(or
mindtools) need to be carefully designed and then carefully inttoduced to leamers. Hedberg
(1989a) asserts that the introduction of technology in education has a history of broken
promises and poor performance. As a result many teachers and administtators have become
wary of visionaries bearing computer-based gifts (Sewell, 1990). This lack of acceptance
and adoption of technology in schools can be traced back to the way that each invention is
presented and marketed (Hedberg, 1989a). Too often the invention is presented as a
solution to many of the problems associated with education and each new design feature is
touted as a time saving device that teachers and administtators need. When the invention
fails to live up to these promises and is not widely adopted, it is often abandoned and its
inventors and supporters roundly criticised. A closer look at the invention may reveal that it
did not fail but that the criteria used to evaluate its success were too narrow or
inappropriate. For example the time scale used may be too short. It may be more
appropriate to judge the invention by the attitudes and perseverance of those who use it as a
tool than by the technology itself.
Hedberg (1989a) suggested that this problem of lack of acceptance occurs because too
often the hardware of technology is viewed in isolation from the context in which it is
employed. Visual tools that assist leamers to constract knowledge are an example of a
computer based tool that can be used in a variety of meaningful contexts. Furthermore,
most are easy to use so the mental effort required to leam to use the software is low.
Therefore, one is justified in displaying cautious optimism about the future adoption of
these tools. However, before adoption each tool needs to be evaluated and Jonassen

263
(1996) has suggested how such tools should be evaluated. The criteria that are
discussed below are mainly based on his suggestions.
They should be affordable (Jonassen suggests that the costs should not exceed US $100)
and should be easy to leam. Generally typical leamers should be capable of leaming how
to use the application within an hour. The screen display should directiy represent
stinctural knowledge in a way that is aesthetically appeahng to leamers, otherwise there is
littie value over pen and paper methods. Finally learners should enjoy using the
application.
Engagement of higher order thinking skills
Visual tools when effectively used engage leamers in higher order thinking skills
(Hyerle, 1996). Jonassen (1996) has classified these thinking skills into groups which
he calls critical, creative and complex thinking skills. When leamers are constracting
concept maps they employ critical thinking to identify, evaluate, analyse and connect
information. Creative thinking is needed when leamers synthesise or elaborate on
information that relate to concepts and links. Jonassen (1996) suggests that
hypothesising may also be involved. Complex thinking is engaged when leamers
develop the layout of their maps and form their links. Such thinking involves a variety of
evaluating, analysing and connecting skills.
When instractors introduce leamers to visual tools such as the concept mapping tool
employed in this study, they need to be aware that the leamers are engaged in a complex
task that is mentally demanding. Therefore, the process needs to be supported by
sttategies that assist leamers to fiiUy engage their mental abilities. One way is to provide
opportunities for discussion and feedback from peers and mtors. Another is for the
instractor to engage individual learners in a dialogue that allows them to work in a form
of cognitive apprenticeship. However, it is time consuming. Finally, instractors need to
provide leamers with plenty of time to engage in the process. If there is an expectation
by the instractor that the initial product should be of high quality, then disappointment is
a likely outcome (White and Gunstone, 1992). However, if the process is valued and the
focus is upon higher order thinking, then over time the outcome is likely to be pleasing.

264
Cognitive tools that provide support at the moment of need
The other cognitive tools developed for this study were forms of "just in time" support
(Gery, 1991) and helped leamers to process information. They were context-specific,
simple to use and required littie, or no instraction. Because they were unobtrasive and
did not distract leamer attention from the main task, they did not split attention and cause
additional cognitive load (Chandler and Sweller, 1991).
The support could easily be in spoken information or visual form but it is important to
select a form of support that is appropriate to the context rather than opting for a more
complex solution. Indeed, a more complex form of support may prove to be counter
productive as it may be a distraction and result in additional cognitive load. As more
experience is gained with such tools in a variety of contexts we will leam more about
their effects and the way leamers use them.
Future leamers are likely to have access to "electronic books" that include cognitive
support tools. The forms that these tools take will depend on the context and on the
understandings that we develop about how leamers use cognitive tools. This study is
only a small step along this path to understanding.

265
References Abacus Concepts. (1992). StatView. Berkeley, C.A.: Abacus Concepts, Inc.
Allinson, L. J., & Hammond, N.V. (1990). Leaming support environments: Rationale
and evaluation. Computers and Education, 15, 137-143.
Anderson, J. R. (1980). Cognitive psychology and its implications. San Francisco:
W.H. Freeman and Co.
Anderson, J. R. (1978). Arguments conceming representations for mental imagery.
Psychological Review, 85, 249-277.
Anderson, R. C. (1972). How to constract achievement tests to assess comprehension.
Review of Educational Research, 42, 145-170.
Anderson, R. C , & Kulhavy, R. W. (1972). Imagery and prose leaming. Joumal of
Educational Psychology, 63, 242-243.
Appel, I. J. (1973). The relationship between the sequence of graph interpretation
skills and the sequence of mathematics skills for kindergarten through ninth grade.
Doctoral Dissertation, Fordham University, University. (Microfilms order no. 73-
16004).
Armbraster, B. B. (1979). An investigation of the effectiveness of "mapping" text as a
studying strategy for middle school students. Unpublished doctoral dissertation.
Champaign, Illinois: University of Illinois.
Ausubel, D. P. (1968). Educational psychology: A cognitive view. New York: Holt,
Rinehart and Winston.
Ausubel, D. B., & Youseff, M. (1963). The role of discriminability in meaningful
parallel leaming. Journal of Educational Psychology, 54, 322-336.
Ausubel, D. P. (1960). The use of advanced organisers in leaming and retention of
meaningful material. Joumal of Educational Psychology, 51, 267-272.
Bacon, F. (1620). Great insaturation of leaming. Trans. Oxford, 1855.
Balajthy, E. (1990). Hypermedia and metacognition: Research and instractional
implications disabled readers. Joumal of Reading, Writing, Leaming Disabilities
Intemational, 6(2), 183-202.
Barker, J., & Tucker, R. N. (1990). The interactive leaming revolution: Multimedia in
education and training. London: KeganPaul.
266
Bames, B. R., «fe Clawson, E. U. (1975). Do advanced organisers facihtate leaming?
Recommendations for further research based on an analysis of 32 studies. Review of
Educational Research, 45(4), 637-659.
Bean, T. W., Singer, H., Sorter, J., & Frazee, C. (1986). The effects of
metacognitive instraction in outlining and graphic organizer constraction on student's
comprehension in a tenth-grade history class. Joumal of Reading Behaviour, 18(2),
153-169.
Bertin, J. (1983). Semiology of graphics. Wisconsin: University of Wisconsin Press.
Beyerbach, B. A. (1988). Developing a technical vocabulary on teacher planning:
preservice teachers' concept maps. Teaching and Teacher Education, 4(4), 33-347.
Bigge, M. L., & Shermis, S. S. (1992). Leaming theories for teachers. N. Y.:
Harper-Collins.
Blakeslee, T. R. (1980). The right brain: A new understanding of the unconscious
mind arui its creative powers. London: Macmillan Press.
Board of Studies, (1991). Science and Technology K-6: Syllabus and Support
Document. Sydney: Department of School Education.
Bonner, J. (1988). Implications of cognitive theory for instractional design. ECTJ,
36(1), 3-14.
Bowen, R. W. (1992). How to make, read, and interpret graphs. Englewood CUffs,
New Jersey: Prentice Hall.
Bower, G. H. (1972). Stimulus-sampling theory of encoding variability. In A. W.
Melton & E. Martin (Eds.), Coding processes in human memory. Washington, D.C.:
Winston.
Bransford, J. D., & McCartell, N. S. (1974). A sketch of a cognitive approach to
comprehension. In W. Weimer & D. S. Palermo (Eds.), Cognition and the symbolic
processes. Hillsdale, N.J.: Erlbaum.
Braner, J. S. (1966). Towards a theory of instruction. Cambridge, Massachusetts:
Harvard University Press.
Braner, J. S. (1986). Actual minds, possible worlds. Cambridge, Massachusetts:
Harvard University Press.
Braner, J. S. (1960). The process of education. Cambridge, Massachusetts: Harvard
University Press.
Buzan, T. (1995). The mindmap book. London: BBC Books.

267
Camboume, B. (1988). The whole story: natural leaming and the acquisition of literacy
in the classroom. Sydney: Ashton Scholastic.
Camboume, B. (1995). Toward an educationally relevant theory of literacy leaming:
Twenty years of inquiry. The Reading Teacher, 49(3), 182-190.
Cannon, J. R. (1995). Further validation of the constractivist leaming environment
survey. Joumal of Elementary Science Teacher Education, 7(1), 47-62.
Carpenter, P., & Just, M. (1989). The role of working memory in language
comprehension. In Klahr, P. & Kotavsky, K. (Eds.), Complex information
processing: The impact of Herbert A. Simon, (pp. 31-68). Hillsdale, New Jersey:
Lawrence Erlbaum.
Certo, S. C , & Lamb S. W., (1980). An investigation of bias within the leaming
styles inventory through factor analysis. Joumal of Experiential Learning and
Simulation, 2, 1-7.
Chandler, P., & Sweller, J. (1991). Cognitive load theory and the format of
instraction. Cognition and Instruction, 8(4), 293-332.
Clark, R. C , & Taylor, D. (1994). The causes and cures of leamer overload.
Training, 31(7), 41-45.
Clarke, J. H. (1991). Using visual organisers to focus on thinking. Joumal of
Reading, 34(1), 526-534.
Clarke, R. C. (1992). EPSS Look before you leap: Some cautions about applications
of electtonic peformance support systems. Performance and Instruction. May/June
1992, 22-25.
Cleixton, C. S., & Hurtell, P. H. (1987). Leaming styles: Implications for improving
educational practice (Ashe-Erie Higher Education Report No.4.). Washington: D.C.:
George Washington University.
Cognitive Technology Group, Leaming Technology Center, and Peabody College of
Vanderbilt University. (1991). Technology and the design of generative leaming
environments. Educational Technology, 31(5), 34-40.
CoUins, A. (1990). The role of computer technology in restracturing schools. In K.
Sheingold & M. S. Tucker, (Eds.), Restructuring for leaming with technology (pp.
29-48). New York: Center for Technology in Education.
Conklm, J. (1987). Hypertext: An introduction and survey. Computer, 20(9), 17-41.

268
Craik, F. I. M., & Lockhart, R. S. (1972). Levels of processing: a framework for
memory research. Joumal of Verbal Leaming and Verbal Behaviour, 11, 671-684.
Crawford, R. (1995). Report on mathematics screening tests 1992 to 1994.:
(Unpubhshed manuscript). WoUongong: Austtaha: University of WoUongong.
Curcio, F. R. (1989). Developing graph comprehension: Elementary and middle
school activities. Virginia: National Council of Teachers of Mathematics, 1906
Association Drive, Reston.
Curriculum Corporation (1994), Science - a curriculum profile for Australian schools.
Carlton, Victoria: Curriculum Corporation.
Curry, L, (1987). Integrating concepts of cognitive leaming style: A review with
attention to psychometric standards. (Research report): Ottawa, Canada, Canadian
College of Health Science Executives.
Dale, E. (1946). Audio-visual methods in teaching. New York: Dryden Press.
Dzile, E. (1969). Audio-visual methods in teaching. 3rd Edition. New York: Dryden
Press.
De Bello, T. C. (1990). Comparison of eleven major leaming styles models: variables,
appropriate populations, validity of instramentation, and the research behind them.
Reading, Writing, and Leaming Disabilities, 6, 203-222.
De Corte, E, (1990). Learning with new information technologies in schools:
perspectives from the psychology of leaming and instraction. Joumal of Computer
Assisted Leaming, 6, 69-87,
Decker, W, H., & Wheatiey, P. C. (1982). Spatial grouping, imagery, and free recall.
Perceptual and motor skills, 55, 45-46.
Dede, C. J. (1990). Imagining technology's role in restracturing for leaming. In K.
Sheingold & M. S. Tucker, (Eds.), Restructuring for leaming with technology (pp.
49-74). New York: Center for Technology in Education.
Department of Education, Employment & Training (DEET), (1989). Discipline review
of teacher education in mathematics arui science. Canberta: Austtalian Govemment
Publishing Service.
Department of School Education. (1991). Science and technology: Syllabus and
support document. Sydney: Department of School Education.
DePorter, B. (1992). Quantum leaming: Unleashing the genius in you. New York:
Dell PubHshmg.

269
Deny, S. J., & LaJoie, S. P. (1993). A middle camp for (un)intelligent instractional
computing: An inttoduction. fti S. P. LaJoie and S. J. Derry (Eds.), Computers as
cognitive tools. Hillsdale, NJ: Lawrence Erlbaum Associates.
Dewey, J. (1938). Education and experience. New York: Macmillan.
Diekhoff, G. M. (1983). Relationship judgments in the evaluation of stractural
understanding. Joumal of Educational Psychology, 75, 227-233.
Doblin, J. (1980). A stracture for non-textual communications. In P.A. Koiers, M.E.
Wrolstad, & N. Bouma (Eds.), Processing visible language Vol. II (pp.89-111). New
York: Plenum Press.
Doland, V. M. (1989). Hypermedia as interpretive act. Hypermedia, 7(1), 6-19,
Donaldson, M, (1978), Children's minds. New York: Fontana,
Driver, R. (1988). Theory into practice H: A constractivist approach to curticulum
development. In P. Fensham (Ed,). Developments and dilemmas in science education
(pp, 133-149), London: The Falmer Press,
Driver, R., Squires, A,, Rushworth, P., & Wood-Robinson, V. (1994), Making sense
of secondary science: research into children's ideas. London: Routiedge.
Driver, R., & Erickson, G. (1983). Theories in action: Some theoretical and empirical
issues in the study of students' conceptual frameworks in science. Studies in Science
Education, 10, 37-60.
Dryden, G., & Vos, J, (1994). The leaming revolution. Aylesbury, Bucks, United
Kingdom: Accelerated Leaming Systems.
Dugdale, S. (1986), Pathfinder: A microcomputer experience in interpreting graphs.
Joumal of Educational Technology Systems, 15(3), 259-280.
Dunn, R., Dunn, K., & Price, G. E, (1979). Leaming style inventory. Lawrence,
K,S.: Price systems.
Dunn, R., Cavanaugh, D. P., Eberle, B. M., & Zenhausem, R. (1982). Hemispheric
preference: The newest element of leaming style. The American Biology Teacher,
44(5), 291-294.
Dunn, R., Beaudry, J, S,, & Klavas, A. (1989). Survey of research on leaming
styles. Educational Leadership, 46(6), 50-58.
Ellsworth, N. J. (1990). What's new in software? Curtent sources of information
boost effectiveness of computer-assisted instraction. Joumal of Reading, Writing, and
Leaming Disabilities Intemational, 6(3), 379-382.

270
Eysneck, M. W., & Keane M. T. (1990). Cognitive psychology: a student's
handbook. East Sussex, UK.: Lawrence Erlbaum
Fenker, R., & Mullins, R. (1982). Stop studying and start leaming. Fort Worth,
Texas: Tangram Press.
Ferry, B., Hedberg, J. G., & Harper, B. M. (1996). Sttategies of teachers as users of
multimedia. Australian Joumal of Education, 40(2), 133-146.
Ferry, B. (1996). Probing personal knowledge: The use of a computer-based tool to
help preservice teachers map subject matter knowledge. Research in Science
Education, 26(2), 233-247.
Fisher, K. M., Faletti, J., Patterson, H., Thornton, R., Lipson, J., & Spring, C.
(May 1990). Computer-based concept mapping-SemNet software: A tool for
describing knowledge networks. Joumal of College Science and Technology, 19,
347-352.
Flavell, J. H. (1976). Metacognitive aspects of problem solving. In L. B. Resnick,
(Ed.), The nature of intelligence. Hillsdale, N.J.: Lawrence Erlbaum.
Flavell, J. H, (1987). Speculation about the nature and development of metacognition.
Hillsdale, N.J.: Lawrence Erlbaum.
Flemming, M. L., & Levie, W. H. (1978). Instructional message design: Principles
from behavioural sciences. NJ: Englewood Cliffs: Educational Technology
Pubhcations.
Franklin, C. (1988). The hypermedia library. Database, 11(3), 43-48.
Frayer, D. A., Fredrick, W. C , & Klausmeier, H. J. (1969). A schema for testing the
level of concept mastery (Working Paper No. 16). Madison, Wisconsin: Wisconsin
Research and Development Center.
Freedman, R. D., & Stumpf, S. A., (1981). Leaming style inventory: Still less than
meets the eye. Academy of Management Review, 6, 297-299.
Funkerhouser, H. G. (1937). Historical development of the graphical representation of
statistical data. Soirees, 3, 367-404.
Gagne, R. M. (1975). Essentials of leaming for instruction. New York: Holt,
Rinehart and Winston.
Gagne, R. M, (1985). The conditions of leaming. New York: Holt, Rinehart and
Winston.

271
Gagne, R, M. (1987). (Ed.). Instructional technology: Foundations. New York:
Lawrence Erlbaum.
Garton, A. F. (1992). Social interaction and the development of language. Hillsdale
(USA): Lawrence Erlbaum.
Gery, G. J. (1989). Electronic performance support systems. Computer-Based
Training Directions, 2(6), 12-15.
Gilbert, J. K., & Watts, D. M. (1983), Concepts, misconceptions and altemative
conceptions: Changing perspectives in science education. Studies in Science
Education, 5, 61-64.
Goetz, E. T., & Armbraster, B. B. (1980). Psychological cortelates of text stracmre.
In R. J. Spiro, B. C. Brace & W. F. Brewer (Eds.), Theoretical issues in reading
comprehension: Perspectives from cognitive psychology, linguistics, artificial
intelligence, and education (pp. 201-216). Hillsdale, N. J.: Lawrence Erlbaum.
Goodram, D. A., Dorsey, L. T., & Schwen, T. M. (1993). Defining and building an
enriched leaming and information environment. Educational Technology, 5(11), 10-
20.
Gordon, S. E., & Gill, R. T. (1989). The formation and use of knowledge structures
in problem solving domains. (Technical report). Washington, D.C.: Boiling Airforce
Base.
Gregorc, A. R., & Wardm, H. B. (1977). Implications for teaching and leaming: A
new definition for individual. NASSP Bulletin, 61, 20-26.
Gressard, C. P., & Loyd, B. H. (1985). Validation studies of a new computer
attitudes scale. Paper presented at the 69th Annual Meeting of the American
Educational Research Association. Chicago. (ERIC Document Reproduction Service
No. MF01/PC02).
Grinder, M. (1989). Righting the educational conveyor belt. Portland, Oregon:
Metamorphous Press,
Hammond, N., & Allinson, L. (1991). Extending hypertext for leaming: An
investigation of access and guidance tools. Proceedings of the Third Conference of the
British Computer Society HCI Specialist Group: People and Computers V (pp.293-
304). Cambridge.

272
Hammond, N. (1991). Tailoring hypertext for the leamer. In M. Kommers, D, H.
Jonassen, & J. Terry Mayes (Eds.), Computers and system sciences . Vol. 81
(pp. 149-159). Beriin: Springer-Veriand in cooperation with NATO Scientific Affans
Division.
Hannafin, M. J. (1989). Interaction strategies and emerging instractional technologies:
Psychological perspectives. Canadian Joumal of Educational Communications, 18(3),
167-179.
Harlen, W. (1992), The teaching of science; studies in primary science. London:
David Fulton Publishers.
Harlen, W., Macro, C , Schilling, M„ Malvem, D,, & Reed, K, (1990), Progress in
primary science. London: Routiedge,
Haywood, J., & Norman, P, (1988). Problems of educational innovation: the primary
teacher's response to the microcomputer, Joumal of Computer Assisted Learning.,
4(1), 34-43,
Hedberg, J, G. (1989a), The relationship between technology and mathematics
education: Implications for teacher education. In DEET (1989), Discipline review of
teacher education in mathematics and science (3) (pp, 103-137), Canberta: Austtalian
Govemment Publishing Service,
Hedberg, J, G, (1989b), The desktop teacher. HERDS A Green Guide No. 10,
Higher Education Research and Development Society of Australasia (HERDSA): c/-
Problarc, PO Box 555, Campbelltown, Austtaha.
Hedberg, J. G, (1988). Teams and conceptualisation. In Ask the workers ...
evaluation. Surry Hills, Sydney: Austtalian Caption Centte.
Hedberg, J. G., & Harper, B, M. (1991), Cognitive records on navigation. In ILI
research report. WoUongong: University of WoUongong.
Hegarty, M., Carpenter, P., & Just, M. A, (1991), Diagrams in the comprehension of
scientific texts. In R, Bar, M. L, Kamil. P, B, Mosenthal & P, D, Pearson (Eds,),
Handbook of reading research: Volume II (pp. 641-667). White Plains, N.Y.:
Longman Publishmg Company.
Heimlich, J, E., & Pittelman, S. D. (1986). Semantic mapping: Classroom
applications. Newark, Delaware: Intemational Readmg Association.
Hellige, J. (1980). Cerebral hemispheric asymmetry: Methods, issues and
implications. Educational Communication and Technology Joumal, 28, 83-98.

273
Holley, C, H., & Dansereau, D. F, E., (Eds.), (1984). Spatial leaming strategies:
Techniques, applications, and related issues. Sydney: Academic Press.
Huberman, M, (1990). Linkage between researchers and practitioners: A qualitative
study. American Educational Research Joumal, 27(2), 363-393.
HoweU, D, C, (1992). Statistical methods for psychology. Belmont, C.A.: Duxbury
Press.
Huff, D. (1975). How to lie with statistics. Sydney: Penguin.
Hughes, M. (1975). Egocentrism in preschool children. Unpublished PhD Thesis.
Edinburgh University, Edinburgh.
Hyerle, D. (1996). Visual tools for constructing knowledge. Alexandria, Virginia:
Association for Supervision and Curriculum Development.
Janvier, C. (1978). The interpretation of complex cartesian graphs representing
situations - studies and teaching experiments. Unpublished PhD Thesis. University
of Nottingham, U.K,
Janvier, C. (1980), Translation processes in mathematics education. Proceedings of the
4th P. M. E. Conference at Berkeley : Berkeley, CA,
Janvier, C , & Garancon, M. (1989), Graphical understanding of simple feedback
systems. Focus on Leaming Problems in Mathematics, 11(2), 127-138.
Jegede, O. J„ Alaiyemola, F. F., & Okebukola, P. A. O. (1990). The effect of
concept mapping on students' anxiety and achievement in biology. Journal of
Research in Science Teaching, 27(10), 950-960,
Jo, M. L, (1993), Hints and leamer conttol for metacognitive strategies in problem
solving. In M. R, Simonson & K. Abu-Omar (Eds,), 15th Annual Proceedings of
Selected Research and Development Presenters at 1993 National Convention for
Educational Communications and Technology, (pp.416-423). Iowa : Iowa State
University College of Education,
Johnson-Laird, P. N. (1981). The form and function of mental models. Proceedings
from the third annual conference of the Cognitive Society, Berkeley California, August
1981: Berkeley, CA.
Jonassen, D. H., & Grabowiski, B, L, (1993). Handbook of individual dijferences,
leaming, and instruction. New Jersey: Lawrence Erlbaum,

274
Jonassen, D. H, (1992a), Semantic networking as cognitive tools. In M. Kommers, D.
H. Jonassen, & J. Terry Mayes (Eds.) Cognitive tools for leaming. Vol. F81 (pp.l9-
21). Berlin: Springer-Veriand in cooperation witii NATO Scientific Affans Divisions,
Jonassen, D. H. (1992b), What are cognitive tools?. In M. Kommers, D, H,
Jonassen, & J. Terry Mayes (Eds,), Cognitive tools for leaming. Vol, F81 (pp. 1-6),
Beriin: Springer-Veriand in cooperation with NATO Scientific Affans Division,
Jonassen, D, H, (1996). Computers in the classroom: mindtools for critical thinking.
New Jersey: Merrill.
Jonassen. D. H., & Reeves, T. C. (1996). Leaming with technology: using
computers as cognitive tools. In D. H. Jonassen (Ed.) The handbook of research for
educational communications and technology. New York: MacmiUan
Jonassen, D, H. (1987). Assessing cognitive structure: verifying a method using
pattem notes, Joumal of Research and Development in Education, 20(3), 1-14,
Jonassen, D., & Hawk, P, (1984), Using graphic organisers in instruction.
Information Design Joumal, 4, 58-68.
Jonassen, D. H. (1988). Designing stractured hypertext and stracturing access to
hypertext. Educational Technology, 28(11), 13-16.
Jones, W. P. (1987), How do we distinguish the hyper from the hype in non-linear
text? In H, J, BuUinger & B, Shackel, (Eds,), Human-computer interaction-Interact
'87 (pp. 1107-1113), Amsterdam: ftiteract'87.
Jung. W. (1993), Uses of cognitive science in science education. Science and
Education, 2, 31-56.
Kenny, R, F. (1993), The effectiveness of instructional orienting activities in
computer-based instruction. In M. R. Simonson & K. Abu-Omar (Eds.), 15th Annual
Proceedings of Selected Research and Development Presenters at 1993 National
Convention for Educational Communications and Technology, (pp.495-515). Iowa :
Iowa State University CoUege of Education.
Kessler, R, (1995). Cognitive styles and concept mapping dimensions of hypermedia
computer users. EdD. Dissertation. Florida Atiantic University, Boca Raton, Florida.
(UMI No. 9528553).
Knowlton, J. Q. (1966), On the definition of a picttire. AV Communication Review,
14, 157-183.

275
Kolb, D. A., & Goldman, M. (1973). Toward a topology of leaming styles and
leaming environments: An investigation of the impact of leaming styles and discipline
demands on the academic performance, social adaptation and career choices ofM.l.T.
Seniors. (M.I.T. Sloan School Working Paper No. 688-73).
Kolb, D. A., Rubin, I. M., & Mclntyre, J. M. (1974). Organisational psychology: An
experimental approach. New Jersey: Englewood Cliffs, Prentice Hall.
Kolb, D. A. (1984). Experiential leaming: Experience as the source of leaming and
development. New Jersey: Englewood Chffs.
Kosslyn, S. M. (1980). Image and mind. Cambridge: MA: Harvard University Press.
Kosslyn, S. M. (1981). The medium is the message of mental imagery. Psychological
Review, 86, 46-66.
Kuhn, T. S. (1962). The structure of scientific revolutions. Chicago: University of
Chicago Press.
Lefrancois, G. R. (1972) Psychology for teaching : a bear always faces the front.
Calif. : Wadsworth Pub. Co.
Levie, W. H., & Dickie, K. E. (1973). The analysis and application of media. In
R.M. Travers (Ed.), Second handbook of research in teaching. Chicago: Rand
McNally.
Lewis, D. E. (1994) The performance at university of equity groups and students
admitted by altemative modes of entry. Canberta: Austtalian Govemment Publishing
Service. 18-19; 36-37.
Li, M. F. (1993). Empowering leamers through metacognitive thinking, instraction,
and design. In M. R. Simonson & K. Abu-Omar (Eds.), 15th Annual Proceedings of
Selected Research and Development Presenters at 1993 National Convention for
Educational Communications and Technology (pp.613-625). Iowa : Iowa State
University CoUege of Education.
Liebhold, M. (1987). A layered theory of design for optical disc software: Leaming
tomortow. Joumalof Apple Educational Advisory Council, 3, 324-353.
Linderblad, S. (1990). From technology to craft: On teachers' experunental adoption of
technology as a new subject in the Swedish primary school. Joumal of Curriculum
Studies, 22(2), 165-175.
Lindsay, P. H., & Norman, D. A. (1977). Human information processing: An
introduction to psychology (2nd Edition). New York: Academic Press.

276
Lloyd, C. V. (1990). The elaboration of concepts in three biology textbooks:
facilitating student leaming. Joumal of Research in Science Teaching, 27(10), 1019-
1032.
Lozanov, G. (1978). Suggestology and outlines of suggestopedy. New York:
Gordon and Breach.
Luiten, J., Wilbur, A., & Ackerson, G. (1980). A meta-analysis of the effects of
advanced organisers on leaming and retention. American Educational Research
Joumal, 17(2), 211-218.
Lyddon, W, J., & McLaughlin, J. T. (1992). Constractivist psychology: a heuristic
framework, Joumal of Mind arui Behaviour, 13(\), 89-107,
MacDonald-Ross, M. (1977) Research in graphic communication - Graphics in text:
How numbers are shown (lET monograph, 7). Milton Keynes: Institute of
Educational Technology, The Open University.
MacNamara, J. (1982). Names for things: A study in human leaming. Cambridge,
Mass: M.I.T Press.
Margulies, N. (1991). Mapping inner space: Leaming and teaching mind mapping.
Tuscon, Arizona: Zephyr Press.
Martin, D. J. (1994). Concept mapping as an aid to lesson planning: a longitudinal
study. Joumal of Elementary Science Education, 6(2), 11-30.
Massoud, S. L, (1991), Computer attitudes and computer knowledge of adult
students. Joumalof Educational Computing Research, 7(3), 266-291,
Matthews, M, (1994). Constructivism in one country: The New Zealand experience .
NARST, March, 1994 Annual Conference Anaheim, (CA).
Matthews, M. (1997). Introductory comments on philosophy and constractivism in
science. Science and Education, 6, 5-14.
Mayer, R. E. (1980). Elaboration techniques that increase the meaningfulness of
technical text: An experimental test of the leaming strategy hypothesis. Joumal of
Educational Psychology, 72(6), 110-lM.
Mayer, R. E, (1975), Different problem solving competencies established in leaming
computer programming with and without meaningful models, Joumal of Educational
Psychology, 61, 725-734.
Mayer, R, E, (1976). Some conditions of meaningful learning of computer
programming, Joumalof Educational Psychology, 68, 143-150,

277
Mayer, R, E, (1977), The sequence of instraction and the concept of assimilation-to-
schema. Instructional Science, 6, 369-388.
Mayer, R. E, (1979). Can advanced organisers influence meaningful leaming? Review
of Educational Research, 49, 371-383.
Mayer, R. E., Dyck, J. L., & Cook, L, K, (1984), Techniques that help readers buUd
mental models from scientific text: Definitions, pretraining and signallmg. Joumal of
Educational Psychology, 76(6), 1089-1105,
McCarthy,B.(l9Sl). The 4 Mat system. Barrington, Ilinois: Excel.
McDonald-Ross, M. (1979). Scientific diagrams and the generation of plausible
hypotheses: An essay in the history of ideas. Instructional Science, 8, 223-234.
McKenzie, J. (Jan./Feb. 1996). Grazing the net. From Now On: The Educational
Technology Joumal, 5(5),n,p.: http://www,pacificrim,net/~mckenzie/grazingl.html;
e-mail, [email protected],
McKonkie, G W, Leaming from text. In L, Schulman (Ed,), Review of research in
education. (Vol. 5). Itasca, IL: Peacock.
Merrill, M. D., & Stolurow, L. M. (1966). Hierarchical preview versus problem
oriented review in leaming an imaginary science. American Research Joumal, 3,
251-261.
Messick, S. (1984). The nature of cognitive styles: Problems and promise in
educational practice. Educational Psychologist, 19(2), 59-74.
Miller, G. A. (1956). The magic number seven, plus or minus two: Some limits to our
capacity to process information. Psychological Review, 63, 81-97.
Misanchuk, E. R., & Schwier, R. A. (1992). Representing interactive multimedia and
hypermedia audit tiails. Joumal of Educational Multimedia arui Hypermedia, 1, 355-
372.
Modgil, S., & Modgil, C. (1982). Jean Piaget: Consensus arui controversy. N.Y.:
Praeger.
Moore, P. J. (1993). Metacognitive processing of diagrams, maps and graphs,
Leaming and Instruction, 3(3), 215-226.
Morris, A., & Stewart-Dore, N. (1984). Leaming to leam from text: Effective reading
in the content areas. Sydney: Addison-Wesley.

278
Mosenthal, P. B., & Kirsh, I. S. (1991). Understanding documents: information types
in nonmimetic documents: A review of Biddle's wipe-clean slate. Joumal of Reading,
34(%), 654-660.
Nelson, T, (1981). Literary machines: the report on, and of, project conceming word
processing, electronic publishing, hyper text, thinker toys, tomorrow's intellectual
revolution, and certain other topics including, knowledge, education and freedom.
Swarthier, PA: Ted Nelson.
Norman, D. A., Gentler, S., & Steeves, A. L. (1976). Comments on leaming
schemata and memory organisation. In D. Kalbar (Ed.), Cognition and Instruction.
Hillsdale: Lawrence Erlbaum.
Novak, D., & Knowles, J. (1991), Beginning teachers' use of computers in the
classroom instraction. Action inTeacher Education, 8(2), 43-51.
Novak, J. D., & Gowin, D B. (1984). Leaming how to leam. New York: Cambridge
University Press.
Novak, J. D. (1990). Concept mapping: A useful tool for science education. Joumal
of Research in Science Teaching, 27(10), 937-949.
Novak, J. D. (1988). Leaming science and the science of leaming. Studies in Science
Education, 15, 77-101.
Novak, J. D. (1977a). A theory of education. London: Cornell University Press.
Novak, J, D. (1977b), An alternative to Piagetian psychology for science and
matiiematics education. Science Education, 61(4), 253-277,
Oliver, R. (1994). Factors influencing teacher uptake of computers. Journal of
Technology and Teacher Education, 2(1), 71-89,
Olson, D, (1977), The language of instraction: On the literate bias of schooling. In
R.C. Anderson, R.C. Spiro, & M.C. Montague (Eds,), Schooling and the acquisition
of knowledge. HUlsdale, N.J.: Lawrence Erlbaum.
Oppenheim, A. N. (1992). Questionnaire design, interviewing and attitude
measurement. London: Pinter Publishers.
Osborne, R., & Wittrock, M. (1985). The generative learning model and its
imphcations for science education. Studies in Science Education, 12, 59-87.
Paivio, A, (1971). Imagery and verbal processes. New York: Holt, Rinehart and
Winston,
279
Paivio, A, (1972). A theoretical analysis of the role of imagery in leaming and
memory. In R. Sheehan (Ed,), The function and nature of imagery. Academic Press.
Paivio, A. (1983). The empirical case for dual coding. In J. C. Yuille (Eds.), Imagery,
memory and cognition, (pp. 310-333). Hillsdale, NJ: Lawrence Erlbaum.
Papert, S. (1980). Mindstorms: Children, computers and powerful ideas. New York:
Basic Books.
Papert, S. (1993). The children's machine: Rethinking school in the age of the
computer. New York: Harvester Wheatsheaf.
Perkins, D. N. (1993). Person-plus: A distributed view of thinking and leaming. In G.
Salamon (Ed.), Distributed cognitions: Psychological arui educational considerations.
Cambridge: Cambridge University Press.
Piaget, J. (1971). Psychology and Epistemology. New York: Grossman.
Piaget, J. (1976). 'Piaget's theory'. In B, Inhelder & H, H, Chipman (Eds,), Piaget
and his school. New York: Springer.
Pinker, S. (1981). A theory of graph comprehension (Occasional Paper No, 10),
Massachusetts Institute of Technology, Cambridge. Massachusetts: Centre for
Cognitive Sciences.
Pinker, S. (1983), Pattern perception and the comprehension of graphs.
Massachusetts Institute of Technology, Cambridge. Massachusetts: Department of
Psychology.
Playfair, W. (1801a). The commercial and political atlas. London: J. Walhs.
Playfair, W. (1801b). The statistical breviary: shewing, on a principle entirely new,
the resources of every state and kingdom in Europe; illustrated with stained copper
plate charts, representing the physical powers of each distinct nation with ease arui
perspicuity. London: T.Bensley, Fleet St.
Popper, K. (1976), The logic in social sciences. In The positivist dispute in German
Sociology. New York: Harper.
Posner, G. L., Strike, K. A. Hewson, P. W. & Gertzog, W. A. (1982).
Accommodation of a scientific conception: Toward a theory of concepmal change.
Science Education, 66(2), 211-227.
Postman, N, (1992). The disappearance of childhood. New York: Delacortre,

280
Preece, J. (1985). Interpreting trends in graphs: A study of 14 and 15 year olds.
Doctoral Dissertation. University of Nottingham. (Dissertation absttacts UMI HDH
5405),
Preece, J„ & Janvier, C. (1992). A stiidy of the interpretation ttends in multiple curve
graphs of ecological sittiations. School Science arui Mathematics, 92 (6), 299-306.
Price, R, V. (1991). Computer-aided instruction: A guide for authors. Pacific Grove,
Califomia: Brooks/Cole Pubhshing Company.
Pylyshyn, Z. (1973). What the mind's eye teUs the mind's brain. Psychological
Bulletin, 80, 1-24,
Pylyshyn, Z. (1981). The imagery debate: Analogue media versus tacit knowledge.
Psychological Review, 88, 16-45.
QuiUian, M. R. (1968). Semantic meaning. In M. Minsky (Ed.), Semantic information
processing. Cambridge, M.A.: MIT Press.
Rabinowitz, M., & Mandler, J. M. (1983). Organization and information rettieval.
Joumal of Experimental Psychology: Leaming, memory and cognition, 9, 430-439.
Ramsden, P. (1992). Leaming to teach in higher education. London: Routiedge.
Reder, L. M. (1978). Comprehension and retention of prose: A literature review
(Technical Report No. 108). Champaign, Uhnois: University of Illinois Centte for the
Sttidy of Readmg. (ERIC Document Reproduction Service No. ED 165 114).
Reiff, J. C , & Powell, J. C. (1992) Leaming differences and interactive computer
programs. Paper presented at the Annual Meeting of the Association of Teacher
Educators. Oriando. (ERIC Document Reproduction Service No. MF01/PC02).
Rigney, J. W., & Munro, A. (1977). On cognitive strategies for processing text.
(Technical Report 80). Los Angeles: University of Southem Califomia, Behavioural
Technology Laboratories.
Romiszowski, A. J. (1990), Developing Auto-Instructional Materials: From
programmed texts to CAL and interactive video. London: Kegan Paul.
Rose, C. (1985). Accelerated leaming. Aston Clinton, Aylesbury, Bucks, U.K.:
Accelerated Leaming Systems.
Roth, M. W., & Bowen, M. G. (1994). Mathematization of experience in a Grade 8
open-enquiry environment: An inttoduction to the representational practices of science.
Joumal of Research in Science Teaching, 31(3), 293-318.

281
Roth, Wolff-Michael. (1994), Student views of collaborative concept mapping: An
emancipatory project. Science Education, 78(1), 1-34.
Rumelhart, D. E, (1977), Introduction to the human processing of information. New
York: Wiley.
Rye, J. A. (1995). An exploratory study of the concept map as an interview tool to
facilitate extemalization of conceptual understandings associated with global
atmospheric change by eighth grade physical science students. Unpublished doctoral
dissertation, Pennsylvania State University, State College, Pennsylvania.
Salomon, G. (1983). The differential investment of mental effort in leaming from
different sources. Educational Psychologist, 18(1), 42-50.
Salomon, G., & Perkins, D. N. (1989). Rocky roads to transfer: Rethinking
mechanisms of a neglected phenomenon. Educational Psychologist, 24(2), 113-142.
Salomon, G., Perkins, D. N., & Globerson, T. (1991). Partners in cognition:
Extending human intelligence with intelligent technologies. Educational Researcher,
20(3), 2-9.
Schmeck, R. R. (Ed.). (1988). Leaming strategies and leaming styles. New York:
Plenum Press.
Schmidt, C, F. (1979). Handbook of graphic presentation. New York: John Wiley
and Sons.
Schreiber, D., & Abegg, G, (1991). Scoring student generated concept maps in
introductory college chemistry. Paper presented at the Annual Meeting of the National
Association for Research in Science Teaching. (ERIC Document Reproduction Service
No. MFOl/PCOl).
Sewell, D. F. (1990), New Tool for New Minds: A cognitive perspective on the use
of computers with young children. London: Harvester Wheatsheaf.
Sewell, T. J. (1986). The measure of leaming style: A critique of four assessment
tools. (Research Report). Green Bay: Wisconsin University. Washington, DC. (ERIC
Document Reproduction Service No, ED 267 247).
Shalveson, R. (1974). Methods for examining representations of subject matter
stracture in student's memory. Joumal of Research in Science Teaching, 11, 231-
249.

282
Shalveson, R. (1993), On concept maps as potential "authentic" assessments in
science. Indirect approaches to knowledge representation in high school science.
National Centte for Research on Evaluation, Standards and Testing, Los Angeles,
CA. Washington, DC: Office of Educational Research and Improvement. (ERIC
Document Reproduction Service No. ED 367 691 TM 021 14).
Shuell, T. (1986), Cognitive conceptions of leaming. Review of Educational
Research, 56(4), 411-436.
Simon, H. (1974). How big is a chunk? Science. 183, 482-488.
Sims, R.R. & Sims, S.J. (1995). The importance of learning styles. London: Greenwood Press.
Skinner, B.F. (1958). Teaching machines. Science, 128, 969-977.
Sless, D. (1981). Leaming and visual communication. New York: Wiley.
Smith, F. (1981). Demonsttations, engagement, and sensitivity: A revised approach to
language and leaming. Language Arts.
Snow, R E. (1980). Aptitude processes. In R. E. Snow, P. A. Federico, and W. E.
Montague (Eds.), Aptitude, leaming and instruction (Vol.1). Hillsdale, N.J.:
Lawrence Erlbaum.
Sperry, R. W. (1964). The great cerebral commissure. Scientific American. January,
42-52.
Stanton, N., & Baber, C. (1992). An investigation of styles and strategies in self-
directed leaming, Joumal of Educational Multimedia arui Hypermedia, 1, 147-167,
Summers, M, (1990), New teachers and computers: An investigation of experiences
andfeehngs. Educational Review, 42(3), 261-271.
Swan, M. (1980). The language of graphs: A collection of teaching materials for
interpretation of graphs. University of Nottingham, U.K.: The Shell Centre for
Mathematical Education.
Sweller, J. (1988). Cognitive load during problem solving: Effects on leaming.
Cognitive Science, 12, 257-285.
Sweller, J. (1994). Cognitive load theory, leaming difficulty, and instractional design.
Leaming and Instruction, 4, 295-312.
Sweller, J., & Chandler, P. (1994). Why some material is difficult to leam. Cognition
and Instruction, 12(3), 185-233.

283
Sylwester, R. (1981). Educational imphcations of recent brain research. Science
Digest. November, 64.
Thro, M. P. (1978). Individual differences among college students in cognitive
sttncmre and physics performance. The annual meeting of the American Educational
Research Association, Canada: Toronto.
Time Books, (1994). The Times Atlas of the World: Concise Edition. London:
Harper Collins.
Tiemey, R. J., Kieffer, R., StoweU, L., Desai, L., E., Whalin, K, & Moss, A., G.,
(1992). Computer acquisition: A longittidinal study of the influence of high computer
access on students' thinking, leaming, and interactions. #16 Research Findings -
Unique Student Competencies. Cupertino, Califomia, Apple Computer Inc.
Tobin, K., Tippins, D. J., & Gallard, A. J. (1994). Research on instractional
sttategies for teaching science. In D. L. Gabel (Ed.), Handbook of research on science
teaching and leaming (pp. 45-93). N.Y.: Macmillan.
Toth, M. A. (1980). Figures of thought: The use of diagrams in teaching sociology.
Teaching Sociology, 7, 409-424.
Tripp, S. D., & Roby, W. (1990). Orientation and disorientation in a hypertext
lexicon. JoumalofComputer-BasedInstruction, 17(4), 120-124.
Tufte, E. R, (1983), The visual display of quantitative information. Chelshire,
Connecticut: Graphics Press,
Tulving, E., & Donaldson, W. E. (1984). Organisation of memory. New York:
Academic Press.
Tulving, E. (1972), Episodic and semantic memory. In E, Tulving & W, Donaldson
(Eds.), Organisation of memory. New York: Academic Press.
Tyler, J, G, (1993). The effects of field dependence/independence and computer
expertise on leaming application functions in a graphic user interface. In M. R.
Simonson & K. Abu-Omar (Eds.), 15th Annual Proceedings of Selected Research and
Development Presenters at 1993 National Convention for Educational Communications
arui Technology (pp.533-539). Iowa: Iowa State University College of Education.
Underwood, J. (1988). Language leaming and hypermedia. ADF Bulletin, 19(3), 13-
17.
284
University of WoUongong. (1995). Undergraduate Calendar 1996. WoUongong,
Austtalia: University of WoUongong.
van Reeuwijk, M. (1992). The standards applied: teaching data visualisation. The
Mathematics Teacher, 85(1), 513-518.
von Glaserfeld, E. (1995). Radical constructivism: A way of knowing and leaming.
London: The Falmer Press.
von Glaserfeld, E. (1989). Cognition, constraction of knowledge and teaching.
Synthese,80, 121-140.
Vygotsky, L. (1978). Mind in society: The development of higher psychological
processes. Cambridge: Harvard University Press.
Wandersee, J. H. (1990). Concept mapping and the cartography of cognition. Joumal
of Research in Science Teaching, 27(10), 923-936.
Webb, J. M., & Kramer, A. R. (1990). Maps or analogies? A comparison of
instractional aids. Human Factors, 32(3), 251-256,
Weingrad, P., Hay, K,, Jackson, S., Boyle, R„ Guzdial, M,, & Soloway, E, (1993),
Student composition of multimedia documents. In M. R. Simonson & K. Abu-Omar
(Eds.), 15th Annual Proceedings of Selected Research and Development Presenters at
1993 National Convention for Educational Communications arui Technology (pp.541-
548). Iowa : Iowa State University CoUege of Education.
Weintraub, S. (1967). What research says to the reading teacher. Reading Teacher,
20, 345-349.
West, L. H., & Pines, A. L. (1985). Cognitive structure and conceptual change.
Sydney: Academic Press.
White, R., & Gunstone, R. (1992). Probing understanding. London: The Falmer
Press.
Wheatiey, G. H. (1991). Constractivist perspectives on science and mathematics
leaming. Science Education, 5(1), 9-12.
Williams, M.. D., & Dodge, B. J. (1993). Tracking and analysing leamer-computer
interaction. In M. R. Simonson & K. Abu-Omar (Eds.), 15th Annual Proceedings of
Selected Research and Development Presenters at 1993 National Convention for
Educational Communications and Technology (pp. 1115-1129). Iowa: Iowa State
University College of Education.

285
Wilson, B. G. (1993). Constructivism and instractional design: Some personal
reflections. In M. R. Simonson & K. Abu-Omar (Eds.), 15th Annual Proceedings of
Selected Research and Development Presenters at 1993 National Convention for
Educational Communications and Technology (pp.1131-1149). Iowa : Iowa State
University College of Education.
Wilson, B. (1990). The preparedness of teacher ttainees for computer utilization: The
Australian and British Experiences. Joumal of Education arui Teaching, 16(2), 161-
171.
Winn, B. (1987). Charts, graphs and diagrams in educational materials. In D. M.
Willows & H. A. Houghton (Eds.), The Psychology of Illustration Volume 1: Basic
research: (pp. 152-198). New York : Springer-Verlag.
Witttock, M. C. (1974). Leaming as a generative process. Educational Psychologist,
11(2), 87-95.
Witttock, M. C, (1980). The brain and psychology. New York: Academic Press.
Wittrock, M. C. (1990). Generative processes of comprehension. Educational
Psychologist, 24(4), 345-374.
Woolfolk, A. E. (1990). Educational Psychology (Fourth Edition). Englewood Cliffs,
New Jersey: Prentice Hall.
Yates, B.C., & Moursund, D. (1989). The computer and problem solving: How
theory can support classroom practice. Computing Teacher, 16(4), 12-16.

286
Appendix 1
Appendix 2
Appendix 3
Appendix 4
Appendix 5
Appendix 6
Appendix 7
Appendix 8
Appendix 9
Appendix 10
Appendix 11
Appendix 12
Appendix 13
Appendices Plate displaying graphs by WUliam Playfak (1801) 287
Multiple choice test on Graphs and Tables 288
SkUls grid for multiple choice test on Graphs and Tables 314
Attitude to computers questionnaire 316
Leaming style inventory 318
Joumal questions used with the prototype 319
Interview questions used with preservice teachers who used 320 the final version of the concept map
Interview questions used with preservice teachers who used 320
the analysis tools with the information about rainforest
destraction
Sample interview ttanscripts 321
Preservice teacher concept maps revised away from the 327
computer
Concept mapping software
Web sites for concept mapping software
Permission documents and other relevant information
329
330
331
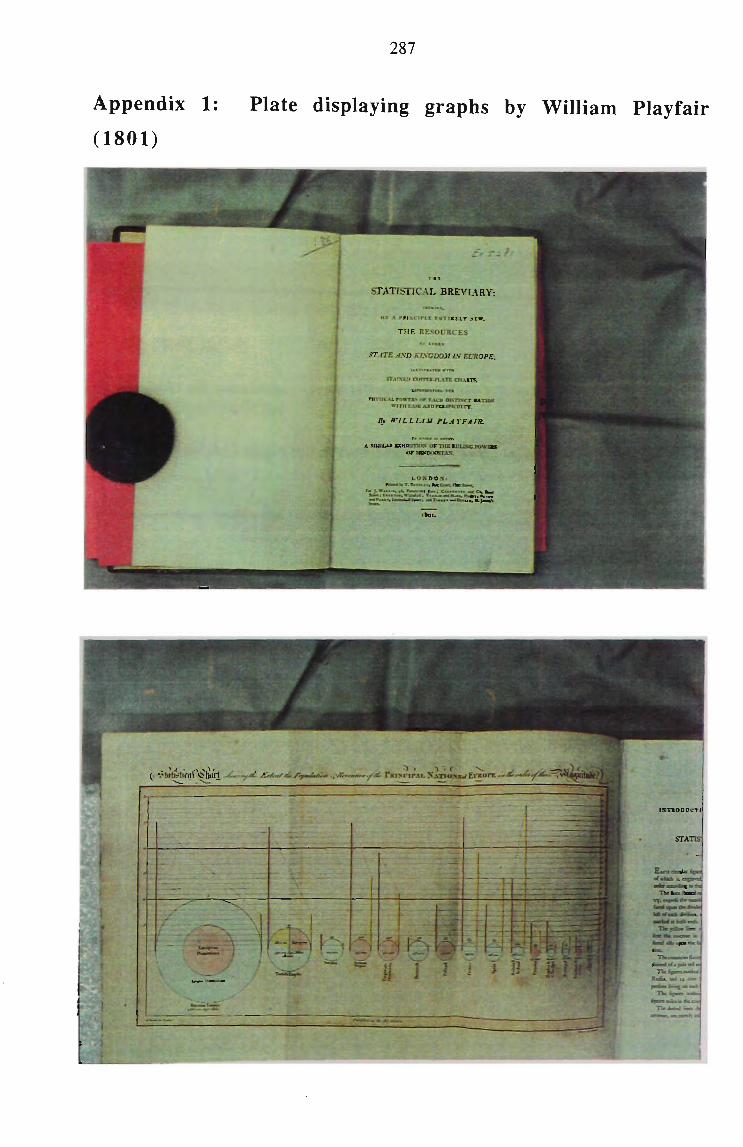
287
Appendix 1: Plate displaying graphs by William Playfair
(1801)
TUB RESOL'ItCF.S
.rr.iTE .^xl> KISGIXJMIS FZ'ROPE.
/IF triLLl.lV PL.iYF.4IR.
^-lISO: • 1 • -' 'C"! T
^ n I MM it I t
I S T a O D U C T I
E L C H tStnlM %a^
TlcnJIov lioEi

288
Appendix 2: Multiple choice test on Graphs and Tables Courtesy of The Educational Testing Centte, University of NSW.
Test of skills in interpreting graphs and tables
INSTRUCTIONS
Answer ail questions. Use a HB pencil or black pen to mark your answers on the sheet provided.
When finished hand in the answer sheet plus the questions.
*PLEASE SEE PRINT COPY FOR PAGES 289-313*

314
Appendix 3: Skills grid for multiple choice test on Graphs and
Tables
Question Answer
1
2
3
4
5
6
7
8
9
10
11
12
13
14
15
16
17
18
19
C
D
B
C
C
D
B
C
D
D
B
A
D
B
D
A
C
C
A
20
21
22
23
24
25
26
27
C
C
A
B
A
C
A
Skills tested
comparing two graphs
reading a table
reading labels on axes
reading a table plus concept of a complete chemical reaction
interpreting scales and reading axes
read values and subtract and add
compare two line graphs and read the axes
read the axes, understanding concepts of speed and acceleration
read and compare values on a bar graph
as above
read a table
read a table
read a diagram
read a table
read a series of graphs and relate to a table
read a table, concept of hardness
read and compare three graphs
read a table and recognise the graph from 4 altematives
find the correct graph and data point from a set of graphs drawn on the same axes
compare picture graphs with scales and then recognise the correct graphical representation of this data
read the graphs, identify data points and compare values
correctly related two different graphs
read a complex table
read a complex table
read a table then recognise the graph that represents this data
interpret a data display
interpret a pie graph

28
29
30
31
32
33
34
35
36
37
38
39
40
C
C
D
D
D
C
B
A
C
A
A
A
B
315
compare histograms
read and relate data from a pie and a line graph
read and relate data from two line graphs drawn on the same axes
plot data on a graph
compare data from two bar graphs
read a seismogram and read the axes on a graph displaying three variables
read a bar chart and compare values
read a bar chart and relate values to a data table
match diagrams of raw data with histograms
read a table of data and apply the definition of specific heat to solve the problem
apply ratio
plot a data point on a line graph and read the axes
compare three line graphs in order to correctly identify a relationship between two variables

gree
0
0
o a
0
a
Disagree
a a
316
Appendix 4: Attitude to computers questionnaire Student name and number:
Please indicate your response to the questions by placing a tick / in the boxes provided.
Computer Anxiety Strongly Agree Disagree S^trongly
1. I am not scared to use computers.
2 . Working with a computer would make me very nervous.
3 . I do not feel threatened when others talk about O O O D computers.
4 . I feel aggressive and hostile toward computers.
5 .* It wouldn't bother me at all to take computer courses.
6. Computers make me feel uncomfortable.
7 . I would feel at ease in a computer class.
8. I get a sinking feeling when I think of trying to use a computer.
9 . I would feel comfortable working with a computer.
10. Computers make me feel uneasy and confused.
Computer Confidence
1. I'm no good with computers.
2 . Generally, I would feel OK. about trying a new problem on the computer.
3 . I don't think I would take an advanced subject in G D computers.
4 . I am sure I could do work with computers.
5 . I'm not the sort of person to do well with computers.
6. I am sure I could leam a computer programming language like BASIC.
7 . I think using a computer would be very hard for me.
8 .* I could get good grades in university computer courses.
9 . * I do not think I could handle a university computer course.
10. I have a lot of self-confidence when it comes to using computers.
* reworded questions
o o
o o a
o a
a D
D
D
D
O
a
o a
o n
a D
B
a a
a a
a a
a a
a o o
a a
B
B
B
B
B
B
B
B
B
B
B
B
B
B
B
B
B
B
B
B
B
B
B
B
B
B
B
B
B
B

Agree
B
B
B
B
B
B
Disag
o B
317
ATTITUDE T O COMPUTERS
Computer Liking Strongly Agree Disagree Strongly
1. I would like working with computers
2 . The challenge of solving problems with computers does not appeal to me.
3 . I think working with computers would be G O C3 B enjoyable and stimulating.
4 . Figuring out computer problems appeals to me. O O CJ B
5 . When there is a problem with a computer run that B B B B I can't immediately solve, I would stick with it until I have the answer.
6 . I don't understand how some people can spend so O G O G much time working with computers and seem to enjoy it.
7 . Once I start to work with the computer, I would find it hard to stop.
8 . I will do as little work with computers as possible.
9 . If a problem is left unsolved in a computer class, I would continue to think about it afterward.
1 0 . I do not enjoy talking with others about computers.
G
O
G
G
G
G
G
G
G
G
O
o
G
O
G
G

318
Appendix 5: Learning style inventory This inventory is designed to assess your method of leaming. As you take the inventory, give a high rank to those words which best characterise the way you leam and a low rank to the words which are least characteristic of your leaming style. You may find it hard to choose the words that best describe your leaming style because there a no right or wrong answers. Different characteristics described in the inventory are equally good. The aim of the inventory is to describe how you leam, not to evaluate your leaming ability.
Instructions.
There are nine sets of four words listed below. Rank order each set of four words assigning a 4 to the word which best characterises your leaming style, a 3 to the word which next best characterises your leaming style, a 2 to the next most characteristic word, and a 1 to the word which is least characteristic of you as leamer. Be sure to assign a different rank number to each of the four words in each set. Do not make ties.
1.
2.
3.
4.
5.
6.
7.
8.
9.
. discriminating
. receptive
. feeling
. accepting
. intuitive
. abstract
. present-oriented
. experience
intense
For scoring only
CE RO
. tentative
. relevant
. watching
. risk-taker
. productive
. observing
. reflecting
. observation
reserved
AC.
. involved
. analytical
. thinking
. evaluative
. logical
. concrete
. fiiture-oriented
_conceptualization
rational
AE
. practical
_ impartial
- doing
_ aware
_ questioning
_ active
_ pragmatic
.experimentation
_ responsible
234578 136789 234589 136789
Scoring the Leaming Style Inventory
To obtain your score on the four dimensions measured by the inventory. Concrete Experience (CE), Reflective Observation (RO), Abstract Conceptualisation (AO), and Active Experimentation (AE), sum each column including only those words whose item number appears under the place for the total score. For example, for CE, total the ranks you have given for the words 2, 3, 4, 5, 7, and 8 in the first column. For RO, total the ranks for words 1, 3, 6, 7, 8, and 9 in the second colunm and so on for AC and AE. Ignore the non scored words in each colunm. Transfer the four raw scores to the Leaming Style Profile below by placing a mark next to the number you scored on each of the four dimensions. Connect these four marks with straight lines ((Kolb, Rubin, and Mclntyre, 1974).

319
Appendix 6: Journal questions used with the prototype Student Names:
1. Comment on the instmction provided during the fu:st tutorial session. Specifically
• Did the instmction help you to understand how to use the software?
• What aspects of the process helped you?
a. the demonstration by the instmctor
b. the practice session in the computer lab
c. working with a partner
d. all of these
e. others - please specify below
• Were there any aspects of the instmction that were confusing?
2. Describe any problems you experienced when using the software.
3. Please make any suggestions about how the software could be improved
4. Are there any other comments that you want to make.
Part 2: Specific questions about the support features:
1. Did you use the balloon to assist you to read the axes of the graphs? Yes/ No (if your response is Yes go to 2, if no go to 3 below)
2. Describe the features of the balloon help that you found useful.
3. Did you use the sorting tool to help you to read the table? Yes/ No
4. Would you prefer to save your maps to a disc? Yes/ No
5. Did you find the concept mapping tool helped you to summarise the graphs? Yes/
No
6. Were the on-screen buttons easy to understand? Yes/ No
8. Please add any other relevant comments that you want to make.

320
Appendix 7: Interview questions used with preservice teachers who used the final version of the concept map 1. Comment on the instmction provided during the fn-st tutorial session. Specifically
• Did the instmction help you to understand how to use the software?
a. the demonstration by the instractor
b. the practice session in the computer lab
c. others - please specify below
2. Were there any aspects of the instmction that were confusing?
3. Describe any problems you experienced when using the software.
4. Do you have any suggestions about how the software could be improved.
5. Are there any other comments that you want to make?
Appendix 8: Interview questions used with preservice teachers who used the analysis tools with the information about rainforest destruction. These questions were asked after preservice teachers had used the software for the second time. Not all questions were needed as some of the questions were already discussed when preservice teachers worked through the software.
Comment on the instmction provided during the first tutorial session.
Follow up questions if needed.
1. Conmient on the instmction provided during the first tutorial session. Specifically
a. the demonstration by the instmctor
b. the practice session in the computer lab
c. others - please specify below
2. Were there any aspects of the instmction that were confusing?
3. Describe any problems you experienced when using the software.
4. Do you have any suggestions about how the software could be improved?
Specific questions about the support features:
1. Did you use the balloon help to assist you to read the axes of the graphs? Please explain.
2. Describe any features of the balloon help that you foimd useftil.
3 Did you use the sorting tool to help you to read the table? Please explain why you did (didn't) use tiie tool.
4. Did you find the concept mapping tool helped you to summarise the graphs? Please explain why you did (didn't) use the tool.
5 Were the on-screen buttons easy to understand? Please explain your response.
6 Are there any other comments that you want to make?

321
Appendix 9: Sample interview transcripts *T1/Interview 8: Sally 17.4.96
Qi
First of all I started off with an idea and I created a box with the idea in it. Then I had a few more ideas that were related to that so I just created a lot of concepts on tiie page, not necessarily in any particular order. Then I moved them around so that tiiey were in some sort of sequence. By moving them around I think I wanted to change the words so I erased those concepts and put in new ones and put in other ones that were better related to the topic. Then I kind of put links in, but because I kept moving the concept around and links don't move, I kept erasing the links so at the moment my concept map doesn't have hnks in it. It follows a sequence so it looks more like a flow chart without the arrows.
Q2
Well I'd like to put in more notes about each of the things and I think just refine it a little bit more. Because one side, my topic is comets and meteors and at the moment I've got a huge amount of ideas and concepts about comets but I've got hardly anything about meteors so I'd like to develop that side maybe a littie bit more and also improve the links. Work out which way the links go and find what are actually meant by some of the concepts because some of them could go either way so I want to make sure that they're either specifically referring to one thing, to one other concept or whether I want them to actually relate to both. Some things like human exploration of comets. Ok, that could refer to Halley's comet or it could refer to comets in general. So I've got to decide whether I want to concentrate maybe more on Halley's comet and because there's a lot more information about it and we seem to have been fascinated about it. It keeps coming back, so we can do more work on i t , or whether I want to talk about other comets as well as a twin topic or whether I want to make it a smaller sort of side issue. So I think I've got to get all those ideas to fit in a concept map.
So, because the concepts keep expanding and it's going out like a tree, I keep changing where my main concept is from the top to the side and back again, so that, yeh, because I just want to have it so that it looks, so that I can follow it with my eyes so that I can see the sequence that I'm talking about. Cause I want what's on the screen to look like what's in my brain. So that's what I'm kind of planning to do.
Q-And have you spent a lot of time thinking about it outside of the lab?
I've spent a little bit of time especially I went home and I got to look at my books on my bookshelf so I found a really good space atias and a few other things and I work at the science centre where they've been playing a comet video, a video about the history of Halley's comet so I've been sort of paying attention to that so I'm more conscious of things and in the news, when the new comet's been around. I've been much more conscious of things about comets at the moment and I think sort of specifically looking for information on comets, although not so much on meteors because they're a bit harder to be get information (pauses) I think.
Q3
Ok well the most fmstrating thing that I found was being unable to move the links. Because I've moved the concepts around so much well as I said before I've given up putting the links in just at the moment because they get stuck there and sometimes they wont erase themselves eitiier. Yesterday I had a few problems. I forgot to clear the screen before I put my concept map up so I got the other person's concept map underneath mine and then some of the links that she'd had wouldn't erase themselves and I kept clicking erase and it wouldn't work so I ended up having, fortunately I hadn't changed too much of my concept map before I realised that suddenly I had animals and their adaptations under comet and tiiinking surely I didn't put animals and insects here. So I ended up clearing the screen just to get rid of these annoying few links that wouldn't erase, so I

322
think that's something just the links that don't move or it's probably just, because you can't do everything in a computer program .
Q-The size?
No, the size of the text is OK, although maybe a few words, not so close to the computer screen you'd have a few problems. It's a fairiy font because of being a small page. Yeh, with the text, it's a bit hard to sort of, you type something and I've discovered that you can cut and paste the text within the program but once because I tiiought, k, I've written tills note and I'll cut it and copy it and put it in tiie memory and tiien I'll clear the screen to get rid of tiiese aimoying hnks and then I'll put it all back, load the whole tiling again and paste it in and it didn't work. It only cuts and pastes while you're in that application that is open at the time. But that's ok.
Q-Was the concept mapping tool easy to use?
Yeh, I think I've had a lot of, quite a lot of experience with computers anyway and I'd like think that I'm quite computer Uterate so I found it very simple to operate and I think, I saw, I noticed that some other people are having problems. They weren't putting their concept map on the whole page because the menu was there whereas I was just moving the menu to where ever it suited me often so that I could fit my ideas on. In fact yesterday I spent part of my time telling the girls on either side of me how to do things with the concept mapping tool. I found it very simple to use and I didn't think it was a problem. I thought it was very basic. Like they seem to be like a lot of people who are scared of computers and even if it is something simple they want to be reassured that they're doing it right because they're scared that it's a big technological thing and it's going to jump up and bite them.
Well, having used a computer almost continuously for the three years of being at Uni. I have great difficulty with pen and paper now. I think sometimes it's fmstrating because you just want to get things done instantly and it takes a bit of fiddling with the computer but it takes a lot more fiddling with pen and paper because if you draw a concept in the wrong place so you draw, you write words in the concept. If you want to change the words, then you actually have to cross it out or start again or use another piece of paper and you end up with lines going here, there and everywhere and scribble and its a bit of a mess. But sometimes can also have the notes. So if you have notes under every concept then the notes could go halfway down the page and then the next concept doesn't fit unless you close the note box.
It's a very neat way of getting the notes behind the concepts. I really liked that idea so that you could have the information about it and the thing of being double lines when it's got a note behind it because then I can say OK, that's the concept that I've been working on, OK, here's another concept which I haven't done anything on yet which I kind of forgot about. Whereas if you writing with pen and paper and you've got the notes on a separate sheet and you've got the concepts on another one it may get, it's not so easy, it's not so visually clear, straight off.
Q-Any otiier comments?
Yeh, actually it's a good tool and I think it's worthwhile. I think concept mapping's a great idea because it just gets you, it forces you to put the ideas from your head onto paper or onto a computer screen and I remember doing a lot of it m high school science, the beginning of every topic the teacher would make us write a concept map and I tiiink that's a great tool and I hope you can develop it so tiiat it saves better.
Tape 2/Interview 12 Leanne 18.4.96
Ql

323
Right, well I basically sort of just dived in because I had my topic sort of in my mind and I hadn t done anything on paper whatsoever. I walked in there basically with an idea in my head and went to work and sort of exploded this concept map about my topic of comniunication. It ended up very busy and when I look at it now it was very much me organising my thoughts about communication ratiier than being sometiiing tiiat was going to end up being the final product so I used it as a tool that way. What I produced, the first map that I've printed out, is nothing like what my actual unit's going to be because it was me organising my ideas and experimenting with the tool.
Q-Can you tell me how you actually used the tool? Did you put all the concepts on first ?
I put all the concepts on first but still I knew where they were going to link if you know what I mean. Like, my thoughts went in a sort of lineal progression tike from one concept to another and what built off that and then I'd go to another concept and build off that and another concept and build off that.
Q-Did you have any difficulties in using the tool?
No, very simple to use I thought and I'm not computer wizzy but I found it very user friendly in that respect. I didn't have any problem whatsoever in using it.
Q-Look at your second map that you'd changed: tell me how you have changed your map.
Well the actual stmcture of the map. I've gone from having my main concept at the top and working down to having my main concept at the side and sort of having a top half and a bottom half and I found I could organise my concepts better by changing the overall format. I've also changed the names of some of the concepts to what I consider to be more related to the activities and the content when I've tried to explain them. Some of them were a bit far too abstiact in linking back, so I sort of like I started off with nonverbal and visual communication and I just ended up with visual messages. What I meant by it hasn't changed a great deal but how I've tried to describe it so it's sort of changed in that respect and I've gotten rid of some of the concepts that were there in the beginning. They were more me organising my thoughts than things that I actually needed that I could actually tie to activities and leaming activities in the classroom...so I sort of got rid of some of those that were my sort of thinking space really rather than what I was going to do in the classroom.
Q3
I haven't ever asked you about but just the way that the actual notes print out, there doesn't seem to be any sort of specific order in that or is there or I haven't discovered it yet? Or is it in the order that the links were drawn or whatever? I haven't actually analysed it but I, looking at it quickly I can sort of see now.
Q-So you wanted it to actually print out the concepts and notes in the order you created them?
Right, now for example today I just jumped aU over the place. To me it would be handier to know which order, or to be able to give them an order that they print out.
Q- When you save your map it actually saves a copy of your map and notes, but it saves the notes separately as a text file. You then can import this into a word processor and just rearrange in the order you want.
So then you can go and pretty it all up and do all tilings to it can you?
Q-Yes. How did you change your map?
Well, that I actually did do that myself. I attempted in the first go with the concept mapping tool, to write some notes but as I said I didn't have any resources with me the first time either. What I've done is still use some of what I created first because it still fits

324
in with the topic. It has been modified in the later ones, do you know what I mean? Having tiie notes there has helped me because I knew what I was tiying to do at tiiat stage My initial idea has changed a bit but I have still kept some of it because it was OK to start with.
Q4
No, because I used pen and paper to try and prepare to come in and because I was happy to redesign my concept map. I started from scratch today because it was just too different, the whole layout was just too different, but not all of the concept names were all different. I just felt I was better off to start again. So I did it on pen and paper but what I found was I had to have a piece of paper for this note and then some piece of paper for link notes and pieces of paper for this. If you're acmally doing it when you're at the computer you haven't got all these sort of things. When I was just inputing it onto the concept map because I worked on, I sort of was still rifting through sheets of paper here and there. The tool keeps it nice and neat and you know where everything is and you can go from one to the other and check back and that and it's very simple. If you know what I mean rather than as, it stays organised for you.
Q-Would you have children using this apphcation?
Yeh, I think so um, particularly from, from the, looking at it as a technology that is user friendly. I'm sure there's a lot of kids that can manipulate a mouse and do all those sort of things far better than I can and feel more comfortable with it so for them. I think some kids, you know, that need to develop those skills. Basically there is not a lot of difficult fine motor skills needed so they definitely would be physically capable of using the tool. It gives them a way of recording their thoughts and if they're anything like me you can capture all those thoughts, before you forget them. Like if you don't, there's no way for you to capture them, once you can lose them. And so this is one way of recording them particularly if you're introducing like a big topic and want to get their initial responses to it. Then maybe look at where their interest lie or where there's holes or where there's misconceptions. A lot of the time particularly when you're looking at scientific concepts, they might have some really way off ideas on how things fit in together and you can identify those so that then you can address in your teaching. So it might be linked up particularly if you're linking things they might have> I can't think of one off the top of my head but I know talking to kids and that sometimes they've got some strange ideas about how things work and then how they're related to each other. So you could identify, you know it would help you in identifying a problems like that so you could teach towards.
Q-Finally is there anything else you'd like to add?
No, I think its been a good experience for me and it's, it's certainly an effective tool for using to plan a unit because it makes you identify all the concepts that are involved in that unit, it makes you think of how you can teach them, what activities, you know the, what you've asked us to do within the map has made sure that we do that and in actual fact it makes you plan a whole unit.
I'll be very honest, I haven't actually started writing up any of the unit part of it yet but it's not going to be difficult because I've done it all, if you know what I mean. In order to get this concept map working right, you have to go tiirough all those things, what are the outcomes on after, which skills, which processes does this activity address, am I addressing designing and makmg using technology and um, investigation? Am I doing all the things that the syllabus, do you know what I mean, when I look at what concepts, you say you identify your concepts then you look at how you're going to teach them but then you also got to look at whether the activities that you planned are achievmg what the broad syllabus sort of outcomes are as well. So in that respect it's just a shame that I don't think you'd have time to do it with everything you wanted to teach but I think I'll have one really good unit.

325
T2/Interview 5 Helen 28.5.96
Q-Helen, when you look at the text, you'll notice there's some words that are red that allow you to go to a glossary. Do you think it's valuable embedded in text that sort of material?
Yeh, I do because then rather than just not knowing and going on not knowing or not bothering to get a dictionary and find out exactly what it means at the point of need but you'd need somewhere to explain that you can click on to those words but I think it's a great idea because it's hitting you right when you need it. Go to the understanding straight away.
Q-Originally in the fn-st one, version of tiiis I actiially had a littie picture tiiat went with it.
A-With the description?
Q-Yes, it was only memory problems that stopped me this time. Think that, is it any value or helpful?
Yeh, a picture illustration always assists with the text I think so it would only add to it, wouldn't take it away.
Q-You might remember this table from before. If you move the cursor to a heading, click on it and you can see now it's sorted from lowest to highest. Do you think that this feature helps you?
Definitely because it stops you from having to do it in your head if the need be. Also it tends to have the figures yourself.
Q-Yes, if you have a look at the annual loss table and click on the heading.
The years to end, these get bigger and they get smaller.
Q-Let's look at graph 2.
-It's scary.
Q-I agree with you on that. Let's have a look at graph one. You'll notice that balloons with information appear. What's your reaction to this feature?
A-I think it's great because it gives you the other side of the argument. You see you've got ten years to go in some countries. Also you can see where the countries are. It helps you to put it in perspective or you know in time and space.
Q-Which is the most valuable the text or the map?
Um, for me, you need both.
Q-Do you know where the countries are?
No, I don't but... well probably the countiies would be more helpful for me cause I don' know where they are and I do understand this.
Q-Lets have a look a graph two.
You can that graph has tiie same features as before. Are they still equally important?
A-I think they're botii equally important.
Q-Let's go to the questions now where it says questions. Think back to when you were actually answering the question, did you rely just on the text for your answers or did you use tables or graphs?
326
I used the text because I'm a text, I'm a word person, I'm a reader but I backed it up. I always back it up to I check because I don't tiiist myself. So knowing there was a graph I'd read it come to an answer and then check with tiie graph.
Q-So but your primary source was a text and the secondary was just a backing up of the other.
Yeh, even though I understand it I could've quickly looked at a graph and probably got the answer. That's, because I'm just text orientated.
Q-Where did you get the information from when you were creating the concept map?
First, what was in my head and then I went back.
Q-Where did you go back to?
Firstiy the text because like I said before I'm a text person but then knowing the graphs were there I had a look at the information.
Q- Do you think that this sort of approach is worth pursuing with children down the track?
Definitely cause it will help them to understand the graphs, not be threatened by a lot of text or a graph - they're all related. And I like the idea of doing a concept map at the end cause you can see what you've understood. I've latched onto the concept maps for pre and post instmction I'm leaming.
Q-Any other comments you want to make?
No, I think it's useful and very easy to use. Like I've mentioned before, I have problems with actually using computers because I don't often use them unless easy something is easy to use. It's not threatening from that perspective.
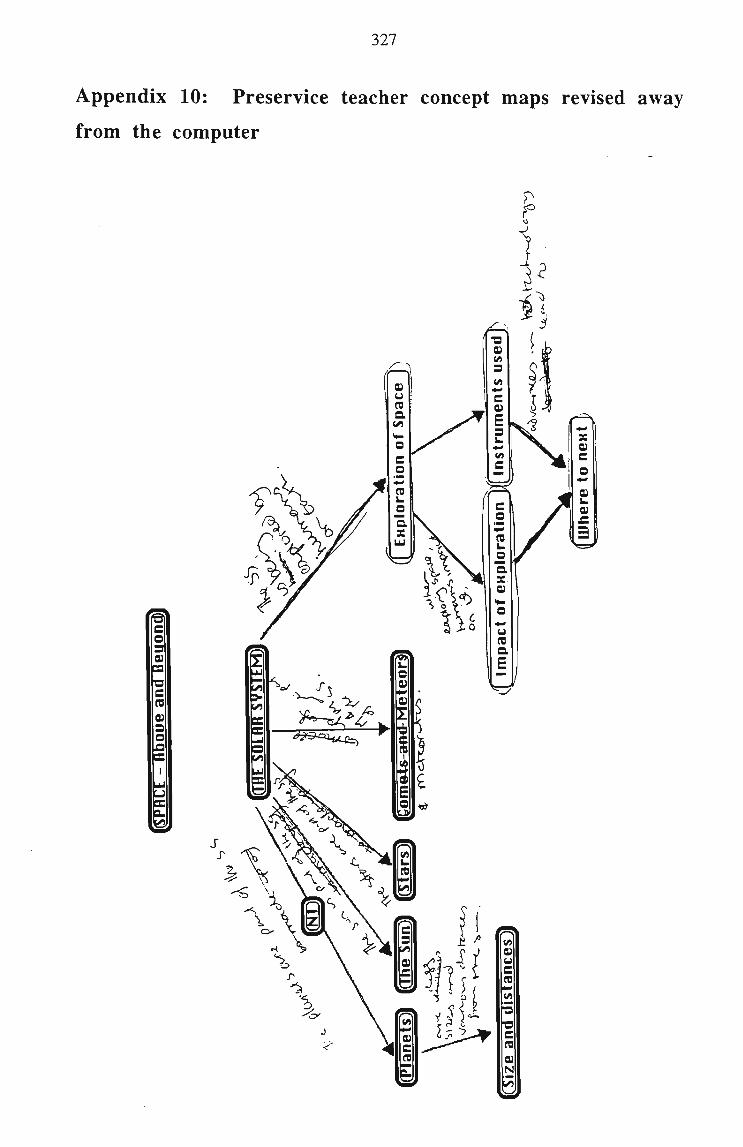
327
Appendix 10: Preservice teacher concept maps revised away
from the computer
c
•a c re u a o
1

328

329
Appendix 11: Concept mapping software
The following concept mapping tools were found to be available at 26.3.96, but other
public domain tools and commercial tools may also exist and Appendix 12 refers to
relevant web sites.
Software
Inspiration
TkstNet/TextVision
CMap
LifeMap
KennisGraaf
Stracture Activator
LeamingTool
Graphics COPE
CourseWorks
SemNet
MindMapper
MindMan
Mind Mapping Tool
VisiMap/InfoMap
Flowchart tools eg MacFlow
General drawing tools
Version
4.0
1.40
2.01
2.8
2.0
1.00
1.1
2.07
0.7
1.0
1.0
2.0b
1.4021
3.7
Platform
Mac/Windows
Mac/Windows
Mac
Mac
Windows
Windows
Mac
Windows
Windows
Mac
Windows
Windows
Mac
Windows
Mac
Mac and PC

330
Appendix 12: Web sites for concept mapping software Computer tools for concept or mind mapping can be found at:
Inspiration Software, http://www.inspiration.com/
CMap 2.0 for Macintosh, gopher://oldal.mannlib.comell.edu:9570/40/misc/CMap_2.0.hqx
Banxia Software (maker of Graphics COPE),http://www.scotnet.co.uk:80/banxia/
SemNet Research Group, http://apple.sdsu.coiii/logan/SemNet.htiiil
MindMan by Micheal Jetter,http://niindman.com/english/mindman.html
CoCo Systems maker of VisiMap and InfoMap (Lite),http://www.coco.co.uk/
Activity Map by Time/system Int, http://www.timesystem.dk/software/index.html
EGLE Magic maker of [email protected]://ftp.std.coni/ftp/vendors/emagic/mindmap/ mindmap.zip

331
Appendix 13: Permission documents and other relevant
information
I need 10 to 15 volunteers to interview on three occasions. The time for each interview will be approximately 30 minutes. The weeks that I need to conduct the interviews are: this week, the first week after the session break and the second week after the session break. All interviews will be conducted in my office.
I can be available at the following times. Monday from 1.30 to 5.00 PM. Tuesday 3.00 PM to 4.00 PM. Wednesday 9.00 to 11.00 AM, and 1.30 to 5.00 PM. Thursday from 12.30 to 5.00 PM. If you can spare the time please nominate a time that would apply for each interview.
Thanks Brian
Name time

332
General Survey
Student Number: ^
1. Place a tick / in the boxes provided to indicate your gender and age
Gender Q female • male
Age a 18-25 0 26-30 0 31-35 0 36-40 0 41-45 O over 45
2. Place a tick / in the boxes provided to indicate the examination subjects you completed in senior high school:
• I completed English (Higher School Certificate or its equivalent)
• I completed Mathematics (Higher School Certificate or its equivalent)
O I completed Science (Higher School Certificate or its equivalent)
O I completed Computer Studies (Higher School Certificate or its equivalent)
3. Have you passed a university or TAPE or privately taught subject about computers? (eg information technology, programming, word processing)
Place a tick / in the appropriate box. O Yes O N o
If you answered, "Yes" please specify:'^
4. Do you have access to a computer where you hve?
Place a tick / in the appropriate box. O Yes O N o
5. Place a tick / in the appropriate boxes to indicate your use of computers
• I use a computer where I live
• I use a computer at work
• I use a computer at university during the teaching session
Q I do not use a computer for any purposes
6. Place a tick / in the appropriate box to indicate the approximate amount of time that you spend using computers
• I use a computer each day
• I use a computer each week
Q I use a computer a few times a month
• I do not use a computer for any purposes
Continued on next page

333
7. Place a tick / in the appropriate boxes to indicate how you use computers
Q I use a computer for word processing
O I use a computer for spreadsheet work
O I use a computer for database work
O I use a computer to play games
QI use a computer for other purposes (please specify)
O I do not use a computer for any purposes
Response sheet to test
Question
1 A B
2 A B
S A B
4 A B
5 A B
6 A B
7 A B
8 A B
9 A B
10 A B
11 A B
12 A B
13 A B
14 A B
15 A B
16 A B
17 A B
18 A B
19 A B
20 A B
on
C
c c c c c c c c c c c c c c c c c c c
Interpreting Graphs and Tables
D
D
D
D
D
D
D
D
D
D
D
D
D
D
D
D
D
D
D
D
Question
21 A B
22 A B
23 A B
24 A B
25 A B
26 A B
27 A B
28 A B
29 A B
30 A B
31 A B
32 A B
33 A B
34 A B
35 A B
36 A B
37 A B
38 A B
39 A B
40 A B
C
C
C
C
c c c c c c c c c c c c c c c c
D
D
D
D
D
D
D
D
D
D
D
D
D
D
D
D
D
D
D
D
Thank you for completing this questionnaire.
Brian Ferry

334
UNIVERSITY^ YITOLLONGONG FACULTY OF EDUCATION
Associate Professor Jim Tognolini Educational Testing Centre University of NSW 13.2.95
Dear Sir,
I am a lecturer in Science Education and a PhD student at this institute. My research centres around the development of a HyperCard-based system that assists students to read and interpret graphs and tables. I have spoken to John Faulkner by phone about the possibility of using some of the test items from the Australian Schools Science Competition to rate the ability of subjects to read and interpret graphs and tables. I would dso be interested in using the statistical data that relates to the test items.
He suggested that I approach you for permission to use these items, and subject to your approval, I would come to the unit and photocopy the relevant data.
Naturally, I would forward you a copy of my completed thesis and acknowledge the assistance of the Educational Testing Centre.
Yours sincerely.
Brian Ferry
Lecturer in Education
ftrian Ferrv faculty ot fcducation. University of WoUongong, Northfaelds Ave, WoUongong 2522 p{^042 21^571^ax: 042 213892/ E-mail: b.Verry®uow*edu^uA/LinkAUST0490
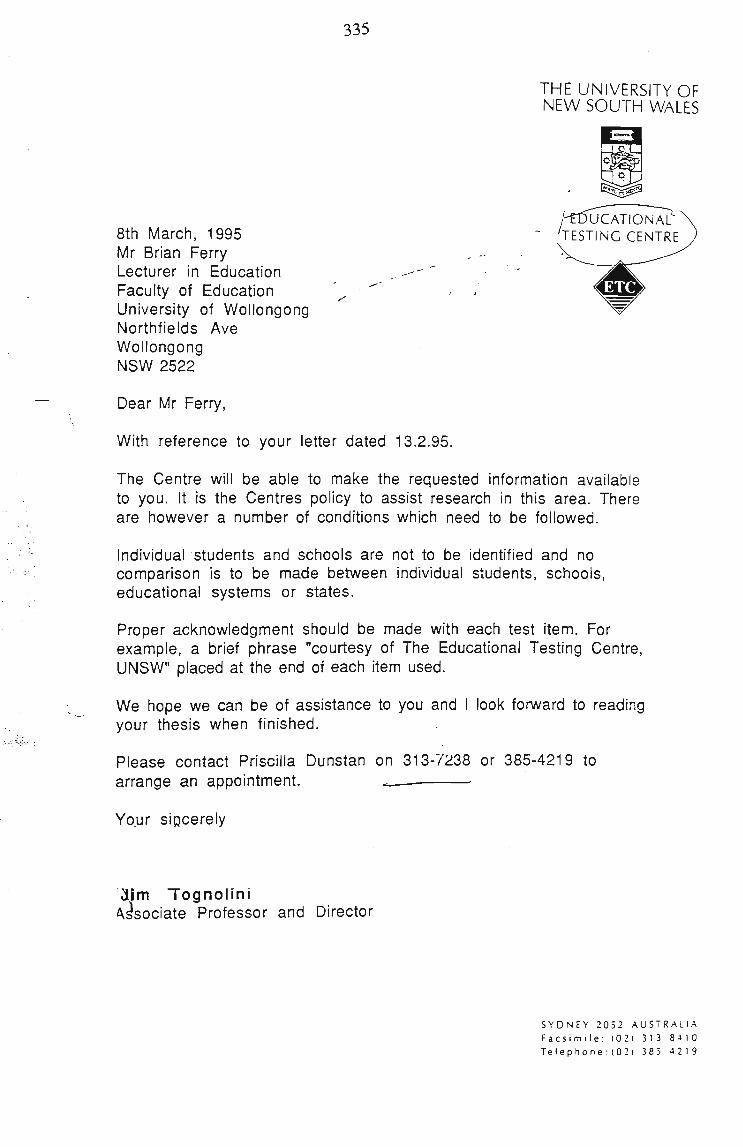
335
THE UNIVERSITY OF NEW SOUTH WALES
/-•515UCATI0NAL" 8th March, 1995 - 'TESTING CENTRE Mr Brian Ferry Lecturer in Education Faculty of Education University of WoUongong Northfields Ave WoUongong NSW 2522
Dear Mr Ferry,
With reference to your letter dated 13.2.95.
The Centre will be able to make the requested information available to you. It is the Centres policy to assist research in this area. There are however a number of conditions which need to be followed.
Individual students and schools are not to be identified and no comparison is to be made between individual students, schools, educational systems or states.
Proper acknowledgment should be made with each test item. For example, a brief phrase "courtesy of The Educational Testing Centre, UNSW" placed at the end of each item used.
We hope we can be of assistance to you and I look fooA/ard to reading your thesis when finished.
Please contact Prisciila Dunstan on 313-7238 or 385-4219 to arrange an appointment. ^_
Your sincerely
^xt\ Tognolini Associate Professor and Director
S Y D N E Y 2 0 5 2 A U S T R A L I A F a c s i m i l e : (02 ) 313 8 4 1 0 T e l e p h o n e : ( 0 2 ) 385 42 19

mm 336
U N I V E R S I T Y Kjr WOLLONGONG Office of the Vice-Principal (Administration)
Academic & Student Services Branch
APPROVED In reply please quote: DC:KM HE95/06
Further Information: Karen McRae (Ext 4457)
15 February 1995
Mr B. Ferry-Faculty of Education University of WoUongong
Dear Mr Ferrv,
I am pleased to advise that the follov^ing Human Research Ethics application has been approved:
Ethics Number:
Project Title:
Name of Researchers:
Approval Date:
Duration of Clearance:
PiE 95/06
Electronic Performance Support Prototype
Mr B. Ferry
9 February 1995
8 February 1996
This certificate relates to the research protocol submitted in your application of 3 February 1995. It will be necessary to inform the Committee of any changes to the research protocol and seek clearance in such an event.
Please note that experiments of long duration must be reviewed annually by the Committee and it will be necessary for you to apply for renewal of this application if experimentation is to continue beyond one year.
Chairperson Human Research Ethics Committee cc. Dean, Faculty of Education
Address: Northfields Avenue WoUongong 2522 Australia S^e C042^ 21 353^?"FtiC5nTriic—SMd^nt^Services: (042) 21 4322. Research/Secretariat: (042) 21 4338

337
Brian Trial 6,3456The card Introduction was open for 12 seconds The card Concept Map was open for 141 seconds The card Questions was open for 10 seconds The card Glossary was open for 3 seconds The card Concept Map was open for 4 seconds The card Graph 3 was open for 16 seconds The card Concept Map was open for 9 seconds The card Glossary was open for 5 seconds The card Graph 2 was open for 3 seconds The card Graph 1 was open for 6 seconds The button 1 was then pressed 5 seconds after this card was opened The button 1 was then pressed 5 seconds after this card was opened The card Graph 2 was open for 5 seconds The card Graph 3 was open for 4 seconds The card Concept Map was open for 5 seconds The card Graph 3 was open for 3 seconds The card Graph 1 was open for 4 seconds I he button 1 was then pressed 6 seconds after this card was opened The button 1 was then pressed 6 seconds after this card was opened The button 1 was then pressed 7 seconds after this card was opened The button 1 was then pressed 7 seconds after this card was opened The button 1 was then pressed 11 seconds after this card was opened The button 1 was then pressed 11 seconds after this card was opened The card Table 1 was open for 12 seconds The card Text was open for 12 seconds The card Text was open for 3 seconds The card Text was open for 2 seconds The card Text was open for 2 seconds The student then quit the stack 32 seconds after this card was opened
- 1 -