Interpretation of transmissivity estimates from … of Transmissivity Estimates from ......
24
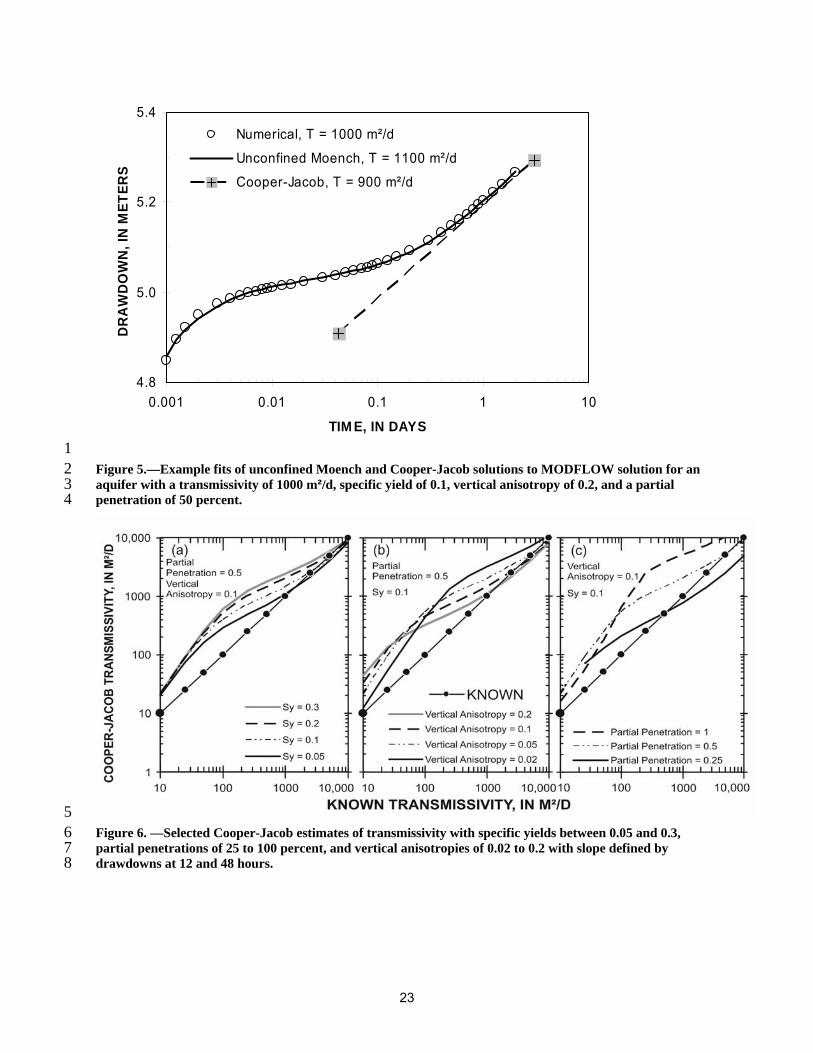
Interpretation of Transmissivity Estimates from Single-Well, Pumping Aquifer Tests 1 2 3 4 5 6 7 8 9 10 11 12 13 14 15 16 17 By Keith J. Halford 1 , Willis D. Weight 2 , and Robert P. Schreiber 3 Abstract Interpretation of single-well tests with the Cooper-Jacob method remains more reasonable than most alternatives. Drawdowns from 628 simulated single-well tests were interpreted with the Cooper-Jacob straight-line method. Error and bias as a function of vertical anisotropy, partial penetration, specific yield, and interpretive technique were investigated for transmissivities that ranged from 10 to 10,000 m²/d. Cooper-Jacob transmissivity estimates in confined aquifers were affected minimally by partial penetration, vertical anisotropy, or analyst. Cooper-Jacob transmissivity estimates of simulated unconfined aquifers averaged twice known values. One percent of these estimates were more than 10 times known values. Transmissivity estimates were not improved by interpreting results with an unconfined solution. An empirical corrector reduced the bias and magnitude of error in Cooper-Jacob transmissivity estimates for unconfined aquifers. The empirical corrector is available as a Visual Basic for Applications function in a single-well analysis spreadsheet. 1 USGS, 333 W Nye Ln, Room 203, Carson City, NV 89706; e-mail:[email protected]; Tel:775-887-7613 2 Montana Tech of The University of Montana, 1300 West Park St., Butte, MT 59701; e-mail:[email protected]; Tel:406-496-4329 3 CDM, One Cambridge Place, 50 Hampshire Street, Cambridge, MA 02139; e-mail:[email protected]; Tel:617-452-6251 1
-
Upload
truonglien -
Category
Documents
-
view
217 -
download
2
Transcript of Interpretation of transmissivity estimates from … of Transmissivity Estimates from ......

Interpretation of Transmissivity Estimates from Single-Well, Pumping Aquifer Tests
1
2
3
4
5
6
7
8
9
10
11
12
13
14
15
16
17
By Keith J. Halford1, Willis D. Weight2, and Robert P. Schreiber3
Abstract Interpretation of single-well tests with the Cooper-Jacob method remains more
reasonable than most alternatives. Drawdowns from 628 simulated single-well tests
were interpreted with the Cooper-Jacob straight-line method. Error and bias as a
function of vertical anisotropy, partial penetration, specific yield, and interpretive
technique were investigated for transmissivities that ranged from 10 to 10,000 m²/d.
Cooper-Jacob transmissivity estimates in confined aquifers were affected minimally by
partial penetration, vertical anisotropy, or analyst. Cooper-Jacob transmissivity
estimates of simulated unconfined aquifers averaged twice known values. One percent
of these estimates were more than 10 times known values. Transmissivity estimates
were not improved by interpreting results with an unconfined solution. An empirical
corrector reduced the bias and magnitude of error in Cooper-Jacob transmissivity
estimates for unconfined aquifers. The empirical corrector is available as a Visual Basic
for Applications function in a single-well analysis spreadsheet.
1 USGS, 333 W Nye Ln, Room 203, Carson City, NV 89706; e-mail:[email protected]; Tel:775-887-7613 2 Montana Tech of The University of Montana, 1300 West Park St., Butte, MT 59701; e-mail:[email protected]; Tel:406-496-4329 3 CDM, One Cambridge Place, 50 Hampshire Street, Cambridge, MA 02139; e-mail:[email protected]; Tel:617-452-6251
1
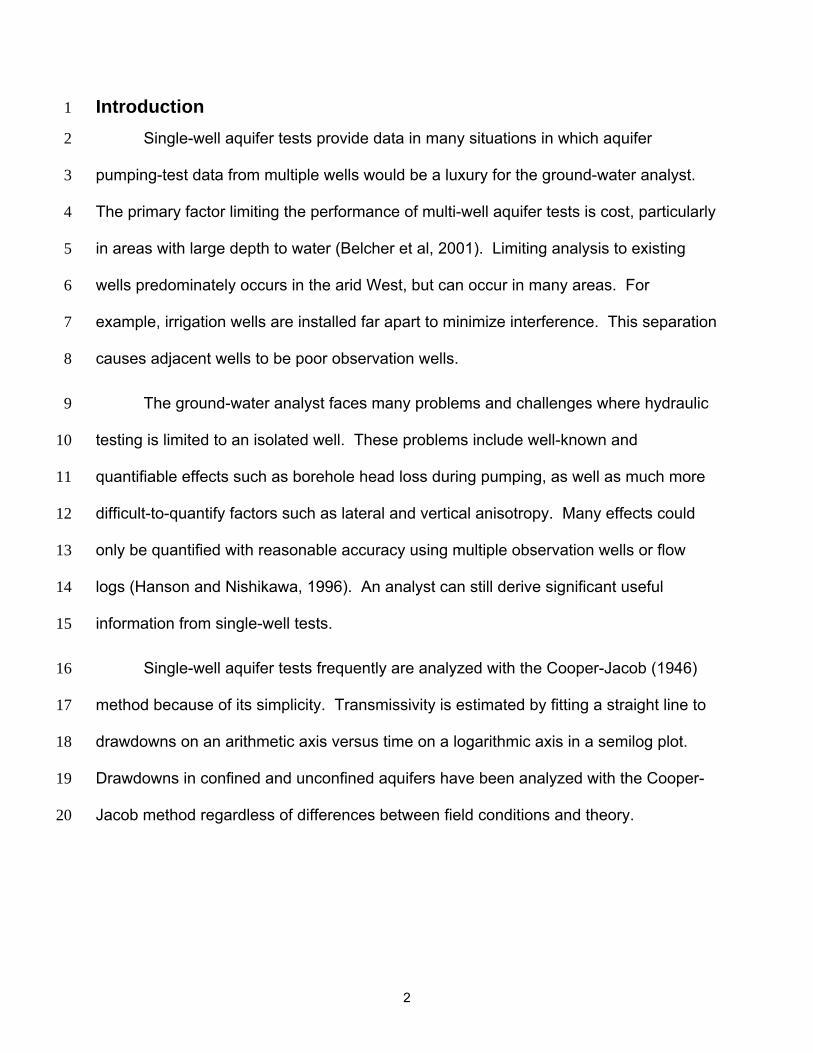
Introduction 1
2
3
4
5
6
7
8
9
10
11
12
13
14
15
16
17
18
19
20
Single-well aquifer tests provide data in many situations in which aquifer
pumping-test data from multiple wells would be a luxury for the ground-water analyst.
The primary factor limiting the performance of multi-well aquifer tests is cost, particularly
in areas with large depth to water (Belcher et al, 2001). Limiting analysis to existing
wells predominately occurs in the arid West, but can occur in many areas. For
example, irrigation wells are installed far apart to minimize interference. This separation
causes adjacent wells to be poor observation wells.
The ground-water analyst faces many problems and challenges where hydraulic
testing is limited to an isolated well. These problems include well-known and
quantifiable effects such as borehole head loss during pumping, as well as much more
difficult-to-quantify factors such as lateral and vertical anisotropy. Many effects could
only be quantified with reasonable accuracy using multiple observation wells or flow
logs (Hanson and Nishikawa, 1996). An analyst can still derive significant useful
information from single-well tests.
Single-well aquifer tests frequently are analyzed with the Cooper-Jacob (1946)
method because of its simplicity. Transmissivity is estimated by fitting a straight line to
drawdowns on an arithmetic axis versus time on a logarithmic axis in a semilog plot.
Drawdowns in confined and unconfined aquifers have been analyzed with the Cooper-
Jacob method regardless of differences between field conditions and theory.
2

1
2
3
4
5
6
7
8
9
10
11
12
13
14
15
Single-well tests from partially penetrating wells in unconfined aquifers depart
greatly from the Theis (1935) model. The Cooper-Jacob method is a simplification of
the Theis solution so the production well should fully penetrate a confined,
homogeneous, and isotropic aquifer. Unconfined aquifer tests are affected by vertical
anisotropy and specific yield in addition to transmissivity and storage coefficient. These
additional parameters control vertical gradients that are created by partial penetration
and drainage from the water table. Likewise, leakage from adjacent confining beds also
could affect the Cooper-Jacob method. Transmissivity likely will be overestimated
where leakage occurs.
Transmissivity estimates from single-well tests in unconfined aquifers also are
affected by discharge rate, test duration, and interpretive technique. The transition from
the release of water from storage owing to the compressibility of the medium and fluid to
drainage of pores is less likely to be observed during a test of relatively small discharge
or short duration. Interpretation is hampered because a final drawdown limb, which has
a slope predicted by the Cooper-Jacob method, is absent.
3

Purpose and Scope 1
2
3
4
5
6
7
8
9
10
11
12
13
14
15
16
17
18
19
20
21
22
This article documents how interpreting single-well, pumping aquifer tests with
the Cooper-Jacob method affects transmissivity estimates. Drawdowns in 800 single-
well tests were simulated with radial, MODFLOW models that were defined with
transmissivities between 10 and 10,000 m²/d. Drawdowns from 628 of these simulated
tests would maintain water levels above pump intakes and were interpreted with the
Cooper-Jacob, straight-line method. Transmissivity error and bias as a function of
vertical anisotropy, partial penetration, specific yield, and interpretive technique were
investigated. Transmissivity estimates were improved with informed interpretation or
with an empirical, corrector algorithm.
Approach Effects of unmet assumptions on the reliability of Cooper-Jacob transmissivity
estimates were investigated by interpreting 628 simulated drawdowns. The
transmissivity of each aquifer was estimated with a Cooper-Jacob analysis of simulated
drawdowns. Effects of unmet assumptions were quantified by comparing Cooper-Jacob
transmissivity estimates to specified values, herein referred to as known transmissivity.
Hydraulic properties were limited to plausible ranges. Transmissivities ranged
from 10 to 10,000 m²/d. Transmissivities of less than 10 m²/d were excluded because
slug tests are more practical than pumping tests. A single specific storage of 5 x 10⁻⁶ m-
1 was assigned to all aquifers because transmissivity estimates were insensitive to
specific storage. Specific yields ranged from 0.05 to 0.3. Vertical anisotropies ranged
between 0.02 and 0.2 and were assumed to represent a sedimentary system.
4

Pumping wells that penetrated between 10 and 100 percent of aquifers were
analyzed. All partially penetrating wells were open at the top of the aquifer or water
table (
1
2
Figure 1). Wellbore storage and skin effects of the pumping wells were simulated
which decreased maximum potential pumping rates. Simulation results were
considered physically impossible and rejected where simulated water levels in the
pumping well were less than 3 m above the bottom of the well. Wells in unconfined
aquifers were simulated to penetrate 25 or more percent of the saturated thickness so
water levels would remain above the pump intakes.
3
4
5
6
7
8
9
10
11
12
13
All single-well tests were simulated over 2-day periods to balance testing
effectiveness and operational constraints. Transmissivity estimates from tests of longer
duration are less ambiguous because drainage from the water table will be observed
and drawdowns will follow a late-time response. Actual single-well tests typically range
between 1 and 3 days in duration because of operational constraints.
5

Simulated Aquifer Tests 1
2
3
4
5
6
All single-well aquifer tests were simulated with two-dimensional MODFLOW
models (McDonald and Harbaugh, 1988; Harbaugh and McDonald, 1996). The
production well in each model was simulated as a high conductivity zone where water
was removed from the uppermost cell and flow was apportioned within MODFLOW. All
models extended 100,000 m from the production well along a row that was discretized
into 99 columns (Figure 1). Pumping wells were simulated in column 1 and aquifer
material was simulated with columns 2 through 99. Column 2 was 0.02 m wide and the
remaining columns were 1.15 times the width of the previous column. The 100-m thick
aquifers were uniformly subdivided into 100 rows. All models had no flow lateral
boundaries, initial heads of 0 m, and a single stress period of 50 time steps. The first
time step was 0.1 second in duration. Each successive time step was 1.3 times greater
than the previous one.
7
8
9
10
11
12
13
14
15
16
17
18
19
20
21
22
Hydraulic properties were modified consistently to simulate axisymmetric, radial
flow. Simulated pumpage was withdrawn from column 1 so that distance from the left
edge of column 1 to a column node would be equivalent to the radial distance from the
pumping well. Hydraulic conductivity and storage of the ith column were multiplied by
2πri to simulate radial flow where ri is the distance from the outer edge of the first
column to the center of the ith column. Axisymmetric, radial flow has been solved with
MODFLOW by using many layers and a single row (Reilly and Harbaugh, 1993; Clemo,
2002). A single MODFLOW layer is more convenient because input is defined easily,
all conductances are computed within the BCF package, and output is checked quickly.
6

Pumping rates were simulated near the maximum rate that could be pumped
practically from an aquifer of a given transmissivity. Pumping rates were greater in
more transmissive aquifers (
1
2
Table 1). Realistic wellbore-storage effects were simulated
by increasing well diameters as pumping rates increased. A storage coefficient of 1
was assigned in row 1 of column 1 to simulate wellbore storage. Conductances
between columns 1 and 2 were reduced tenfold to simulate skin where a well was
present.
3
4
5
6
7
8
9
10
11
12
13
14
15
16
Interpretation Cooper-Jacob transmissivity was estimated for each single-well test by a
mechanistic approach and separately by six analysts, including the three authors and
three volunteers. Transmissivity was estimated automatically with the mechanistic
approach. A semilog slope was defined by the drawdowns at 0.5 and 2 d after pumping
started. A minimum time of 0.5 d was selected as a compromise between avoiding the
early-time complications due to wellbore storage, partial penetration, and water-table
effects and assumed measurement sensitivity for actual aquifer tests. Experience
guided analysts’ best fit of semilog slopes. All simulated drawdowns and analyses can
be retrieved from http://nevada.usgs.gov/tech/groundwater_05.htm. 17
7
1
2
3
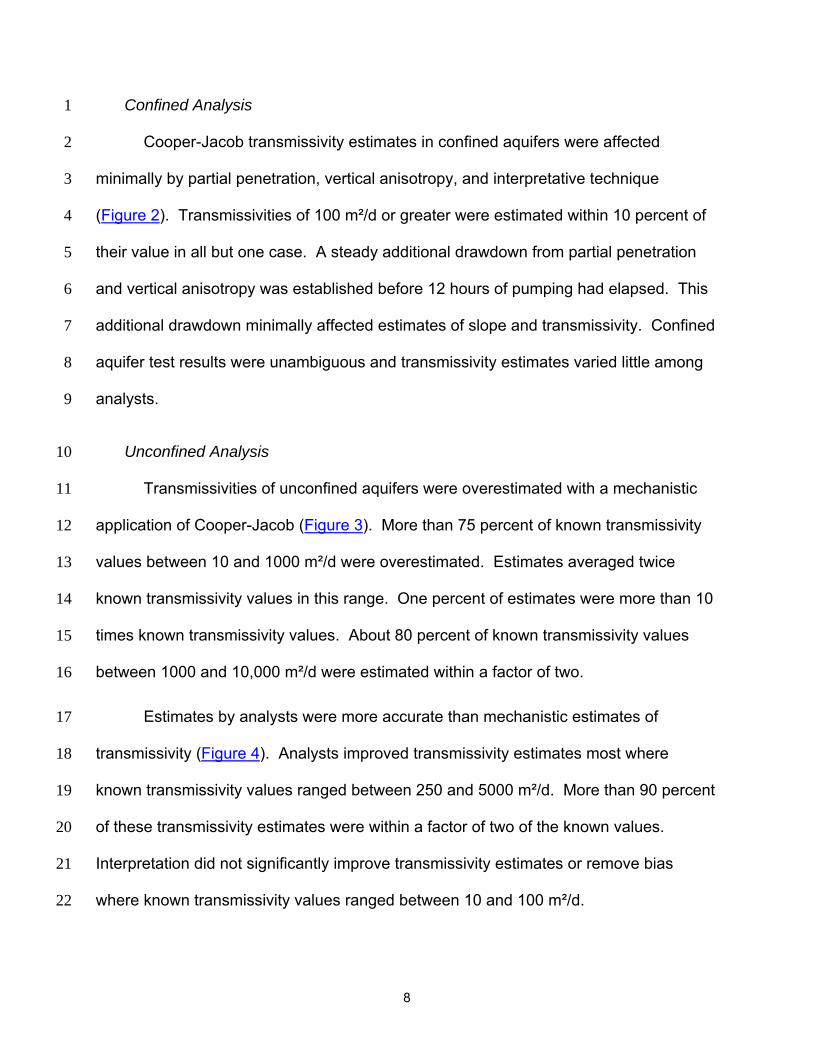
Confined Analysis
Cooper-Jacob transmissivity estimates in confined aquifers were affected
minimally by partial penetration, vertical anisotropy, and interpretative technique
(Figure 2). Transmissivities of 100 m²/d or greater were estimated within 10 percent of
their value in all but one case. A steady additional drawdown from partial penetration
and vertical anisotropy was established before 12 hours of pumping had elapsed. This
additional drawdown minimally affected estimates of slope and transmissivity. Confined
aquifer test results were unambiguous and transmissivity estimates varied little among
analysts.
4
5
6
7
8
9
10
11
Unconfined Analysis
Transmissivities of unconfined aquifers were overestimated with a mechanistic
application of Cooper-Jacob (Figure 3). More than 75 percent of known transmissivity
values between 10 and 1000 m²/d were overestimated. Estimates averaged twice
known transmissivity values in this range. One percent of estimates were more than 10
times known transmissivity values. About 80 percent of known transmissivity values
between 1000 and 10,000 m²/d were estimated within a factor of two.
12
13
14
15
16
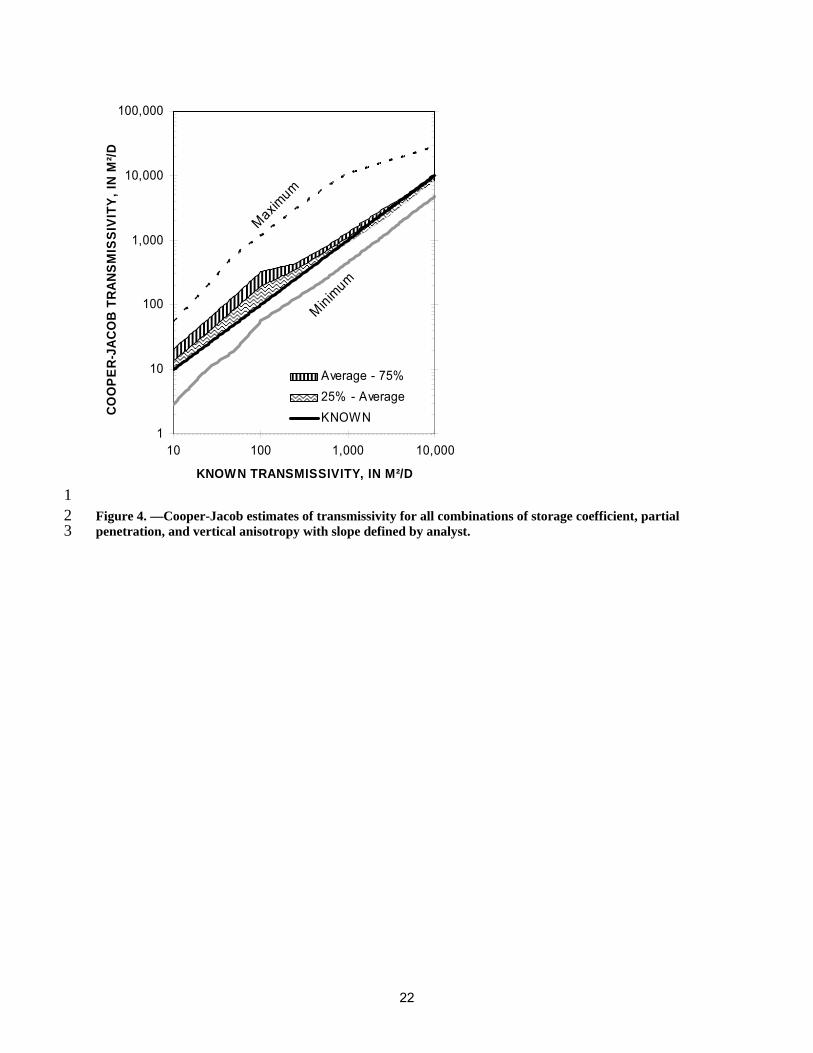
17 Estimates by analysts were more accurate than mechanistic estimates of
transmissivity (Figure 4). Analysts improved transmissivity estimates most where
known transmissivity values ranged between 250 and 5000 m²/d. More than 90 percent
of these transmissivity estimates were within a factor of two of the known values.
Interpretation did not significantly improve transmissivity estimates or remove bias
where known transmissivity values ranged between 10 and 100 m²/d.
18
19
20
21
22
8

Transmissivity estimates were not improved by interpreting results with an
unconfined analytical solution instead of Cooper-Jacob. Results from an unconfined
aquifer with a transmissivity of 1000 m²/d were interpreted with the Moench unconfined
solution (Barlow and Moench, 1999). Transmissivity, specific storage, vertical
anisotropy, specific yield, and skin were estimated simultaneously to minimize an
unweighted, sum-of-squares objective function. Transmissivity estimates ranged
between 800 and 1300 m²/d while matching all aspects of the drawdown curve (
1
2
3
4
5
6
Figure 7
8
9
10
11
12
5). A similar transmissivity of 900 m²/d was estimated by applying Cooper-Jacob to the
final drawdown limb.
Specific storage, vertical anisotropy, and specific yield could not be estimated
uniquely with an unconfined Moench solution (Barlow and Moench, 1999). Estimates of
these hydraulic properties with an unconfined Moench solution ranged over more than
2-orders of magnitude and several estimates were physically unreasonable (Table 2).
Initial estimates strongly affected final estimates. Initial estimates were limited to
plausible values for all six solutions.
13
14
15
16
17
Effects of Individual Parameters
Specific yield, vertical anisotropy, and partial penetration systematically affected
Cooper-Jacob transmissivity estimates in unconfined aquifers (Figure 6). Effects of
individual parameters on transmissivity were more pronounced on mechanistic
estimates. These effects largely were eliminated by analysts where known
transmissivity values ranged between 500 and 10,000 m²/d. Cooper-Jacob
transmissivity estimates exceeded known transmissivity values more as specific yield
increased (
18
19
20
21
22
Figure 6a). 23
9

Decreases in vertical anisotropy proportionally displace the maximum difference
between Cooper-Jacob estimates and known transmissivity (
1
Figure 6b). Transmissivity
estimates likely will be worst where vertical anisotropy ranges between 0.05 and 0.1.
Estimates differ most from known transmissivity between 50 and 100 m²/d, which is the
range where errors could not be compensated with interpretation.
2
3
4
5
6 Partial penetration affected transmissivity estimates more than specific yield or
vertical anisotropy (Figure 6c). Overestimation of transmissivity was greatest for fully
penetrating wells in unconfined aquifers. Transmissivity estimates were least biased
where partial penetration was 25 percent.
7
8
9
10
11
12
13
14
Empirical Corrector
An empirical corrector was developed to improve transmissivity estimates from
single-well tests on unconfined aquifers. Cooper-Jacob transmissivity, vertical
anisotropy, partial penetration, and specific yield define a multiplier that corrects the
Cooper-Jacob transmissivity estimate. The common log of the empirical corrector (C) is
10

)0.89Kxz-(0.3 v-0.50.10.1
e 2.237)-PP + (tanh(v) Kxz.)log( 630=C .........................................................(1) 1
10log(4PP)
0.1
Y0.2
CJ
10Kxz 5.03
1 - )log(S - PP -Kxz - )log(T=v ...............................................................................................(2) 2
3
4
5
6
7
8
9
where, Kxz is vertical anisotropy (dimensionless), PP is partial penetration
(dimensionless), SY is specific yield (dimensionless), and TCJ is a Cooper-Jacob
transmissivity estimate (L²/T). Coefficients and exponents in equations (1) and (2) were
estimated by minimizing sum-of-squares differences between known transmissivity and
mechanistic-transmissivity estimates. The empirical corrector is applied as a Visual
Basic for Applications function in the spreadsheet Pumping_Cooper-
Jacob_wCORRECTOR.xls and can be retrieved from
http://nevada.usgs.gov/tech/groundwater_05.htm. This workbook is a modification of
the previously published Cooper-Jacob.xls (Halford and Kuniansky, 2002).
10
11
12 More than 65 percent of known transmissivity values between 10 and 250 m²/d
can be corrected within a factor of two (Figure 7), assuming that 95 percent of specific
yield and vertical anisotropy estimates are within a factor of two of their actual values.
The average of all estimates for a given transmissivity was less biased and was within 5
percent of the known value. Equation (1) is of limited value where known transmissivity
exceeds 500 m²/d because limitations of the Cooper-Jacob method can be better
compensated with interpretation.
13
14
15
16
17
18
11

Hydraulic Conductivity 1
2
3
Hydraulic conductivity of confined aquifers was unambiguously determined as
the transmissivity estimate divided by aquifer thickness, rather than the screen length,
whenever transmissivity was 100 m²/d or greater (Figure 2). Hydraulic conductivity was
not defined clearly by either aquifer thickness or screen length where transmissivity was
less than 50 m²/d. Screen length might be appropriate for estimating hydraulic
conductivity from transmissivity but only where transmissivity is appreciably less than 10
m²/d.
4
5
6
7
8
9
10
11
12
Hydraulic conductivities of unconfined aquifers could not be interpreted
unambiguously from transmissivity estimates with either aquifer thickness or screen
length. Aquifer thickness was better than screen length for interpreting hydraulic
conductivity with estimates that ranged from 0.5 to 4 times known hydraulic
conductivities (Figure 6c). Hydraulic conductivity estimates ranged from 1.6 to 8 times
known values where transmissivity estimates were divided by screen length.
13
14
15
16
17
18
19
20
21
Design Effects Well and aquifer head losses can be better differentiated with improved
transmissivity estimates from single-well aquifer tests. Head losses, from poor well
completion practice (skin) and partial penetration, will be overestimated where
transmissivity has been overestimated. An analyst could conclude falsely that the well
was completed poorly and that completion of future wells could be improved. This
scenario is likely to occur where transmissivity ranges between 10 and 250 m²/d.
12
1
2
3
4
5
6
7
8
9
10
11
12
13
14
15
Interpretive techniques from this paper can be used to improve the design of
isolated production wells. Wells will more likely produce at designed rates with
improved skin and transmissivity estimates because screen lengths and well diameters
can be sized appropriately. The expense of poor design can be significant where
deepening a well or drilling an additional well likely is a result.
Conclusions Cooper-Jacob analysis of single well tests in unconfined aquifers overestimates
transmissivity. Transmissivity estimates averaged twice known values between 10 and
1000 m²/d and exceeded known values by more than an order of magnitude in a few
cases. Transmissivity estimates also were not improved by interpreting results with an
unconfined solution. Cooper-Jacob transmissivity estimates in confined aquifers
differed little from known values regardless of partial penetration or vertical anisotropy.
Hydraulic conductivity of confined aquifers was estimated unambiguously using the
transmissivity estimate divided by aquifer thickness where transmissivity exceeded 100
m²/d.
13

1
2
3
4
5
6
7
8
9
10
11
12
13
14
15
Transmissivity estimates from single-well tests can be improved with informed
interpretation or empirical corrections. The final limb of an unconfined response can be
identified by an analyst where transmissivity exceeds 500 m²/d. All transmissivity
estimates are improved qualitatively because analysts are aware of likely biases. The
empirical corrector that was developed in this paper can reduce systematic bias where
transmissivity ranges between 10 and 250 m²/d. Improved transmissivity estimates
should improve skin estimates that would allow for better well design. This simple
approach provides a useful tool to improve transmissivity estimates from a single-well
test.
Acknowledgements The authors express their appreciation to Eve L. Kuniansky, Randell J. Laczniak,
and David E. Prudic of the U.S. Geological Survey who generously assisted this study
by analyzing many simulated aquifer tests. The authors thank Randy Hanson, Rhett
Everett, and Ed Weeks of the U.S. Geological Survey and anonymous reviewers that
helped improve the paper.
14

References 1
2
3
4
5
6
7
8
9
10
11
12
13
14
15
16
17
18
19
20
21
22
23
Barlow, P.M., and A.F. Moench. 1999. WTAQ—A computer program for calculating drawdowns and
estimating hydraulic properties for confined and water-table aquifers. USGS Water-Resources
Investigations Report 99-4225.
Belcher, W.R., P.E. Elliott, and A.L. Geldon. 2001. Hydraulic-property estimates for use with a transient
ground-water flow model of the Death Valley Regional Ground-Water Flow System, Nevada and
California. USGS Water-Resources Investigations Report 01-4210.
Clemo, T., 2002. MODFLOW-2000 for cylindrical geometry with internal flow observations and improved
water table simulation. Technical Report BSU CGISS 02-01, Boise State University, Boise, Idaho.
Cooper, H.H., and C.E. Jacob. 1946. A generalized graphical method for evaluating formation constants
and summarizing well field history. American Geophysical Union Transactions 27: 526–534.
Halford, K.J., and E.L. Kuniansky. 2002. Documentation of spreadsheets for the analysis of aquifer
pumping and slug test data. USGS Open-File Report 02-197.
Hanson, R. T., and Tracy Nishikawa. 1996. Combined use of flowmeter and time-drawdown data to
estimate hydraulic conductivities in layered aquifer systems. Ground Water 34, no. 1: 84-94.
Harbaugh, A.W., and M.G. McDonald. 1996. Programmer's documentation for MODFLOW-96, an update
to the U.S. Geological Survey modular finite-difference ground-water flow model: USGS Open-File
Report 96-486.
McDonald, M.G., and A.W. Harbaugh. 1988. A modular three-dimensional finite-difference ground-water
flow model. USGS Techniques of Water-Resources Investigations, book 6, A1.
Reilly, T.E., and A. W. Harbaugh. 1993. Computer Note: Simulation of cylindrical flow to a well using the
U.S. Geological Survey modular finite-difference ground-water flow model. Ground Water 31, no. 3:
489-494.
15

1
2
3
4
Theis, C.V. 1935. The relation between the lowering of the piezometric surface and the rate and duration
of discharge of a well using ground water storage. Transaction of American Geophysical Union 16:
519–524.
16

Tables 1
2 3 4 5
6
Table 1.—Well diameters and discharges assigned to simulated aquifers. .................................. 18 Table 2.—Six unconfined Moench solutions for a simulated single-well test in an aquifer with a
transmissivity of 1000 m²/d, specific yield of 0.1, vertical anisotropy of 0.2, and a partial penetration of 50 percent. ..................................................................................................... 18
17
1 2
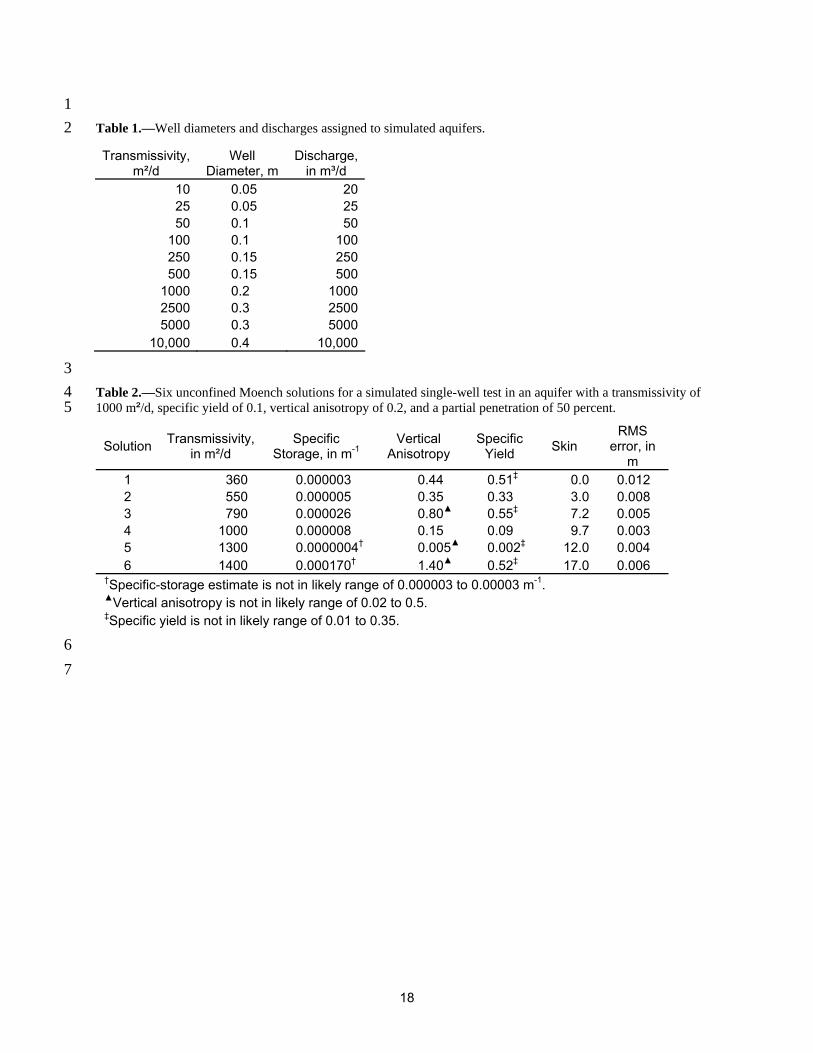
Table 1.—Well diameters and discharges assigned to simulated aquifers.
Transmissivity, m²/d
Well Diameter, m
Discharge, in m³/d
10 0.05 2025 0.05 2550 0.1 50
100 0.1 100250 0.15 250500 0.15 500
1000 0.2 10002500 0.3 25005000 0.3 5000
10,000 0.4 10,000
3 4 5
Table 2.—Six unconfined Moench solutions for a simulated single-well test in an aquifer with a transmissivity of 1000 m²/d, specific yield of 0.1, vertical anisotropy of 0.2, and a partial penetration of 50 percent.
Solution Transmissivity, in m²/d
Specific Storage, in m-1
Vertical Anisotropy
Specific Yield Skin
RMS error, in
m 1 360 0.000003 0.44 0.51‡ 0.0 0.012 2 550 0.000005 0.35 0.33 3.0 0.008 3 790 0.000026 0.80▲ 0.55‡ 7.2 0.005 4 1000 0.000008 0.15 0.09 9.7 0.003 5 1300 0.0000004† 0.005▲ 0.002‡ 12.0 0.004 6 1400 0.000170† 1.40▲ 0.52‡ 17.0 0.006
†Specific-storage estimate is not in likely range of 0.000003 to 0.00003 m-1. ▲Vertical anisotropy is not in likely range of 0.02 to 0.5. ‡Specific yield is not in likely range of 0.01 to 0.35.
6 7
18

FIGURES 1
2 3 4 5 6 7 8 9
10 11 12 13 14 15 16 17 18 19 20
Figure 1.—Definition sketch of hypothetical well and aquifer system with grid for numerical solution.................................................................................................................................. 20
Figure 2.—Cooper-Jacob estimates of transmissivity in confined aquifers for all combinations of partial penetration and vertical anisotropy with slope defined by drawdowns at 12 and 48 hours...................................................................................................................................... 20
Figure 3. —Cooper-Jacob estimates of transmissivity for all combinations of storage coefficient, partial penetration, and vertical anisotropy with slope defined by drawdowns at 12 and 48 hours...................................................................................................................................... 21
Figure 4. —Cooper-Jacob estimates of transmissivity for all combinations of storage coefficient, partial penetration, and vertical anisotropy with slope defined by analyst........................... 22
Figure 5.—Example fits of unconfined Moench and Cooper-Jacob solutions to MODFLOW solution for an aquifer with a transmissivity of 1000 m²/d, specific yield of 0.1, vertical anisotropy of 0.2, and a partial penetration of 50 percent. ................................................... 23
Figure 6. —Selected Cooper-Jacob estimates of transmissivity with specific yields between 0.05 and 0.3, partial penetrations of 25 to 100 percent, and vertical anisotropies of 0.02 to 0.2 with slope defined by drawdowns at 12 and 48 hours. ......................................................... 23
Figure 7. —Corrected Cooper-Jacob estimates of transmissivity for all combinations of storage coefficient, partial penetration, and vertical anisotropy with slope defined by drawdowns at 12 and 48 hours..................................................................................................................... 24
19

1
2 Figure 1.—Definition sketch of hypothetical well and aquifer system with grid for numerical solution.
Maximum
Minimum
1
10
100
1,000
10,000
100,000
10 100 1,000 10,000
KNOWN TRANSMISSIVITY, IN M²/D
CO
OP
ER
-JA
CO
B T
RA
NS
MIS
SIV
ITY
, IN
M²/D
Average - 75%25% - AverageKNOWN
3 4 5
Figure 2.—Cooper-Jacob estimates of transmissivity in confined aquifers for all combinations of partial penetration and vertical anisotropy with slope defined by drawdowns at 12 and 48 hours.
20

Maximum
Minimum
1
10
100
1,000
10,000
100,000
10 100 1,000 10,000
KNOWN TRANSMISSIVITY, IN M²/D
CO
OP
ER-J
ACO
B T
RAN
SMIS
SIVI
TY, I
N M
²/D
Average - 75%25% - AverageKNOWN
1 2 3
Figure 3. —Cooper-Jacob estimates of transmissivity for all combinations of storage coefficient, partial penetration, and vertical anisotropy with slope defined by drawdowns at 12 and 48 hours.
21
Maximum
Minimum
1
10
100
1,000
10,000
100,000
10 100 1,000 10,000
KNOWN TRANSMISSIVITY, IN M²/D
CO
OP
ER-J
ACO
B T
RAN
SMIS
SIVI
TY, I
N M
²/D
Average - 75%25% - AverageKNOWN
1 2 3
Figure 4. —Cooper-Jacob estimates of transmissivity for all combinations of storage coefficient, partial penetration, and vertical anisotropy with slope defined by analyst.
22
4.8
5.0
5.2
5.4
0.001 0.01 0.1 1 10
TIM E, IN DAYS
DR
AW
DO
WN
, IN
MET
ERS
Numerical, T = 1000 m²/d
Unconfined Moench, T = 1100 m²/d
Cooper-Jacob, T = 900 m²/d
1 2 3 4
Figure 5.—Example fits of unconfined Moench and Cooper-Jacob solutions to MODFLOW solution for an aquifer with a transmissivity of 1000 m²/d, specific yield of 0.1, vertical anisotropy of 0.2, and a partial penetration of 50 percent.
5 6 7 8
Figure 6. —Selected Cooper-Jacob estimates of transmissivity with specific yields between 0.05 and 0.3, partial penetrations of 25 to 100 percent, and vertical anisotropies of 0.02 to 0.2 with slope defined by drawdowns at 12 and 48 hours.
23

Maximum
Minimum
1
10
100
1,000
10,000
100,000
10 100 1,000 10,000
KNOWN TRANSMISSIVITY, IN M²/D
CO
OPE
R-J
AC
OB
TR
AN
SMIS
SIVI
TY, I
N M
²/D
Average - 75%25% - AverageKNOWN
1 2 3
Figure 7. —Corrected Cooper-Jacob estimates of transmissivity for all combinations of storage coefficient, partial penetration, and vertical anisotropy with slope defined by drawdowns at 12 and 48 hours.
24