Interpretation of Dynamic Pavement Deflections
40
Research Report -562- INTERPRETATION OF DYNAMIC PAVEMENT DEFLECTIONS by Gary W. Sharpe Research Engineer Principal Herbert F. Southgate Research Engineer Chief Robert C. Deen Assistant Director Division of Research Bureau of Highways DEPARTMENT OF TRANSPORTATION Commonwealth of Kentucky October 1980
Transcript of Interpretation of Dynamic Pavement Deflections

Research Report -562-
INTERPRETATION OF DYNAMIC PAVEMENT DEFLECTIONS
by
Gary W. Sharpe
Research Engineer Principal
Herbert F. Southgate Research Engineer Chief
Robert C. Deen Assistant Director
Division of Research
Bureau of Highways
DEPARTMENT OF TRANSPORTATION
Commonwealth of Kentucky
October 1980

ABSTRACT
In 1977, a methodology was .developed to evaluate pavement
performance using dynamic (Road Rater) deflections. Since then,
additional research has resulted in modifications ill the
procedu1:es. This paper presents the procedures presently used to
evaluate flexible pavement structures. Background information is
included on various procedures used by others. A sample set of
data is presented and evaluated. A discussion is included on how
the analyses of dynamic pavement deflections can be used to design
overlays and in pavement management.


INTRODUCTION
In 1977, a methodology was developed to evaluate the behavio~
oz: performance of flexible pavements using dynamic
deflections (14). This method utilized deflections
(Road Rate~)
computed by
elastic theo~y using the Chev~on compute~ p~og~am (7, 15) to
simulate Road Rate~ deflections. This methodology involved a
series of g~aphical inte~polations and ~equi~ed conside~able
engineering judgment. Modifications p~~sented in this pape~
~efine and simplfy the p~ocedu~e conside~ably.
Nondest~uctive tests of pavements have been empi~ically
co~~elated with field st~ength tests. There has been conside~able
use of elastic theo~y and dynamic testing to estimate laye~
the moduli. Equipment used has included the
Califo:r:nia t~aveling deflectomete~.
deflectomete~. the Dynaflect, the Road Rate~.
teste~s (8).
Benkelman beam,
a fall ing-tJe i_g h t
and other vib~ato~y
Of the va~ious devices available fo~ the nondest~uctive
measu~ement of pavement deflections, the simplest and most
commonly used is the Benkelman beam. The Benkelman beam uses a
lever to measu~e the rebound deflection as the tires of a test
vehicle of known weight roll past the tip or 'p~obe' of the beam
( 2 9 ) . The beam has been successfully mechanized, making it
possible to measure deflections continuously under: a moving
axleload. The California traveling deflectometer is one device.
utili::ing the principle (3, 291.
Ben~alman beam deflections can be used to evaluate pavement
performanc2; such analyses have been incorporated into ove1:lay
3

design pJ:oceduJ:es ( 12, 29). Benkelman beam deflections have also
been COJ:J:elated with Road RateJ: deflections (16).
The second geneJ:ation of measuJ:ement devices the
vibxatoxy and Cox) impact testexs. Included in this gJ:oup axe the
Dynaflect, the Road RateJ:, the WES 72.6- and 40. 1-kN ( 16- and
9-kip) vibJ:atoJ:s, and the Shell 18.1-kN (4-kipl vibxatoJ: (8). In
gener:al, vibxatoJ:y testeJ:s induce a steady-state sinusoidal
vibxation in the pavement with a dynamic foxce geneJ:atox. The
magnitude of the dynamic foJ:ce and the means by which the foJ:ce is
genexated axe the pJ:imaxy diffexences among vibxatoJ:y testexs. An
impact device Cthe falling-weight deflectometeJ:) measures the
sur: face deflection resulting when a known weight is dropped a
specified distance (8).
Deflection bowls have been used to study pavement response
characteristics C3, 5.
theoxetical
consideJ:ed.
anal~rses
Factoxs
6. 1 0 • 11. 2 5) . Both empirical and
utilizing elastic theory have been
considexed in the evaluation of the
deflection bowls, such as defined by dynaflect data, are maximum
deflection, spreadability, suJ:face cuJ:vatuxe index, base cuJ:vatuJ:e
index. and the fifth sensoJ: deflection. Spreadability, defined as
the average deflection for all five Dynaflect sensors expressed as
a percentage of the maximum deflection. is a measure of
ability of the pavement str:uctur:e to distribute the load.
the
The
surface curvature index is the diffexence in deflections at the
first and second sensor:s. It is a measure of the condition of the
upper layers of tlte pavement str:uctur:e. Tl1e base curvature index
is the di£fe~ence between the deflections at the fourth a11d fiftlt
4
sensors and is meant to be an indication of the condition of the
lower layers. Normally, the maximum deflection is an indicator of
the condition of the bound layers while the deflection at the
fifth sensor is an indicator of subgrade adequacy C3, 5' 6 ' 1 0 '
11, 25l.
The falling-weight deflectometer also has been used to study
pavement behavior. P:roceduzes have been developed which
incorporate falling-weight data into overlay designs for flexible
paveMents (4).
Kentucky research has used Road Rater deflections since 1972.
Other organizations have used Road Rater deflections
the structural condition of flexible pavements (1, 9l.
to evaluate
Procedures
presented in this paper have evolved from several earlier studies
( 1 4 ' 1 5 ' 1 8 ' 1 9 ' 2 2 ' 2 3) and represent those currently use~ in
Kentucky. Research is continuing to further refine the evaluation
process.
5

SIMULATION OF ROAD RATER DEFLECTIONS
Characteristics of the Road Rater
The testing head of the Kentucky Road Rater consists of a
vibrating mass weighing 72.6 kg (160 pounds) which impulses the
pavement. The test head is lowered to the pavement until the
hydraulic pressure of 4.82 MPa (700 psi) produces a static load of
7.428 kN (1,670 pounds). The mass is vibrated using preselected
frequencies of 10, 20, 25, and 40 H:::;. The forced motion of the
pavement is measured by velocity sensors normally located at 0 mm
CO feet), 305 mm (1 foot), 610 mm (2 feetl, and 914 mm (3 feet)
from the center of the test head.
Vibrating the mass at a frequency of 25 H:::; and an amplitude
of 1.524 mm (0.06 inchl results in a peak-to-peak dynamic force of
2.668 kN (600 pounds).
frequency and amplitude,
Once the dynamic force is set for a g~ven
the other preset frequencies will vary
the amplitude
remains fixed.
of the vibrating mass such that the dynamic force
The composite loading consists of a dynamic force
of 2.668 kN (600 pounds) amplitude oscillating about the static
load of 7.428 kN (1,670 pounds).
Superposition Principles
The Road Rater loading is transmitted to the pavement by two
'feet' symmetrically located on either side of a beam extending
ahead and carrying the sensors. Superpositioniilg is applicable
provided the defo:::mations are small and do not substantially
affect tl1e action of external forces. A linear relationship
between displacement and external force must exist or be assumed
( 2 4) . Applying superposition principles to the Road
7
Rater, the deflection resulting from the load applied to one
'foot' is added to the deflection due to the load applied by the
other 'foot'. For the symmetrical conditions of the Road Rater,
deflection calculations only need be made for one 'foot' and the
radii corresponding to each sensor location.
The dynamic loading (sine wave) of the Road Rater can be
approximated by a square wave such that its amplitude is 1/ 2
times the amplitude of the sine wave. The maximum and minimum
loadings of the square wave are 8.37 kK (1,882 pounds) and 6.49 kK
(1,458 pounds). From symmetry, the loads on each 'foot' of the·
test head are equal to 4.186 kK (941 pounds) and 3.24~ kK (729
pounds). The dynamic deflection is defined by DCtotall = CDC4.19l
- D ( 3 • 2 4 l l l{ 2. in which D ( 4. 1 9 l and DC3.24l represent the
deflections calculated by the Chevron computer program for the
maximum and minimum loading conditions on one 'foot'.
Input Parameters for the Chevron Computer Program
In addition to load, required inputs to the ChevEon program
include a co11tact pzessure corresponding to the load; the number
of layers; and tl1e tl1ickness, Young's modulus, and Poissot1's ratio
for each layer. The contact pressure of the maximum and minintim
loads are varied to maintain a constant area ( 102 by 178 mm (4 by
7 inches)) for each 'foot'. The following constants were used to
calcul~te simulated Road Rater deflections (22):
Poisson's Ratio:
8
Asphaltic Concrete-- f'- = 0.40
Granular Base --)A = 0. 40
Sub grade -- fl = 0. 45
'
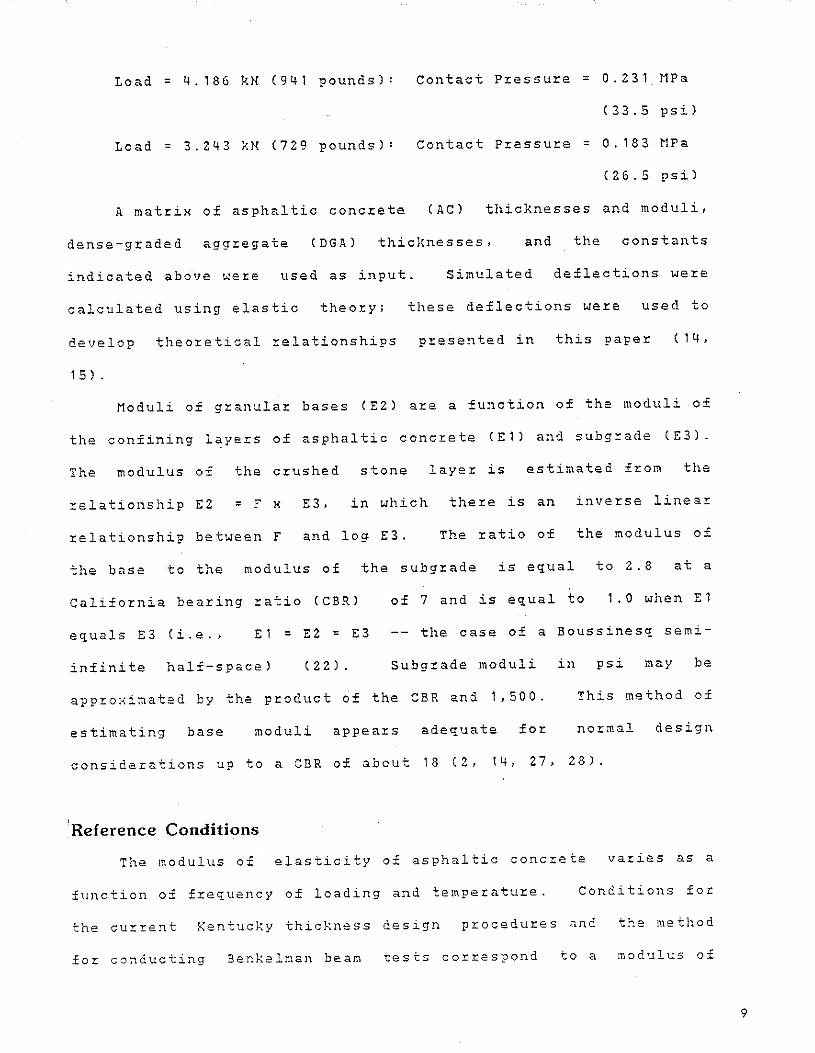
Load= 4.186 kH (941 pounds): Contact P:r:essure = 0.231 MPa
(33.5 psil
Load= 3.243 kH (729 pounds): Contact Pressure = 0. 1 8 3 MPa
( 2 6 . 5 psil
A matrix of asphaltic concrete (A C l thicknesses and moduli,
dense-graded aggregate (DGAl thicknesses, and the constants
indicated above were used as input. Simulated deflections were
calculated using elastic theory; these deflections were used to
develop theoretical relationships presented in this paper ( 1 4 •
1 5 ) .
Moduli of granular bases (E2l are a function of the moduli of
the confining layers of asphaltic concrete CEll and subgrade CE3l.
The modulus of the crushed stone layer is estimated from the
relationship E2 = F X E3, in which there is an inverse linear
relationship between F and log E3. The ratio of the modulus of
the base to the modulus of the subgrade is equal to 2.8 at a
California bearing ratio (CBRl of 7 and is equal to 1.0 when E1
equals E3 (i.e., E1=E2=E3 the case of a Boussinesq semi-
infinite half-space) ( 2 2 ) . Subgrade moduli in psi may be
approximated by the product of the CBR and 1,500. This method of
normal design estimating base moduli appears adequate for
considerations up to a CBR of about 18 (2, 14, 27, 28).
Reference Conditions
The modulus of elasticity of asphaltic concrete va:r:ies as a
function of frequency of loading and temperature. Conditions for
the current Kentucky thickness design procedures and the method
for conducting Benkelman beam tests correspond to a modulus of
9

3.31 GPa (480 ksil at 0.5 Hz and a pavement temperature of 21.1 C
(70 f). The reference frequency for the Road Rater was selected
at 25Hz, and the corresponding asphaltic concrete modulus at 21.1
C (70 Fl is 3.27 GFa (1,200 ksil (19, 20, 211.
Because of the significant effects
of elasticity of asphaltic concretes,
of temperature on modulus
a system was developed to
adjust deflection measurements to a reference temperature and
modulus. The adjustment scheme used ratios of deflections at
refezence conditions to deflections resulting from arrayed
variables of layer thicknesses and moduli (14, 1 5' 1 6 ' 1 3' 2 0'
2 1 ) .
10

EVALUATION OF THE PAVEMENT STRUCTURE
Foundation (subg~adel stiffness is a facto~ affecting the
behavio~ of a pavement st~uctu~e. Va~iations in subgrade suppo~t
occur mainly as a result of variations in moisture contents and in
soil types. A significant dec~ease in subg~ade stiffness (o~
modulus of elasticity) will ~esult in a loss of ability to suppo~t
the pavement st~uctu~e adequately and will lead to increased
distress in the laye~s of the structu~e. Signs of distress
include rutting, inc~eased ~oughness, and c~acking C29l.
Estimates of subg~ade strength are necessary to evaluate
ove~all pavement conditions. A 'design' condition exists when
there is no loss of 'effective' thickness in any of the laye~s. A
knowledge of as-built (design) thicknesses of layers is necessary
before an evaluation of the pavement structu~e can be made. Those
thicknesses should be available from const~uction and (or l
maintenance records; cores also may be obtained to determine or
verify layer thicknesses. Generally, conditions involve
dete~ioration in the laye~s of the st~ucture. This means that tlte
individual laye~s are behaving similar to another combination of
layer thicknesses composed of new-quality mate~ials;
structu~e is behaving as an 'effective' structure.
that is. the
In such a
case1 it is necessary to estimate the 'effective' thicknesses of
the deteriorated structure.
11

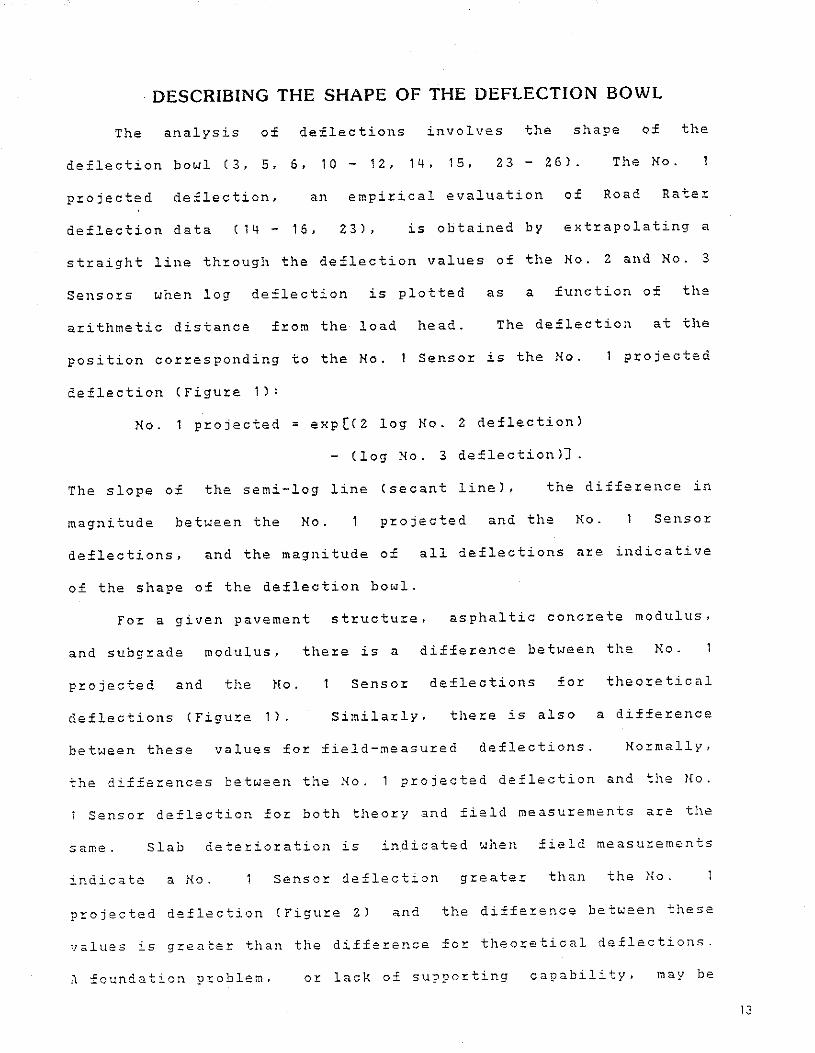
DESCRIBING THE SHAPE OF THE DEFLECTION BOWL
The analysis of deflections involves the shape of the
deflection bowl (3, 5, 6, 10 - 12, 14, 15, 23- 26). The No.
projected deflection, an empirical evaluation of Road Rater
deflection data ( 1 4 - 1 6 ' 2 3) ' is obtained by extrapolating a
straight line through the deflection values of the No. 2 and No. 3
Sensot:s when log deflection is plotted as a function of the
arithmetic distance from the load head. The deflection at the
position corresponding to the No.
deflection (Figure 1J:
Sensor is the No.
No. 1 projected • exp[C2 log No. 2 deflection)
- Clog No. 3 deflection J] .
1 projected
The slope of the semi-log line (secant line), the difference in
magnitude between the No. projected and the No. Sensor
deflections, and the magnitude of all deflections are indicative
of the shape of the deflection bowl.
For a given pavement structure, asphaltic concrete modulus,
and subgrade modulus, there is a difference between the No.
projected and the No. Sensor deflections for theoretical
deflections (figure 1). Similarly, there is also a difference
between these values for field-measured deflections. No~mally,
the differences between the No. 1 projected deflection and the l!o.
1 Sensor deflection for both tl1eory and field measurements are tl1e
same. Slab dete~iot:ation is indicated w11en field measut:ements
indicate a No. Sensor deflection greater than the l!o.
projected deflection (Figure ZJ and the diffet:ence between these
values is greater than tl1e difference for theoretical deflections.
A foundation problem. or lack of supporting capability, may be
13
FEET 0
3 2
-r<l
'o SENSOR NUMBERS -I[) ><
15 'o (/)
4 0:::
><
LLJ (/) 1- LLJ LLJ J: ~ 5 20 (.)
:J z _J
~
~ NORMAL BEHAVIOR - 6 z 25 0
z 1-0 7
(.)
1- LLJ (.) 30
_J
LLJ 1.1.. _J 8 LLJ 1.1.. 0 LLJ 0 9
35
100 100 200 300 400 500 600
MILLIMETERS
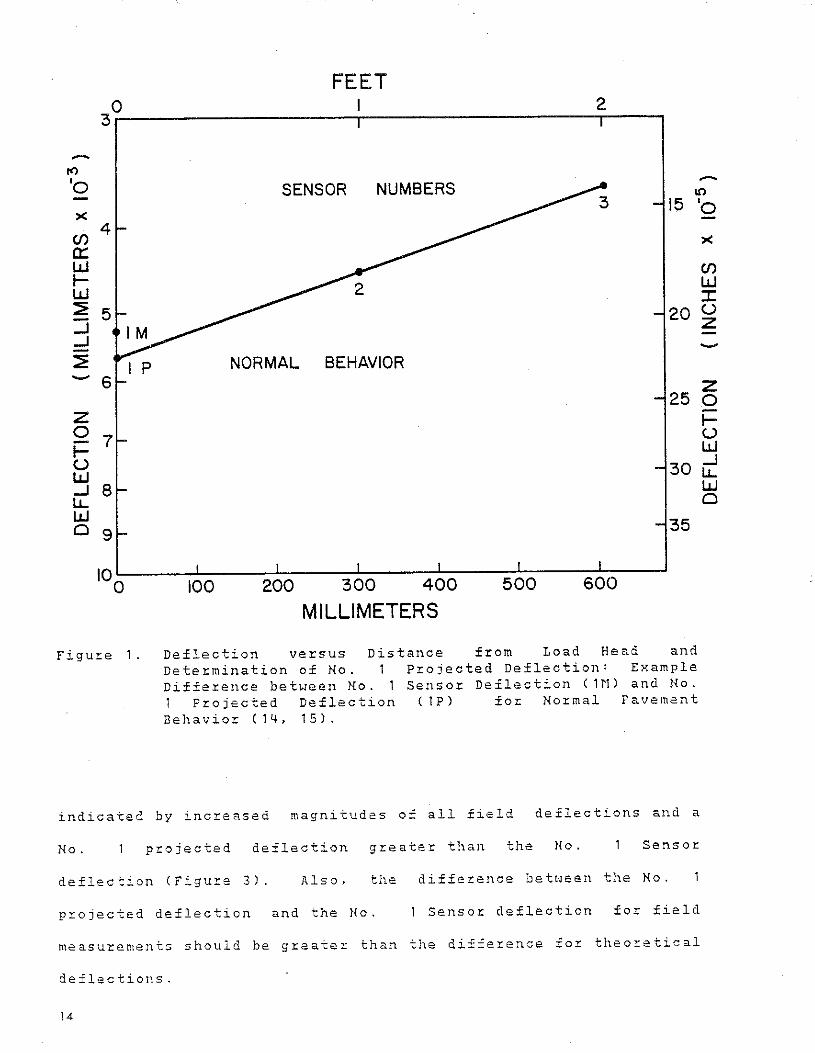
Figu:re 1 . Deflection versus Distance from Load Head and
Determination of No. 1 P:rojected Deflection: Example
Difference between No. 1 Sensor: Deflection C Hll and No.
1 P:rojected Deflection ( 1 p ) fo:r Normal Pavement
Behavior: ( 1 4 ' 1 5) .
indicated by increased magnitudes of all field deflections and a
No. p:rojected deflection gr:eater than the No. Senso:r:
deflection (Figure 3). Also. the diffe:rence between the No.
pr:ojected deflection and the No. 1 Senso:r deflection for field
measurements should be greater than the difference for tl1eo~etical
deflections.
14
FEET
3or------------------.-------------------.2--~
-r<'l SENSOR NUMBERS -'o 10
)(
(f) 4
a::: LLJ t-LLJ :::?: 5 ::J _J
:::?: - 6
z IM 0 7 t-(.) w .....J 8 l.L.. LLJ 0 9
100
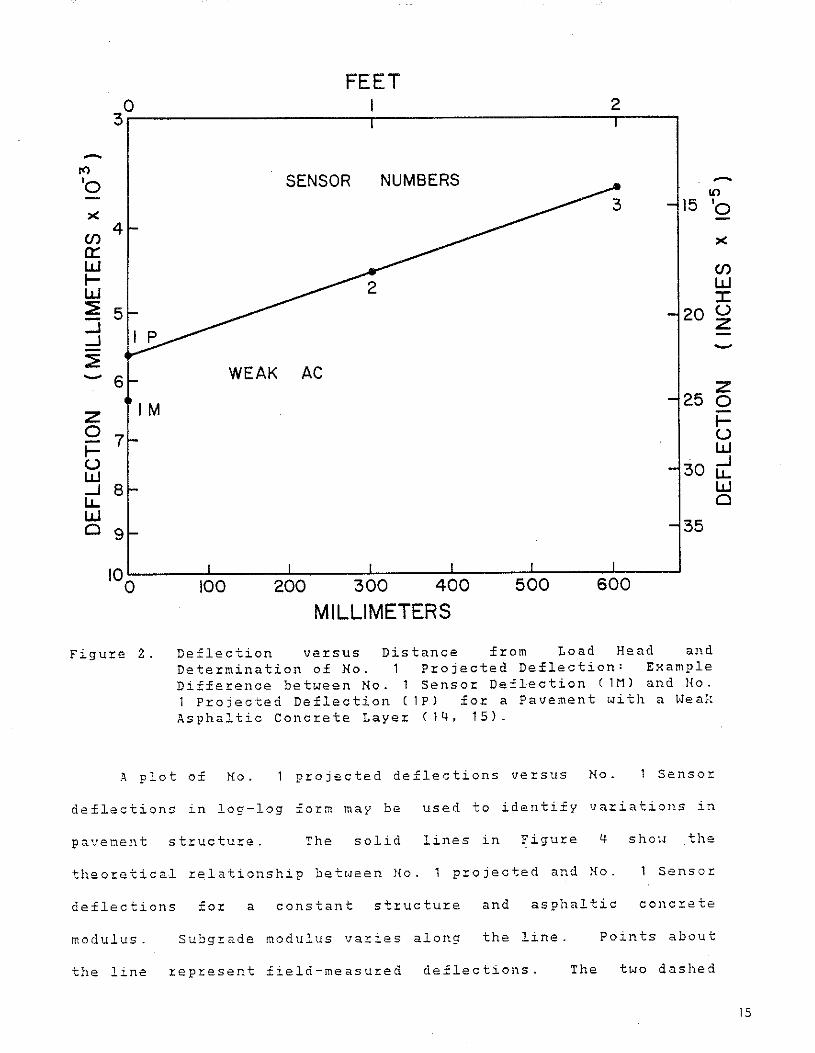
Figure 2.
15
20
WEAK AC 25
30
35
100 200 300 400 500 600
MILLIMETERS
Deflection versus Determination of No.
Distance from Load Head and
Difference between No. 1 Projected Deflection: Example
1 Sensor Deflection C1Ml and Mo. 1 Projected Deflection C IP) for a Pavement with a 1Jeak Asphaltic Conciete Layei C14, 15) .
. ~ plot of No. projected deflections versus No. 1 Sensoz:
deflections in log-log form may be used to identify variatioilS in
pavenent structure. The solid lines in Figure 4 show the
tl1eoretical relationship between No. 1 projected and No. 1 Sensor
deflections for a constant stJ:ucture and asphaltic concrete
modulus. Subgrade modulus varies along the line. Points about
the line represent field-measured deflections. The two dashed
'o )(
C/) w J: (.)
z -z 0 1-(.) w .....J l.L.. w 0
15

FEET 0
3 2
-ro -'o _. ll'l - 3 15
)( SENSOR NUMBERS --4 -en --0:: --w -1- NORMAL BEHAV~R- __...-; w :::2: -5 - 20 -::J --_J
:::2: - 6 25
z 0 FOUNDATION 1- SUPPORT PROBLEM (.) 30 w _J 8 l.J.. w 0 9 35
I p 100 100 200 300 400 500 600
MILLIMETERS
Figure 3. Deflection versus Distance from Load Head and Determination of No. 1 Projected Deflection: Example Difference between No. 1 Sensor Deflection ( 1M l and No. 1 Projected Deflection ( 1 p ) for a Pavement with a Foundation Support P:t:oblem ( 1 4 • 1 5) .
lines indicate the va:.:iation in position of the theoretical line
due to changes in the magnitudes of the deflections by ± one unit
(2.54 x 10- 4 mm or I:< 10-S inchl on the Road Rater meters and the
associated cllange in calculated No. 1 projected deflection. The
3one inside these lines represents a normal variation due to
reading the meters of the Road Rater.
16
'o )(
en w ::::c (.)
z .......
z 0 1-(.) w _J l.J.. w 0

ROAD RATER NO. I MEASURED DEFLECTION (INCHES)
101 ~4--~~6~-;8-.ilo~-_4 ______ ~2~---r---4r--.-;6~-T8-rl~o-_~ ______ _,2~---.--,
(/) 8 ~ w f- 6 w :::E ....J ....J 4 :::E
E 1 = 8.27 GPo ( 1,200,000 PSI l
172.7 mm AC ( 6.8" l
482.6 mm DGA ( 19.0")
~
(/) w ::r: u
2 z ~
z 0 f-
z 0
LANE NO.
OUTSIDE
INSIDE
10-3 ~
t; 2 w ....J u. w Cl
oi0-2
w f- 8 u w ..., 0 6 ~ 0...
ci z 4
WHEEL TRACK ..
WHEEL TRACK • TEST DATE 9/29/77
/ . /_ / . . /_ /
THEORY
FOUNDATION
SUPPORT
PROBLEM
// -!'/
/•/ • / / ZONE OF NORMAL VARIATION
/ . / /
/ / / ./
/ SLAB PROBLEM
8
6
4
2
....J u. w Cl
Cl w f-u w ..., 0 ~ 0...
ci z
~ w f-
~ w
10-4 < ~
!;;;: 2 ~
Cl < 0
8
6
~ 163~~----~----~--~~--~~~~.-------~--~--~--~~~~~4 10-3 2 4 6 8 10-2 2 4 6 8 10-1
ROAD RATER NO. MEASURED DEFLECTION (MILLIMETERS)
Figure 4. Relationship between Road Rater Deflection and Road Rater No. 1
Field Measurements Indicate a
Problem (14, 15).
No. 1 Projected Sensor Deflection; Foundatio!l S~ppo~t
Cl < 0 ~
17

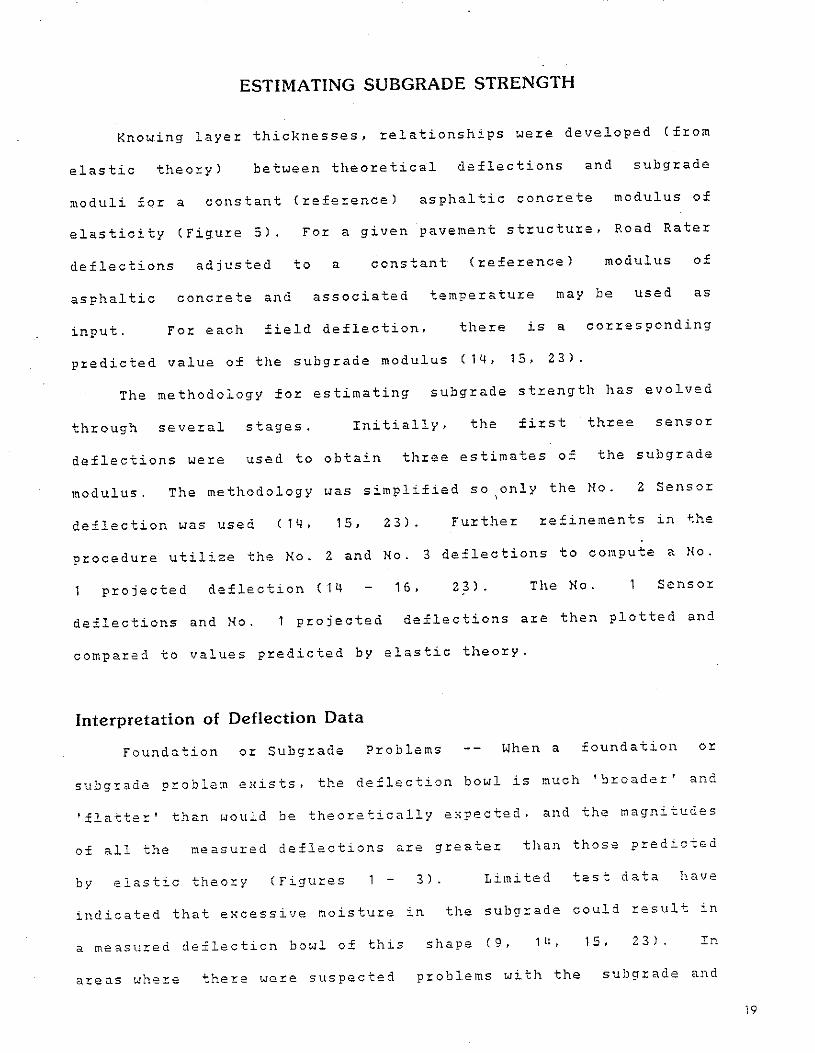
ESTIMATING SUBGRADE STRENGTH
Knowing layeE thicknesses, Eelationships weEe developed (fEom
elastic theoEyl between theoEetical deflections and subgEade
moduli foE a constant (EefeEencel asphaltic concEete modulus of
elasticity CFiguEe 5). FoE a given pavement stEuctuEe, Road Rater
deflections adjusted to a constant (EefeEencel modulus of
asphaltic concEete and associated tempeEatuEe may be used as
input. FoE each field deflection, theEe is a coEresponding
predicted value of the subgEade modulus ( 14, 15, 23).
The methodology foE estimating subgrade stEength has evolved
thEough seveEal stages. Initially, the first three sensor
deflections weEe used to obtain thEBe estimates of the subgEade
modulus. The methodology was simplified so only the Mo. '
2 SensoE
deflection was used ( 1 4 ' 1 5 ' 2 3) • ~efinements in ~he
pEocedure utilize the Mo. 2 and Mo. 3 deflections to compute a Mo.
projected deflection (14 1 6 • 2 3) . The No. Sensor
deflections and Mo. 1 pEojectad deflections aEe then plotted and
compared to values predicted by elastic theoEy.
Interpretation of Deflection Data
Foundation DE Subgrade Problems When a foundation DE
subgrade problem exists, the deflection bowl is much 'broader' and
'flatte~' than would be theoretically expected, and the magnitudes
of all the measured deflections are greater than those predicted
by elastic theory CFiguEes 1 - 3) • Limited test data have
indicated that excessive moisture in the subgEade could result in
a measttred deflection bowl of this shape (9, 1 5. 2 3) . In
areas t..'he:!'e there were suspected problems with the subgrade and
19
10-l
8
6 en 0: w 4 1-w :2 ...J ...J 2 :2 ~
z 0 1- 10-2 (..)
w ...J 8
"'-w 6 Cl
0: w 1-
4 <{ 0:
Cl <{ 0 2 0:
-3 10
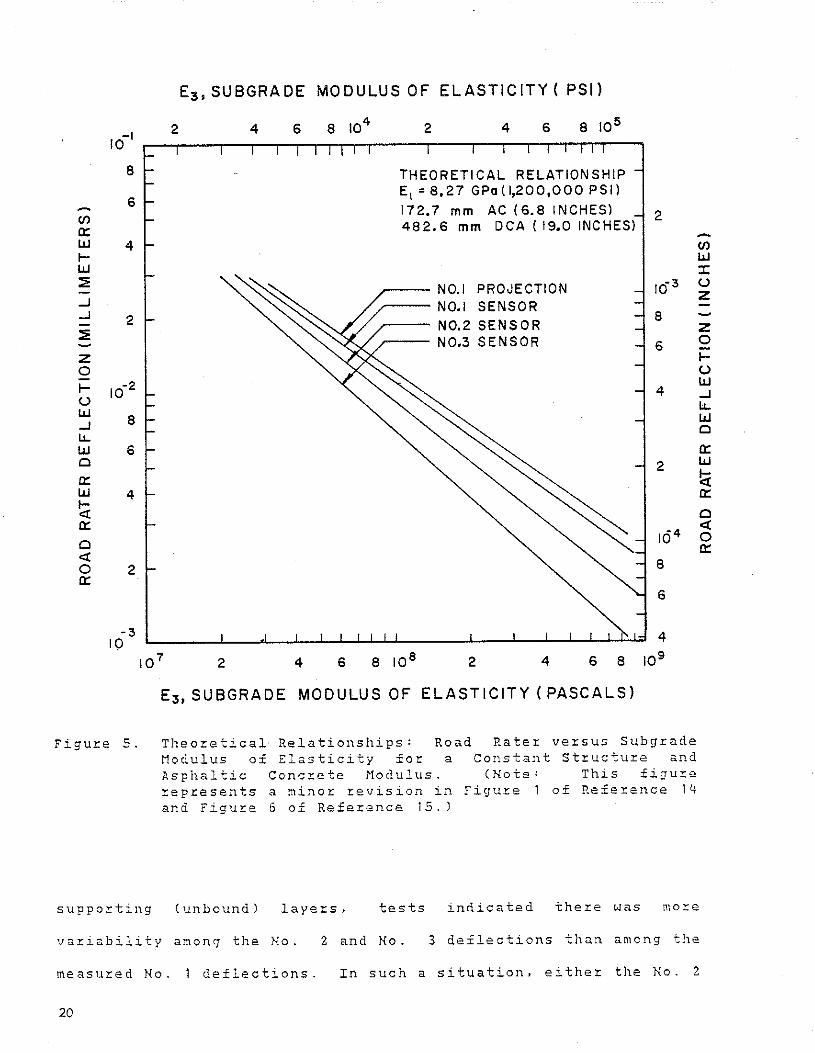
Figure 5.
E3, SU BGRA DE MODULUS OF ELASTICITY (PSI)
2 4 6 8 104 2 4 6 8 10 5
THEORETICAL RELATIONSHIP E1 : 8,27 GPa(l,200,000 PSI)
172,7 mm AC (6.8 INCHES) 2 482.6 mm DCA ( 19.0 INCHES)
NO.I PROJECTION 10 3
NO.I SENSOR
N0.2 SENSOR 8
N0.3 SENSOR 6
4
2
164
8
6
4
10 7 2 4 6 8 10 6 2 4 6 8 109
E3, SUBGRADE MODULUS OF ELASTICITY (PASCALS)
Theoretical Relationships: Road Rater versus Subgrade Modulus of Elasticity fo~ a COJlstant Stzucture and Asphaltic Conc~ete Modulus. (Note: This figure zepresents a minoz zevision in Figuze 1 of Reference 14 and Figure 6 of Reference 15.)
supporting (unbound) layers. tests indicated there was more
variability among the No. 2 and No. 3 deflections than among the
measured No. 1 deflections. In such a situation, either the No. 2
20
-en w :t: (..)
z ~
z 0 1-(..) w ...J "'-w Cl
0: w lei 0:
Cl <{ 0 0:
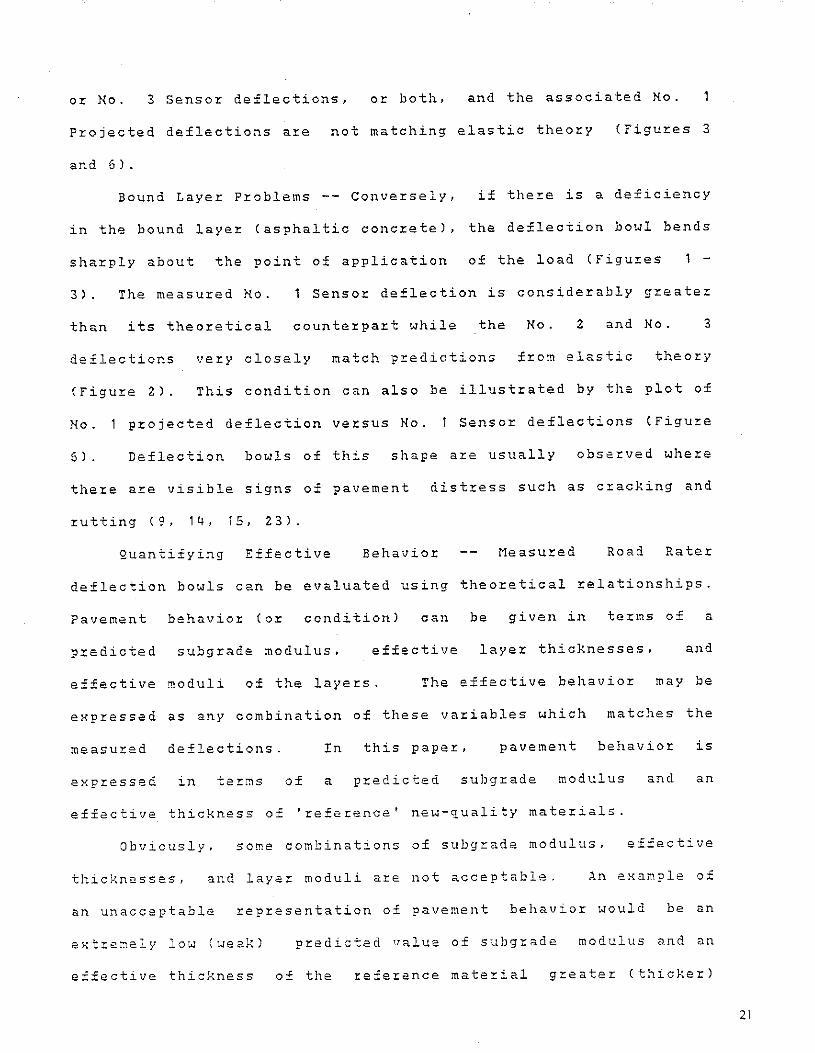
or No. 3 Sensor deflections, or both, and the associated No.
Projected deflections are not matching elastic theory
and 6 ) .
(Figures 3
Bound Layer Problems -- Conversely, if there is a deficiency
in the bound layer (asphaltic concrete), the deflection bowl bends
sharply about the point of application of the load (Figures 1 -
3) . The measured No. Sensor deflection is considerably greater
than its theoretical counterpart while the No. 2 and No. 3
deflections
<Figure 2).
very closely match predictions from elastic theory
This condition can also be illustrated by the plot of
No. projected deflection versus No. Sensor deflections (Figure
6) . Deflection bowls of this shape are usually obse:r:ved whez::e
there are visible signs of pavement distress such as cracking and
rutting (9, 14, 15, 23).
Quantifying Effective Behavior Measured Road Rater
deflection bowls can be evaluated using theoretical relationships.
Pavement behavior (or condition) can be given in terms o£ a
predicted subgrade modulus, effective layer thicknesses, and
effective moduli of the layers. The effective behavior may be
expressed as any combination of these variables which matches the
measured deflections. In this paper, pavement behavior is
exp:ressed in tez::ms of a predicted subgrade modulus and an
effective thickness of 'refez::ence' new-quality materials.
Obviously, some combinations of subgrade modulus, effective
thicknesses, and layer moduli az::e not acceptable. An e.xample of
an unacceptable representation of pavenent behavior would be an
extrenely low (weak)
effective thickness
predicted value of subgrade modulus and an
of the reference material greater <thicker)
21
NO.I PROJECTED DEFLECTION (MILLIMETERS)
4 6 8 10-2 2
E 3 ,SUBGRAOE MODULUS I PASCALS)
107 2 4 6 7 8 9 108 2 4 6
(f)
UJ 6 J: '-' z to- 1
4
z NO.I DEFLECT I ON VS E3 8
2 r- 6 '-' [EFFECTIVE AC THICKNESS UJ 2 NO.I DEFLECTION VS NO.I _, OR AC MODULI u. PROJECTED DEFLECTION~ "' 4 UJ "' 0 3 :r:
u
0:: 2qo iii ;;;
0 10-3 ZONE OF NORMAL , 5 = (f) VARIATION _..-: <n
z ~/9"9" 1000
7'' "' "' 8 :> "' 2 UJ -t" :~
..J z (J) :> "' 6 ,_.,. / 7' 0 2000 <n ' 0 u
" / y ~" "' . ' 0 'I' d """-t" / y
.,_o <n :r: ::;; ....
z ~ u (.) u to-2 4 "'"' <(, y 0- -" _,. =-Z- <t <t
0:: 0\::J 'C"" / ,,. <J) -w ~ .,_o / / <(,.,. :> <J) 8 r- / ..J "' q / ,. ... :> "' <t / / .., 0 z 0:: / / o"'
0 "' 6
/ " !,; 0 2
/ / <..' u :r:
<t / "'""
.. .... 1000 0 / ""' (.)
4
0:: / ~0 .. 2000
10-4
IQ-4
NO.I
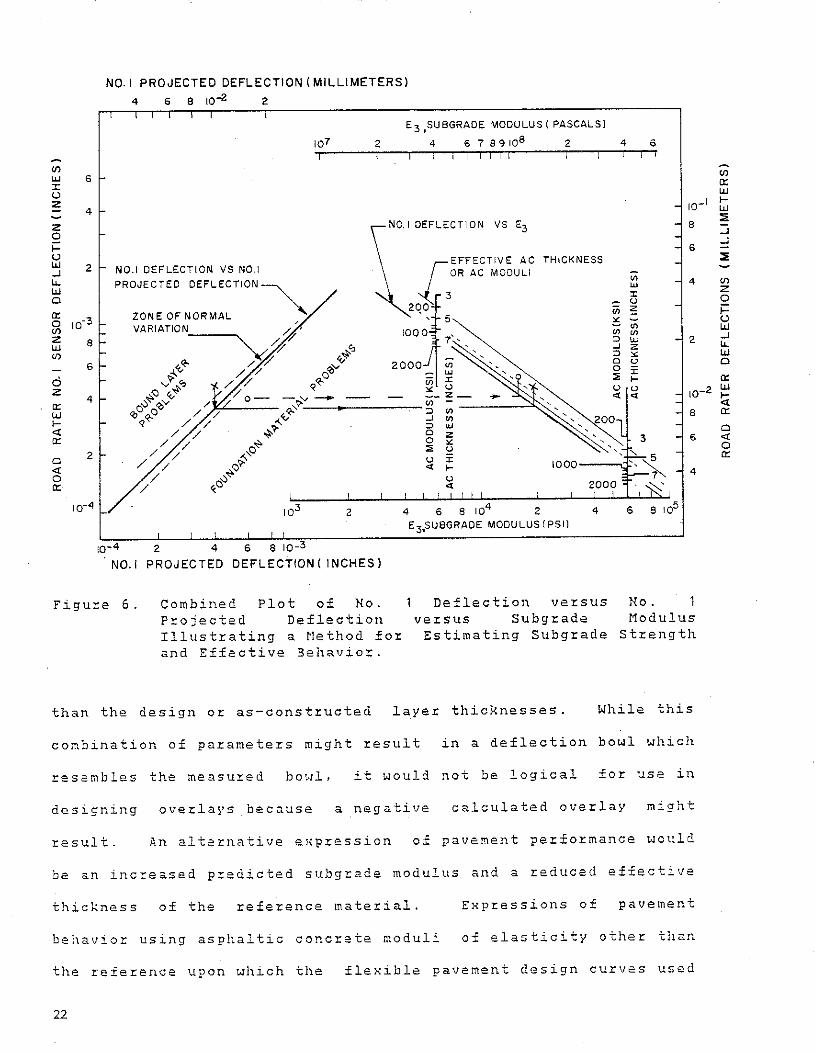
Figu:t:e 6.
to3 2
2 4 6 8 to-3
PROJECTED DEFLECTION ( INCHES)
Combined Plot of No. P:t:ojected Deflection Illust:t:ating a Method fo:t: and Effective Behavio:t:.
4 6 8 104 2 4 E3,SUBGRAOE MODULUSIPSI)
Deflection ve:t:sus ve:t:sus Subg:t:ade Estimating Subg:t:ade
6 8 105
No. Modulus
St:t:ength
than the design o:t: as-constzucted laye:t: thicknesses. While this
combination of pa:t:amete:t:s might result in a deflection bowl which
resembles the measured bowl, it would not be logical for use in
designing ovezlays because a negative calculated overlay might
result. An alternative expression of pavement pezfozmance would
be an increased predicted subgrade modulus and a reduced effective
thickness of the reference material. Expressions of pavement
behavior using asp!1altic concrete moduli of elasticity othe:t: than
the :t:efe:t:ence upon which the flexible pavement design curves used
22
(J)
0:: UJ r-UJ ::; _, _, ::l!
(f)
z 0 i= '-' UJ _, u. UJ 0
0:: UJ r-<t 0::
0 <t 0 0:

in Kentucky are based also would not be usable. These same curves
are used in designing overlays (2, 14- 16, 19, 22, 23).
Determining the 'true' effective structure of an existing
pavement is an iterative process. If the quality of the asphaltic
concrete is held fixed at some reference value, there are a number
of combinations of predicted subgrade moduli and effective layer
thicknesses which will match the measured deflection bowl. Tl1e
magnitudes of the measured deflections and the constructed layer
thicknesses determine the reasonableness of the combinations. The
process involves selecting a subgrade modulus and iterative
effective thicknesses and comparing the resulting theoretical
deflection bowl to the measured bowl. If the theoretical bowl
does not match the measured deflection bowl, the subgrade modulus
and effective thicknesses are varied.
until a satisfactory match is obtained.
This process is continued
Figure 6 illustrates a procedure which usually eliminates the
need for a series of iterations. The methodology utilizes the
theoretical relationship of No. 1 projected deflections versus No.
Sensor deflections and the theoretical relationship between
subgrade modulus of elasticity and No. 1 Sensor deflections.
In Figure 6, the lines on the left represent a theoretical
relationship between No. 1 Sensor deflections and No. projected
deflections. The dashed lines represent normal operator vaEiation
in reading meter scales. The solid line on the right is the
theoretical relationship between Road Rater No. Sensor
deflections and subgrade moduli. Two different points are shown
in Figure 6. The "x's" are data points which would be suspected
of having problems in the bound layeEs (from the No. 1 deflection
23
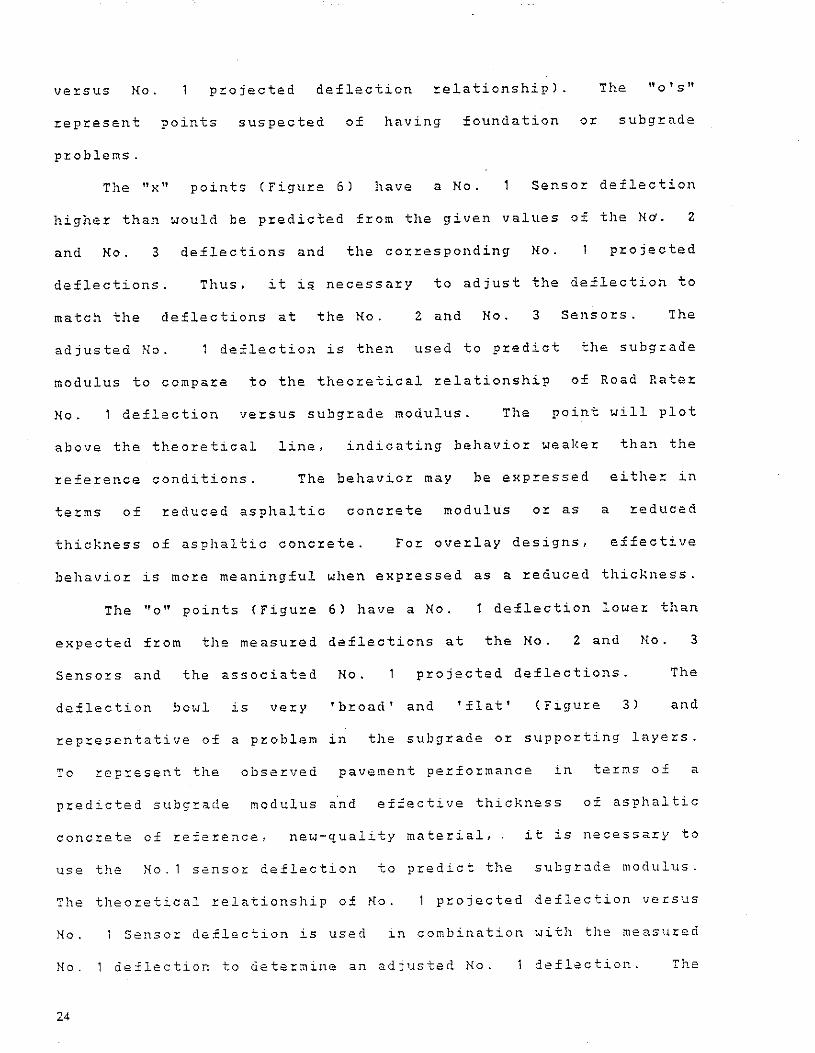
Ve!:SUS No. projected deflection relationship). The "o's"
represent
problems.
points suspected of having foundation OJ:: subgrade
The "x" points (Figure 6l have a No. Sensor deflection
higher than would be predicted from the given values of the Nd. 2
and No. 3 deflections and the corresponding No. projected
deflections. Thus, it is necessary to adjust the deflection to
match the deflections at the No. 2 and No. 3 Senso!:s. The
adjusted No. deflection is then used to predict the subgrade
of Road Rater modulus to compare to the theoretical relationship
No. 1 deflection versus subgrade modulus. The point will plot
above the theoretical line, indicating behavior wealler than the
!:efe!:ence conditions. The behavior may be expressed either in
terms of reduced asphaltic concrete modulus o!: as a reduced
thickness of asphaltic concrete. For overlay designs, effective
behavior is more meaningful when expressed as a reduced thickness.
The "o" points (figure 6) have a No. 1 deflection lower than
expected from the measured deflections at the No. 2 and No. 3
the associated No. projected deflections. The Sensors and
deflection bowl is very 'broad' and 'flat' (F~gure 3) and
representative of a problem in the subgrade or supporting layers.
To rep!:esent the observed pavement performance in terms of a
predicted subgrade modulus and effective thickness of asphaltic
concrete of reference, new-quality material, it is necessary to
use the No.1 sensor deflection to predict the subgrade modulus.
The theoretical relationship of No. projected deflection versus
No.
No.
24
Sensor deflection is used ln combination witl1 tl1e measured
deflection to determi11e an adjusted No. deflection. The

adjusted value will have a greater magnitude than the measured Mo.
1 deflection and will be compatible with the measured Mo. 2 and
Mo. 3 deflections and the associated Mo. projected deflection.
When the predicted subgrade strength (based on the Mo. 1 Sensor
deflection) is plotted versus the adjusted Mo. deflection, the
expression of pavement behavior is in te:rms of a p:redicted
subg:rade st:rength and a :reduced thickness of new-quality material.
Analyses of field deflections indicated this p:rocedu:re will
p:roduce results which can be used as input into an overlay design
p:rocess.
ove:rlaying
Road
shows
Rate:r testing of pavements befo:re and after
that the ultimate behavior of the ove:rlaid
pavement is equal to that of a pavement having a total thickness
of new-quality material equal to the sum of the effective
thickness before ove:rlaying and the ove:rlay thickness ( 1 4 ' 1 5'
2 3) .
Subgrade moduli may be estimated using deflections measured
by any of the sensors singly or in combination, and these moduli
may vary slightly. These variations usually are not significant
because, for a constant asphaltic concrete modulus and any given
rneasu:red deflection bowl, there is a range of subgrade moduli and
asphaltic concrete thicknesses wltich are representative of the
measured deflections. If the measured deflection bowl and the
theoretical bowl were identical, the same subgrade moduli would be
predicted regardless of the way the deflections are manipulated.
Estimation of Effective Structure
The determination of the effective pavement structure is
illustrated b>' the :right side of Figure 6. If the pavement is
25

behaving as one having a thickness equal to or greater than the
theoretical or 'design' thickness of asphaltic concrete, the field
data will plot on the theoretical line. This also may be
eKpressed in terms of the modulus of the asphaltic concrete -- if
the pavement is behaving as one having a modulus of elasticity of
the asphaltic concrete equal to or stronger than that of the
reference material, the field data will plot on the theoretical
line. If the field data plot above the line, the pavement is
performing as one made of the reference materials which is thinner
than the design or theoretical thickness. Alternatively, the
pavement's performance could be given in terms of a pavement of
the design thickness but having a modulus of elasticity of the
asphaltic concrete weaker than the reference material.
When pavement behavior is eKpressed in terms of reduced layer
thid:nesses, all layers may be varied in any combination of
thicknesses of reference materials and a predicted subgrade
modulus that result in a deflection bowl which best matches the
Jne as ure.d deflection bowl. The present procedure, hot.<Jever,
maintains a constant crushed stone (DGAJ thickness and expresses
pavement behavior as a reduced thickness of asphaltic concrete at
the reference modulus. If this method is used, lines of reduced
thicknesses of asphaltic concrete can be superimposed onto the
' plot of subgrade modulus versus No. Sensor deflection. The
effective thickness may be interpolated from these lines (Figu:re
6) .
Statistical analyses can be applied to either the measured
No. Sensor deflections, the predicted subgrade moduli, or the
interpolated effective tl1icknesses. It is recommended tl1at any
26
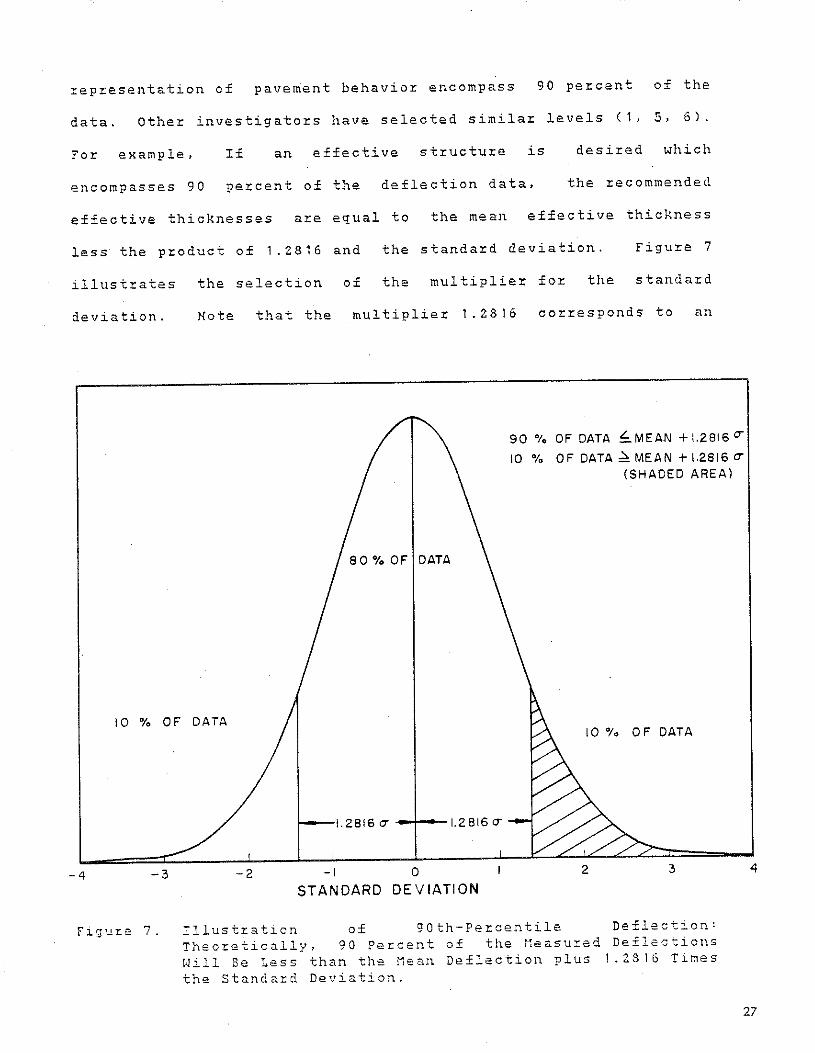
zep~esentation of pave~ent behavior encompass 90 percent of the
data. Other investigators have selected similar levels (1, 5, 6l.
For example, If an effective structure is desired which
encompasses 90 percent of the deflection data, the :recommended
effective thicknesses a:re equal to the mean effective thickness
less the p:roduct of 1.2816 and the standa:rd deviation. Figu:re 7
illustrates
deviation.
the selection of the multiplie:r fo:r the standa:rd
Note that the multiplie:r 1.2816 cor:responds to an
90 % OF DATA L MEAN + 1.2816 CT
10 % OF DATA.::,. MEAN + 1.2816 CT
(SHADED AREA)
10 % OF OATA
-4 -3
figure 7.
10 "to 0 F DATA
1.2816 CT -+--
-2 -1 0 2 3
STANDARD DEVIATION
Illustration of 90th-Percentile Deflection:
Theoretically, 90 Percent of the ~easured Deflections
Will Be Less than the Mean Deflection plus 1.2816 Times
the Standard Deviation.
4
27
80-pe~cent cumulative dist~ibution but ~esults in a 90th-
pe~centile effective thickness because one tail of the no~mal
dist~ibution is not included (13, 17).
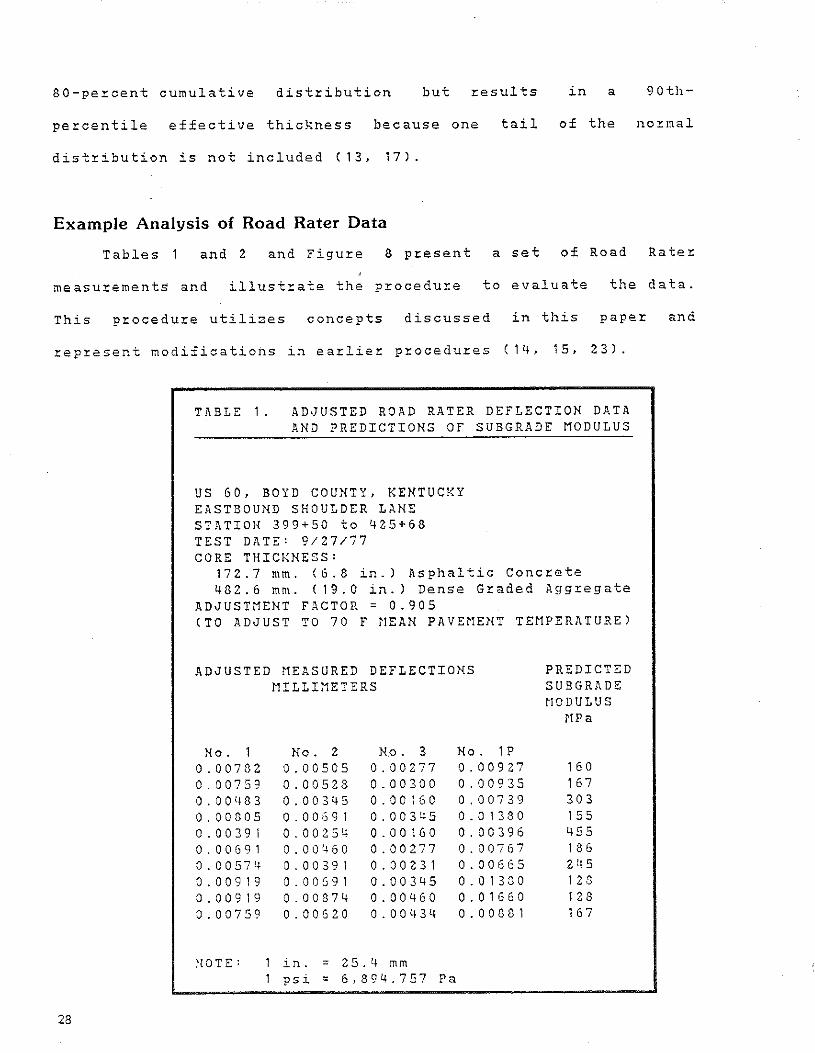
Example Analysis of Road Rater Data
Tables 1 and 2 and Figu~e 8 p~esent a set of Road Rate~
measu~ements and illust~ate the p~ocedu~e to evaluate the data.
This p~ocedu~e utilizes concepts discussed in this pape~ and
represent modifications in ea~lier procedures ( 14, 15, 23).
28
TABLE 1. ADJUSTED ROAD RATER DEFLECTION DATA AND PREDICTIONS OF SUBGRADE MODULUS
US 60, BOYD COUNTY, KENTUCKY EASTBOUND SHOULDER LANE STATION 399+50 to 425+68 TEST DATE: 9/27/77 CORE THICKNESS:
172.7 mm. (6.8 in.J Asphaltic Concrete 482.6 mm. ( 19.0 in.) Dense Graded Aggregate
ADJUSTMENT FACTOR = 0.905 (TO ADJUST TO 70 F MEAN PAVEMENT TEMPERATURE)
ADJUSTED MEASURED DEFLECTIONS MILLIMETERS
No. 0.00782 0.00759 0.00'183 0.00305 0.00391 0.00691 0.00574 0.00919 0.00919 0.00759
NOTE:
No. 2 0.00505 0. 00528 0.00345 0.00691 0.00254 0. 00460 0.00391 0.00691 0.00874 0.00620
No. 3 0. 00277 0.00300 0.00160 0.00345 0.00160 0. 00277 0.00231 0.00345 0.00460 0.00434
in. = 25.1~ mm psi= 6,894.757 Pa
No. 1 P 0.00927 0.00935 0.00739 0.01330 0.00396 0.00767 0.00665 0.01330 0.01660 0.00881
PREDICTED SU BGR.~DE ~IODULUS
rrP a
1 6 0 167 303 155 455 186 245 123 128 1 6 7
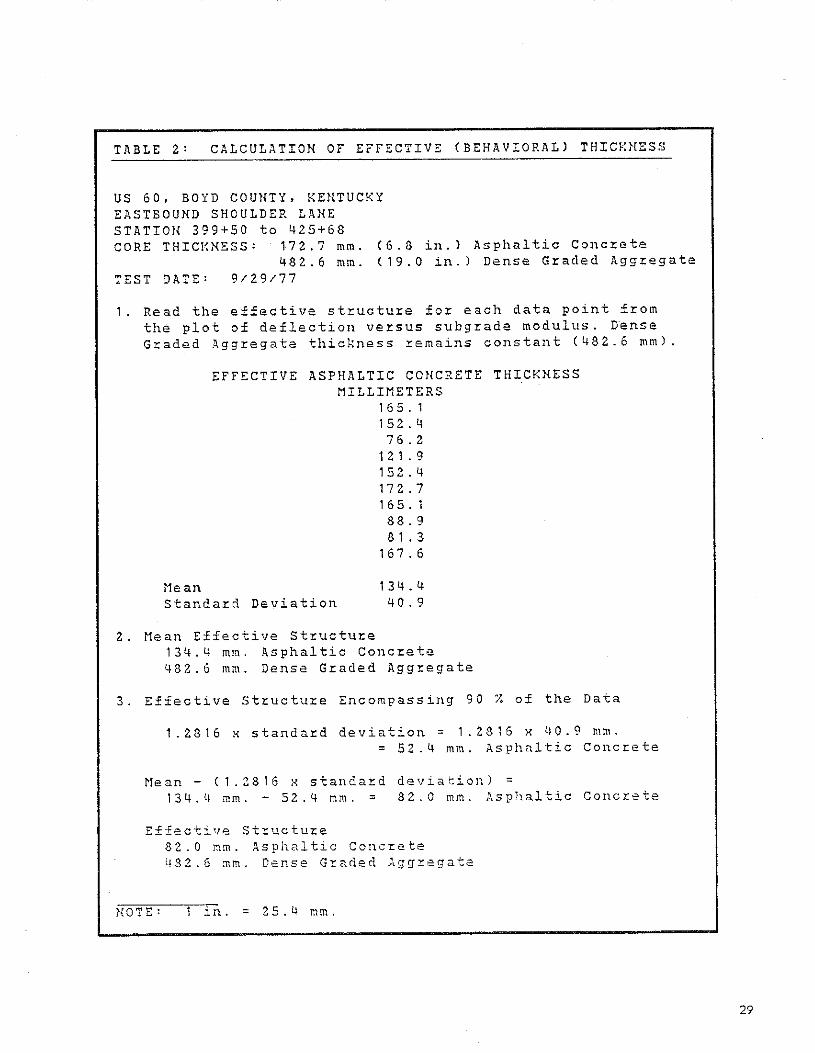
T.~BLE 2: CALCULATION OF EFFECTIVE (BEHAVIORAL) THICKNESS
US 60, BOYD COUHTY, KENTUCKY EASTBOUND SHOULDER LANE STATIOH 399+50 to 425+68 CORE THIC!;NESS: 172.7 mm. (6.8 in. J Asphaltic Conc:.:ete
(19.0 in.J Dense G:.:aded Agg:.:egate
TEST DATE: 482.6 mm.
9/29/77
1. Read the effective st:.:uctu:.:e fo:.: each data point f:.:om
the plot of deflection ve:.:sus subg:.:ade modulus. Dense G:.:aded Agg:.:egate thickness remains constant (482.6 mml.
Mean
EFFECTIVE ASPHALTIC CONCRETE THICKNESS MILLIMETERS
1 6 50 1 1 52 0 4 76.2
1 2 1 0 9 152.4 17 2 0 7 1 6 5 0 1 88.9 8 1 0 3
167.6
Standard Deviation 1 3 4 0 4 40.9
2. Mean Effective Structu:.:e 134.4 mm. Asphaltic Concrete 482.6 mm. Dense G:.:aded Aggregate
3. Effective St:.:uctu:.:e Encompassing 90 % of the Data
1.2816 K standard deviation= 1.2816 K 40.9 mm. = 52.4 mm. Asphaltic Conc:.:ete
Mean- (1.2816 x standard deviation) = 134.4 mm.- 52.4 mm. = 82.0 mm. Asphaltic Concrete
Effective St~uctuze
HOTE:
82.0 mm. Asphaltic Concrete 432.6 mm. Dense Graded Aggregate
1 in.= 25.4 mm.
29

<f)
w 6 ::t: u z
4 z 0 t-u w
2 _, "-w 0
a: 0 -3 <ll I 0 z w 8 <f)
6 0 z a: 4 w !:;: a:
0 2 .. 0 a:
104
NO.I PROJECTED DEFLECTION(MILLIMETERS) 4 6 8 10-2 2
E3 , SUSGRADE MODULUS I PASCALS)
2 4 6 7 8 9 10 8 2 4 6
US 60 BOYD CO. STATION 399 +50 TO 425 + 68 SHOULDER LANE TEST DATE 9/29/77 CORE THICKNESS: 172.7 mm (6.8 INCHESlAC
482.6mm 119.01NCHESlAC
NOTElCONVERSION FACTORS INCHES TO MILLIMETERS MULTIPLY BY 25-4
KSI TO PASCALS MULTIPLY BY 6.894757 x 10 6
NO.I DEFLECTION VS NO-I PROJECTED DEFLECTION -------..,Y
2
7
2000
in "' "' "' "' ::> "' _, z ::> ,_ 0 '-'"' 0 -w :; "'"' >-u u uz
"' ..:::
"' "' "' u z
"' "' ;;; ., "' "' ::> z _, "' ::>
0 u 0 'i: :; 1-
u u
"' "' 3
5 1000 --.}- 7~
2000 --..
4 6 8 104 2 4
E3,sUBGRADE MODULUS I PSI l
!0-1
8
6
4
2
IQ-2
8
6
4
10-4
NO.I 2
PROJECTED 4 6 8 I0-3
DEFLECTION (INCHES)
Figu~e 8.
30
Example Analysis of Road Rate~ Deflections: Subg~ade
Moduli P~edictions from Mo. 1 Deflections and Mo. 1
Projected Deflections; G~aph of Mo. 1 Deflections
ve~sus No. 1 Projected Deflections; and No. 1
Deflections ve~sus Subg~ade Moduli.
u; a: w t-w ::. :::; _, ::.
"' z 0 t-u w _, "-w 0
a: w !:;: a: 0 .. 0 a:
SUMMARY
The procedures for the evaluation of pavement performance and
condition p~esented in this paper utilize the concepts developed
and published in 1978 (14, 15, 2 3) . Since then, these concepts
and the associated procedure has been modified and simplified to
provide a more workable procedure.
A key to an adequate design of an overlay for any pavement
structure is to be able to determine reasonable values for design
parameters that represent the condition
The parameters considered in Kentucky's
of the eKisting pavement.
procedure include the in-
place subgrade modulus and the effective thickness of the existing
pavement structure at a specified reference modulus of elasticity
of the asphaltic concrete. The total thickness of an overlay is
equal
future
to the difference between
design level (based on
the thickness needed for some
tt:affic volumes and associated
equivalent axleloads and the in-place subgrade modulus (CBRll and
the effective thickness of the existing asphaltic concrete layers.
There is a need for continued research in this area as
highway maintenance becomes mo~e and more significant. As costs
continue to rise, the pressure to adequately assess the condition
of existing pavements increases.
31


ACKNOWLEDGEMENTS
Th~ conc~pts, data, and analys~s z~po~ted in this paper are a
result in pa~t of R~s~arch Study KYHPR-75-77, Development of a
Rational Ov~rlay Design Method for Pavements, and Research Study
KYHPR-70-49, Full-Depth Asphaltic Concrete Pavements, conducted as
a part of Wozk Program HPR-PL-1(15), Part II. funded in part by
the Fed~ral Highway Administration and by the Kentucky D~paztm~nt
of Transportation. The contents of the r~port r~fl~ct th~ vi~ws
of the authors who ar~ r~sponsible foz the facts and accuracy of
th~ data pz~sented. The contents do not nec~ssarily reflect th~
official v iet.Js oz polici~s of the Kentucky Department of
Tzansportation noz of the Federal Highway Administration. The
zeport do~s not constitute
z~gulation.
a standard, specification, oz
33


1 •
2.
3.
4.
5.
6.
7.
3.
REFERENCES
Bhazandes, A. c. Cumberledge, F. ; Hoffman, G . L. ; and
Hopkins, J. G. ; "A Practical Approach to Flexible Pavement
Evaluation and Rehabilitation," P:roc~edings, Fourth
International Confe1::ence, Structural Design of Asphalt
Pavements, University of Michigan, 1977.
Deen, R. C.; Southgate, H. F.; and Havens, J. H.; Structural
Analysis of Bituminous Concrete Pavements," Division of
Research, Kentucky Department of Highways, 1971.
Kinchen, R. w.; and Temple, w. H. ; "Asphaltic Concrete
Overlays of Rigid and Flexible Pavements," Louisiana
Department of Transportation and Development, September 1977.
Koole, R. c.; "Overlay Design Based on Falling Weight
De:Electometer Measurements," Record
Research Board, 1979.
Majidzadeh, " . ~. ' "Dynamic Deflection
700, Transportation
Study for Pavement
Condition Investigations,• Ohio Department of Transportation,
1974.
Majidzadeh, K.; "Pavement Condition Evaluation Utilizing
Dynamic Deflection Measurements," Ohio Department o:E
Transportation, June 1977.
Michelow, J. ; "Analy·ses of Stress and Displac~rnents in N-
Layered Elastic System under a Load Uniformily Distributed on
a Circular Area," Chevron Oil Research, unpublished,
September 24, 1963.
Moore, !~. M. ; Hanson, D. I. and Hall, J. w.; "An
Introducr::ion to Nondestructive Structural Evaluation of
35

9.
1 0 .
1 1 .
1 2 .
1 3.
1 4.
15.
1 6.
Pavements," Circular 1 8 9 ' Transportation Research Board,
January 1978.
"Pavement Investigation, City of Huntington Beach, CA,"
Project No. 10523, LaBelle Consultants, Santa Ana, CA, 1977.
Peterson, G. and Shepherd, 1. w. j ''Deflection Analysis of
Flexible Pavements,R Utah State Highway Department, January
1 9 7 2 •
Peterson, G.; RPredicting Performance of Pavements· by
Deflections,R Utah State Highway Department, May 1975.
Rufford, P. G.; RA Pavement Analysis and Structural Design
Procedure Based on Deflection," Proceedings, Fourth
Asphalt International Confe:r:ence, Structural Design of
Pavements, University of Michigan, 1977.
Schwar, J. F. ; and Puy-Huarte, J. RStatistical Methods in
Traffic Engineering,'' Department of Civil Engineering, The
Ohio State University, August 1967.
Sharpe, G. W.; Southgate, H. F.; and Deen, R. C.; "Pavement
Evaluation from Dynamic Deflections," Record 700,
T:t:anspo:t:tation Research Boa:t:d, 1979.
Sharpe, G. W.; Southgate, H. F. and Deen, R. C.; "Pavement
Evaluation Using Road Rater Deflections," Division of
Research, Kentucky Department of T:t:ansportation, August 1978.
Sharpe, G. w.; and Southgate, H. F.; "Road Rater and
Ben:.{elman Be am Pavement Deflections," Division of Research,
Kentucky Department of Transportation, June 1979.
17. Snedecor, G. W.; and Coch:r:an, W. G.; Sta-tistic.:t-1 Methods, The
Iowa State University P:t:ess, Sixth Edition, 1967.
36

18.
1 9 .
2 0.
2 1 .
22.
23
2 4.
25.
26.
Southgate, H. F. ; and De en, R. c.; "Deflection Behavior of
Asphaltic Concrete Pavements,'' Division of Research, Kentucky
Department of Transportation, January 1975.
Southgate, H. F.; Deen, R. C.; Havens, J. H.; and Drake, W.
B. ; "A Flexible Pavement Design and Management System,"
Proceedings, Fourth International Conference, Structural
Design of Asphalt Pavements, University of Michigan, 1977.
Southgate, H. F.; and Deen, R. C.; "Temperature Distribution
within Asphalt Pavements and Its Relationship to Pavement
Deflection," Record 291, Highway Research Boa:~:d, 1969.
Southgate, H. F. and Deen, R. C.; "Temperature Dist:~:ibution
within Asphalt Pavements," Reco:~:d Transportation
Resea:~:ch Boa:~:d, 1975.
Southgate, H. F.; Hewbe:~::~:y, D. c. Jr. ; Deen, R. c.; and
Havens, J. H. "Resu:~:facing, Resto:~:ation, and Rehabilitation
of Interstate Highways• C:~:iteria and Logic Used To Dete:~:mine
January 3, 1 9 7 7' Heeds and Estimates of Costs," Division of
Research, Kentucky Department of Transpo:~:tation, July 1977.
Southgate, H. F.; Sha:~:pe, G. W.; and Deen, R. C. "A Rational
Thickness Design System for Asphaltic Concrete Overlays,"
Record 700, Transportation Research Board, 1979.
Timoshenko, S .. P.; and Goodier, J. N.; Theory of Elasticity,
Third Edition, McG:~:aw-Hill Book Company, 1972.
Vaswani, N. " . " . ' "Design of Flexible Pavemen~s in Virginia
Using .i\.~SHO Road Test Results," Record zo 1, Highway Resea:~:ch
Boa:~:d, 1970.
Wiseman. G.; U~an. J. Hoffman, M. S. Ishai, I. and Livneh,
37

27.
23.
2 9 .
38
M. ; "Simple Elastic Models for Pavement Evaluation Using
Fourth
Asphalt
Measured Surface Deflection Bowls," Proceedings,
International Conference, Structural Design of
PavE>ments, University of tlichigan, 1977.
t.Jitczak, M. w.
to
"A Compa:rison of Layer Theory Design
.~pproaches Observed Asphalt Airfield Pavement
Performance,'' Proceedings, The Association of Asphalt Paving
Technologists, Vol 44, 1975.
Witczak, M. w. ; "Asphalt Pavement Performance at Baltimore-
Washington International Ai:r.:poz:t," The Asphalt Institute,
Research Report 74-2, 1974.
Yoder, E. J.; and \oli tc:oak, M. w. ; Princio1es of Pav~mont
Desiqn, Second Edition, John Wiley and Sons, Inc., 1975.