
Interplex presentation results_q4_fy15
10
0 Interplex Holdings Ltd 4QFY15
-
Upload
arzish-baaquie -
Category
Business
-
view
310 -
download
0
Transcript of Interplex presentation results_q4_fy15

0
Interplex Holdings Ltd4QFY15

1
Financial Performance

2
23.0
33.5
20.3 21.3 17.0
12.9 2.3 - 2.5 9.8
68.7
39.4
29.9
19.1 13.9
10.1
16.3 14.4 7.1
19.5
Automotive Networking andEnterprise Server
Enclosures
Industrial Products ConsumerElectronics
Mass Storage Imaging & Printing TelecommunicationsIndustrial Electronics Medical and LifeSciences
Others
4QFY14
4QFY15
21.6
93.7
41.3
169.5 14.2%
17.3%14.8%
17.5%
4Q YTDFY14 FY15 Gross Profit
Overview of 4QFY15 operating results
Revenue(US$M) (US$M)
Gross Profit
91%
81%
57%
53%
198%
187%
-8%
99%
47%
Discontinued Enclosures Business (US$9.4M)
-10%
-22%-18%
152.0
633.1
238.4
969.5
4Q YTDFY14 FY15

3
Revenue Breakdown by Industry Segment (FY15 vs FY14)
(In US$M)FY15 Revenue FY14 Revenue
13%
29%
12%8%
14%
14%
2%
1%
7%
Consumer Electronics
Networking and EnterpriseServers
Mass Storage
Imaging & Printing
Industrial Electronics
Industrial Products
Automotive
Medical and Life Sciences
Telecommunications
Others
8%
17%
7%
5%
6%
12%
26%
3%8%
8%

4
Overview of 4QFY15 operating results
Profit Before Tax (US$M) (US$M)
Profit After Tax
Note: NOI refers to net non-recurring items mainly related to gains from disposal of properties in Q4FY15 (FY15: mainly gains from disposal of properties and AFS investment offset by acquisition related professional fees). For FY14, NOI mainly related to acquisition related professional fees.NC relates to negative carry of interest expense for Jul 2014 (US$1.0M), affecting FY15 profits. (4QFY14 and FY14: US$3.0M)
6.3
13.4
29.1
55.7
(3.6)
8.0
(5.9)
1.9
1.8%
9.0%
3.7%
5.9%
4.2%
5.6%
4.6%5.7%
4QFY14 4QFY15 YTD FY14 YTD FY15
Normalised PBT NOI & NC
PBT Margin Normalised PBT Margin
5.7
10.3
23.9
42.5
(3.6)
8.0
(5.9)
1.9
1.3%
7.7%
2.8%
4.6%
3.7%
4.3%
3.8%
4.4%
4QFY14 4QFY15 YTD FY14 YTD FY15
Normalised PAT NOI & NC
PAT Margin Normalised PAT Margin

5
Profit and Loss Highlights
US$’M
4Q YTD
FY15 FY14 FY15 FY14
Revenue 238.4 152.0 969.5 633.1
Gross Profit 41.3 21.6 169.5 93.7
GP Margin 17.3% 14.2% 17.5% 14.8%
EBITDA 25.8 11.5 107.0 51.7
EBITDA Margin 10.8% 7.5% 11.0% 8.2%
Profit Before Tax 21.4 2.7 57.5 23.1
PBT Margin 9.0% 1.8% 5.9% 3.7%
Profit After Tax 18.3 2.0 44.4 17.9
PAT Margin 7.7% 1.3% 4.6% 2.8%
Earnings per share (US cts)
- Basic 3.3 0.3 8.0 3.2
- Diluted 3.2 0.3 7.8 3.2

6
Balance Sheet Highlights
US$M As at 30 June 2015 As at 30 Jun 2014
Total assets 834.9 600.3
Inventories 91.8 48.4
Trade receivables 217.7 140.0
Cash & cash equivalents, net of o/d 104.2 229.2
Non-current assets 366.7 152.8
Total liabilities (640.5) (423.3)
Total Debt (303.1) (261.8)
Non-current liabilities # (225.2) (168.3)
Total equity 194.4 177.0
Net Debt (198.9) (32.6)
#Includes non-current portion of loans and borrowings and finance lease obligations
@The figures presented above represent salient information from the Balance Sheet and will not sum downwards

7
Cash Flows Highlights
Note: Figures above may not sum downwards due to rounding.
US$’M 4QFY15 4QFY14 YTD FY15 YTD FY14
Cash generated from operations 29.2 10.1 86.1 65.1
Net cash generated from operatingactivities
20.7 7.1 54.2 53.6
Net cash generated from/ (used in) investing activities
(0.6) (6.0) (165.6) (26.2)
Net cash (used in)/ generated from financing activities
(18.6) 41.7 0.3 109.3
Net effect of exchange rate changes 2.7 1.5 (13.9) (0.7)
Net change in cash & cash equivalents 4.2 44.3 (125.0) 136.1
Beginning cash and cash equivalents 100.0 184.9 229.2 93.1
Ending cash and cash equivalents 104.2 229.2 104.2 229.2
8
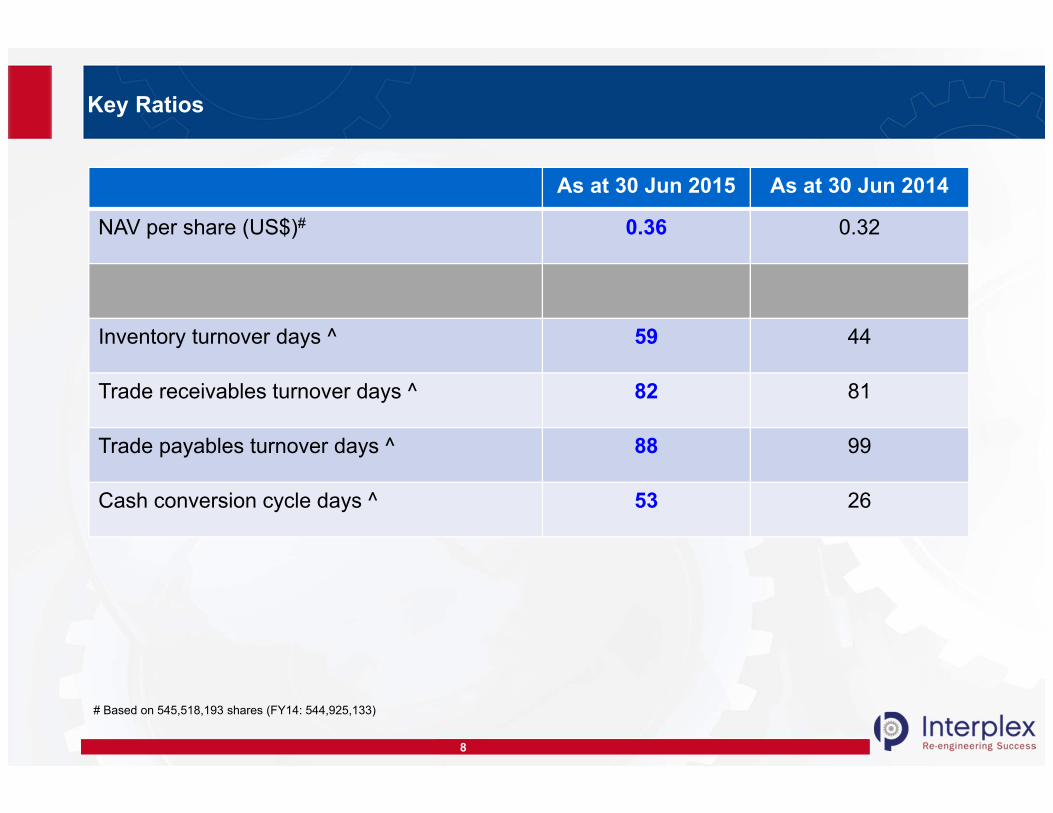
Key Ratios
As at 30 Jun 2015 As at 30 Jun 2014
NAV per share (US$)# 0.36 0.32
Inventory turnover days ^ 59 44
Trade receivables turnover days ^ 82 81
Trade payables turnover days ^ 88 99
Cash conversion cycle days ^ 53 26
# Based on 545,518,193 shares (FY14: 544,925,133)
9
Thank You