Interplay between Hydration Water and Headgroup Dynamics...
8
Published: February 8, 2011 r2011 American Chemical Society 1825 dx.doi.org/10.1021/jp110899j | J. Phys. Chem. B 2011, 115, 1825–1832 ARTICLE pubs.acs.org/JPCB Interplay between Hydration Water and Headgroup Dynamics in Lipid Bilayers P. Berntsen,* ,† C. Svanberg, ‡ and J. Swenson* ,† † Department of Applied Physics, Chalmers University of Technology, SE-412 96 G€ oteborg, Sweden ‡ Borealis Innovation Center, Industriv € agen, SE-444 86 Stenungsund, Sweden ABSTRACT: In this study, the interplay between water and lipid dynamics has been investigated by broadband dielectric spectroscopy and modulated differential scanning calorimetry (MDSC). The multilamellar lipid bilayer system 1,2-dimyr- istoyl-sn-glycero-3-phosphocholine (DMPC) has been stu- died over a broad temperature range at three different water contents: about 3, 6, and 9 water molecules per lipid molecule. The results from the dielectric relaxation measurements show that at temperatures <250 K the lipid headgroup rotation is described by a super-Arrhenius temperature dependence at the lowest hydration level and by the Arrhenius law at the highest hydration level. This difference in the temperature dependence of the lipid headgroup rotation can be explained by the increasing interaction between the headgroups with decreasing water content, which causes their rotational motion to be more cooperative in character. The main water relaxation shows an anomalous dependence on the water content in the supercooled and glassy regime. In contrast to the general behavior of interfacial water, the water dynamics is fastest in the driest sample and its temperature dependence is best described by a super-Arrhenius temperature dependence. The best explanation for this anomalous behavior is that the water relaxation becomes more determined by fast local lipid motions than by the intrinsic water dynamics at low water contents. In support for this interpretation is the finding that the relaxation time of the main water process is faster than that in most other host systems at temperatures below 180 K. Thus, the dielectric relaxation data show clearly the strong interplay between water and lipid dynamics; the water influences the lipid dynamics and vice versa. In the MDSC data, we observe a weak enthalpy relaxation at 203 K for the driest sample and at 179 K for the most hydrated sample, attributed to the freezing-in of the lipid headgroup rotation observed in the dielectric data, since this motion reaches a time scale of about 100 s at about the same temperatures. ’ INTRODUCTION Biomembranes, phospholipid bilayers that form the bound- aries of cells, exhibit a fluidity that is dependent on the amount of hydration water. 1,2 Of particular interest are the viscoelastic properties of biomembranes, as they have consequences for the morphology and dynamics of the cell. 3,4 While biological func- tion is primarily associated with the fully hydrated form of biological membranes, the less hydrated states are highly relevant for cryopreservation of biological membranes and cells, which is of practical and industrial importance in, e.g., clinical medicine, pharmacology, food science, 5 and the preservation of embryos for test tube fertilization. 6 Investigations of the dehydrated states give us the possibility to better understand how water affects its nearest surroundings and the interplay between water molecules and the biological surface. Because of the complexity of biological membranes, simpler model membranes containing one type of phospholipid molecule or a simple mixture of lipid molecules are generally studied. An example of such phospholipids is phosphatidycholine which consists of a polar headgroup region and hydrophobic acyl chains, which together are the driving force for self-assembly into multilamellar structures consisting of lipid bilayers and interlayer water. 7 The dynamics of model membranes of phospholipids and the associated water has been probed by experimental techniques such as NMR, 8 quasi-elastic neutron scattering (QENS), 9-11 dynamic light scattering, 12 dielectric spectroscopy, 13-21 and ultra- sonic spectroscopy. 22 Computer simulations have also improved our understanding of the structure and dynamics at different hydration levels, 2 temperatures, and phase configurations 23,24 and of the structural and dynamical hydrogen bonding features at the lipid-water interface. 25 These studies highlight the wide variation in dynamics of hydrated lipid membranes that include several dif- ferent types of processes, such as fast diffusion of water molecules, rotation of the lipid heads, segmental motion of the lipid tails, and 2D translational diffusion of lipids within the layers. A full under- standing of the important relation between lipid and solvent Received: November 15, 2010 Revised: January 11, 2011
Transcript of Interplay between Hydration Water and Headgroup Dynamics...

Published: February 8, 2011
r 2011 American Chemical Society 1825 dx.doi.org/10.1021/jp110899j | J. Phys. Chem. B 2011, 115, 1825–1832
ARTICLE
pubs.acs.org/JPCB
Interplay between Hydration Water and Headgroup Dynamicsin Lipid BilayersP. Berntsen,*,† C. Svanberg,‡ and J. Swenson*,†
†Department of Applied Physics, Chalmers University of Technology, SE-412 96 G€oteborg, Sweden‡Borealis Innovation Center, Industriv€agen, SE-444 86 Stenungsund, Sweden
ABSTRACT: In this study, the interplay between water andlipid dynamics has been investigated by broadband dielectricspectroscopy and modulated differential scanning calorimetry(MDSC). The multilamellar lipid bilayer system 1,2-dimyr-istoyl-sn-glycero-3-phosphocholine (DMPC) has been stu-died over a broad temperature range at three different watercontents: about 3, 6, and 9 water molecules per lipid molecule.The results from the dielectric relaxation measurements showthat at temperatures <250 K the lipid headgroup rotation isdescribed by a super-Arrhenius temperature dependence atthe lowest hydration level and by the Arrhenius law at the highest hydration level. This difference in the temperature dependence ofthe lipid headgroup rotation can be explained by the increasing interaction between the headgroups with decreasing water content,which causes their rotational motion to be more cooperative in character. The main water relaxation shows an anomalousdependence on the water content in the supercooled and glassy regime. In contrast to the general behavior of interfacial water, thewater dynamics is fastest in the driest sample and its temperature dependence is best described by a super-Arrhenius temperaturedependence. The best explanation for this anomalous behavior is that the water relaxation becomes more determined by fast locallipid motions than by the intrinsic water dynamics at low water contents. In support for this interpretation is the finding that therelaxation time of the main water process is faster than that in most other host systems at temperatures below 180 K. Thus, thedielectric relaxation data show clearly the strong interplay between water and lipid dynamics; the water influences the lipid dynamicsand vice versa. In the MDSC data, we observe a weak enthalpy relaxation at 203 K for the driest sample and at 179 K for the mosthydrated sample, attributed to the freezing-in of the lipid headgroup rotation observed in the dielectric data, since this motionreaches a time scale of about 100 s at about the same temperatures.
’ INTRODUCTION
Biomembranes, phospholipid bilayers that form the bound-aries of cells, exhibit a fluidity that is dependent on the amount ofhydration water.1,2 Of particular interest are the viscoelasticproperties of biomembranes, as they have consequences for themorphology and dynamics of the cell.3,4 While biological func-tion is primarily associated with the fully hydrated form ofbiological membranes, the less hydrated states are highly relevantfor cryopreservation of biological membranes and cells, which isof practical and industrial importance in, e.g., clinical medicine,pharmacology, food science,5 and the preservation of embryosfor test tube fertilization.6
Investigations of the dehydrated states give us the possibilityto better understand how water affects its nearest surroundingsand the interplay between water molecules and the biologicalsurface. Because of the complexity of biological membranes,simpler model membranes containing one type of phospholipidmolecule or a simple mixture of lipid molecules are generallystudied. An example of such phospholipids is phosphatidycholinewhich consists of a polar headgroup region and hydrophobic acylchains, which together are the driving force for self-assembly into
multilamellar structures consisting of lipid bilayers and interlayerwater.7
The dynamics of model membranes of phospholipids and theassociated water has been probed by experimental techniquessuch as NMR,8 quasi-elastic neutron scattering (QENS),9-11
dynamic light scattering,12 dielectric spectroscopy,13-21 and ultra-sonic spectroscopy.22 Computer simulations have also improvedour understanding of the structure and dynamics at differenthydration levels,2 temperatures, and phase configurations23,24 andof the structural and dynamical hydrogen bonding features at thelipid-water interface.25 These studies highlight the wide variationin dynamics of hydrated lipid membranes that include several dif-ferent types of processes, such as fast diffusion of water molecules,rotation of the lipid heads, segmental motion of the lipid tails, and2D translational diffusion of lipids within the layers. A full under-standing of the important relation between lipid and solvent
Received: November 15, 2010Revised: January 11, 2011

1826 dx.doi.org/10.1021/jp110899j |J. Phys. Chem. B 2011, 115, 1825–1832
The Journal of Physical Chemistry B ARTICLE
dynamics from the glassy state up to ambient temperatures is,however, lacking.
In this work, we have used broadband dielectric spectroscopy(BDS) and modulated differential scanning calorimetry (MDSC)to study the water and lipid dynamics of multilamellar membranesat low hydration levels from glassy temperatures up to physiologicaltemperatures. The phospholipid we have used is dimyristoyl-phosphocholine (DMPC) (see Figure 1). It is naturally found inbiological membranes such as the cellular plasma membrane andconsists of two saturated C14 carbon acids connected to a dipolarheadgroup.26Dielectric spectroscopy is awell suitedmethod for theinvestigation of polar materials, and it covers a large dynamicalrange from ps up to several minutes. It provides important dyna-mical information, such as relaxation times and activation energiesof relaxation and charge transport processes.MDSCmeasurementsprovide information of thermal events as a function of time andtemperature in materials which involve endothermic or exothermicprocesses, or changes in heat capacity. Here, we focus on the waterand lipid dynamics at low temperatures, since it is of importance toexplore the nature of a possible glass-like behavior of lipidmembranes and to what extent water affects this behavior. More-over, it is of interest to extend previous dielectric measurements onsupercooled water in different types of host materials21,27-30 tounderstand how the dynamics of supercooled confined waterdepends on the structure and the hydrophilic/hydrophobic char-acter of its nearest environment.31,32
’EXPERIMENTAL METHODS
To achieve a supported phospholipid multibilayer system,the approach described in ref 33 was followed. A 10mg portion of1,2-dimyristoyl-sn-glycero-3-phosphocholine, molecular weight677.93 (DMPC, Avanti Polar Lipids), was dissolved in 1 mL ofisopropanol. Repeatedly, 0.05-0.1 mL of the suspension wasdeposited until the whole suspension had evaporated on cleanedbrass electrodes for the dielectric measurements and in a pan forthe MDSC measurements. The membrane films were temperedaround the gel-fluid transition temperature to anneal defectsand to get a better alignment of the lipids. To remove residualsolvent, the samples were placed under a vacuum (10-3 mbar)for 2-3 h. Partially hydrated DMPCmultilayers were preparedthrough vapor phase equilibrium, by storing the vacuumpumped samples at 298 K in sealed desiccators with saturatedMilli-Q water salt solutions for 2-3 days. Relative humiditieswere 75% (NaCl) and 84% (KCl)34 and water absorption0.08 and 0.16 g of water/g of lipid. A basically dry sample wasalso prepared by putting the sample under a vacuum overnight.The samples are referred to as H0, H75, and H84 in the text,and they contain approximately 3, 6, and 9 water moleculesper lipid molecule, respectively. Thus, even the vacuum-driedH0 sample contains some base water. These water moleculesare hydrogen bonded to lipid oxygen atoms and diffuse slowlybetween the oxygen atoms of the phosphate and the oxygenatoms double bonded to carbon atoms (see Figure 1).25
Additional hydration water is located around the cholinegroup-N(CH3)3 (see Figure 1) for moderate hydration levelsand finally in the interlayer region for the highest hydrationlevels.25,35
MDSC Measurements. The modulated differential scanningcalorimetry (MDSC) experiments were performed using a TAQ1000 thermal analyzer. This technique is an extension of con-ventional DSC, where a sinusoidal wave modulation is super-positioned on a linear temperature ramp; see, e.g., ref 36. Thisenables a separation of thermal events and transitions into“kinetic” and “heat capacity” responses of the measured sample.The reversing component in MDSC experiment is related tothe sample’s heat capacity; a glass transition event is detected inthe reversing heat flow. On the other hand, processes such asenthalpic relaxation, crystallization, evaporation, decomposition,and cure are resolved into the kinetic component or nonreversingheat flow. For a melting transition, the interpretation is notstraightforward. Melting can occur in the reversing heat flow aswell as in the nonreversing heat flow, and moreover, the relativecontribution of these components depends on the experi-mental conditions (underlying heating rate, modulation period,modulation amplitude, sample thickness). Hermetically sealedpans were used for the samples and with an empty pan as thereference. The MDSC experiments were performed in a heatonly temperature-modulation procedure starting at 100 K andthen heated to 283 K, with a ramp rate of 2 K/min and atemperature modulation of(0.32 K every 60 s. The sample panwas quenched in liquid nitrogen before the MDSC heating scanwas started.Dielectric Relaxation Measurements. The experiments
were performed using an Alpha-S high resolution dielectric spec-trometer from Novocontrol over the frequencies 10-2-107 Hzusing electrodes with a diameter of 20 mm. Isothermal frequencyscans of the complex dielectric function ε*(ω) = ε0(ω)- iε00(ω)were performed from 130 up to 310 K in steps of 2 or 5 K,depending on the temperature. Prior to the dielectric experi-ments, the samples were quenched down to 77 K by submergingthem into a liquid nitrogen bath in order to minimize crystal-lization of the water. The exact thickness of each sample is notknown, and therefore, we will refrain from discussing theamplitudes of the processes.One conductivity/polarization term and a sum of Havriliak-
Negami functions were used to fit the imaginary part of thedielectric function ε00(ω):
ε00ðωÞ ¼ σ
ε0ω
� �s
þX
ImΔε
ð1þ ðiωτÞRÞβ" #
ð1Þ
The first term on the right-hand side of eq 1 quantifies the dcconductictivity and polarization effects in terms of ε00(ω) by thefit parameters σ and s; s = 1 for pure dc conductivity and s < 1when also polarization effects contribute. The conductivity termis visible as an increase in ε00 toward low frequencies. ε0 is thevacuum permittivity. τ is the relaxation time (the inverse of therelaxation rate), and Δε is the relaxation strength of a givenrelaxation process. The exponents R and β [0 < R, βe 1] definethe symmetrical and asymmetrical broadening, respectively,of the dielectric loss peaks compared to a Debye peak [R =β = 1].The main structural relaxation, or the so-called R process in
viscous liquids, is closely linked to the glass transition and hasa non-Arrhenius temperature dependence that is generally
Figure 1. Schematic picture of the 1,2-dimyristoyl-sn-glycero-3-phos-phocholine (DMPC) molecule.
1827 dx.doi.org/10.1021/jp110899j |J. Phys. Chem. B 2011, 115, 1825–1832
The Journal of Physical Chemistry B ARTICLE
described by the Vogel-Fulcher-Tamman equation37-39
τ ¼ τ0 expDT0
T - T0
� �ðT0<TÞ ð2Þ
This equation gives an activation energy which increases oncooling, i.e., a super-Arrhenius temperature dependence, and arelaxation time which becomes infinite at T0. τ0 is the relaxationtime in the high temperature limit, usually 10-14-10-13 s, corre-sponding to a typical molecular vibration time. D is the so-calledfragility index which determines the deviation from an Arrheniustemperature dependence. A smaller D value corresponds to alarger deviation from the well-known Arrhenius behavior
τ ¼ τ0 expEkbT
� �ð3Þ
which gives the relaxation time at the temperatureT by τ0 and theactivation energy E of an ordinary thermally activated process.The Arrhenius law is commonly used to describe the temperaturedependence of noncooperative secondary (β) relaxations.40
’RESULTS
Thermal Events with MDSC. In Figure 2, we show theMDSC data of the H0 and H84 samples, respectively. In orderto have a reliable Fourier deconvolution in MDSC, one needs atleast four cycles of the modulation during the transition (full widthat half-maximum of the peak).36 For the narrow peaks shown inFigure 2, we are far from reaching this criterion. Therefore, we donot get reliable results in the reversing and nonreversing heat flow.However, the data for the total heat flow should be reliable andtherefore used in the case of the narrow peaks.The MDSC scan of the H0 sample (see Figure 2A) is rather
featureless except for a small endothermic event at 203 K in thetotal heat flow, also observed in the reversing component, whichis an indication that this thermal event probably is due to thesame kind of enthalpy relaxation of the lipids when the time scaleof the associated relaxation process reaches the experimentaltime scale upon reheating.The higher hydration level of the H84 sample (see Figure 2B)
results in anMDSC scan with two endotherms at 131 and 179 K,which we interpret as enthalphy relaxations from water and lipidmolecules, respectively. The weak exothermic feature at 215 K islikely a result of small rearrangements of amorphous structure toa crystalline structure before themain endothermic feature sets inat about 220 K. This main event continues to 236 K, and it fulfillsthe four-cycle criterion to distinguish between reversing andnonreversing signals. A small step can be observed in the heatcapacity related reversing term, but the main component of thisevent is kinetic nonreversing, probably due to some kind ofmelting. The small exothermic feature at 273 K may be an over-lapping phenomena such as a structural recovery of the lipids thatfollows from passing the melting of a small amount of surfacewater on the lipid sample. All the observed thermal events arepresented in Table 1.Dielectric Relaxation Data. Dielectric loss spectra at se-
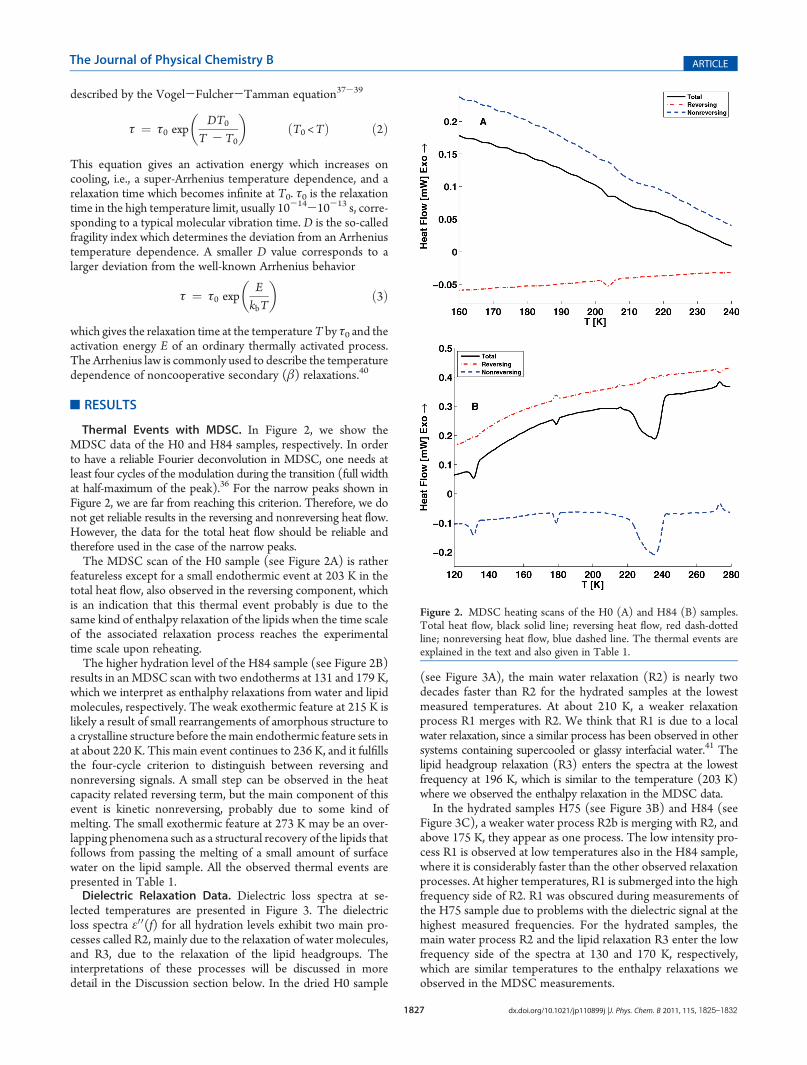
lected temperatures are presented in Figure 3. The dielectricloss spectra ε00(f) for all hydration levels exhibit two main pro-cesses called R2, mainly due to the relaxation of water molecules,and R3, due to the relaxation of the lipid headgroups. Theinterpretations of these processes will be discussed in moredetail in the Discussion section below. In the dried H0 sample
(see Figure 3A), the main water relaxation (R2) is nearly twodecades faster than R2 for the hydrated samples at the lowestmeasured temperatures. At about 210 K, a weaker relaxationprocess R1 merges with R2. We think that R1 is due to a localwater relaxation, since a similar process has been observed in othersystems containing supercooled or glassy interfacial water.41 Thelipid headgroup relaxation (R3) enters the spectra at the lowestfrequency at 196 K, which is similar to the temperature (203 K)where we observed the enthalpy relaxation in the MDSC data.In the hydrated samples H75 (see Figure 3B) and H84 (see
Figure 3C), a weaker water process R2b is merging with R2, andabove 175 K, they appear as one process. The low intensity pro-cess R1 is observed at low temperatures also in the H84 sample,where it is considerably faster than the other observed relaxationprocesses. At higher temperatures, R1 is submerged into the highfrequency side of R2. R1 was obscured during measurements ofthe H75 sample due to problems with the dielectric signal at thehighest measured frequencies. For the hydrated samples, themain water process R2 and the lipid relaxation R3 enter the lowfrequency side of the spectra at 130 and 170 K, respectively,which are similar temperatures to the enthalpy relaxations weobserved in the MDSC measurements.
Figure 2. MDSC heating scans of the H0 (A) and H84 (B) samples.Total heat flow, black solid line; reversing heat flow, red dash-dottedline; nonreversing heat flow, blue dashed line. The thermal events areexplained in the text and also given in Table 1.
1828 dx.doi.org/10.1021/jp110899j |J. Phys. Chem. B 2011, 115, 1825–1832
The Journal of Physical Chemistry B ARTICLE
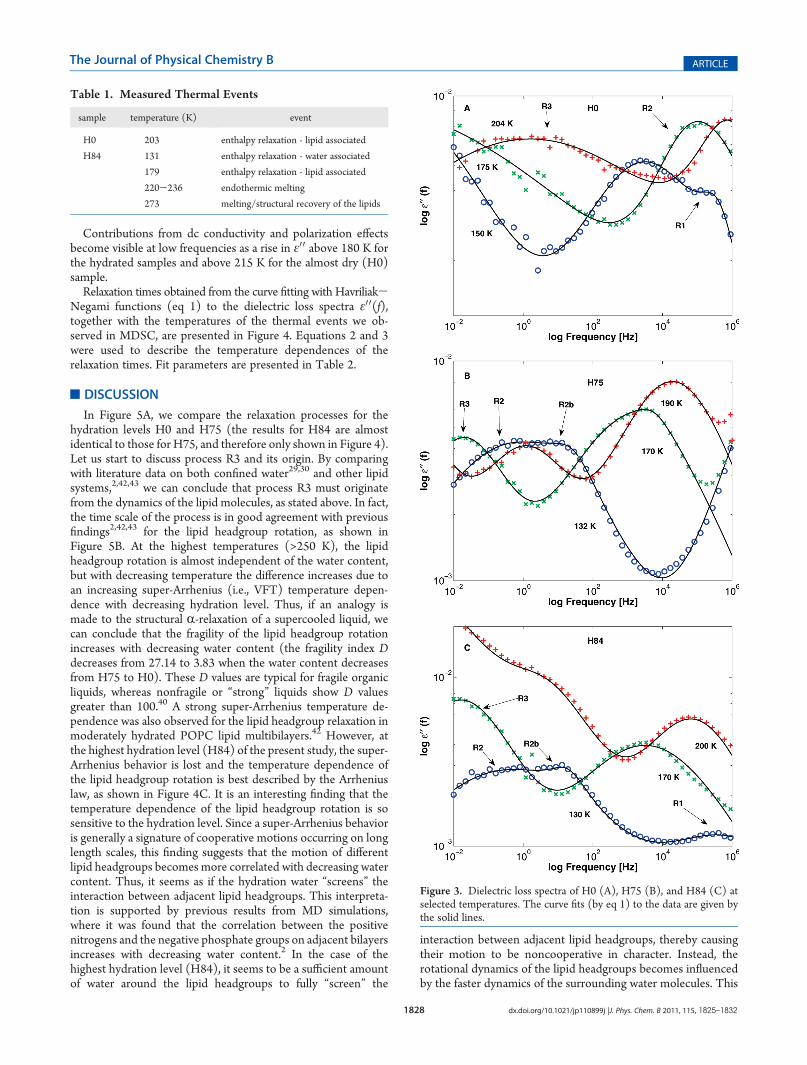
Contributions from dc conductivity and polarization effectsbecome visible at low frequencies as a rise in ε00 above 180 K forthe hydrated samples and above 215 K for the almost dry (H0)sample.Relaxation times obtained from the curve fitting with Havriliak-
Negami functions (eq 1) to the dielectric loss spectra ε00(f),together with the temperatures of the thermal events we ob-served in MDSC, are presented in Figure 4. Equations 2 and 3were used to describe the temperature dependences of therelaxation times. Fit parameters are presented in Table 2.
’DISCUSSION
In Figure 5A, we compare the relaxation processes for thehydration levels H0 and H75 (the results for H84 are almostidentical to those for H75, and therefore only shown in Figure 4).Let us start to discuss process R3 and its origin. By comparingwith literature data on both confined water29,30 and other lipidsystems,2,42,43 we can conclude that process R3 must originatefrom the dynamics of the lipid molecules, as stated above. In fact,the time scale of the process is in good agreement with previousfindings2,42,43 for the lipid headgroup rotation, as shown inFigure 5B. At the highest temperatures (>250 K), the lipidheadgroup rotation is almost independent of the water content,but with decreasing temperature the difference increases due toan increasing super-Arrhenius (i.e., VFT) temperature depen-dence with decreasing hydration level. Thus, if an analogy ismade to the structural R-relaxation of a supercooled liquid, wecan conclude that the fragility of the lipid headgroup rotationincreases with decreasing water content (the fragility index Ddecreases from 27.14 to 3.83 when the water content decreasesfrom H75 to H0). These D values are typical for fragile organicliquids, whereas nonfragile or “strong” liquids show D valuesgreater than 100.40 A strong super-Arrhenius temperature de-pendence was also observed for the lipid headgroup relaxation inmoderately hydrated POPC lipid multibilayers.42 However, atthe highest hydration level (H84) of the present study, the super-Arrhenius behavior is lost and the temperature dependence ofthe lipid headgroup rotation is best described by the Arrheniuslaw, as shown in Figure 4C. It is an interesting finding that thetemperature dependence of the lipid headgroup rotation is sosensitive to the hydration level. Since a super-Arrhenius behavioris generally a signature of cooperative motions occurring on longlength scales, this finding suggests that the motion of differentlipid headgroups becomes more correlated with decreasing watercontent. Thus, it seems as if the hydration water “screens” theinteraction between adjacent lipid headgroups. This interpreta-tion is supported by previous results from MD simulations,where it was found that the correlation between the positivenitrogens and the negative phosphate groups on adjacent bilayersincreases with decreasing water content.2 In the case of thehighest hydration level (H84), it seems to be a sufficient amountof water around the lipid headgroups to fully “screen” the
interaction between adjacent lipid headgroups, thereby causingtheir motion to be noncooperative in character. Instead, therotational dynamics of the lipid headgroups becomes influencedby the faster dynamics of the surrounding water molecules. This
Figure 3. Dielectric loss spectra of H0 (A), H75 (B), and H84 (C) atselected temperatures. The curve fits (by eq 1) to the data are given bythe solid lines.
Table 1. Measured Thermal Events
sample temperature (K) event
H0 203 enthalpy relaxation - lipid associated
H84 131 enthalpy relaxation - water associated
179 enthalpy relaxation - lipid associated
220-236 endothermic melting
273 melting/structural recovery of the lipids

1829 dx.doi.org/10.1021/jp110899j |J. Phys. Chem. B 2011, 115, 1825–1832
The Journal of Physical Chemistry B ARTICLE
prominent role of the hydration water on the headgroupdynamics is supported by recent neutron scattering investi-gations.44
The water content of planar lipid bilayers also has a moregeneral effect on the dynamical properties of the membrane. Ithas been shown2,45 that the elasticity of lipid bilayers increaseswith increasing hydration level. This can possibly be related to arecent finding that soft deformable colloids make strong colloidalglasses.46 The fragility of deformable colloid particles was shownto be dictated by elastic properties on the scale of individualcolloidal particles.46 Thus, an analogy with colloids can be made;highly hydrated lipid membranes should behave as strong glassformers, whereas dehydrated lipid membranes should exhibit afragile behavior; i.e., the hydration water controls both theelasticity and the fragility of the lipid bilayer systems. This issupported by the observed hydration dependence of the lipidheadgroup rotation, although it is not evident that the headgrouprotation should be directly related to the glass transition of thelipid membrane. The enthalpy relaxation observed at 179 and203 K in the MDSC data of the H84 and H0 samples, respec-tively, is likely due to the freezing-in (on a time scale of 100 s,which is commonly used to define the dynamic glass transition)of the lipid headgroup dynamics, since this occurs at similartemperatures in the dielectric relaxation data. However, whetherthis enthalpy relaxation of the lipid headgroups should beassociated with a true glass transition (i.e., the freezing-in of aviscosity related structural R-relaxation) or the freezing-in of amore local relaxation process cannot be established in this study.However, a recent calorimetric study by Shalaev et al.47 suggeststhat the true Tg of such a low hydrated DMPC is located as highas around 340 K, which would imply that the calorimetric Tg
cannot be associated with the freezing-in of lipid headgroupdynamics. Rather, the highTg suggests that it should be related tothe freezing-in of slow cooperative motions involving severallipid molecules.
Let us now discuss the observed water dynamics in the lipidbilayers. Due to the large dielectric constant of water, dielectricprocesses due to reorientational motions of water molecules aregenerally easily observed even for a very small fraction of water inthe system. Therefore, we interpret R2 and R2b to be caused bythe main relaxation of water molecules with slightly different
Figure 4. Arrhenius plot of the temperature dependent relaxation timesobtained from the curve fitting of the dielectric loss data presented inFigure 3 showing the temperature dependences of the processesobserved in the H0, H75, and H84 samples, respectively. The tempera-ture dependences are described by eq 2 or 3 (dashed lines). Fitparameters are presented in Table 2. Vertical lines mark the thermalevents observed in the MDSC measurements.
Table 2. Fit Parameters from eqs 2 and 3 Describingthe Temperature Dependences of the Relaxation TimesPresented in Figure 4
τ0 E (eV) T0 (K) D
H0
R1 2.3� 10-9 0.07
R2 9.0� 10-11 77.8 12.13
R3 7.8� 10-9 166 3.83
H75
R2 7.8� 10-13 43.7 53.8
R2b 1.7� 10-13 0.28
R3 2.5� 10-12 90.8 27.14
H84
R1 2.6� 10-8 0.023
R2 2.5� 10-11 67.3 22.3
R2b 1.4� 10-13 0.28
R3 6.3� 10-18 0.62
1830 dx.doi.org/10.1021/jp110899j |J. Phys. Chem. B 2011, 115, 1825–1832
The Journal of Physical Chemistry B ARTICLE
local environments, as discussed below. Also, R1 is most likely aresult of local water dynamics, as a similar process has beenobserved in other water containing systems.41
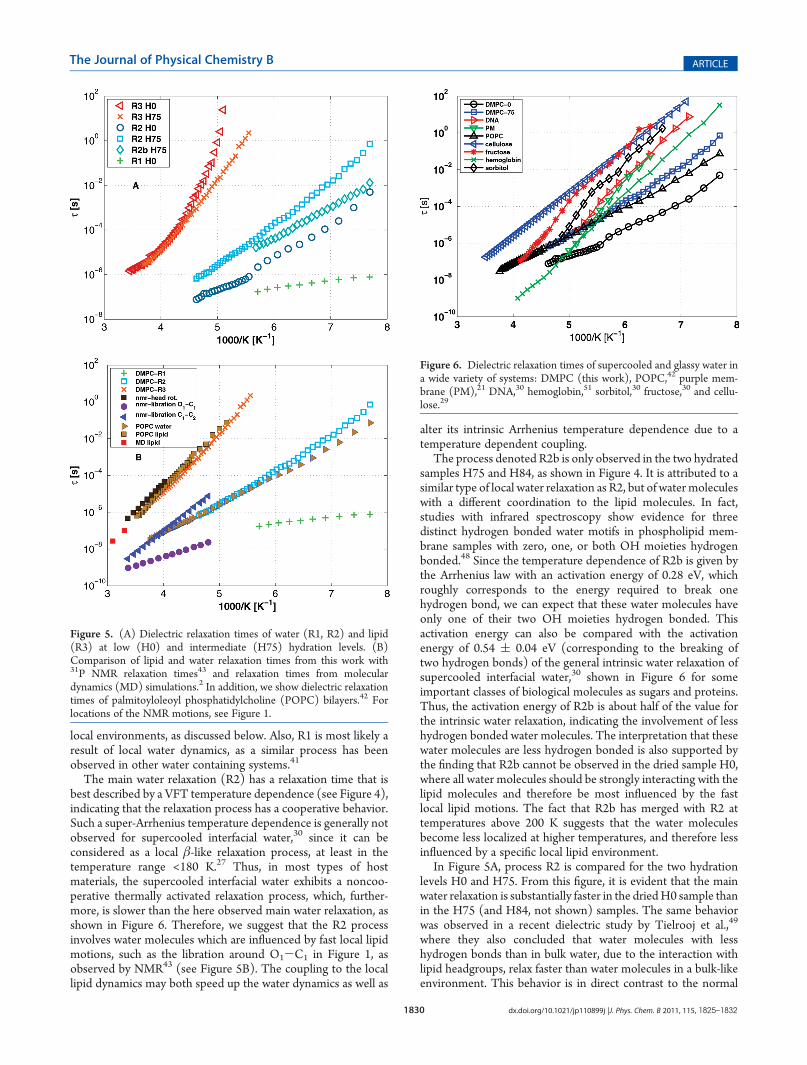
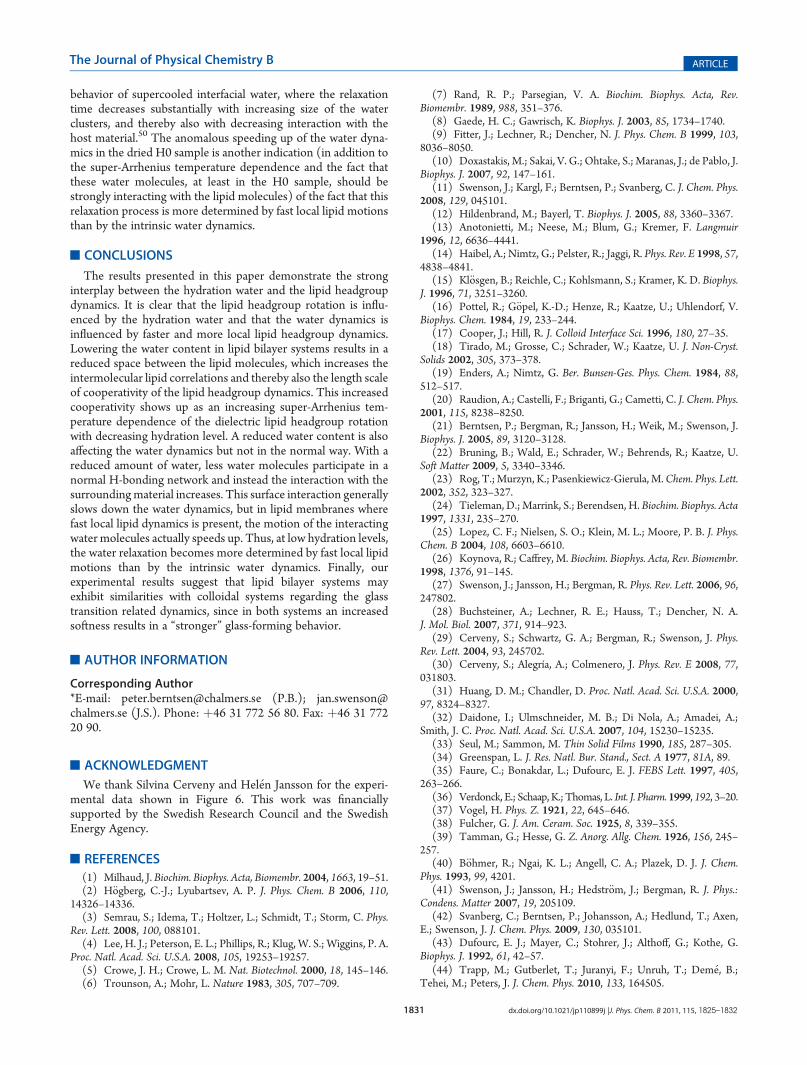
The main water relaxation (R2) has a relaxation time that isbest described by a VFT temperature dependence (see Figure 4),indicating that the relaxation process has a cooperative behavior.Such a super-Arrhenius temperature dependence is generally notobserved for supercooled interfacial water,30 since it can beconsidered as a local β-like relaxation process, at least in thetemperature range <180 K.27 Thus, in most types of hostmaterials, the supercooled interfacial water exhibits a noncoo-perative thermally activated relaxation process, which, further-more, is slower than the here observed main water relaxation, asshown in Figure 6. Therefore, we suggest that the R2 processinvolves water molecules which are influenced by fast local lipidmotions, such as the libration around O1-C1 in Figure 1, asobserved by NMR43 (see Figure 5B). The coupling to the locallipid dynamics may both speed up the water dynamics as well as
alter its intrinsic Arrhenius temperature dependence due to atemperature dependent coupling.
The process denoted R2b is only observed in the two hydratedsamples H75 and H84, as shown in Figure 4. It is attributed to asimilar type of local water relaxation as R2, but of water moleculeswith a different coordination to the lipid molecules. In fact,studies with infrared spectroscopy show evidence for threedistinct hydrogen bonded water motifs in phospholipid mem-brane samples with zero, one, or both OH moieties hydrogenbonded.48 Since the temperature dependence of R2b is given bythe Arrhenius law with an activation energy of 0.28 eV, whichroughly corresponds to the energy required to break onehydrogen bond, we can expect that these water molecules haveonly one of their two OH moieties hydrogen bonded. Thisactivation energy can also be compared with the activationenergy of 0.54 ( 0.04 eV (corresponding to the breaking oftwo hydrogen bonds) of the general intrinsic water relaxation ofsupercooled interfacial water,30 shown in Figure 6 for someimportant classes of biological molecules as sugars and proteins.Thus, the activation energy of R2b is about half of the value forthe intrinsic water relaxation, indicating the involvement of lesshydrogen bonded water molecules. The interpretation that thesewater molecules are less hydrogen bonded is also supported bythe finding that R2b cannot be observed in the dried sample H0,where all water molecules should be strongly interacting with thelipid molecules and therefore be most influenced by the fastlocal lipid motions. The fact that R2b has merged with R2 attemperatures above 200 K suggests that the water moleculesbecome less localized at higher temperatures, and therefore lessinfluenced by a specific local lipid environment.
In Figure 5A, process R2 is compared for the two hydrationlevels H0 and H75. From this figure, it is evident that the mainwater relaxation is substantially faster in the driedH0 sample thanin the H75 (and H84, not shown) samples. The same behaviorwas observed in a recent dielectric study by Tielrooj et al.,49
where they also concluded that water molecules with lesshydrogen bonds than in bulk water, due to the interaction withlipid headgroups, relax faster than water molecules in a bulk-likeenvironment. This behavior is in direct contrast to the normal
Figure 6. Dielectric relaxation times of supercooled and glassy water ina wide variety of systems: DMPC (this work), POPC,42 purple mem-brane (PM),21 DNA,30 hemoglobin,51 sorbitol,30 fructose,30 and cellu-lose.29
Figure 5. (A) Dielectric relaxation times of water (R1, R2) and lipid(R3) at low (H0) and intermediate (H75) hydration levels. (B)Comparison of lipid and water relaxation times from this work with31P NMR relaxation times43 and relaxation times from moleculardynamics (MD) simulations.2 In addition, we show dielectric relaxationtimes of palmitoyloleoyl phosphatidylcholine (POPC) bilayers.42 Forlocations of the NMR motions, see Figure 1.
1831 dx.doi.org/10.1021/jp110899j |J. Phys. Chem. B 2011, 115, 1825–1832
The Journal of Physical Chemistry B ARTICLE
behavior of supercooled interfacial water, where the relaxationtime decreases substantially with increasing size of the waterclusters, and thereby also with decreasing interaction with thehost material.50 The anomalous speeding up of the water dyna-mics in the dried H0 sample is another indication (in addition tothe super-Arrhenius temperature dependence and the fact thatthese water molecules, at least in the H0 sample, should bestrongly interacting with the lipid molecules) of the fact that thisrelaxation process is more determined by fast local lipid motionsthan by the intrinsic water dynamics.
’CONCLUSIONS
The results presented in this paper demonstrate the stronginterplay between the hydration water and the lipid headgroupdynamics. It is clear that the lipid headgroup rotation is influ-enced by the hydration water and that the water dynamics isinfluenced by faster and more local lipid headgroup dynamics.Lowering the water content in lipid bilayer systems results in areduced space between the lipid molecules, which increases theintermolecular lipid correlations and thereby also the length scaleof cooperativity of the lipid headgroup dynamics. This increasedcooperativity shows up as an increasing super-Arrhenius tem-perature dependence of the dielectric lipid headgroup rotationwith decreasing hydration level. A reduced water content is alsoaffecting the water dynamics but not in the normal way. With areduced amount of water, less water molecules participate in anormal H-bonding network and instead the interaction with thesurroundingmaterial increases. This surface interaction generallyslows down the water dynamics, but in lipid membranes wherefast local lipid dynamics is present, the motion of the interactingwater molecules actually speeds up. Thus, at low hydration levels,the water relaxation becomes more determined by fast local lipidmotions than by the intrinsic water dynamics. Finally, ourexperimental results suggest that lipid bilayer systems mayexhibit similarities with colloidal systems regarding the glasstransition related dynamics, since in both systems an increasedsoftness results in a “stronger” glass-forming behavior.
’AUTHOR INFORMATION
Corresponding Author*E-mail: [email protected] (P.B.); [email protected] (J.S.). Phone: þ46 31 772 56 80. Fax: þ46 31 77220 90.
’ACKNOWLEDGMENT
We thank Silvina Cerveny and Hel�en Jansson for the experi-mental data shown in Figure 6. This work was financiallysupported by the Swedish Research Council and the SwedishEnergy Agency.
’REFERENCES
(1) Milhaud, J. Biochim. Biophys. Acta, Biomembr. 2004, 1663, 19–51.(2) H€ogberg, C.-J.; Lyubartsev, A. P. J. Phys. Chem. B 2006, 110,
14326–14336.(3) Semrau, S.; Idema, T.; Holtzer, L.; Schmidt, T.; Storm, C. Phys.
Rev. Lett. 2008, 100, 088101.(4) Lee, H. J.; Peterson, E. L.; Phillips, R.; Klug, W. S.; Wiggins, P. A.
Proc. Natl. Acad. Sci. U.S.A. 2008, 105, 19253–19257.(5) Crowe, J. H.; Crowe, L. M. Nat. Biotechnol. 2000, 18, 145–146.(6) Trounson, A.; Mohr, L. Nature 1983, 305, 707–709.
(7) Rand, R. P.; Parsegian, V. A. Biochim. Biophys. Acta, Rev.Biomembr. 1989, 988, 351–376.
(8) Gaede, H. C.; Gawrisch, K. Biophys. J. 2003, 85, 1734–1740.(9) Fitter, J.; Lechner, R.; Dencher, N. J. Phys. Chem. B 1999, 103,
8036–8050.(10) Doxastakis, M.; Sakai, V. G.; Ohtake, S.; Maranas, J.; de Pablo, J.
Biophys. J. 2007, 92, 147–161.(11) Swenson, J.; Kargl, F.; Berntsen, P.; Svanberg, C. J. Chem. Phys.
2008, 129, 045101.(12) Hildenbrand, M.; Bayerl, T. Biophys. J. 2005, 88, 3360–3367.(13) Anotonietti, M.; Neese, M.; Blum, G.; Kremer, F. Langmuir
1996, 12, 6636–4441.(14) Haibel, A.; Nimtz, G.; Pelster, R.; Jaggi, R. Phys. Rev. E 1998, 57,
4838–4841.(15) Kl€osgen, B.; Reichle, C.; Kohlsmann, S.; Kramer, K. D. Biophys.
J. 1996, 71, 3251–3260.(16) Pottel, R.; G€opel, K.-D.; Henze, R.; Kaatze, U.; Uhlendorf, V.
Biophys. Chem. 1984, 19, 233–244.(17) Cooper, J.; Hill, R. J. Colloid Interface Sci. 1996, 180, 27–35.(18) Tirado, M.; Grosse, C.; Schrader, W.; Kaatze, U. J. Non-Cryst.
Solids 2002, 305, 373–378.(19) Enders, A.; Nimtz, G. Ber. Bunsen-Ges. Phys. Chem. 1984, 88,
512–517.(20) Raudion, A.; Castelli, F.; Briganti, G.; Cametti, C. J. Chem. Phys.
2001, 115, 8238–8250.(21) Berntsen, P.; Bergman, R.; Jansson, H.; Weik, M.; Swenson, J.
Biophys. J. 2005, 89, 3120–3128.(22) Bruning, B.; Wald, E.; Schrader, W.; Behrends, R.; Kaatze, U.
Soft Matter 2009, 5, 3340–3346.(23) Rog, T.;Murzyn, K.; Pasenkiewicz-Gierula, M.Chem. Phys. Lett.
2002, 352, 323–327.(24) Tieleman, D.; Marrink, S.; Berendsen, H. Biochim. Biophys. Acta
1997, 1331, 235–270.(25) Lopez, C. F.; Nielsen, S. O.; Klein, M. L.; Moore, P. B. J. Phys.
Chem. B 2004, 108, 6603–6610.(26) Koynova, R.; Caffrey, M. Biochim. Biophys. Acta, Rev. Biomembr.
1998, 1376, 91–145.(27) Swenson, J.; Jansson, H.; Bergman, R. Phys. Rev. Lett. 2006, 96,
247802.(28) Buchsteiner, A.; Lechner, R. E.; Hauss, T.; Dencher, N. A.
J. Mol. Biol. 2007, 371, 914–923.(29) Cerveny, S.; Schwartz, G. A.; Bergman, R.; Swenson, J. Phys.
Rev. Lett. 2004, 93, 245702.(30) Cerveny, S.; Alegría, A.; Colmenero, J. Phys. Rev. E 2008, 77,
031803.(31) Huang, D. M.; Chandler, D. Proc. Natl. Acad. Sci. U.S.A. 2000,
97, 8324–8327.(32) Daidone, I.; Ulmschneider, M. B.; Di Nola, A.; Amadei, A.;
Smith, J. C. Proc. Natl. Acad. Sci. U.S.A. 2007, 104, 15230–15235.(33) Seul, M.; Sammon, M. Thin Solid Films 1990, 185, 287–305.(34) Greenspan, L. J. Res. Natl. Bur. Stand., Sect. A 1977, 81A, 89.(35) Faure, C.; Bonakdar, L.; Dufourc, E. J. FEBS Lett. 1997, 405,
263–266.(36) Verdonck, E.; Schaap, K.; Thomas, L. Int. J. Pharm. 1999, 192, 3–20.(37) Vogel, H. Phys. Z. 1921, 22, 645–646.(38) Fulcher, G. J. Am. Ceram. Soc. 1925, 8, 339–355.(39) Tamman, G.; Hesse, G. Z. Anorg. Allg. Chem. 1926, 156, 245–
257.(40) B€ohmer, R.; Ngai, K. L.; Angell, C. A.; Plazek, D. J. J. Chem.
Phys. 1993, 99, 4201.(41) Swenson, J.; Jansson, H.; Hedstr€om, J.; Bergman, R. J. Phys.:
Condens. Matter 2007, 19, 205109.(42) Svanberg, C.; Berntsen, P.; Johansson, A.; Hedlund, T.; Axen,
E.; Swenson, J. J. Chem. Phys. 2009, 130, 035101.(43) Dufourc, E. J.; Mayer, C.; Stohrer, J.; Althoff, G.; Kothe, G.
Biophys. J. 1992, 61, 42–57.(44) Trapp, M.; Gutberlet, T.; Juranyi, F.; Unruh, T.; Dem�e, B.;
Tehei, M.; Peters, J. J. Chem. Phys. 2010, 133, 164505.
1832 dx.doi.org/10.1021/jp110899j |J. Phys. Chem. B 2011, 115, 1825–1832
The Journal of Physical Chemistry B ARTICLE
(45) Petrache, H. I.; Gouliaev, N.; Tristram-Nagle, S.; Zhang, R.;Suter, R. M.; Nagle, J. F. Phys. Rev. E 1998, 57, 7014–7024.(46) Mattsson, J.; Wyss, H. M.; Fernandez-Nieves, A.; Miyazaki, K.;
Hu, Z.; Reichman, D. R.; Weitz, D. A. Nature 2009, 462, 83–86.(47) Shalaev, E. Y.; Zografi, G.; Steponkus, P. L. J. Phys. Chem. B
2010, 114, 3526–3533.(48) Volkov, V.; Palmer, D.; Righini, R. Phys. Rev. Lett. 2007, 99,
078302.(49) Tielrooij, K. J.; Paparo, D.; Piatkowski, L.; Bakker, H. J.; Bonn,
M. Biophys. J. 2009, 97, 2484–2492.(50) Sj€ostrom, J.; Mattsson, J.; Bergman, R.; Johansson, E.;
Josefsson, K.; Svantesson, D.; Swenson, J. Phys. Chem. Chem. Phys.2010, 12, 10452–10456.(51) Jansson, H. Unpublished data.