Internet Surveillance Camera Measurements of Atmospheric Aerosols Concentration 2
16
Internet Surveillance Camera Measurements of Atmospheric Aerosols Concentration 27 X Internet Surveillance Camera Measurements of Atmospheric Aerosols Concentration C.J. Wong, M.Z. MatJafri, K. Abdullah and H.S. Lim School of Physics, Universiti Sains Malaysia 11800 USM, Penang, Malaysia 1. Introduction Nowadays, air pollution becomes a very serious problem with the rapid growth of industrialization and urbanization (Kim Oanh et al., 2006, Wu et al., 2006). This air pollution is not only continues to damage our environment, it also endanger our health (Pope et al., 2008, Pope et al., 2007, Banauch et al., 2006, Brunekreef et al., 2002). Evidence gathered to date indicates that the most harmful component of this pollution is the microscopic atmospheric aerosols with an aerodynamic diameter below 10 micrometers (PM 10 ) (Pope et al., 2008, Pope et al., 2007, Pope et al., 2004, Donaldson et al., 2000, Pope et al., 1995). Only particles less than 10 micrometers in diameter can be inhaled deep into the lungs, then embed themselves in the lungs to cause adverse health effects. These effects have been linked to respiratory disease, cancer and other potentially deadly illnesses. This is the reason for both the WHO and the United Nations have declared that atmospheric aerosols poses the greatest air pollution threat globally. In order to monitor the levels of air pollution, so that early warning will be provided to prevent long exposure to this type of harmful air pollution. Many researchers attempt to develop more efficient techniques to monitor this atmospheric aerosols air pollution. This includes the techniques of Atmospheric Optical Thickness (AOT) and satellite images (Hadjimitsis, 2009, Hadjimitsis, 2008, Sifakis et al., 1992, Kaufman et al., 1983, Lim et al., 2009). Satellite images were normally used by researchers in their remote sensing air quality studies, but the main drawback of using satellite images is the difficulty in obtaining cloud- free scenes especially for the Equatorial region. In order to overcome cloud-free scenes problem, aerial photographic imagery technique is used to obtain air pollution map. This technique utilizes fundamental optical theory like light absorption, light scattering and light reflection. This technique has long been used for visibility monitoring (Middleton, 1968, Noll et al., 1968, Horvath et al., 1969, Diederen et al., 1985). The continuous and rapid evolution of digital technologies in the last decade fostered an incredible improvement in digital photography technology, in information and communication technologies (ICT) and personal computer technology. This modern digital technology allows image data transfer over the internet protocol, which provides real time observation and image processing (Wong et al., 2009, Wong et al., 2007). This has made it 2 www.intechopen.com
Transcript of Internet Surveillance Camera Measurements of Atmospheric Aerosols Concentration 2
Internet Surveillance Camera Measurements of Atmospheric Aerosols Concentration 27
Internet Surveillance Camera Measurements of Atmospheric Aerosols
C.J. Wong, M.Z. MatJafri, K. Abdullah and H.S. Lim
X
Internet Surveillance Camera Measurements of Atmospheric Aerosols Concentration
C.J. Wong, M.Z. MatJafri, K. Abdullah and H.S. Lim
School of Physics, Universiti Sains Malaysia 11800 USM, Penang, Malaysia
1. Introduction
Nowadays, air pollution becomes a very serious problem with the rapid growth of industrialization and urbanization (Kim Oanh et al., 2006, Wu et al., 2006). This air pollution is not only continues to damage our environment, it also endanger our health (Pope et al., 2008, Pope et al., 2007, Banauch et al., 2006, Brunekreef et al., 2002). Evidence gathered to date indicates that the most harmful component of this pollution is the microscopic atmospheric aerosols with an aerodynamic diameter below 10 micrometers (PM10) (Pope et al., 2008, Pope et al., 2007, Pope et al., 2004, Donaldson et al., 2000, Pope et al., 1995). Only particles less than 10 micrometers in diameter can be inhaled deep into the lungs, then embed themselves in the lungs to cause adverse health effects. These effects have been linked to respiratory disease, cancer and other potentially deadly illnesses. This is the reason for both the WHO and the United Nations have declared that atmospheric aerosols poses the greatest air pollution threat globally. In order to monitor the levels of air pollution, so that early warning will be provided to prevent long exposure to this type of harmful air pollution. Many researchers attempt to develop more efficient techniques to monitor this atmospheric aerosols air pollution. This includes the techniques of Atmospheric Optical Thickness (AOT) and satellite images (Hadjimitsis, 2009, Hadjimitsis, 2008, Sifakis et al., 1992, Kaufman et al., 1983, Lim et al., 2009). Satellite images were normally used by researchers in their remote sensing air quality studies, but the main drawback of using satellite images is the difficulty in obtaining cloud-free scenes especially for the Equatorial region. In order to overcome cloud-free scenes problem, aerial photographic imagery technique is used to obtain air pollution map. This technique utilizes fundamental optical theory like light absorption, light scattering and light reflection. This technique has long been used for visibility monitoring (Middleton, 1968, Noll et al., 1968, Horvath et al., 1969, Diederen et al., 1985). The continuous and rapid evolution of digital technologies in the last decade fostered an incredible improvement in digital photography technology, in information and communication technologies (ICT) and personal computer technology. This modern digital technology allows image data transfer over the internet protocol, which provides real time observation and image processing (Wong et al., 2009, Wong et al., 2007). This has made it
2
www.intechopen.com
Geoscience and Remote Sensing, New Achievements28
possible to monitor real time PM10 air pollution at multi location. This is an attempt to fulfill the need for preventing long exposure to this harmful air pollution. The object of this study is to develop a state-of-the-art technique to enhance the capability of the internet surveillance camera for temporal air quality monitoring. This technique is able to detect particulate matter with diameter less than 10 micrometers (PM10). An empirical algorithm was developed and tested based on the atmospheric characteristic to determine PM10 concentrations using multispectral data obtained from the internet surveillance camera. A program is developed by using this algorithm to determine the real-time air quality information automatically. This development showed that the modern Information and Communications Technologies (ICT) and digital image processing technology could monitor temporal development of air quality at multi location simultaneously from a central monitoring station.
2. Description of the Algorithm
In this study, we developed an algorithm based on the fundamental optical theory, that is light absorption, light scattering and light reflection. This algorithm is used to perform image processing on the captured digital images to determine the concentration of atmospheric aerosols.
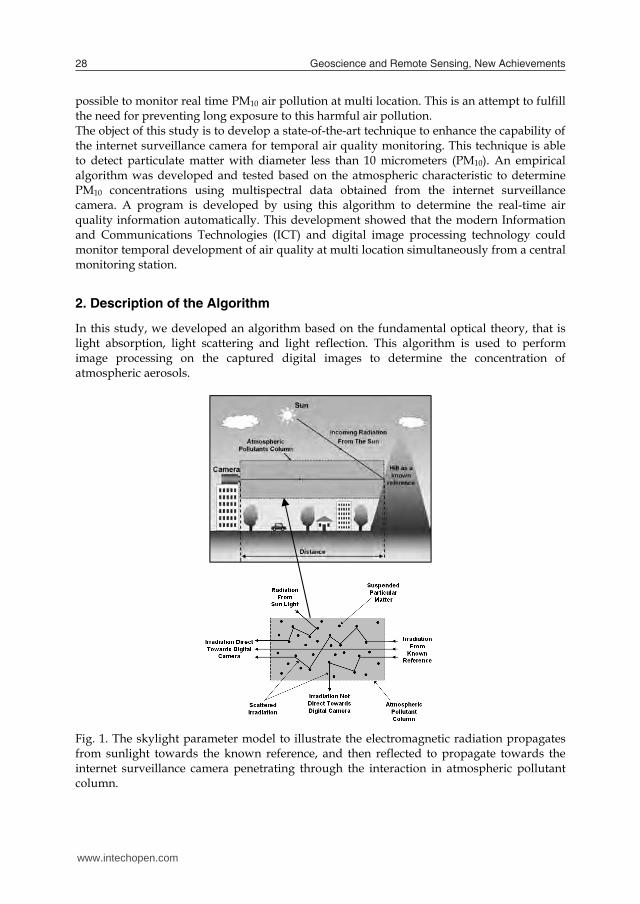
Fig. 1. The skylight parameter model to illustrate the electromagnetic radiation propagates from sunlight towards the known reference, and then reflected to propagate towards the internet surveillance camera penetrating through the interaction in atmospheric pollutant column.
Figure 1 shows the electromagnetic radiation path of ambient light propagating towards the internet surveillance camera, and then this electromagnetic radiation is reflected by a known reference target and penetrating through the ambient pollutant column. At the ambient pollutant column, this electromagnetic radiation encounters absorption and scatters. In a single scattering of visible electromagnetic radiation by aerosol in atmosphere, Liu et al. showed that the atmospheric reflectance due to molecules scattering, Rr is proportional to the optical thickness for molecules, τr (Liu et al., 1996). This atmospheric reflectance due to molecule scattering, Rr can be written as
νs
rrr μμ
PτR4
(1)
where Pr(Θ) is the scattering phase function for molecules, µv is the cosine of viewing angle, and µs is the cosine of solar zenith angle. In the same paper, Liu et al. also showed that the atmospheric reflectance due to particles scattering, Ra is proportional the optical thickness for aerosols, τa (Liu et al., 1996). Later on, King et al. and Fukushima et al. have further confirmed this relationship (King et al., 1999, Fukushima et al., 2000). This particles scattering, Ra is
νs
aaa μμ
PτR4
(2)
where Pa(Θ) is scattering phase function for aerosols. In year 1997, Vermote et al. showed that the atmospheric reflectance, Ratm is the sum of reflectance from particles, Ra and reflectance from molecules, Rr (Vermote et al., 1997). This atmospheric reflectance, Ratm can be written as
raatm RRR (3) By substituting equation (1) and equation (2) into equation (3), the atmospheric reflectance, Ratm also can be written as
)()(41 rraa
vsatm PτPτ
μμR (4)
Camagni et al. expressed the optical depth, in term of absorption, σ and finite path, s (Camagni et al., 1983). Equation (5) showed this optical depth, as
s (5) where σ is absorption, is density and s is finite path.
www.intechopen.com
Internet Surveillance Camera Measurements of Atmospheric Aerosols Concentration 29
possible to monitor real time PM10 air pollution at multi location. This is an attempt to fulfill the need for preventing long exposure to this harmful air pollution. The object of this study is to develop a state-of-the-art technique to enhance the capability of the internet surveillance camera for temporal air quality monitoring. This technique is able to detect particulate matter with diameter less than 10 micrometers (PM10). An empirical algorithm was developed and tested based on the atmospheric characteristic to determine PM10 concentrations using multispectral data obtained from the internet surveillance camera. A program is developed by using this algorithm to determine the real-time air quality information automatically. This development showed that the modern Information and Communications Technologies (ICT) and digital image processing technology could monitor temporal development of air quality at multi location simultaneously from a central monitoring station.
2. Description of the Algorithm
In this study, we developed an algorithm based on the fundamental optical theory, that is light absorption, light scattering and light reflection. This algorithm is used to perform image processing on the captured digital images to determine the concentration of atmospheric aerosols.
Fig. 1. The skylight parameter model to illustrate the electromagnetic radiation propagates from sunlight towards the known reference, and then reflected to propagate towards the internet surveillance camera penetrating through the interaction in atmospheric pollutant column.
Figure 1 shows the electromagnetic radiation path of ambient light propagating towards the internet surveillance camera, and then this electromagnetic radiation is reflected by a known reference target and penetrating through the ambient pollutant column. At the ambient pollutant column, this electromagnetic radiation encounters absorption and scatters. In a single scattering of visible electromagnetic radiation by aerosol in atmosphere, Liu et al. showed that the atmospheric reflectance due to molecules scattering, Rr is proportional to the optical thickness for molecules, τr (Liu et al., 1996). This atmospheric reflectance due to molecule scattering, Rr can be written as
νs
rrr μμ
PτR4
(1)
where Pr(Θ) is the scattering phase function for molecules, µv is the cosine of viewing angle, and µs is the cosine of solar zenith angle. In the same paper, Liu et al. also showed that the atmospheric reflectance due to particles scattering, Ra is proportional the optical thickness for aerosols, τa (Liu et al., 1996). Later on, King et al. and Fukushima et al. have further confirmed this relationship (King et al., 1999, Fukushima et al., 2000). This particles scattering, Ra is
νs
aaa μμ
PτR4
(2)
where Pa(Θ) is scattering phase function for aerosols. In year 1997, Vermote et al. showed that the atmospheric reflectance, Ratm is the sum of reflectance from particles, Ra and reflectance from molecules, Rr (Vermote et al., 1997). This atmospheric reflectance, Ratm can be written as
raatm RRR (3) By substituting equation (1) and equation (2) into equation (3), the atmospheric reflectance, Ratm also can be written as
)()(41 rraa
vsatm PτPτ
μμR (4)
Camagni et al. expressed the optical depth, in term of absorption, σ and finite path, s (Camagni et al., 1983). Equation (5) showed this optical depth, as
s (5) where σ is absorption, is density and s is finite path.
www.intechopen.com
Geoscience and Remote Sensing, New Achievements30
In the same paper, Camagni et al. also showed that this optical depth, is the sum of the optical depth for particle aerosols, a and the optical depth for molecule aerosols, r (Camagni et al., 1983). This optical depth, also can be written as
ra (6) As the optical depths for particle aerosols, a and for molecule aerosols, r can be written in the form of equation (5). Thus the optical depths for particle aerosols, a and for molecule aerosols, r are written as
sρστ aaa (7)
srrr (8) Equations (7) and (8) are substituted into equation (4). The atmospheric reflectance, Ratm become
)()(4
rrraaavs
atm PρσPρσμμsR (9)
Ratm, a,r, P a(Θ) and Pr(Θ) are dependent on wavelength, , thus equation (9) can be expressed as
),()(),()(4
)( λPρλσλPρλσμμsλR rrraaa
vsatm (10)
when a is particle aerosols concentration (PM10), P andr is molecule aerosols concentration, G. Equation (10) can be written as
),(G)(),(P)(4
)( λPλσλPλσμμsλR rraa
vsatm (11)
Equation (11) is extended into a two bands algorithm for wavelength,1 and wavelength,2. These two bands algorithm are as shown in equation (12) and equation (13).
),(G)(),(P)(4
)( 11111 λPλσλPλσμμsλR rraa
vsatm (12)
),(G)(),(P)(4
)( 22222 λPλσλPλσμμsλR rraa
vsatm (13)
where Ratm(i) is atmospheric reflectance, i = 1, 2 are the band numbers. Solving equation (12) and (13) simultaneously and we obtain particle concentration of PM10, P as
)()(P 2110 λRaλRa atmatm (14) where aj is algorithm coefficients, j = 0, 1 are then empirically determined. From the equation (14); the PM10 concentration is linearly related to the atmosphere reflectance for band 1 and band 2. This algorithm was generated based on the linear relationship between τ and reflectance. Retalis et al. also found that the PM10 was linearly related to τ and the correlation coefficient for the linear model was better than exponential (Retalis et al., 2003). This means that reflectance was linear with the PM10. In order to simplify the data processing, the air quality concentration was used in our analysis instead of using density, ρ, values.
3. Methodology
3.1 Equipment Set-Up As shown in Figure 2, an internet surveillance camera was used as remote sensing sensor to monitor the concentrations of particles less than 10 micrometers in diameter. This internet surveillance camera is a Bosch’s auto dome 300 series PTZ camera system. It is a 0.4 mega pixel (PAL) Charge-Couple-Device CCD camera, which allows image data transfer over the standard computer networks (Ethernet networks), internet. Therefore it can be used as a remote sensing sensor to monitor air quality.
Fig. 2. A 0.4 mega pixel (PAL) Charge-Couple-Device CCD, internet surveillance camera used in this study is a Bosch’s auto dome 300 series PTZ camera system
www.intechopen.com

Internet Surveillance Camera Measurements of Atmospheric Aerosols Concentration 31
In the same paper, Camagni et al. also showed that this optical depth, is the sum of the optical depth for particle aerosols, a and the optical depth for molecule aerosols, r (Camagni et al., 1983). This optical depth, also can be written as
ra (6) As the optical depths for particle aerosols, a and for molecule aerosols, r can be written in the form of equation (5). Thus the optical depths for particle aerosols, a and for molecule aerosols, r are written as
sρστ aaa (7)
srrr (8) Equations (7) and (8) are substituted into equation (4). The atmospheric reflectance, Ratm become
)()(4
rrraaavs
atm PρσPρσμμsR (9)
Ratm, a,r, P a(Θ) and Pr(Θ) are dependent on wavelength, , thus equation (9) can be expressed as
),()(),()(4
)( λPρλσλPρλσμμsλR rrraaa
vsatm (10)
when a is particle aerosols concentration (PM10), P andr is molecule aerosols concentration, G. Equation (10) can be written as
),(G)(),(P)(4
)( λPλσλPλσμμsλR rraa
vsatm (11)
Equation (11) is extended into a two bands algorithm for wavelength,1 and wavelength,2. These two bands algorithm are as shown in equation (12) and equation (13).
),(G)(),(P)(4
)( 11111 λPλσλPλσμμsλR rraa
vsatm (12)
),(G)(),(P)(4
)( 22222 λPλσλPλσμμsλR rraa
vsatm (13)
where Ratm(i) is atmospheric reflectance, i = 1, 2 are the band numbers. Solving equation (12) and (13) simultaneously and we obtain particle concentration of PM10, P as
)()(P 2110 λRaλRa atmatm (14) where aj is algorithm coefficients, j = 0, 1 are then empirically determined. From the equation (14); the PM10 concentration is linearly related to the atmosphere reflectance for band 1 and band 2. This algorithm was generated based on the linear relationship between τ and reflectance. Retalis et al. also found that the PM10 was linearly related to τ and the correlation coefficient for the linear model was better than exponential (Retalis et al., 2003). This means that reflectance was linear with the PM10. In order to simplify the data processing, the air quality concentration was used in our analysis instead of using density, ρ, values.
3. Methodology
3.1 Equipment Set-Up As shown in Figure 2, an internet surveillance camera was used as remote sensing sensor to monitor the concentrations of particles less than 10 micrometers in diameter. This internet surveillance camera is a Bosch’s auto dome 300 series PTZ camera system. It is a 0.4 mega pixel (PAL) Charge-Couple-Device CCD camera, which allows image data transfer over the standard computer networks (Ethernet networks), internet. Therefore it can be used as a remote sensing sensor to monitor air quality.
Fig. 2. A 0.4 mega pixel (PAL) Charge-Couple-Device CCD, internet surveillance camera used in this study is a Bosch’s auto dome 300 series PTZ camera system
www.intechopen.com

Geoscience and Remote Sensing, New Achievements32
This internet surveillance camera was calibrated by using a spectroradiometer with Pro Lamp light source and colour papers. This calibration enabled us to convert the digital numbers (DN) of the images captured by the internet surveillance camera to irradiance. The coefficients of calibrated internet surveillance camera are as listed below
0278000030 .N.L RR (15)
0263000040 .N.L GG (16)
0248000040 .N.L BB (17) where LR is irradiance for red band (Wm-2 nm-1), LG is irradiance for green band (Wm-2 nm-1) , LB is irradiance for blue band (Wm-2 nm-1), NR is digital number for red band, NG is digital number for green band and NB is digital number for blue band. The schematic set-up of the internet surveillance camera is shown in Figure 3. This set-up provides a continuous, on-line, real-time monitoring for air pollution at multiple locations. It is able to detect the present of particulates air pollution immediately, in the air and helps to ensure the continuing safety of environmental air for living creatures.
Fig. 3. The schematic set-up of internet surveillance camera as remote sensor to monitor air quality
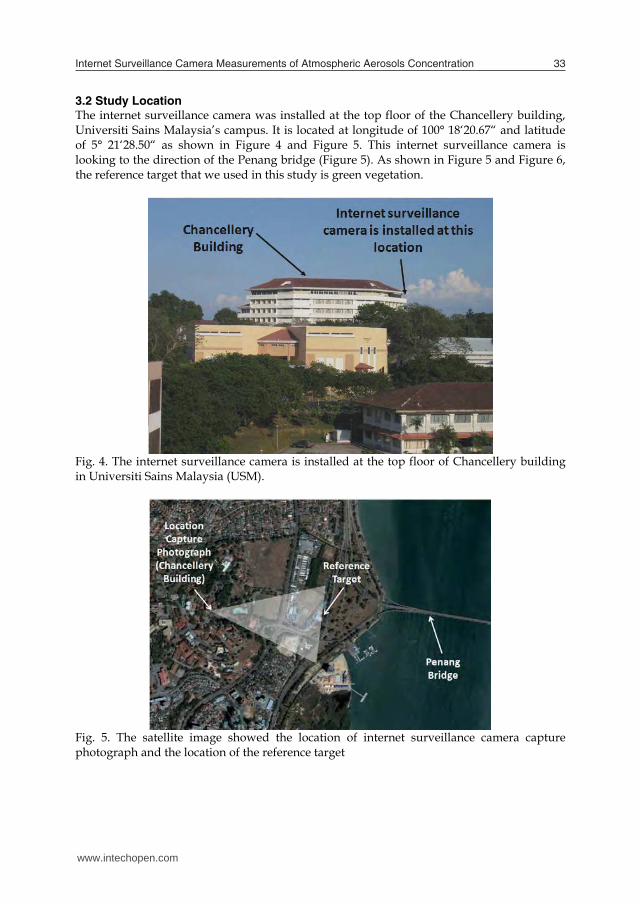
3.2 Study Location The internet surveillance camera was installed at the top floor of the Chancellery building, Universiti Sains Malaysia’s campus. It is located at longitude of 100° 18‘20.67“ and latitude of 5° 21‘28.50“ as shown in Figure 4 and Figure 5. This internet surveillance camera is looking to the direction of the Penang bridge (Figure 5). As shown in Figure 5 and Figure 6, the reference target that we used in this study is green vegetation.
Fig. 4. The internet surveillance camera is installed at the top floor of Chancellery building in Universiti Sains Malaysia (USM).
Fig. 5. The satellite image showed the location of internet surveillance camera capture photograph and the location of the reference target
www.intechopen.com
Internet Surveillance Camera Measurements of Atmospheric Aerosols Concentration 33
This internet surveillance camera was calibrated by using a spectroradiometer with Pro Lamp light source and colour papers. This calibration enabled us to convert the digital numbers (DN) of the images captured by the internet surveillance camera to irradiance. The coefficients of calibrated internet surveillance camera are as listed below
0278000030 .N.L RR (15)
0263000040 .N.L GG (16)
0248000040 .N.L BB (17) where LR is irradiance for red band (Wm-2 nm-1), LG is irradiance for green band (Wm-2 nm-1) , LB is irradiance for blue band (Wm-2 nm-1), NR is digital number for red band, NG is digital number for green band and NB is digital number for blue band. The schematic set-up of the internet surveillance camera is shown in Figure 3. This set-up provides a continuous, on-line, real-time monitoring for air pollution at multiple locations. It is able to detect the present of particulates air pollution immediately, in the air and helps to ensure the continuing safety of environmental air for living creatures.
Fig. 3. The schematic set-up of internet surveillance camera as remote sensor to monitor air quality
3.2 Study Location The internet surveillance camera was installed at the top floor of the Chancellery building, Universiti Sains Malaysia’s campus. It is located at longitude of 100° 18‘20.67“ and latitude of 5° 21‘28.50“ as shown in Figure 4 and Figure 5. This internet surveillance camera is looking to the direction of the Penang bridge (Figure 5). As shown in Figure 5 and Figure 6, the reference target that we used in this study is green vegetation.
Fig. 4. The internet surveillance camera is installed at the top floor of Chancellery building in Universiti Sains Malaysia (USM).
Fig. 5. The satellite image showed the location of internet surveillance camera capture photograph and the location of the reference target
www.intechopen.com
Geoscience and Remote Sensing, New Achievements34
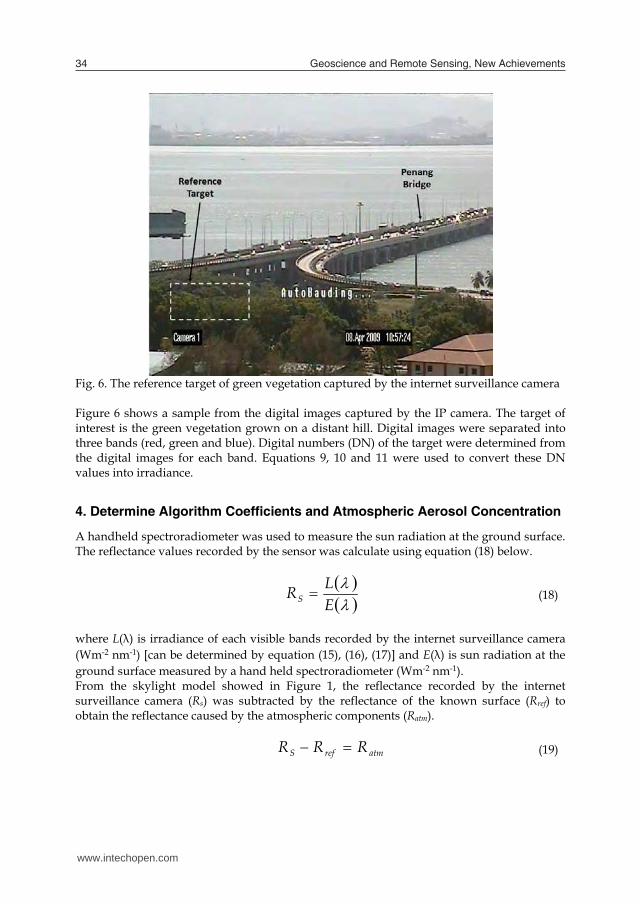
Fig. 6. The reference target of green vegetation captured by the internet surveillance camera Figure 6 shows a sample from the digital images captured by the IP camera. The target of interest is the green vegetation grown on a distant hill. Digital images were separated into three bands (red, green and blue). Digital numbers (DN) of the target were determined from the digital images for each band. Equations 9, 10 and 11 were used to convert these DN values into irradiance.
4. Determine Algorithm Coefficients and Atmospheric Aerosol Concentration
A handheld spectroradiometer was used to measure the sun radiation at the ground surface. The reflectance values recorded by the sensor was calculate using equation (18) below. E
LRS (18)
where L(λ) is irradiance of each visible bands recorded by the internet surveillance camera (Wm-2 nm-1) [can be determined by equation (15), (16), (17)] and E(λ) is sun radiation at the ground surface measured by a hand held spectroradiometer (Wm-2 nm-1). From the skylight model showed in Figure 1, the reflectance recorded by the internet surveillance camera (Rs) was subtracted by the reflectance of the known surface (Rref) to obtain the reflectance caused by the atmospheric components (Ratm).
atmrefS RRR (19)
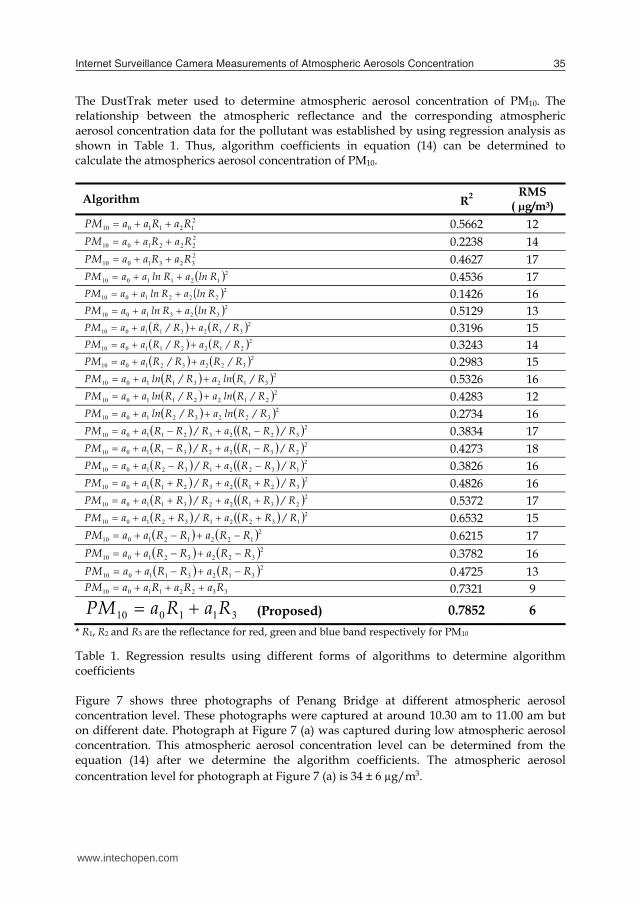
The DustTrak meter used to determine atmospheric aerosol concentration of PM10. The relationship between the atmospheric reflectance and the corresponding atmospheric aerosol concentration data for the pollutant was established by using regression analysis as shown in Table 1. Thus, algorithm coefficients in equation (14) can be determined to calculate the atmospherics aerosol concentration of PM10.
Algorithm R2 RMS
( µg/m3) 21211010 RaRaaMP 0.5662 12 22221010 RaRaaMP 0.2238 14 23231010 RaRaaMP 0.4627 17 21211010 RlnaRlnaaMP 0.4536 17 22221010 RlnaRlnaaMP 0.1426 16 23231010 RlnaRlnaaMP 0.5129 13 2312311010 R/RaR/RaaMP 0.3196 15 2212211010 R/RaR/RaaMP 0.3243 14 2322321010 R/RaR/RaaMP 0.2983 15 2312311010 R/RlnaR/RlnaaMP 0.5326 16 2212211010 R/RlnaR/RlnaaMP 0.4283 12 2322321010 R/RlnaR/RlnaaMP 0.2734 16 232123211010 R/RRaR/RRaaMP 0.3834 17 223122311010 R/RRaR/RRaaMP 0.4273 18 213221321010 R/RRaR/RRaaMP 0.3826 16 232123211010 R/RRaR/RRaaMP 0.4826 16 223122311010 R/RRaR/RRaaMP 0.5372 17 213221321010 R/RRaR/RRaaMP 0.6532 15 2122121010 RRaRRaaMP 0.6215 17 2322321010 RRaRRaaMP 0.3782 16 2312311010 RRaRRaaMP 0.4725 13
332211010 RaRaRaaMP 0.7321 9
311010 RaRaMP (Proposed) 0.7852 6 * R1, R2 and R3 are the reflectance for red, green and blue band respectively for PM10
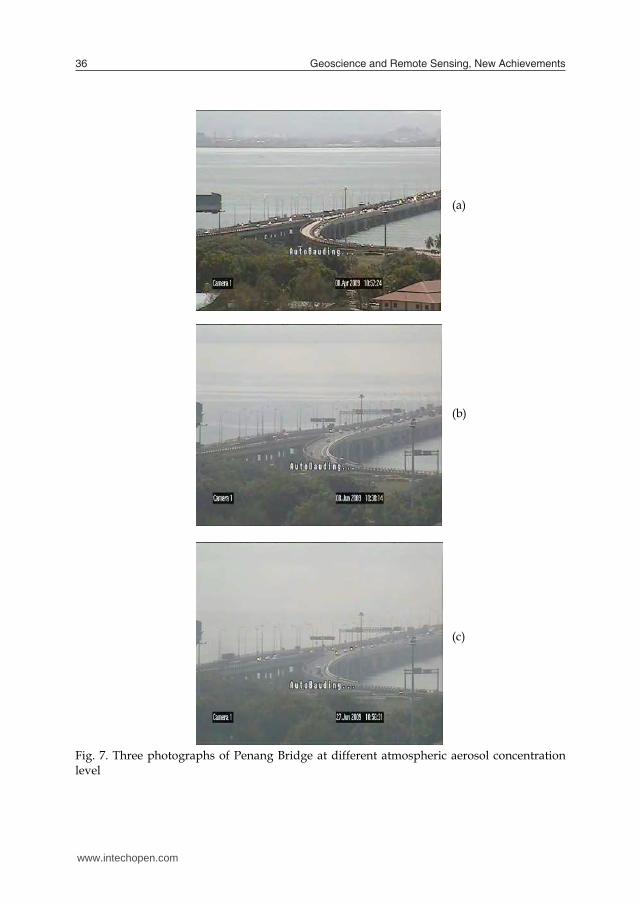
Table 1. Regression results using different forms of algorithms to determine algorithm coefficients Figure 7 shows three photographs of Penang Bridge at different atmospheric aerosol concentration level. These photographs were captured at around 10.30 am to 11.00 am but on different date. Photograph at Figure 7 (a) was captured during low atmospheric aerosol concentration. This atmospheric aerosol concentration level can be determined from the equation (14) after we determine the algorithm coefficients. The atmospheric aerosol concentration level for photograph at Figure 7 (a) is 34 ± 6 µg/m3.
www.intechopen.com
Internet Surveillance Camera Measurements of Atmospheric Aerosols Concentration 35
Fig. 6. The reference target of green vegetation captured by the internet surveillance camera Figure 6 shows a sample from the digital images captured by the IP camera. The target of interest is the green vegetation grown on a distant hill. Digital images were separated into three bands (red, green and blue). Digital numbers (DN) of the target were determined from the digital images for each band. Equations 9, 10 and 11 were used to convert these DN values into irradiance.
4. Determine Algorithm Coefficients and Atmospheric Aerosol Concentration
A handheld spectroradiometer was used to measure the sun radiation at the ground surface. The reflectance values recorded by the sensor was calculate using equation (18) below. E
LRS (18)
where L(λ) is irradiance of each visible bands recorded by the internet surveillance camera (Wm-2 nm-1) [can be determined by equation (15), (16), (17)] and E(λ) is sun radiation at the ground surface measured by a hand held spectroradiometer (Wm-2 nm-1). From the skylight model showed in Figure 1, the reflectance recorded by the internet surveillance camera (Rs) was subtracted by the reflectance of the known surface (Rref) to obtain the reflectance caused by the atmospheric components (Ratm).
atmrefS RRR (19)
The DustTrak meter used to determine atmospheric aerosol concentration of PM10. The relationship between the atmospheric reflectance and the corresponding atmospheric aerosol concentration data for the pollutant was established by using regression analysis as shown in Table 1. Thus, algorithm coefficients in equation (14) can be determined to calculate the atmospherics aerosol concentration of PM10.
Algorithm R2 RMS
( µg/m3) 21211010 RaRaaMP 0.5662 12 22221010 RaRaaMP 0.2238 14 23231010 RaRaaMP 0.4627 17 21211010 RlnaRlnaaMP 0.4536 17 22221010 RlnaRlnaaMP 0.1426 16 23231010 RlnaRlnaaMP 0.5129 13 2312311010 R/RaR/RaaMP 0.3196 15 2212211010 R/RaR/RaaMP 0.3243 14 2322321010 R/RaR/RaaMP 0.2983 15 2312311010 R/RlnaR/RlnaaMP 0.5326 16 2212211010 R/RlnaR/RlnaaMP 0.4283 12 2322321010 R/RlnaR/RlnaaMP 0.2734 16 232123211010 R/RRaR/RRaaMP 0.3834 17 223122311010 R/RRaR/RRaaMP 0.4273 18 213221321010 R/RRaR/RRaaMP 0.3826 16 232123211010 R/RRaR/RRaaMP 0.4826 16 223122311010 R/RRaR/RRaaMP 0.5372 17 213221321010 R/RRaR/RRaaMP 0.6532 15 2122121010 RRaRRaaMP 0.6215 17 2322321010 RRaRRaaMP 0.3782 16 2312311010 RRaRRaaMP 0.4725 13
332211010 RaRaRaaMP 0.7321 9
311010 RaRaMP (Proposed) 0.7852 6 * R1, R2 and R3 are the reflectance for red, green and blue band respectively for PM10
Table 1. Regression results using different forms of algorithms to determine algorithm coefficients Figure 7 shows three photographs of Penang Bridge at different atmospheric aerosol concentration level. These photographs were captured at around 10.30 am to 11.00 am but on different date. Photograph at Figure 7 (a) was captured during low atmospheric aerosol concentration. This atmospheric aerosol concentration level can be determined from the equation (14) after we determine the algorithm coefficients. The atmospheric aerosol concentration level for photograph at Figure 7 (a) is 34 ± 6 µg/m3.
www.intechopen.com
Geoscience and Remote Sensing, New Achievements36
(a) (b) (c) Fig. 7. Three photographs of Penang Bridge at different atmospheric aerosol concentration level
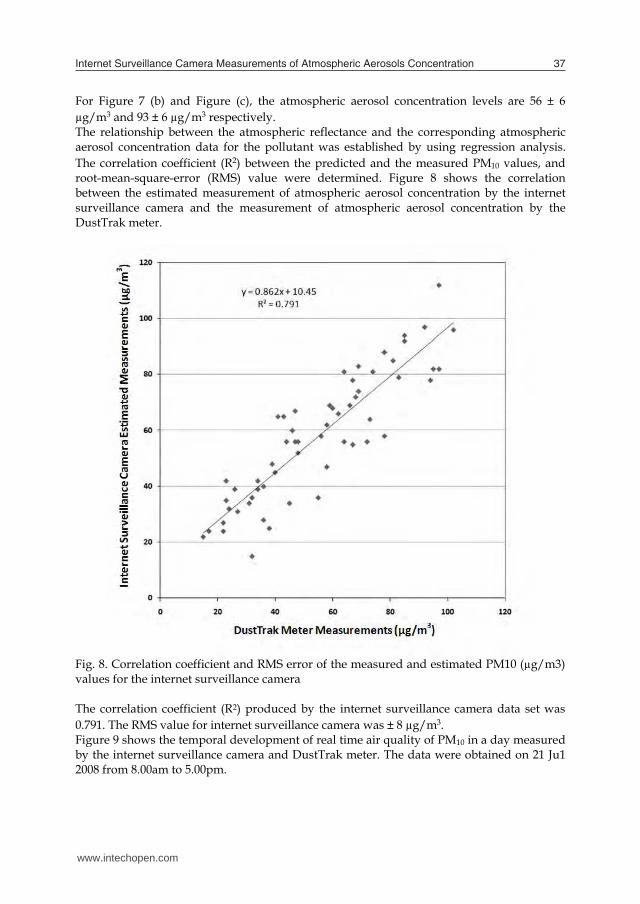
For Figure 7 (b) and Figure (c), the atmospheric aerosol concentration levels are 56 ± 6 µg/m3 and 93 ± 6 µg/m3 respectively. The relationship between the atmospheric reflectance and the corresponding atmospheric aerosol concentration data for the pollutant was established by using regression analysis. The correlation coefficient (R2) between the predicted and the measured PM10 values, and root-mean-square-error (RMS) value were determined. Figure 8 shows the correlation between the estimated measurement of atmospheric aerosol concentration by the internet surveillance camera and the measurement of atmospheric aerosol concentration by the DustTrak meter.
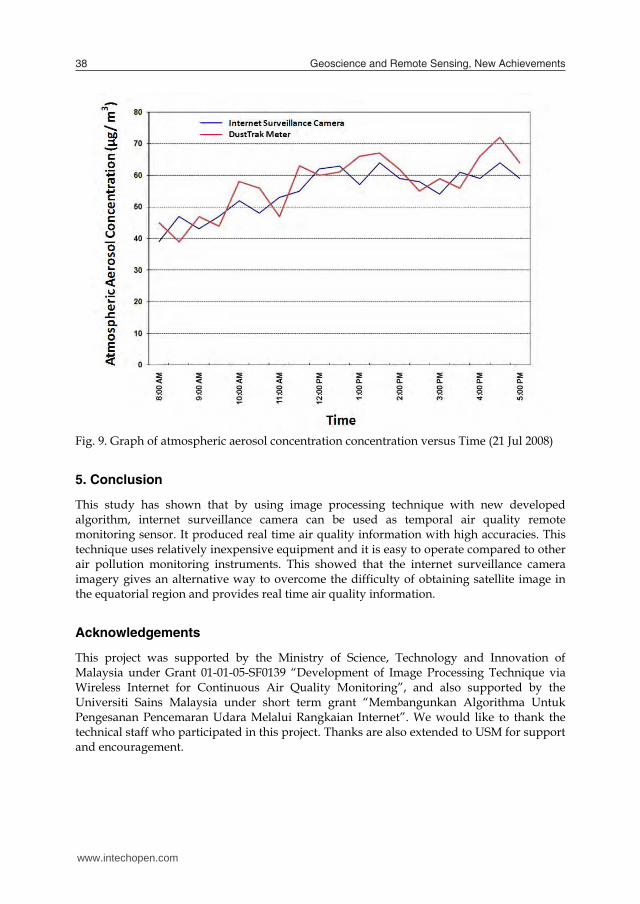
Fig. 8. Correlation coefficient and RMS error of the measured and estimated PM10 (µg/m3) values for the internet surveillance camera The correlation coefficient (R2) produced by the internet surveillance camera data set was 0.791. The RMS value for internet surveillance camera was ± 8 µg/m3. Figure 9 shows the temporal development of real time air quality of PM10 in a day measured by the internet surveillance camera and DustTrak meter. The data were obtained on 21 Ju1 2008 from 8.00am to 5.00pm.
www.intechopen.com
Internet Surveillance Camera Measurements of Atmospheric Aerosols Concentration 37
(a) (b) (c) Fig. 7. Three photographs of Penang Bridge at different atmospheric aerosol concentration level
For Figure 7 (b) and Figure (c), the atmospheric aerosol concentration levels are 56 ± 6 µg/m3 and 93 ± 6 µg/m3 respectively. The relationship between the atmospheric reflectance and the corresponding atmospheric aerosol concentration data for the pollutant was established by using regression analysis. The correlation coefficient (R2) between the predicted and the measured PM10 values, and root-mean-square-error (RMS) value were determined. Figure 8 shows the correlation between the estimated measurement of atmospheric aerosol concentration by the internet surveillance camera and the measurement of atmospheric aerosol concentration by the DustTrak meter.
Fig. 8. Correlation coefficient and RMS error of the measured and estimated PM10 (µg/m3) values for the internet surveillance camera The correlation coefficient (R2) produced by the internet surveillance camera data set was 0.791. The RMS value for internet surveillance camera was ± 8 µg/m3. Figure 9 shows the temporal development of real time air quality of PM10 in a day measured by the internet surveillance camera and DustTrak meter. The data were obtained on 21 Ju1 2008 from 8.00am to 5.00pm.
www.intechopen.com
Geoscience and Remote Sensing, New Achievements38
Fig. 9. Graph of atmospheric aerosol concentration concentration versus Time (21 Jul 2008)
5. Conclusion
This study has shown that by using image processing technique with new developed algorithm, internet surveillance camera can be used as temporal air quality remote monitoring sensor. It produced real time air quality information with high accuracies. This technique uses relatively inexpensive equipment and it is easy to operate compared to other air pollution monitoring instruments. This showed that the internet surveillance camera imagery gives an alternative way to overcome the difficulty of obtaining satellite image in the equatorial region and provides real time air quality information.
Acknowledgements
This project was supported by the Ministry of Science, Technology and Innovation of Malaysia under Grant 01-01-05-SF0139 “Development of Image Processing Technique via Wireless Internet for Continuous Air Quality Monitoring”, and also supported by the Universiti Sains Malaysia under short term grant “Membangunkan Algorithma Untuk Pengesanan Pencemaran Udara Melalui Rangkaian Internet”. We would like to thank the technical staff who participated in this project. Thanks are also extended to USM for support and encouragement.
6. References
Banauch, G.I.; Hall, C.; Weiden, M.; Cohen, H.W.; Aldrich, T.K.; Christodoulou, V.; Arcentales, N.; Kelly, K.J. & Prezant, D.J. (2006). Pulmonary function after exposure to the World Trade Center collapse in the New York Fire department. Am Respir Crit Care Med, Vol. 174, No. 3, 1 Aug 2006, Pages 312-19, PMID: 16864714
Brunekreef, B.; & Holgate, S.T. (2002). Air pollution and health. Lancet, Vol. 360, No. 9341, 19 Oct 2002, Pages 1233-42, PMID: 12401268.
Camagni, P. & Sandroni, S. (1983). Optical Remote sensing of air pollution, Joint Research Centre, Ispra, Italy, Elsevier Science Publishing Company Inc.
Charlson, R.J.; Horvath, H. & Pueschel, R.F. (1967). The direct measurement of atmospheric light scattering coefficient for studies of visibility and pollution. Atmospheric Environment (1967). Vol. 1, No. 4, July 1967, Pages 469-478, doi:10.1016/0004-6981(67)90062-5.
Diederen, H.S.M.A.; Guicherit, R. & HolLonder, J.C.T. (1985). Visibility reduction by air pollution in The Netherlands. Atmospheric Environment (1967). Vol. 19, No. 2, 1985, Pages 377-383, doi:10.1016/0004-6981(85)90105-2.
Donaldson, K.; Gilmour, M.I. & MacNee, W. (2000). Asthma and PM10. Respiratory Research. Vol. 1, No. 1, 3 July 2000, Pages 12–15, ISSN 1465-9921.
Fukushima, H.; Toratani, M.; Yamamiya, S. & Mitomi, Y. (2000). Atmospheric correction algorithm for ADEOS/OCTS acean color data: performance comparison based on ship and buoy measurements. Adv. Space Res, Vol. 25, No. 5, 1015-1024.
Hadjimitsis, D.G. (2009). Aerosol optical thickness (AOT) retrieval over land using satellite image-based algorithm. Air Qual., Atmos. Health. Vol. 2, No. 2, 25 March 2009., Pages 89-97, ISSN 1873-9318.
Hadjimitsis, D.G. (2008). Description of a new method for retrieving the aerosol optical thickness from satellite remotely sensed imagery using the maximum contrast value principle and the darkest pixel approach. Trans. GIS J. Vol. 12, No. 5, Oct 2008, Pages 633–644. doi:10.1111/j.1467-9671. 2008.01121.x.
Horvath, H. & Noll, K.E. (1969). The relationship between atmospheric light scattering coefficient and visibility. Atmospheric Environment (1967). Vol. 3, No. 5, Sept 1969, Pages 543-550, doi:10.1016/0004-6981(69)90044-4.
Kaufman, Y.J. & Fraser, R.S. (1983). Light extinction by aerosols during summer air pollution. J. of Climate & Appl. Meteorol. Vol. 22, No. 10, Oct 1983, Pages 1694–1706. doi:10.1175/1520-0450(1983)022<1694:LEBADS>2.0.CO;2
Kim Oanh, N.T.; Upadhyay, N.; Zhuang, Y.H.; Hao, Z.P.; Murthy, D.V.S.; Lestari, P.; Villarin, J.T.; Chengchua, K.; Co, H.X.; Dung, N.T. & Lindgren, E.S. (2006). Particulate air pollution in six Asian cities: Spatial and temporal distributions, and associated sources. Atmospheric Environment, Vol. 40, No. 18, June 2006, Pages 3367-3380, ISSN 1352-2310.
King, M. D.; Kaufman, Y. J.; Tanre, D. & Nakajima, T. (1999). Remote sensing of tropospheric aerosold form space: past, present and future, Bulletin of the American Meteorological society, 2229-2259.
Lim, H.S.; MatJafri, M.Z.; Abdullah, K; Wong, C.J. & Mohd. Saleh, N. (2009). Aerosol Optical Thickness Data Retrieval Over Penang Island, Malaysia, Proceeding of the 2009 IEEE Aerospace Conference, pp. 1-6, ISBN: 978-1-4244-2621-8, 7-14 March 2009, IEEE International, Big Sky, MT, USA.
www.intechopen.com
Internet Surveillance Camera Measurements of Atmospheric Aerosols Concentration 39
Fig. 9. Graph of atmospheric aerosol concentration concentration versus Time (21 Jul 2008)
5. Conclusion
This study has shown that by using image processing technique with new developed algorithm, internet surveillance camera can be used as temporal air quality remote monitoring sensor. It produced real time air quality information with high accuracies. This technique uses relatively inexpensive equipment and it is easy to operate compared to other air pollution monitoring instruments. This showed that the internet surveillance camera imagery gives an alternative way to overcome the difficulty of obtaining satellite image in the equatorial region and provides real time air quality information.
Acknowledgements
This project was supported by the Ministry of Science, Technology and Innovation of Malaysia under Grant 01-01-05-SF0139 “Development of Image Processing Technique via Wireless Internet for Continuous Air Quality Monitoring”, and also supported by the Universiti Sains Malaysia under short term grant “Membangunkan Algorithma Untuk Pengesanan Pencemaran Udara Melalui Rangkaian Internet”. We would like to thank the technical staff who participated in this project. Thanks are also extended to USM for support and encouragement.
6. References
Banauch, G.I.; Hall, C.; Weiden, M.; Cohen, H.W.; Aldrich, T.K.; Christodoulou, V.; Arcentales, N.; Kelly, K.J. & Prezant, D.J. (2006). Pulmonary function after exposure to the World Trade Center collapse in the New York Fire department. Am Respir Crit Care Med, Vol. 174, No. 3, 1 Aug 2006, Pages 312-19, PMID: 16864714
Brunekreef, B.; & Holgate, S.T. (2002). Air pollution and health. Lancet, Vol. 360, No. 9341, 19 Oct 2002, Pages 1233-42, PMID: 12401268.
Camagni, P. & Sandroni, S. (1983). Optical Remote sensing of air pollution, Joint Research Centre, Ispra, Italy, Elsevier Science Publishing Company Inc.
Charlson, R.J.; Horvath, H. & Pueschel, R.F. (1967). The direct measurement of atmospheric light scattering coefficient for studies of visibility and pollution. Atmospheric Environment (1967). Vol. 1, No. 4, July 1967, Pages 469-478, doi:10.1016/0004-6981(67)90062-5.
Diederen, H.S.M.A.; Guicherit, R. & HolLonder, J.C.T. (1985). Visibility reduction by air pollution in The Netherlands. Atmospheric Environment (1967). Vol. 19, No. 2, 1985, Pages 377-383, doi:10.1016/0004-6981(85)90105-2.
Donaldson, K.; Gilmour, M.I. & MacNee, W. (2000). Asthma and PM10. Respiratory Research. Vol. 1, No. 1, 3 July 2000, Pages 12–15, ISSN 1465-9921.
Fukushima, H.; Toratani, M.; Yamamiya, S. & Mitomi, Y. (2000). Atmospheric correction algorithm for ADEOS/OCTS acean color data: performance comparison based on ship and buoy measurements. Adv. Space Res, Vol. 25, No. 5, 1015-1024.
Hadjimitsis, D.G. (2009). Aerosol optical thickness (AOT) retrieval over land using satellite image-based algorithm. Air Qual., Atmos. Health. Vol. 2, No. 2, 25 March 2009., Pages 89-97, ISSN 1873-9318.
Hadjimitsis, D.G. (2008). Description of a new method for retrieving the aerosol optical thickness from satellite remotely sensed imagery using the maximum contrast value principle and the darkest pixel approach. Trans. GIS J. Vol. 12, No. 5, Oct 2008, Pages 633–644. doi:10.1111/j.1467-9671. 2008.01121.x.
Horvath, H. & Noll, K.E. (1969). The relationship between atmospheric light scattering coefficient and visibility. Atmospheric Environment (1967). Vol. 3, No. 5, Sept 1969, Pages 543-550, doi:10.1016/0004-6981(69)90044-4.
Kaufman, Y.J. & Fraser, R.S. (1983). Light extinction by aerosols during summer air pollution. J. of Climate & Appl. Meteorol. Vol. 22, No. 10, Oct 1983, Pages 1694–1706. doi:10.1175/1520-0450(1983)022<1694:LEBADS>2.0.CO;2
Kim Oanh, N.T.; Upadhyay, N.; Zhuang, Y.H.; Hao, Z.P.; Murthy, D.V.S.; Lestari, P.; Villarin, J.T.; Chengchua, K.; Co, H.X.; Dung, N.T. & Lindgren, E.S. (2006). Particulate air pollution in six Asian cities: Spatial and temporal distributions, and associated sources. Atmospheric Environment, Vol. 40, No. 18, June 2006, Pages 3367-3380, ISSN 1352-2310.
King, M. D.; Kaufman, Y. J.; Tanre, D. & Nakajima, T. (1999). Remote sensing of tropospheric aerosold form space: past, present and future, Bulletin of the American Meteorological society, 2229-2259.
Lim, H.S.; MatJafri, M.Z.; Abdullah, K; Wong, C.J. & Mohd. Saleh, N. (2009). Aerosol Optical Thickness Data Retrieval Over Penang Island, Malaysia, Proceeding of the 2009 IEEE Aerospace Conference, pp. 1-6, ISBN: 978-1-4244-2621-8, 7-14 March 2009, IEEE International, Big Sky, MT, USA.
www.intechopen.com
Geoscience and Remote Sensing, New Achievements40
Liu, C. H.; Chen, A. J. & Liu, G. R. (1996). An image-based retrieval algorithm of aerosol characteristics and surface reflectance for satellite images, International Journal Of Remote Sensing, 17 (17), 3477-3500.
Middleton, W.E.K. (1968). Vision Through the Atmosphere, University of Toronto Press, Toronto.
Noll, K.E.; Mueller, P.K. & Imada, M. (1968). Visibility and aerosol concentration in urban air. Atmospheric Environment (1967). Vol. 2, No. 5, Sept 1968, Pages 465-475, doi:10.1016/0004-6981(68)90040-1.
Pope, C.A. III; Renlund, D.G.; Kfoury, A.G.; May, H.T.; Horne, B.D. (2008). Relation of Heart Failure Hospitalization to Exposure to Fine Particulate Air Pollution The American Journal of Cardiology, Vol. 102, No. 9, 1 Nov 2008, Pages 1230-1234.
Pope, C.A. III. (2007). Mortality effects of longer term exposures to fine particulate air pollution: review of recent epidemiological evidence. Inhalation Toxicology, Vol. 19, No. 1, Suppl. 1, Pages 33–38, PMID: 17886048, ISSN 0895-8378.
Pope, C.A. III; Burnett, R.T.; Thurston, G.D.; Thun, M.J.; Calle, E.E.; Krewski, D. & Godleski, J.J. (2004). Cardiovascular mortality and long-term exposure to particulate air pollution: epidemiological evidence of general pathophysiological pathways of disease. Circulation Vol.109, No. 1, 6 Jan 2004, Pages 71–77, PMID: 14676145.
Pope, C.A. III; Dockery, D.W. & Schwartz, J. (1995). Review of epidemiological evidence of health effects of particulate air pollution. Inhalation Toxicol. Vol. 7, No. 1, Pages 1–18.
Sifakis, N. & Deschamps, P.Y. (1992). Mapping of air pollution using spot satellite data. Photogramm Eng Remote Sensing. Vol. 58, No. 10, Oct 1992, Pages 1433-1437, ISSN 0099-1112.
Sifakis, N.; Iossifidis, C. & Sarigiannis, D. (2006). High resolution 3D-mapping of urban air pollution using EO data. Proceeding of the 25th EARSeL Symposium, 6-11 June 2005, Porto Portugal, in: Global Developments in Environmental Earth Observation from Space (2006), André Marçal (ed.), pp 673-681.
Vermote, E. ; Tanre, D. ; Deuze, J. L. ; Herman, M. & Morcrette, J. J. (1997). 6S user guide Version 2, Second Simulation of the satellite signal in the solar spectrum (6S), [Talian laman web], [02/08/2005]. http://www.geog.tamu.edu/klein/geog661/handouts/6s/6smanv2.0_P1.pdf.
Wong, C.J.; MatJafri, M.Z.; Abdullah, K. & Lim, H.S. (2009a). Determination of Aerosol Concentration using an Internet Protocol Camera, Proceeding of the 2009 IEEE Aerospace Conference, pp. 1-7, ISBN: 978-1-4244-2621-8, 7-14 March 2009, IEEE International, Big Sky, MT, USA.
Wong, C.J.; MatJafri, M.Z.; Abdullah, K.; Lim, H.S. & Low, K.L. (2007). Temporal air quality monitoring using surveillance camera, Proceeding of the Geoscience and Remote Sensing Symposium, 2007. IGARSS 2007, pp. 2864 - 2868, ISBN: 978-1-4244-1211-2, Centre de Convencions Internacional de Barcelona, 23-27 July 2007, IEEE International, Barcelona, Spain.
www.intechopen.com
Geoscience and Remote Sensing New AchievementsEdited by Pasquale Imperatore and Daniele Riccio
ISBN 978-953-7619-97-8Hard cover, 508 pagesPublisher InTechPublished online 01, February, 2010Published in print edition February, 2010
InTech EuropeUniversity Campus STeP Ri Slavka Krautzeka 83/A 51000 Rijeka, Croatia Phone: +385 (51) 770 447 Fax: +385 (51) 686 166www.intechopen.com
InTech ChinaUnit 405, Office Block, Hotel Equatorial Shanghai No.65, Yan An Road (West), Shanghai, 200040, China
Phone: +86-21-62489820 Fax: +86-21-62489821
Our planet is nowadays continuously monitored by powerful remote sensors operating in wide portions of theelectromagnetic spectrum. Our capability of acquiring detailed information on the environment has beenrevolutionized by revealing its inner structure, morphology and dynamical changes. The way we now observeand study the evolution of the Earth’s status has even radically influenced our perception and conception ofthe world we live in. The aim of this book is to bring together contributions from experts to present newresearch results and prospects of the future developments in the area of geosciences and remote sensing;emerging research directions are discussed. The volume consists of twenty-six chapters, encompassing boththeoretical aspects and application-oriented studies. An unfolding perspective on various current trends in thisextremely rich area is offered. The book chapters can be categorized along different perspectives, amongothers, use of active or passive sensors, employed technologies and configurations, considered scenario onthe Earth, scientific research area involved in the studies.
How to referenceIn order to correctly reference this scholarly work, feel free to copy and paste the following:
C.J. Wong, M.Z. MatJafri, K. Abdullah and H.S. Lim (2010). Internet Surveillance Camera Measurements ofAtmospheric Aerosols Concentration, Geoscience and Remote Sensing New Achievements, PasqualeImperatore and Daniele Riccio (Ed.), ISBN: 978-953-7619-97-8, InTech, Available from:http://www.intechopen.com/books/geoscience-and-remote-sensing-new-achievements/internet-surveillance-camera-measurements-of-atmospheric-aerosols-concentration

© 2010 The Author(s). Licensee IntechOpen. This chapter is distributedunder the terms of the Creative Commons Attribution-NonCommercial-ShareAlike-3.0 License, which permits use, distribution and reproduction fornon-commercial purposes, provided the original is properly cited andderivative works building on this content are distributed under the samelicense.