Internet Store-Sales Update Amazon / eBay / Google ... · Sachin Khattar, CFA * Equity Associate...
19
INDUSTRY NOTE USA | Technology Internet October 9, 2014 Internet Amazon / eBay / Google: September Same- Store-Sales Update EQUITY RESEARCH AMERICAS Jefferies US Internet Team * Jefferies Equity Research [email protected] Brian Pitz * Equity Analyst (212) 336-7413 [email protected] Brian Fitzgerald * Equity Analyst (212) 284-2491 [email protected] Stan Velikov, CFA * Equity Associate (415) 229-1534 [email protected] Timothy O'Shea * Equity Associate (212) 284-3415 [email protected] Sachin Khattar, CFA * Equity Associate (212) 323-3381 [email protected] * Jefferies LLC Key Takeaway ChannelAdvisor's September same store sales (SSS) report showed solid growth from Amazon and Google (another strong month for PLAs) and a rebound in eBay growth (albeit still below overall eCommerce). We continue to favor GOOG and AMZN as top large cap plays in the eCommerce space along with small cap SALE. Google's PLAs keep gaining traction: Since 2H12, when Google transitioned its Google Shopping program to a paid service based on Product Listing Ads (PLAs), clicks to regular paid-search "right rail" ads have declined in 18 out of 25 total months for ChannelAdvisor clients. While there has been some concern that PLAs are cannibalizing traditional AdWords search ads, our channel checks indicate PLA budgets are actually additive. PLAs generate higher revenue than text ads for Google due to much higher click-thru & conversion rates, which more than offset lower CPCs. And as mobile continues to grow faster than desktop, starting to create headwinds for conversion rates, increasing average order value is offsetting the impact. Conversion rates have improved Y/Y in 4 of the last 6 months (by +7.0% on average) with AOV up +34% Y/Y in September and +25% Y/Y in August. Our latest proprietary PLA study (see a summary on pages 2-3 of this note) shows increasing adoption of PLAs by advertisers and stable penetration levels. According to ChannelAdvisor, Google Shopping / PLAs SSS were up +45% Y/Y in September, +54% Y/Y in August, and +41% Y/ Y in July. After some deceleration in SSS (as the program matured), we are seeing some reacceleration in 2Q and 3Q14. Solid PLAs SSS growth remains a key tailwind for Google and bodes well for 3Q14 results. Amazon market share gains continue: According to ChannelAdvisor, SSS for third- party sellers on the Amazon platform were up +38% Y/Y in September, +45% Y/Y in August, and +40% Y/Y in July. This compares to n/a, +12% Y/Y, and +14% Y/Y, respectively, for US eCommerce growth (excluding Travel), per comScore. As before, we believe these numbers clearly support our thesis that Amazon continues growing roughly 2-3x faster than overall eCommerce and 6-8x faster than overall retail. SSS for the 12 US chains reporting monthly results are expected to grow +5.1% Y/Y in September, up from +4.5% Y/Y in August and +4.7% Y/Y in July (excluding drugstores, SSS are expected to grow +4.1% Y/Y in September, down from +5.0% Y/Y in August and +4.4% Y/Y in July) as consumer confidence improved and cool weather drove some incremental demand for fall merchandise. Longer term we expect Amazon unit growth to reaccelerate on various initiatives including same-day delivery, digital content, and optimized fulfillment. eBay Marketplaces growth bounces back: According to ChannelAdvisor, SSS growth for eBay merchants was +9% Y/Y in September, up from +6% Y/Y in August and slightly below the +10% Y/Y in July. This compares to n/a, +12% Y/Y, and +14% Y/Y, respectively, for US eCommerce growth (excluding Travel), per comScore. Sales growth in eBay's Fixed- Price format also rebounded but not that meaningfully (+8% Y/Y in September, +7% Y/Y in August, +13% Y/Y in July) and remained below overall eCommerce growth. While eBay seems to be recovering from the growth deceleration we saw in the previous five months (partly caused by external triggers such as the May data breach and Google Panda update), we expect internal changes (new seller performance evaluation measure introduced in Aug) will take some time to clear through the system. The new measure - a transaction Defect Rate - rewards sellers who provide great service and penalizes transaction-related defects which are the top predictors that a buyer would leave eBay or buy less. One of the policy change's initial impacts, observed by ChannelAdvisor, is sellers of used / refurbished golf and electronics products significantly reducing their inventory (it's important to note here that ChannelAdvisor's customer base over-indexes for this category of sellers). We believe that short-term headwinds for Marketplaces will keep growth in line with to slightly below overall eCommerce growth over the next couple of quarters. Jefferies does and seeks to do business with companies covered in its research reports. As a result, investors should be aware that Jefferies may have a conflict of interest that could affect the objectivity of this report. Investors should consider this report as only a single factor in making their investment decision. Please see analyst certifications, important disclosure information, and information regarding the status of non-US analysts on pages 16 to 19 of this report.
Transcript of Internet Store-Sales Update Amazon / eBay / Google ... · Sachin Khattar, CFA * Equity Associate...
INDUSTRY NOTE
USA | Technology
Internet October 9, 2014
InternetAmazon / eBay / Google: September Same-Store-Sales Update
EQU
ITY R
ESEARC
H A
MERIC
AS
Jefferies US Internet Team *Jefferies Equity Research
[email protected] Pitz *
Equity Analyst(212) 336-7413 [email protected]
Brian Fitzgerald *Equity Analyst
(212) 284-2491 [email protected] Velikov, CFA *
Equity Associate(415) 229-1534 [email protected]
Timothy O'Shea *Equity Associate
(212) 284-3415 [email protected] Khattar, CFA *
Equity Associate(212) 323-3381 [email protected]
* Jefferies LLC
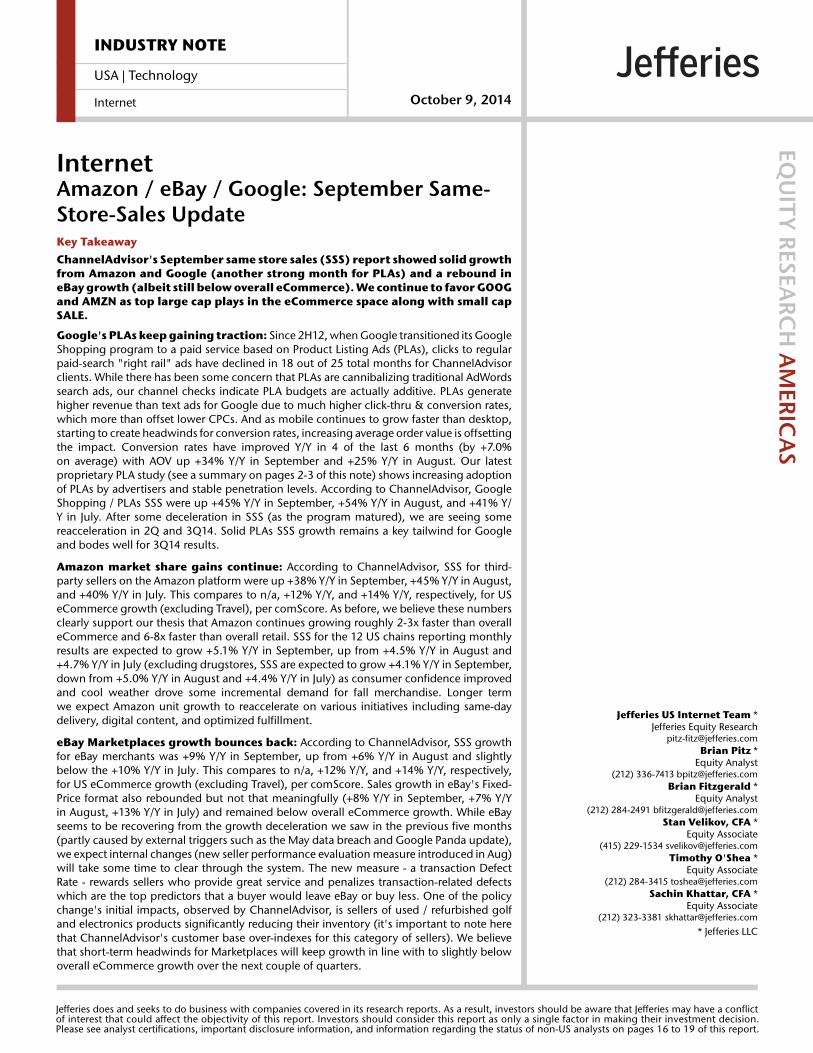
Key TakeawayChannelAdvisor's September same store sales (SSS) report showed solid growthfrom Amazon and Google (another strong month for PLAs) and a rebound ineBay growth (albeit still below overall eCommerce). We continue to favor GOOGand AMZN as top large cap plays in the eCommerce space along with small capSALE.
Google's PLAs keep gaining traction: Since 2H12, when Google transitioned its GoogleShopping program to a paid service based on Product Listing Ads (PLAs), clicks to regularpaid-search "right rail" ads have declined in 18 out of 25 total months for ChannelAdvisorclients. While there has been some concern that PLAs are cannibalizing traditional AdWordssearch ads, our channel checks indicate PLA budgets are actually additive. PLAs generatehigher revenue than text ads for Google due to much higher click-thru & conversion rates,which more than offset lower CPCs. And as mobile continues to grow faster than desktop,starting to create headwinds for conversion rates, increasing average order value is offsettingthe impact. Conversion rates have improved Y/Y in 4 of the last 6 months (by +7.0%on average) with AOV up +34% Y/Y in September and +25% Y/Y in August. Our latestproprietary PLA study (see a summary on pages 2-3 of this note) shows increasing adoptionof PLAs by advertisers and stable penetration levels. According to ChannelAdvisor, GoogleShopping / PLAs SSS were up +45% Y/Y in September, +54% Y/Y in August, and +41% Y/Y in July. After some deceleration in SSS (as the program matured), we are seeing somereacceleration in 2Q and 3Q14. Solid PLAs SSS growth remains a key tailwind for Googleand bodes well for 3Q14 results.
Amazon market share gains continue: According to ChannelAdvisor, SSS for third-party sellers on the Amazon platform were up +38% Y/Y in September, +45% Y/Y in August,and +40% Y/Y in July. This compares to n/a, +12% Y/Y, and +14% Y/Y, respectively, for USeCommerce growth (excluding Travel), per comScore. As before, we believe these numbersclearly support our thesis that Amazon continues growing roughly 2-3x faster than overalleCommerce and 6-8x faster than overall retail. SSS for the 12 US chains reporting monthlyresults are expected to grow +5.1% Y/Y in September, up from +4.5% Y/Y in August and+4.7% Y/Y in July (excluding drugstores, SSS are expected to grow +4.1% Y/Y in September,down from +5.0% Y/Y in August and +4.4% Y/Y in July) as consumer confidence improvedand cool weather drove some incremental demand for fall merchandise. Longer termwe expect Amazon unit growth to reaccelerate on various initiatives including same-daydelivery, digital content, and optimized fulfillment.
eBay Marketplaces growth bounces back: According to ChannelAdvisor, SSS growthfor eBay merchants was +9% Y/Y in September, up from +6% Y/Y in August and slightlybelow the +10% Y/Y in July. This compares to n/a, +12% Y/Y, and +14% Y/Y, respectively,for US eCommerce growth (excluding Travel), per comScore. Sales growth in eBay's Fixed-Price format also rebounded but not that meaningfully (+8% Y/Y in September, +7% Y/Yin August, +13% Y/Y in July) and remained below overall eCommerce growth. While eBayseems to be recovering from the growth deceleration we saw in the previous five months(partly caused by external triggers such as the May data breach and Google Panda update),we expect internal changes (new seller performance evaluation measure introduced in Aug)will take some time to clear through the system. The new measure - a transaction DefectRate - rewards sellers who provide great service and penalizes transaction-related defectswhich are the top predictors that a buyer would leave eBay or buy less. One of the policychange's initial impacts, observed by ChannelAdvisor, is sellers of used / refurbished golfand electronics products significantly reducing their inventory (it's important to note herethat ChannelAdvisor's customer base over-indexes for this category of sellers). We believethat short-term headwinds for Marketplaces will keep growth in line with to slightly belowoverall eCommerce growth over the next couple of quarters.
Jefferies does and seeks to do business with companies covered in its research reports. As a result, investors should be aware that Jefferies may have a conflictof interest that could affect the objectivity of this report. Investors should consider this report as only a single factor in making their investment decision.Please see analyst certifications, important disclosure information, and information regarding the status of non-US analysts on pages 16 to 19 of this report.
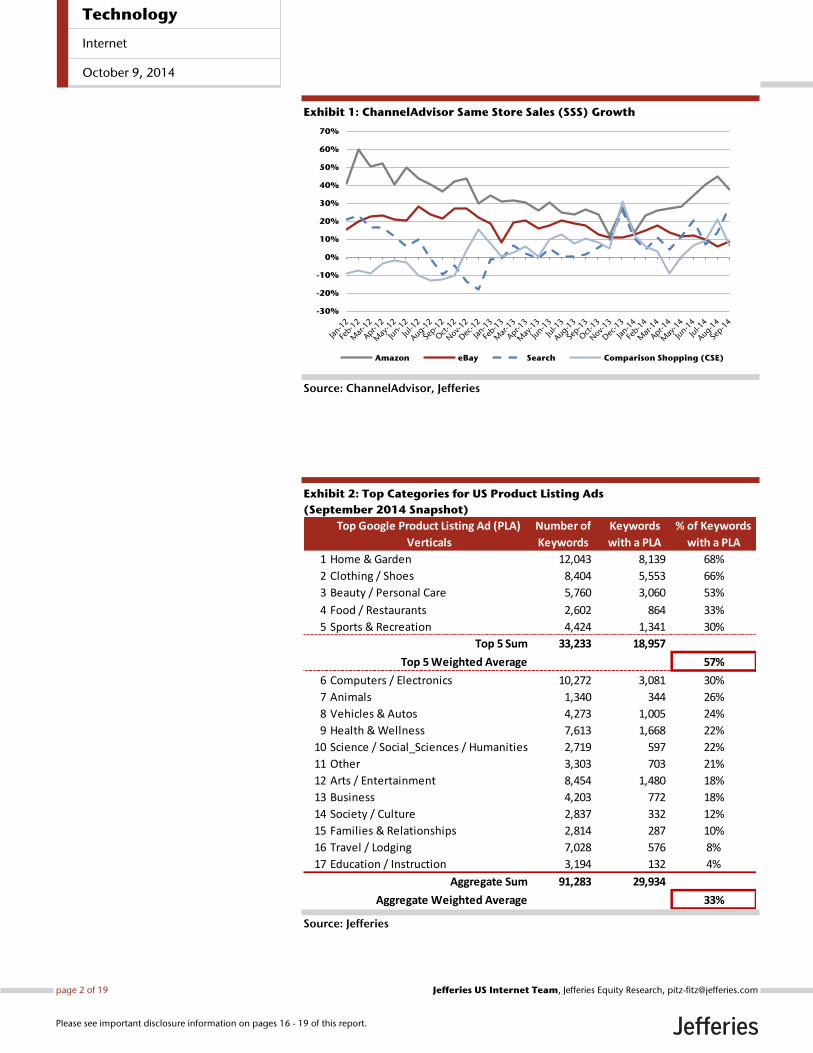
Exhibit 1: ChannelAdvisor Same Store Sales (SSS) Growth
Source: ChannelAdvisor, Jefferies
Exhibit 2: Top Categories for US Product Listing Ads
(September 2014 Snapshot)
Source: Jefferies
-30%
-20%
-10%
0%
10%
20%
30%
40%
50%
60%
70%
Amazon eBay Search Comparison Shopping (CSE)
Top Google Product Listing Ad (PLA)
Verticals
Number of
Keywords
Keywords
with a PLA
% of Keywords
with a PLA
1 Home & Garden 12,043 8,139 68%
2 Clothing / Shoes 8,404 5,553 66%
3 Beauty / Personal Care 5,760 3,060 53%
4 Food / Restaurants 2,602 864 33%
5 Sports & Recreation 4,424 1,341 30%
Top 5 Sum 33,233 18,957
Top 5 Weighted Average 57%
6 Computers / Electronics 10,272 3,081 30%
7 Animals 1,340 344 26%
8 Vehicles & Autos 4,273 1,005 24%
9 Health & Wellness 7,613 1,668 22%
10 Science / Social_Sciences / Humanities 2,719 597 22%
11 Other 3,303 703 21%
12 Arts / Entertainment 8,454 1,480 18%
13 Business 4,203 772 18%
14 Society / Culture 2,837 332 12%
15 Families & Relationships 2,814 287 10%
16 Travel / Lodging 7,028 576 8%
17 Education / Instruction 3,194 132 4%
Aggregate Sum 91,283 29,934
Aggregate Weighted Average 33%
Technology
Internet
October 9, 2014
page 2 of 19 , Jefferies Equity Research, [email protected] US Internet Team
Please see important disclosure information on pages 16 - 19 of this report.
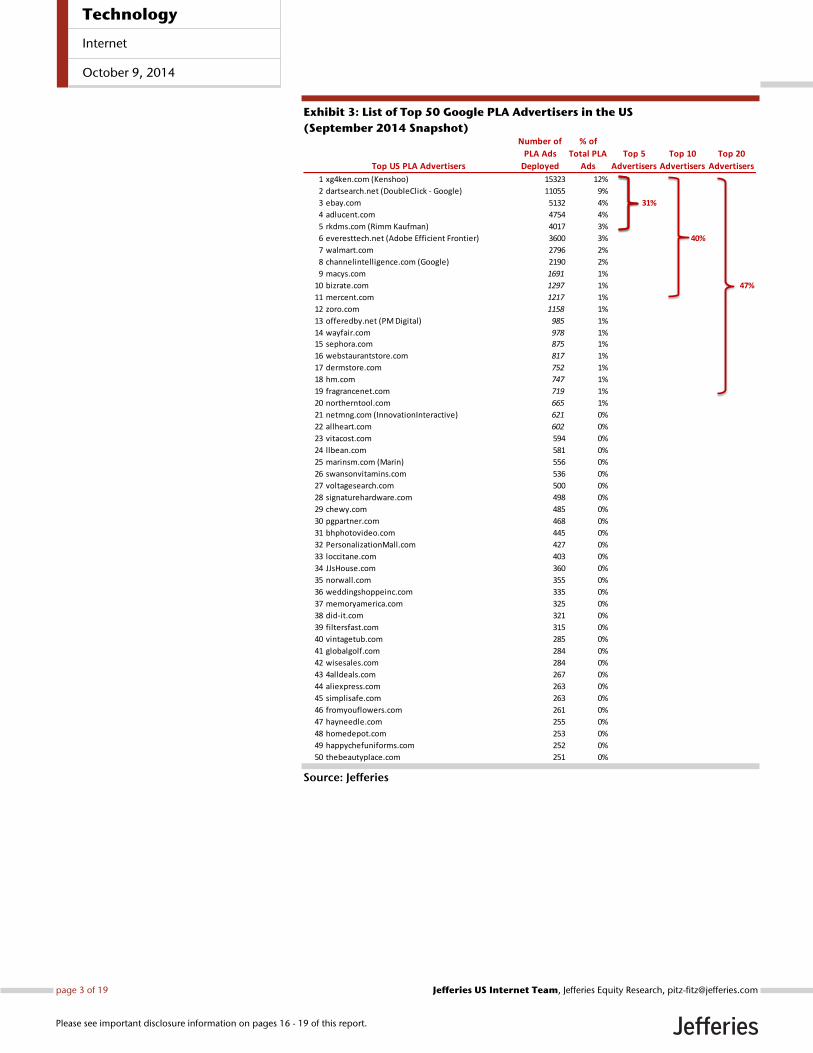
Exhibit 3: List of Top 50 Google PLA Advertisers in the US
(September 2014 Snapshot)
Source: Jefferies
Top US PLA Advertisers
Number of
PLA Ads
Deployed
% of
Total PLA
Ads
Top 5
Advertisers
Top 10
Advertisers
Top 20
Advertisers
1 xg4ken.com (Kenshoo) 15323 12%
2 dartsearch.net (DoubleClick - Google) 11055 9%
3 ebay.com 5132 4% 31%
4 adlucent.com 4754 4%
5 rkdms.com (Rimm Kaufman) 4017 3%
6 everesttech.net (Adobe Efficient Frontier) 3600 3% 40%
7 walmart.com 2796 2%
8 channelintelligence.com (Google) 2190 2%
9 macys.com 1691 1%
10 bizrate.com 1297 1% 47%
11 mercent.com 1217 1%
12 zoro.com 1158 1%
13 offeredby.net (PM Digital) 985 1%
14 wayfair.com 978 1%
15 sephora.com 875 1%
16 webstaurantstore.com 817 1%
17 dermstore.com 752 1%
18 hm.com 747 1%
19 fragrancenet.com 719 1%
20 northerntool.com 665 1%
21 netmng.com (InnovationInteractive) 621 0%
22 allheart.com 602 0%
23 vitacost.com 594 0%
24 llbean.com 581 0%
25 marinsm.com (Marin) 556 0%
26 swansonvitamins.com 536 0%
27 voltagesearch.com 500 0%
28 signaturehardware.com 498 0%
29 chewy.com 485 0%
30 pgpartner.com 468 0%
31 bhphotovideo.com 445 0%
32 PersonalizationMall.com 427 0%
33 loccitane.com 403 0%
34 JJsHouse.com 360 0%
35 norwall.com 355 0%
36 weddingshoppeinc.com 335 0%
37 memoryamerica.com 325 0%
38 did-it.com 321 0%
39 filtersfast.com 315 0%
40 vintagetub.com 285 0%
41 globalgolf.com 284 0%
42 wisesales.com 284 0%
43 4alldeals.com 267 0%
44 aliexpress.com 263 0%
45 simplisafe.com 263 0%
46 fromyouflowers.com 261 0%
47 hayneedle.com 255 0%
48 homedepot.com 253 0%
49 happychefuniforms.com 252 0%
50 thebeautyplace.com 251 0%
Technology
Internet
October 9, 2014
page 3 of 19 , Jefferies Equity Research, [email protected] US Internet Team
Please see important disclosure information on pages 16 - 19 of this report.
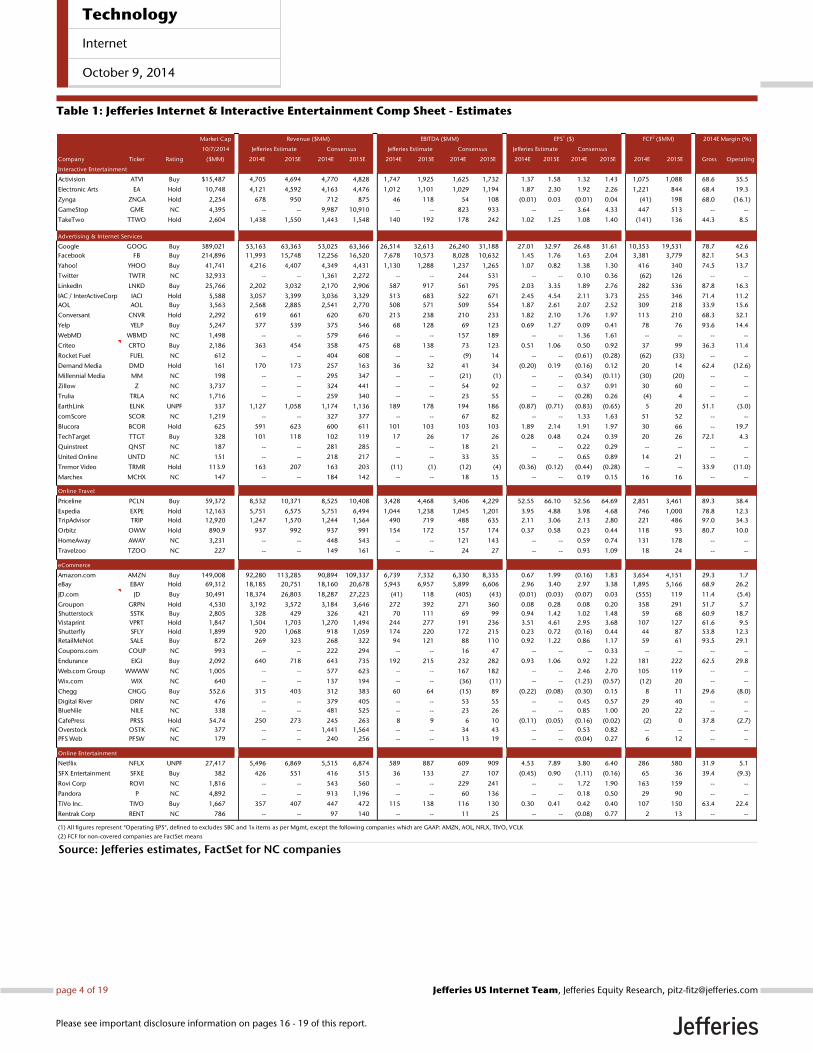
Table 1: Jefferies Internet & Interactive Entertainment Comp Sheet - Estimates
Source: Jefferies estimates, FactSet for NC companies
Market Cap
10/7/2014
Company Ticker Rating ($MM) 2014E 2015E 2014E 2015E 2014E 2015E 2014E 2015E 2014E 2015E 2014E 2015E 2014E 2015E Gross Operating
Interactive Entertainment
Activision ATVI Buy $15,487 4,705 4,694 4,770 4,828 1,747 1,925 1,625 1,732 1.37 1.58 1.32 1.43 1,075 1,088 68.6 35.5
Electronic Arts EA Hold 10,748 4,121 4,592 4,163 4,476 1,012 1,101 1,029 1,194 1.87 2.30 1.92 2.26 1,221 844 68.4 19.3
Zynga ZNGA Hold 2,254 678 950 712 875 46 118 54 108 (0.01) 0.03 (0.01) 0.04 (41) 198 68.0 (16.1)
GameStop GME NC 4,395 -- -- 9,987 10,910 -- -- 823 933 -- -- 3.64 4.33 447 513 -- --
TakeTwo TTWO Hold 2,604 1,438 1,550 1,443 1,548 140 192 178 242 1.02 1.25 1.08 1.40 (141) 136 44.3 8.5
Advertising & Internet Services
Google GOOG Buy 389,021 53,163 63,363 53,025 63,366 26,514 32,613 26,240 31,188 27.01 32.97 26.48 31.61 10,353 19,531 78.7 42.6
Facebook FB Buy 214,896 11,993 15,748 12,256 16,520 7,678 10,573 8,028 10,632 1.45 1.76 1.63 2.04 3,381 3,779 82.1 54.3
Yahoo! YHOO Buy 41,741 4,216 4,407 4,349 4,431 1,130 1,288 1,237 1,265 1.07 0.82 1.38 1.30 416 340 74.5 13.7
Twitter TWTR NC 32,933 -- -- 1,361 2,272 -- -- 244 531 -- -- 0.10 0.36 (62) 126 -- --
LinkedIn LNKD Buy 25,766 2,202 3,032 2,170 2,906 587 917 561 795 2.03 3.35 1.89 2.76 282 536 87.8 16.3
IAC / InterActiveCorp IACI Hold 5,588 3,057 3,399 3,036 3,329 513 683 522 671 2.45 4.54 2.11 3.73 255 346 71.4 11.2
AOL AOL Buy 3,563 2,568 2,885 2,541 2,770 508 571 509 554 1.87 2.61 2.07 2.52 309 218 33.9 15.6
Conversant CNVR Hold 2,292 619 661 620 670 213 238 210 233 1.82 2.10 1.76 1.97 113 210 68.3 32.1
Yelp YELP Buy 5,247 377 539 375 546 68 128 69 123 0.69 1.27 0.09 0.41 78 76 93.6 14.4
WebMD WBMD NC 1,498 -- -- 579 646 -- -- 157 189 -- -- 1.36 1.61 -- -- -- --
Criteo CRTO Buy 2,186 363 454 358 475 68 138 73 123 0.51 1.06 0.50 0.92 37 99 36.3 11.4
Rocket Fuel FUEL NC 612 -- -- 404 608 -- -- (9) 14 -- -- (0.61) (0.28) (62) (33) -- --
Demand Media DMD Hold 161 170 173 257 163 36 32 41 34 (0.20) 0.19 (0.16) 0.12 20 14 62.4 (12.6)
Millennial Media MM NC 198 -- -- 295 347 -- -- (21) (1) -- -- (0.34) (0.11) (30) (20) -- --
Zillow Z NC 3,737 -- -- 324 441 -- -- 54 92 -- -- 0.37 0.91 30 60 -- --
Trulia TRLA NC 1,716 -- -- 259 340 -- -- 23 55 -- -- (0.28) 0.26 (4) 4 -- --
EarthLink ELNK UNPF 337 1,127 1,058 1,174 1,136 189 178 194 186 (0.87) (0.71) (0.83) (0.65) 5 20 51.1 (3.0)
comScore SCOR NC 1,219 -- -- 327 377 -- -- 67 82 -- -- 1.33 1.63 51 52 -- --
Blucora BCOR Hold 625 591 623 600 611 101 103 103 103 1.89 2.14 1.91 1.97 30 66 -- 19.7
TechTarget TTGT Buy 328 101 118 102 119 17 26 17 26 0.28 0.48 0.24 0.39 20 26 72.1 4.3
Quinstreet QNST NC 187 -- -- 281 285 -- -- 18 21 -- -- 0.22 0.29 -- -- -- --
United Online UNTD NC 151 -- -- 218 217 -- -- 33 35 -- -- 0.65 0.89 14 21 -- --
Tremor Video TRMR Hold 113.9 163 207 163 203 (11) (1) (12) (4) (0.36) (0.12) (0.44) (0.28) -- -- 33.9 (11.0)
Marchex MCHX NC 147 -- -- 184 142 -- -- 18 15 -- -- 0.19 0.15 16 16 -- --
Online Travel
Priceline PCLN Buy 59,372 8,532 10,371 8,525 10,408 3,428 4,468 3,406 4,229 52.55 66.10 52.56 64.69 2,851 3,461 89.3 38.4
Expedia EXPE Hold 12,163 5,751 6,575 5,751 6,494 1,044 1,238 1,045 1,201 3.95 4.88 3.98 4.68 746 1,000 78.8 12.3
TripAdvisor TRIP Hold 12,920 1,247 1,570 1,244 1,564 490 719 488 635 2.11 3.06 2.13 2.80 221 486 97.0 34.3
Orbitz OWW Hold 890.9 937 992 937 991 154 172 157 174 0.37 0.58 0.23 0.44 118 93 80.7 10.0
HomeAway AWAY NC 3,231 -- -- 448 543 -- -- 121 143 -- -- 0.59 0.74 131 178 -- --
Travelzoo TZOO NC 227 -- -- 149 161 -- -- 24 27 -- -- 0.93 1.09 18 24 -- --
eCommerce
Amazon.com AMZN Buy 149,008 92,280 113,285 90,894 109,337 6,739 7,332 6,330 8,335 0.67 1.99 (0.16) 1.83 3,654 4,151 29.3 1.7
eBay EBAY Hold 69,312 18,185 20,751 18,160 20,678 5,943 6,957 5,899 6,606 2.96 3.40 2.97 3.38 1,895 5,166 68.9 26.2
JD.com JD Buy 30,491 18,374 26,803 18,287 27,223 (41) 118 (405) (43) (0.01) (0.03) (0.07) 0.03 (555) 119 11.4 (5.4)
Groupon GRPN Hold 4,530 3,192 3,572 3,184 3,646 272 392 271 360 0.08 0.28 0.08 0.20 358 291 51.7 5.7
Shutterstock SSTK Buy 2,805 328 429 326 421 70 111 69 99 0.94 1.42 1.02 1.48 59 68 60.9 18.7
Vistaprint VPRT Hold 1,847 1,504 1,703 1,270 1,494 244 277 191 236 3.51 4.61 2.95 3.68 107 127 61.6 9.5
Shutterfly SFLY Hold 1,899 920 1,068 918 1,059 174 220 172 215 0.23 0.72 (0.16) 0.44 44 87 53.8 12.3
RetailMeNot SALE Buy 872 269 323 268 322 94 121 88 110 0.92 1.22 0.86 1.17 59 61 93.5 29.1
Coupons.com COUP NC 993 -- -- 222 294 -- -- 16 47 -- -- -- 0.33 -- -- -- --
Endurance EIGI Buy 2,092 640 718 643 735 192 215 232 282 0.93 1.06 0.92 1.22 181 222 62.5 29.8
Web.com Group WWWW NC 1,005 -- -- 577 623 -- -- 167 182 -- -- 2.46 2.70 105 119 -- --
Wix.com WIX NC 640 -- -- 137 194 -- -- (36) (11) -- -- (1.23) (0.57) (12) 20 -- --
Chegg CHGG Buy 552.6 315 403 312 383 60 64 (15) 89 (0.22) (0.08) (0.30) 0.15 8 11 29.6 (8.0)
Digital River DRIV NC 476 -- -- 379 405 -- -- 53 55 -- -- 0.45 0.57 29 40 -- --
BlueNile NILE NC 338 -- -- 481 525 -- -- 23 26 -- -- 0.85 1.00 20 22 -- --
CafePress PRSS Hold 54.74 250 273 245 263 8 9 6 10 (0.11) (0.05) (0.16) (0.02) (2) 0 37.8 (2.7)
Overstock OSTK NC 377 -- -- 1,441 1,564 -- -- 34 43 -- -- 0.53 0.82 -- -- -- --
PFS Web PFSW NC 179 -- -- 240 256 -- -- 13 19 -- -- (0.04) 0.27 6 12 -- --
Online Entertainment
Netflix NFLX UNPF 27,417 5,496 6,869 5,515 6,874 589 887 609 909 4.53 7.89 3.80 6.40 286 580 31.9 5.1
SFX Entertainment SFXE Buy 382 426 551 416 515 36 133 27 107 (0.45) 0.90 (1.11) (0.16) 65 36 39.4 (9.3)
Rovi Corp ROVI NC 1,816 -- -- 543 560 -- -- 229 241 -- -- 1.72 1.90 163 159 -- --
Pandora P NC 4,892 -- -- 913 1,196 -- -- 60 136 -- -- 0.18 0.50 29 90 -- --
TiVo Inc. TIVO Buy 1,667 357 407 447 472 115 138 116 130 0.30 0.41 0.42 0.40 107 150 63.4 22.4
Rentrak Corp RENT NC 786 -- -- 97 140 -- -- 11 25 -- -- (0.08) 0.77 2 13 -- --
(1) All figures represent "Operating EPS", defined to excludes SBC and 1x items as per Mgmt, except the following companies which are GAAP: AMZN, AOL, NFLX, TIVO, VCLK
(2) FCF for non-covered companies are FactSet means
EPS1 ($)
Jefferies Estimate Consensus
FCF2 ($MM) 2014E Margin (%) Revenue ($MM)
Jefferies Estimate Consensus
EBITDA ($MM)
Jefferies Estimate Consensus
Technology
Internet
October 9, 2014
page 4 of 19 , Jefferies Equity Research, [email protected] US Internet Team
Please see important disclosure information on pages 16 - 19 of this report.
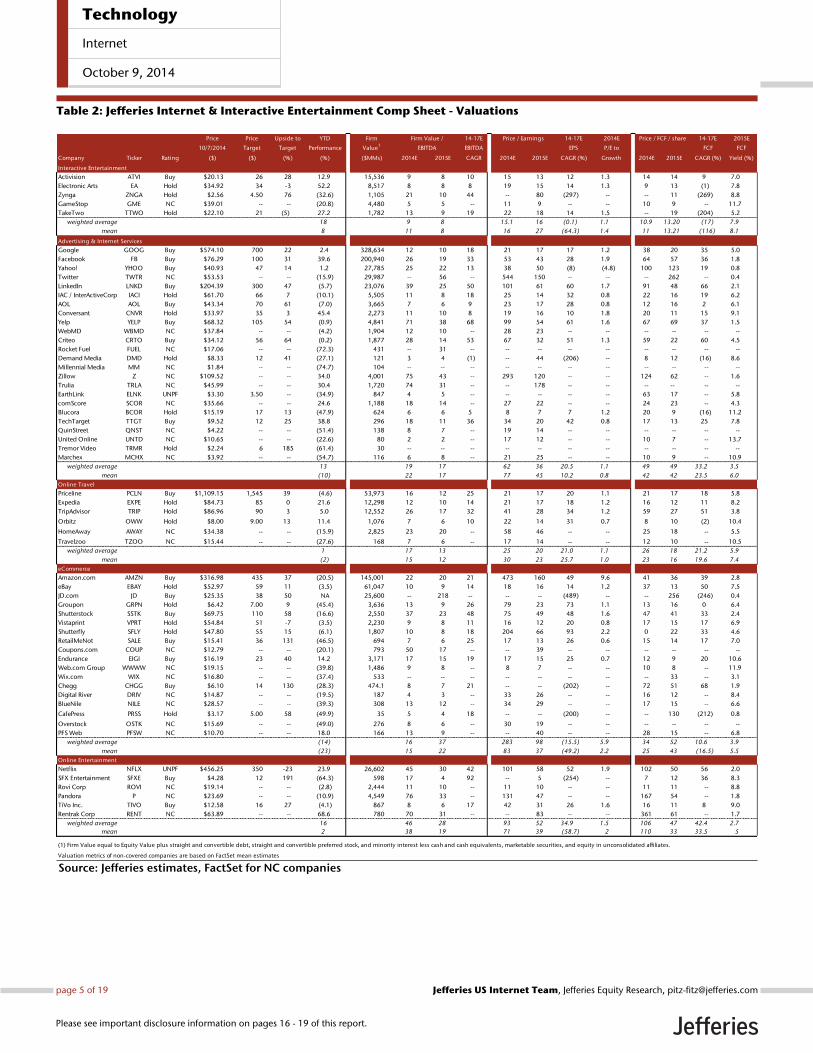
Table 2: Jefferies Internet & Interactive Entertainment Comp Sheet - Valuations
Source: Jefferies estimates, FactSet for NC companies
Price Price Upside to YTD Firm 14-17E 14-17E 2014E 14-17E 2015E
10/7/2014 Target Target Performance Value1
EBITDA EPS P/E to FCF FCF
Company Ticker Rating ($) ($) (%) (%) ($MMs) 2014E 2015E CAGR 2014E 2015E CAGR (%) Growth 2014E 2015E CAGR (%) Yield (%)
Interactive Entertainment
Activision ATVI Buy $20.13 26 28 12.9 15,536 9 8 10 15 13 12 1.3 14 14 9 7.0
Electronic Arts EA Hold $34.92 34 -3 52.2 8,517 8 8 8 19 15 14 1.3 9 13 (1) 7.8
Zynga ZNGA Hold $2.56 4.50 76 (32.6) 1,105 21 10 44 -- 80 (297) -- -- 11 (269) 8.8
GameStop GME NC $39.01 -- -- (20.8) 4,480 5 5 -- 11 9 -- -- 10 9 -- 11.7
TakeTwo TTWO Hold $22.10 21 (5) 27.2 1,782 13 9 19 22 18 14 1.5 -- 19 (204) 5.2
weighted average 18 9 8 15.1 16 (0.1) 1.1 10.9 13.20 (17) 7.9
mean 8 11 8 16 27 (64.3) 1.4 11 13.21 (116) 8.1
Advertising & Internet Services
Google GOOG Buy $574.10 700 22 2.4 328,634 12 10 18 21 17 17 1.2 38 20 35 5.0
Facebook FB Buy $76.29 100 31 39.6 200,940 26 19 33 53 43 28 1.9 64 57 36 1.8
Yahoo! YHOO Buy $40.93 47 14 1.2 27,785 25 22 13 38 50 (8) (4.8) 100 123 19 0.8
Twitter TWTR NC $53.53 -- -- (15.9) 29,987 -- 56 -- 544 150 -- -- -- 262 -- 0.4
LinkedIn LNKD Buy $204.39 300 47 (5.7) 23,076 39 25 50 101 61 60 1.7 91 48 66 2.1
IAC / InterActiveCorp IACI Hold $61.70 66 7 (10.1) 5,505 11 8 18 25 14 32 0.8 22 16 19 6.2
AOL AOL Buy $43.34 70 61 (7.0) 3,665 7 6 9 23 17 28 0.8 12 16 2 6.1
Conversant CNVR Hold $33.97 35 3 45.4 2,273 11 10 8 19 16 10 1.8 20 11 15 9.1
Yelp YELP Buy $68.32 105 54 (0.9) 4,841 71 38 68 99 54 61 1.6 67 69 37 1.5
WebMD WBMD NC $37.84 -- -- (4.2) 1,904 12 10 -- 28 23 -- -- -- -- -- --
Criteo CRTO Buy $34.12 56 64 (0.2) 1,877 28 14 53 67 32 51 1.3 59 22 60 4.5
Rocket Fuel FUEL NC $17.06 -- -- (72.3) 431 -- 31 -- -- -- -- -- -- -- -- --
Demand Media DMD Hold $8.33 12 41 (27.1) 121 3 4 (1) -- 44 (206) -- 8 12 (16) 8.6
Millennial Media MM NC $1.84 -- -- (74.7) 104 -- -- -- -- -- -- -- -- -- -- --
Zillow Z NC $109.52 -- -- 34.0 4,001 75 43 -- 293 120 -- -- 124 62 -- 1.6
Trulia TRLA NC $45.99 -- -- 30.4 1,720 74 31 -- -- 178 -- -- -- -- -- --
EarthLink ELNK UNPF $3.30 3.50 -- (34.9) 847 4 5 -- -- -- -- -- 63 17 -- 5.8
comScore SCOR NC $35.66 -- -- 24.6 1,188 18 14 -- 27 22 -- -- 24 23 -- 4.3
Blucora BCOR Hold $15.19 17 13 (47.9) 624 6 6 5 8 7 7 1.2 20 9 (16) 11.2
TechTarget TTGT Buy $9.52 12 25 38.8 296 18 11 36 34 20 42 0.8 17 13 25 7.8
QuinStreet QNST NC $4.22 -- -- (51.4) 138 8 7 -- 19 14 -- -- -- -- -- --
United Online UNTD NC $10.65 -- -- (22.6) 80 2 2 -- 17 12 -- -- 10 7 -- 13.7
Tremor Video TRMR Hold $2.24 6 185 (61.4) 30 -- -- -- -- -- -- -- -- -- -- --
Marchex MCHX NC $3.92 -- -- (54.7) 116 6 8 -- 21 25 -- -- 10 9 -- 10.9
weighted average 13 19 17 62 36 20.5 1.1 49 49 33.2 3.5
mean (10) 22 17 77 45 10.2 0.8 42 42 23.5 6.0
Online Travel
Priceline PCLN Buy $1,109.15 1,545 39 (4.6) 53,973 16 12 25 21 17 20 1.1 21 17 18 5.8
Expedia EXPE Hold $84.73 85 0 21.6 12,298 12 10 14 21 17 18 1.2 16 12 11 8.2
TripAdvisor TRIP Hold $86.96 90 3 5.0 12,552 26 17 32 41 28 34 1.2 59 27 51 3.8
Orbitz OWW Hold $8.00 9.00 13 11.4 1,076 7 6 10 22 14 31 0.7 8 10 (2) 10.4
HomeAway AWAY NC $34.38 -- -- (15.9) 2,825 23 20 -- 58 46 -- -- 25 18 -- 5.5
Travelzoo TZOO NC $15.44 -- -- (27.6) 168 7 6 -- 17 14 -- -- 12 10 -- 10.5
weighted average 1 17 13 25 20 21.0 1.1 26 18 21.2 5.9
mean (2) 15 12 30 23 25.7 1.0 23 16 19.6 7.4
eCommerce
Amazon.com AMZN Buy $316.98 435 37 (20.5) 145,001 22 20 21 473 160 49 9.6 41 36 39 2.8
eBay EBAY Hold $52.97 59 11 (3.5) 61,047 10 9 14 18 16 14 1.2 37 13 50 7.5
JD.com JD Buy $25.35 38 50 NA 25,600 -- 218 -- -- -- (489) -- -- 256 (246) 0.4
Groupon GRPN Hold $6.42 7.00 9 (45.4) 3,636 13 9 26 79 23 73 1.1 13 16 0 6.4
Shutterstock SSTK Buy $69.75 110 58 (16.6) 2,550 37 23 48 75 49 48 1.6 47 41 33 2.4
Vistaprint VPRT Hold $54.84 51 -7 (3.5) 2,230 9 8 11 16 12 20 0.8 17 15 17 6.9
Shutterfly SFLY Hold $47.80 55 15 (6.1) 1,807 10 8 18 204 66 93 2.2 0 22 33 4.6
RetailMeNot SALE Buy $15.41 36 131 (46.5) 694 7 6 25 17 13 26 0.6 15 14 17 7.0
Coupons.com COUP NC $12.79 -- -- (20.1) 793 50 17 -- -- 39 -- -- -- -- -- --
Endurance EIGI Buy $16.19 23 40 14.2 3,171 17 15 19 17 15 25 0.7 12 9 20 10.6
Web.com Group WWWW NC $19.15 -- -- (39.8) 1,486 9 8 -- 8 7 -- -- 10 8 -- 11.9
Wix.com WIX NC $16.80 -- -- (37.4) 533 -- -- -- -- -- -- -- -- 33 -- 3.1
Chegg CHGG Buy $6.10 14 130 (28.3) 474.1 8 7 21 -- -- (202) -- 72 51 68 1.9
Digital River DRIV NC $14.87 -- -- (19.5) 187 4 3 -- 33 26 -- -- 16 12 -- 8.4
BlueNile NILE NC $28.57 -- -- (39.3) 308 13 12 -- 34 29 -- -- 17 15 -- 6.6
CafePress PRSS Hold $3.17 5.00 58 (49.9) 35 5 4 18 -- -- (200) -- -- 130 (212) 0.8
Overstock OSTK NC $15.69 -- -- (49.0) 276 8 6 -- 30 19 -- -- -- -- -- --
PFS Web PFSW NC $10.70 -- -- 18.0 166 13 9 -- -- 40 -- -- 28 15 -- 6.8
weighted average (14) 16 37 283 98 (15.5) 5.9 34 52 10.6 3.9
mean (23) 15 22 83 37 (49.2) 2.2 25 43 (16.5) 5.5
Online Entertainment
Netflix NFLX UNPF $456.25 350 -23 23.9 26,602 45 30 42 101 58 52 1.9 102 50 56 2.0
SFX Entertainment SFXE Buy $4.28 12 191 (64.3) 598 17 4 92 -- 5 (254) -- 7 12 36 8.3
Rovi Corp ROVI NC $19.14 -- -- (2.8) 2,444 11 10 -- 11 10 -- -- 11 11 -- 8.8
Pandora P NC $23.69 -- -- (10.9) 4,549 76 33 -- 131 47 -- -- 167 54 -- 1.8
TiVo Inc. TIVO Buy $12.58 16 27 (4.1) 867 8 6 17 42 31 26 1.6 16 11 8 9.0
Rentrak Corp RENT NC $63.89 -- -- 68.6 780 70 31 -- -- 83 -- -- 361 61 -- 1.7
weighted average 16 46 28 93 52 34.9 1.5 106 47 42.4 2.7
mean 2 38 19 71 39 (58.7) 2 110 33 33.5 5
Valuation metrics of non-covered companies are based on FactSet mean estimates
(1) Firm Value equal to Equity Value plus straight and convertible debt, straight and convertible preferred stock, and minority interest less cash and cash equivalents, marketable securities, and equity in unconsolidated affiliates.
Price / Earnings
Firm Value /
EBITDA
Price / FCF / share
Technology
Internet
October 9, 2014
page 5 of 19 , Jefferies Equity Research, [email protected] US Internet Team
Please see important disclosure information on pages 16 - 19 of this report.
AMZN Model
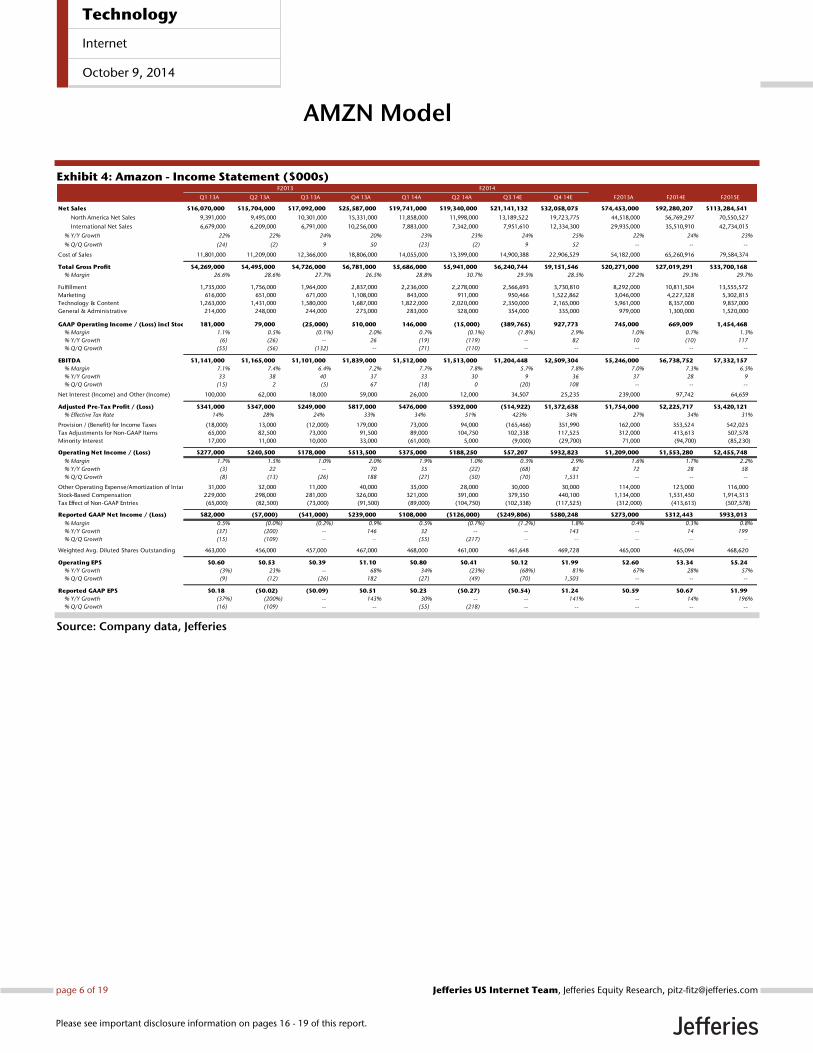
Exhibit 4: Amazon - Income Statement ($000s)
Source: Company data, Jefferies
Q1 13A Q2 13A Q3 13A Q4 13A Q1 14A Q2 14A Q3 14E Q4 14E F2013A F2014E F2015E
Net Sales $16,070,000 $15,704,000 $17,092,000 $25,587,000 $19,741,000 $19,340,000 $21,141,132 $32,058,075 $74,453,000 $92,280,207 $113,284,541
North America Net Sales 9,391,000 9,495,000 10,301,000 15,331,000 11,858,000 11,998,000 13,189,522 19,723,775 44,518,000 56,769,297 70,550,527
International Net Sales 6,679,000 6,209,000 6,791,000 10,256,000 7,883,000 7,342,000 7,951,610 12,334,300 29,935,000 35,510,910 42,734,015
% Y/Y Growth 22% 22% 24% 20% 23% 23% 24% 25% 22% 24% 23%
% Q/Q Growth (24) (2) 9 50 (23) (2) 9 52 -- -- --
Cost of Sales 11,801,000 11,209,000 12,366,000 18,806,000 14,055,000 13,399,000 14,900,388 22,906,529 54,182,000 65,260,916 79,584,374
Total Gross Profit $4,269,000 $4,495,000 $4,726,000 $6,781,000 $5,686,000 $5,941,000 $6,240,744 $9,151,546 $20,271,000 $27,019,291 $33,700,168
% Margin 26.6% 28.6% 27.7% 26.5% 28.8% 30.7% 29.5% 28.5% 27.2% 29.3% 29.7%
Fulfillment 1,735,000 1,756,000 1,964,000 2,837,000 2,236,000 2,278,000 2,566,693 3,730,810 8,292,000 10,811,504 13,555,572
Marketing 616,000 651,000 671,000 1,108,000 843,000 911,000 950,466 1,522,862 3,046,000 4,227,328 5,302,815
Technology & Content 1,263,000 1,431,000 1,580,000 1,687,000 1,822,000 2,020,000 2,350,000 2,165,000 5,961,000 8,357,000 9,837,000
General & Administrative 214,000 248,000 244,000 273,000 283,000 328,000 354,000 335,000 979,000 1,300,000 1,520,000
GAAP Operating Income / (Loss) incl Stock Comp & Amort. of Intangibles181,000 79,000 (25,000) 510,000 146,000 (15,000) (389,765) 927,773 745,000 669,009 1,454,468
% Margin 1.1% 0.5% (0.1%) 2.0% 0.7% (0.1%) (1.8%) 2.9% 1.0% 0.7% 1.3%
% Y/Y Growth (6) (26) -- 26 (19) (119) -- 82 10 (10) 117
% Q/Q Growth (55) (56) (132) -- (71) (110) -- -- -- -- --
EBITDA $1,141,000 $1,165,000 $1,101,000 $1,839,000 $1,512,000 $1,513,000 $1,204,448 $2,509,304 $5,246,000 $6,738,752 $7,332,157
% Margin 7.1% 7.4% 6.4% 7.2% 7.7% 7.8% 5.7% 7.8% 7.0% 7.3% 6.5%
% Y/Y Growth 33 38 40 37 33 30 9 36 37 28 9
% Q/Q Growth (15) 2 (5) 67 (18) 0 (20) 108 -- -- --
Net Interest (Income) and Other (Income) 100,000 62,000 18,000 59,000 26,000 12,000 34,507 25,235 239,000 97,742 64,659
Adjusted Pre-Tax Profit / (Loss) $341,000 $347,000 $249,000 $817,000 $476,000 $392,000 ($14,922) $1,372,638 $1,754,000 $2,225,717 $3,420,121
% Effective Tax Rate 14% 28% 24% 33% 34% 51% 423% 34% 27% 34% 31%
Provision / (Benefit) for Income Taxes (18,000) 13,000 (12,000) 179,000 73,000 94,000 (165,466) 351,990 162,000 353,524 542,025
Tax Adjustments for Non-GAAP Items 65,000 82,500 73,000 91,500 89,000 104,750 102,338 117,525 312,000 413,613 507,578
Minority Interest 17,000 11,000 10,000 33,000 (61,000) 5,000 (9,000) (29,700) 71,000 (94,700) (85,230)
Operating Net Income / (Loss) $277,000 $240,500 $178,000 $513,500 $375,000 $188,250 $57,207 $932,823 $1,209,000 $1,553,280 $2,455,748
% Margin 1.7% 1.5% 1.0% 2.0% 1.9% 1.0% 0.3% 2.9% 1.6% 1.7% 2.2%
% Y/Y Growth (3) 22 -- 70 35 (22) (68) 82 72 28 58
% Q/Q Growth (8) (13) (26) 188 (27) (50) (70) 1,531 -- -- --
Other Operating Expense/Amortization of Intangibles 31,000 32,000 11,000 40,000 35,000 28,000 30,000 30,000 114,000 123,000 116,000
Stock-Based Compensation 229,000 298,000 281,000 326,000 321,000 391,000 379,350 440,100 1,134,000 1,531,450 1,914,313
Tax Effect of Non-GAAP Entries (65,000) (82,500) (73,000) (91,500) (89,000) (104,750) (102,338) (117,525) (312,000) (413,613) (507,578)
Reported GAAP Net Income / (Loss) $82,000 ($7,000) ($41,000) $239,000 $108,000 ($126,000) ($249,806) $580,248 $273,000 $312,443 $933,013
% Margin 0.5% (0.0%) (0.2%) 0.9% 0.5% (0.7%) (1.2%) 1.8% 0.4% 0.3% 0.8%
% Y/Y Growth (37) (200) -- 146 32 -- -- 143 -- 14 199
% Q/Q Growth (15) (109) -- -- (55) (217) -- -- -- -- --
Weighted Avg. Diluted Shares Outstanding 463,000 456,000 457,000 467,000 468,000 461,000 461,648 469,728 465,000 465,094 468,620
Operating EPS $0.60 $0.53 $0.39 $1.10 $0.80 $0.41 $0.12 $1.99 $2.60 $3.34 $5.24
% Y/Y Growth (3%) 23% -- 68% 34% (23%) (68%) 81% 67% 28% 57%
% Q/Q Growth (9) (12) (26) 182 (27) (49) (70) 1,503 -- -- --
Reported GAAP EPS $0.18 ($0.02) ($0.09) $0.51 $0.23 ($0.27) ($0.54) $1.24 $0.59 $0.67 $1.99
% Y/Y Growth (37%) (200%) -- 143% 30% -- -- 141% -- 14% 196%
% Q/Q Growth (16) (109) -- -- (55) (218) -- -- -- -- --
F2013 F2014
Technology
Internet
October 9, 2014
page 6 of 19 , Jefferies Equity Research, [email protected] US Internet Team
Please see important disclosure information on pages 16 - 19 of this report.
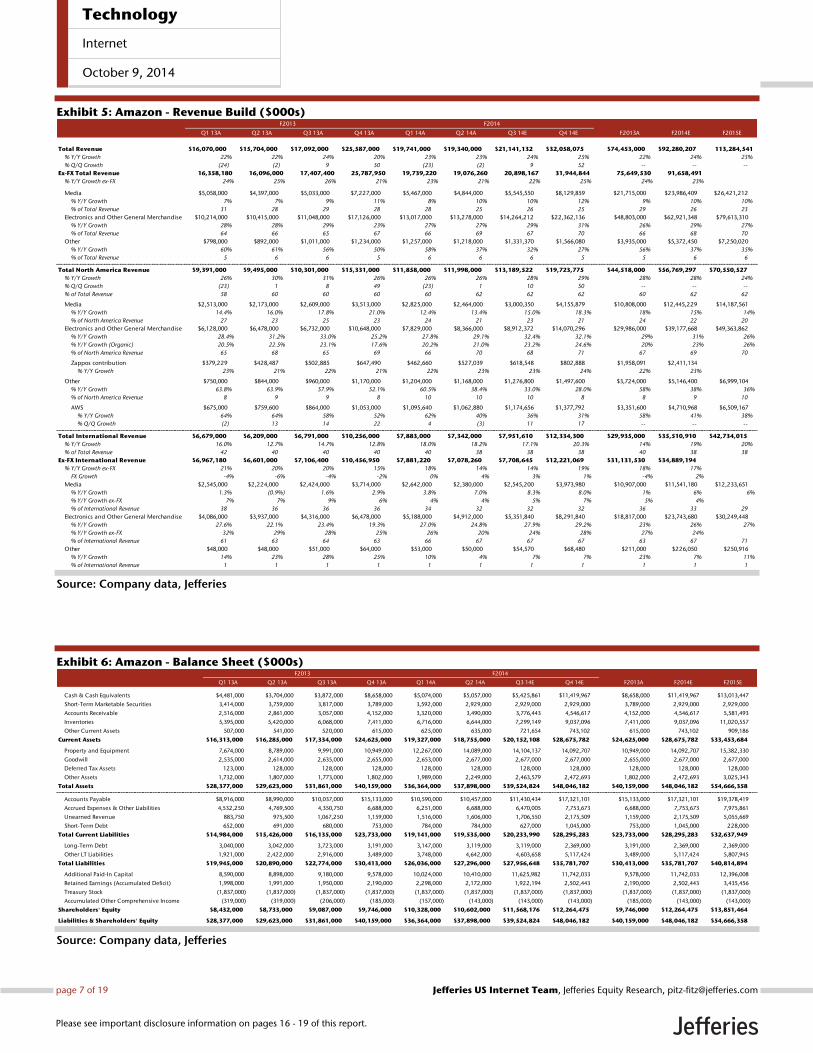
Exhibit 5: Amazon - Revenue Build ($000s)
Source: Company data, Jefferies
Exhibit 6: Amazon - Balance Sheet ($000s)
Source: Company data, Jefferies
Q1 13A Q2 13A Q3 13A Q4 13A Q1 14A Q2 14A Q3 14E Q4 14E F2013A F2014E F2015E
Total Revenue $16,070,000 $15,704,000 $17,092,000 $25,587,000 $19,741,000 $19,340,000 $21,141,132 $32,058,075 $74,453,000 $92,280,207 113,284,541
% Y/Y Growth 22% 22% 24% 20% 23% 23% 24% 25% 22% 24% 23%
% Q/Q Growth (24) (2) 9 50 (23) (2) 9 52 -- -- --
Ex-FX Total Revenue 16,358,180 16,096,000 17,407,400 25,787,950 19,739,220 19,076,260 20,898,167 31,944,844 75,649,530 91,658,491
% Y/Y Growth ex-FX 24% 25% 26% 21% 23% 21% 22% 25% 24% 23%
Media $5,058,000 $4,397,000 $5,033,000 $7,227,000 $5,467,000 $4,844,000 $5,545,550 $8,129,859 $21,715,000 $23,986,409 $26,421,212
% Y/Y Growth 7% 7% 9% 11% 8% 10% 10% 12% 9% 10% 10%
% of Total Revenue 31 28 29 28 28 25 26 25 29 26 23
Electronics and Other General Merchandise $10,214,000 $10,415,000 $11,048,000 $17,126,000 $13,017,000 $13,278,000 $14,264,212 $22,362,136 $48,803,000 $62,921,348 $79,613,310
% Y/Y Growth 28% 28% 29% 23% 27% 27% 29% 31% 26% 29% 27%
% of Total Revenue 64 66 65 67 66 69 67 70 66 68 70
Other $798,000 $892,000 $1,011,000 $1,234,000 $1,257,000 $1,218,000 $1,331,370 $1,566,080 $3,935,000 $5,372,450 $7,250,020
% Y/Y Growth 60% 61% 56% 50% 58% 37% 32% 27% 56% 37% 35%
% of Total Revenue 5 6 6 5 6 6 6 5 5 6 6
Total North America Revenue $9,391,000 $9,495,000 $10,301,000 $15,331,000 $11,858,000 $11,998,000 $13,189,522 $19,723,775 $44,518,000 $56,769,297 $70,550,527
% Y/Y Growth 26% 30% 31% 26% 26% 26% 28% 29% 28% 28% 24%
% Q/Q Growth (23) 1 8 49 (23) 1 10 50 -- -- --
% of Total Revenue 58 60 60 60 60 62 62 62 60 62 62
Media $2,513,000 $2,173,000 $2,609,000 $3,513,000 $2,825,000 $2,464,000 $3,000,350 $4,155,879 $10,808,000 $12,445,229 $14,187,561
% Y/Y Growth 14.4% 16.0% 17.8% 21.0% 12.4% 13.4% 15.0% 18.3% 18% 15% 14%
% of North America Revenue 27 23 25 23 24 21 23 21 24 22 20
Electronics and Other General Merchandise $6,128,000 $6,478,000 $6,732,000 $10,648,000 $7,829,000 $8,366,000 $8,912,372 $14,070,296 $29,986,000 $39,177,668 $49,363,862
% Y/Y Growth 28.4% 31.2% 33.0% 25.2% 27.8% 29.1% 32.4% 32.1% 29% 31% 26%
% Y/Y Growth (Organic) 20.5% 22.5% 23.1% 17.6% 20.2% 21.0% 23.2% 24.6% 20% 23% 26%
% of North America Revenue 65 68 65 69 66 70 68 71 67 69 70
Zappos contribution $379,229 $428,487 $502,885 $647,490 $462,660 $527,039 $618,548 $802,888 $1,958,091 $2,411,134
% Y/Y Growth 23% 21% 22% 21% 22% 23% 23% 24% 22% 23%
Other $750,000 $844,000 $960,000 $1,170,000 $1,204,000 $1,168,000 $1,276,800 $1,497,600 $3,724,000 $5,146,400 $6,999,104
% Y/Y Growth 63.8% 63.9% 57.9% 52.1% 60.5% 38.4% 33.0% 28.0% 58% 38% 36%
% of North America Revenue 8 9 9 8 10 10 10 8 8 9 10
AWS $675,000 $759,600 $864,000 $1,053,000 $1,095,640 $1,062,880 $1,174,656 $1,377,792 $3,351,600 $4,710,968 $6,509,167
% Y/Y Growth 64% 64% 58% 52% 62% 40% 36% 31% 58% 41% 38%
% Q/Q Growth (2) 13 14 22 4 (3) 11 17 -- -- --
Total International Revenue $6,679,000 $6,209,000 $6,791,000 $10,256,000 $7,883,000 $7,342,000 $7,951,610 $12,334,300 $29,935,000 $35,510,910 $42,734,015
% Y/Y Growth 16.0% 12.7% 14.7% 12.8% 18.0% 18.2% 17.1% 20.3% 14% 19% 20%
% of Total Revenue 42 40 40 40 40 38 38 38 40 38 38
Ex-FX International Revenue $6,967,180 $6,601,000 $7,106,400 $10,456,950 $7,881,220 $7,078,260 $7,708,645 $12,221,069 $31,131,530 $34,889,194
% Y/Y Growth ex-FX 21% 20% 20% 15% 18% 14% 14% 19% 18% 17%
FX Growth -4% -6% -4% -2% 0% 4% 3% 1% -4% 2%
Media $2,545,000 $2,224,000 $2,424,000 $3,714,000 $2,642,000 $2,380,000 $2,545,200 $3,973,980 $10,907,000 $11,541,180 $12,233,651
% Y/Y Growth 1.3% (0.9%) 1.6% 2.9% 3.8% 7.0% 8.3% 8.0% 1% 6% 6%
% Y/Y Growth ex-FX 7% 7% 9% 6% 4% 4% 5% 7% 5% 4%
% of International Revenue 38 36 36 36 34 32 32 32 36 33 29
Electronics and Other General Merchandise $4,086,000 $3,937,000 $4,316,000 $6,478,000 $5,188,000 $4,912,000 $5,351,840 $8,291,840 $18,817,000 $23,743,680 $30,249,448
% Y/Y Growth 27.6% 22.1% 23.4% 19.3% 27.0% 24.8% 27.9% 29.2% 23% 26% 27%
% Y/Y Growth ex-FX 32% 29% 28% 25% 26% 20% 24% 28% 27% 24%
% of International Revenue 61 63 64 63 66 67 67 67 63 67 71
Other $48,000 $48,000 $51,000 $64,000 $53,000 $50,000 $54,570 $68,480 $211,000 $226,050 $250,916
% Y/Y Growth 14% 23% 28% 25% 10% 4% 7% 7% 23% 7% 11%
% of International Revenue 1 1 1 1 1 1 1 1 1 1 1
F2013 F2014
Q1 13A Q2 13A Q3 13A Q4 13A Q1 14A Q2 14A Q3 14E Q4 14E F2013A F2014E F2015E
Cash & Cash Equivalents $4,481,000 $3,704,000 $3,872,000 $8,658,000 $5,074,000 $5,057,000 $5,425,861 $11,419,967 $8,658,000 $11,419,967 $13,013,447
Short-Term Marketable Securities 3,414,000 3,759,000 3,817,000 3,789,000 3,592,000 2,929,000 2,929,000 2,929,000 3,789,000 2,929,000 2,929,000
Accounts Receivable 2,516,000 2,861,000 3,057,000 4,152,000 3,320,000 3,490,000 3,776,443 4,546,617 4,152,000 4,546,617 5,581,493
Inventories 5,395,000 5,420,000 6,068,000 7,411,000 6,716,000 6,644,000 7,299,149 9,037,096 7,411,000 9,037,096 11,020,557
Other Current Assets 507,000 541,000 520,000 615,000 625,000 635,000 721,654 743,102 615,000 743,102 909,186
Current Assets $16,313,000 $16,285,000 $17,334,000 $24,625,000 $19,327,000 $18,755,000 $20,152,108 $28,675,782 $24,625,000 $28,675,782 $33,453,684
Property and Equipment 7,674,000 8,789,000 9,991,000 10,949,000 12,267,000 14,089,000 14,104,137 14,092,707 10,949,000 14,092,707 15,382,330
Goodwill 2,535,000 2,614,000 2,635,000 2,655,000 2,653,000 2,677,000 2,677,000 2,677,000 2,655,000 2,677,000 2,677,000
Deferred Tax Assets 123,000 128,000 128,000 128,000 128,000 128,000 128,000 128,000 128,000 128,000 128,000
Other Assets 1,732,000 1,807,000 1,773,000 1,802,000 1,989,000 2,249,000 2,463,579 2,472,693 1,802,000 2,472,693 3,025,343
Total Assets $28,377,000 $29,623,000 $31,861,000 $40,159,000 $36,364,000 $37,898,000 $39,524,824 $48,046,182 $40,159,000 $48,046,182 $54,666,358
Accounts Payable $8,916,000 $8,990,000 $10,037,000 $15,133,000 $10,590,000 $10,457,000 $11,430,434 $17,321,101 $15,133,000 $17,321,101 $19,378,419
Accrued Expenses & Other Liabilities 4,532,250 4,769,500 4,350,750 6,688,000 6,251,000 6,688,000 6,470,005 7,753,673 6,688,000 7,753,673 7,975,861
Unearned Revenue 883,750 975,500 1,067,250 1,159,000 1,516,000 1,606,000 1,706,550 2,175,509 1,159,000 2,175,509 5,055,669
Short-Term Debt 652,000 691,000 680,000 753,000 784,000 784,000 627,000 1,045,000 753,000 1,045,000 228,000
Total Current Liabilities $14,984,000 $15,426,000 $16,135,000 $23,733,000 $19,141,000 $19,535,000 $20,233,990 $28,295,283 $23,733,000 $28,295,283 $32,637,949
Long-Term Debt 3,040,000 3,042,000 3,723,000 3,191,000 3,147,000 3,119,000 3,119,000 2,369,000 3,191,000 2,369,000 2,369,000
Other LT Liabilities 1,921,000 2,422,000 2,916,000 3,489,000 3,748,000 4,642,000 4,603,658 5,117,424 3,489,000 5,117,424 5,807,945
Total Liabilities $19,945,000 $20,890,000 $22,774,000 $30,413,000 $26,036,000 $27,296,000 $27,956,648 $35,781,707 $30,413,000 $35,781,707 $40,814,894
Additional Paid-In Capital 8,590,000 8,898,000 9,180,000 9,578,000 10,024,000 10,410,000 11,625,982 11,742,033 9,578,000 11,742,033 12,396,008
Retained Earnings (Accumulated Deficit) 1,998,000 1,991,000 1,950,000 2,190,000 2,298,000 2,172,000 1,922,194 2,502,443 2,190,000 2,502,443 3,435,456
Treasury Stock (1,837,000) (1,837,000) (1,837,000) (1,837,000) (1,837,000) (1,837,000) (1,837,000) (1,837,000) (1,837,000) (1,837,000) (1,837,000)
Accumulated Other Comprehensive Income (319,000) (319,000) (206,000) (185,000) (157,000) (143,000) (143,000) (143,000) (185,000) (143,000) (143,000)
Shareholders' Equity $8,432,000 $8,733,000 $9,087,000 $9,746,000 $10,328,000 $10,602,000 $11,568,176 $12,264,475 $9,746,000 $12,264,475 $13,851,464
Liabilities & Shareholders' Equity $28,377,000 $29,623,000 $31,861,000 $40,159,000 $36,364,000 $37,898,000 $39,524,824 $48,046,182 $40,159,000 $48,046,182 $54,666,358
F2013 F2014
Technology
Internet
October 9, 2014
page 7 of 19 , Jefferies Equity Research, [email protected] US Internet Team
Please see important disclosure information on pages 16 - 19 of this report.
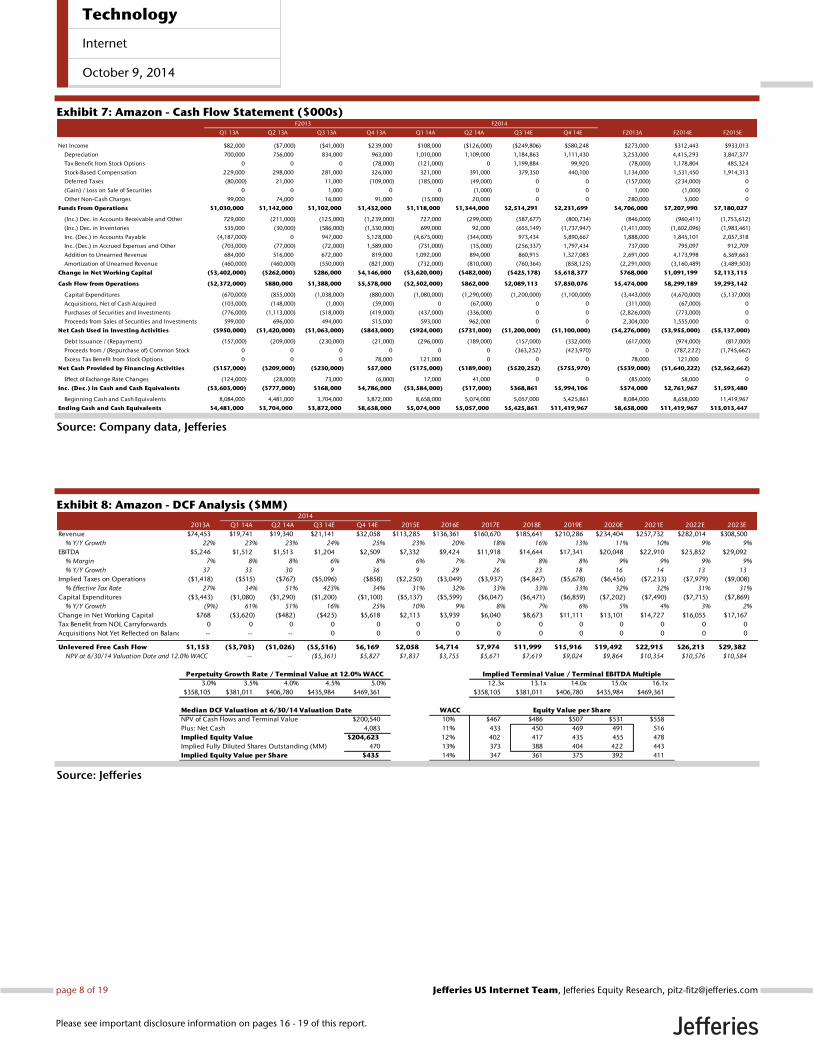
Exhibit 7: Amazon - Cash Flow Statement ($000s)
Source: Company data, Jefferies
Exhibit 8: Amazon - DCF Analysis ($MM)
Source: Jefferies
Q1 13A Q2 13A Q3 13A Q4 13A Q1 14A Q2 14A Q3 14E Q4 14E F2013A F2014E F2015E
Net Income $82,000 ($7,000) ($41,000) $239,000 $108,000 ($126,000) ($249,806) $580,248 $273,000 $312,443 $933,013
Depreciation 700,000 756,000 834,000 963,000 1,010,000 1,109,000 1,184,863 1,111,430 3,253,000 4,415,293 3,847,377
Tax Benefit from Stock Options 0 0 0 (78,000) (121,000) 0 1,199,884 99,920 (78,000) 1,178,804 485,324
Stock-Based Compensation 229,000 298,000 281,000 326,000 321,000 391,000 379,350 440,100 1,134,000 1,531,450 1,914,313
Deferred Taxes (80,000) 21,000 11,000 (109,000) (185,000) (49,000) 0 0 (157,000) (234,000) 0
(Gain) / Loss on Sale of Securities 0 0 1,000 0 0 (1,000) 0 0 1,000 (1,000) 0
Other Non-Cash Charges 99,000 74,000 16,000 91,000 (15,000) 20,000 0 0 280,000 5,000 0
Funds From Operations $1,030,000 $1,142,000 $1,102,000 $1,432,000 $1,118,000 $1,344,000 $2,514,291 $2,231,699 $4,706,000 $7,207,990 $7,180,027
(Inc.) Dec. in Accounts Receivable and Other 729,000 (211,000) (125,000) (1,239,000) 727,000 (299,000) (587,677) (800,734) (846,000) (960,411) (1,753,612)
(Inc.) Dec. in Inventories 535,000 (30,000) (586,000) (1,330,000) 699,000 92,000 (655,149) (1,737,947) (1,411,000) (1,602,096) (1,983,461)
Inc. (Dec.) in Accounts Payable (4,187,000) 0 947,000 5,128,000 (4,675,000) (344,000) 973,434 5,890,667 1,888,000 1,845,101 2,057,318
Inc. (Dec.) in Accrued Expenses and Other (703,000) (77,000) (72,000) 1,589,000 (731,000) (15,000) (256,337) 1,797,434 737,000 795,097 912,709
Addition to Unearned Revenue 684,000 516,000 672,000 819,000 1,092,000 894,000 860,915 1,327,083 2,691,000 4,173,998 6,369,663
Amortization of Unearned Revenue (460,000) (460,000) (550,000) (821,000) (732,000) (810,000) (760,364) (858,125) (2,291,000) (3,160,489) (3,489,503)
Change in Net Working Capital ($3,402,000) ($262,000) $286,000 $4,146,000 ($3,620,000) ($482,000) ($425,178) $5,618,377 $768,000 $1,091,199 $2,113,115
Cash Flow from Operations ($2,372,000) $880,000 $1,388,000 $5,578,000 ($2,502,000) $862,000 $2,089,113 $7,850,076 $5,474,000 $8,299,189 $9,293,142
Capital Expenditures (670,000) (855,000) (1,038,000) (880,000) (1,080,000) (1,290,000) (1,200,000) (1,100,000) (3,443,000) (4,670,000) (5,137,000)
Acquisitions, Net of Cash Acquired (103,000) (148,000) (1,000) (59,000) 0 (67,000) 0 0 (311,000) (67,000) 0
Purchases of Securities and Investments (776,000) (1,113,000) (518,000) (419,000) (437,000) (336,000) 0 0 (2,826,000) (773,000) 0
Proceeds from Sales of Securities and Investments 599,000 696,000 494,000 515,000 593,000 962,000 0 0 2,304,000 1,555,000 0
Net Cash Used in Investing Activities ($950,000) ($1,420,000) ($1,063,000) ($843,000) ($924,000) ($731,000) ($1,200,000) ($1,100,000) ($4,276,000) ($3,955,000) ($5,137,000)
Debt Issuance / (Repayment) (157,000) (209,000) (230,000) (21,000) (296,000) (189,000) (157,000) (332,000) (617,000) (974,000) (817,000)
Proceeds from / (Repurchase of) Common Stock 0 0 0 0 0 0 (363,252) (423,970) 0 (787,222) (1,745,662)
Excess Tax Benefit from Stock Options 0 0 0 78,000 121,000 0 0 0 78,000 121,000 0
Net Cash Provided by Financing Activities ($157,000) ($209,000) ($230,000) $57,000 ($175,000) ($189,000) ($520,252) ($755,970) ($539,000) ($1,640,222) ($2,562,662)
Effect of Exchange Rate Changes (124,000) (28,000) 73,000 (6,000) 17,000 41,000 0 0 (85,000) 58,000 0
Inc. (Dec.) in Cash and Cash Equivalents ($3,603,000) ($777,000) $168,000 $4,786,000 ($3,584,000) ($17,000) $368,861 $5,994,106 $574,000 $2,761,967 $1,593,480
Beginning Cash and Cash Equivalents 8,084,000 4,481,000 3,704,000 3,872,000 8,658,000 5,074,000 5,057,000 5,425,861 8,084,000 8,658,000 11,419,967
Ending Cash and Cash Equivalents $4,481,000 $3,704,000 $3,872,000 $8,658,000 $5,074,000 $5,057,000 $5,425,861 $11,419,967 $8,658,000 $11,419,967 $13,013,447
F2013 F2014
2014
2013A Q1 14A Q2 14A Q3 14E Q4 14E 2015E 2016E 2017E 2018E 2019E 2020E 2021E 2022E 2023E
Revenue $74,453 $19,741 $19,340 $21,141 $32,058 $113,285 $136,361 $160,670 $185,641 $210,286 $234,404 $257,732 $282,014 $308,500
% Y/Y Growth 22% 23% 23% 24% 25% 23% 20% 18% 16% 13% 11% 10% 9% 9%
EBITDA $5,246 $1,512 $1,513 $1,204 $2,509 $7,332 $9,424 $11,918 $14,644 $17,341 $20,048 $22,910 $25,852 $29,092
% Margin 7% 8% 8% 6% 8% 6% 7% 7% 8% 8% 9% 9% 9% 9%
% Y/Y Growth 37 33 30 9 36 9 29 26 23 18 16 14 13 13
Implied Taxes on Operations ($1,418) ($515) ($767) ($5,096) ($858) ($2,250) ($3,049) ($3,937) ($4,847) ($5,678) ($6,456) ($7,233) ($7,979) ($9,008)
% Effective Tax Rate 27% 34% 51% 423% 34% 31% 32% 33% 33% 33% 32% 32% 31% 31%
Capital Expenditures ($3,443) ($1,080) ($1,290) ($1,200) ($1,100) ($5,137) ($5,599) ($6,047) ($6,471) ($6,859) ($7,202) ($7,490) ($7,715) ($7,869)
% Y/Y Growth (9%) 61% 51% 16% 25% 10% 9% 8% 7% 6% 5% 4% 3% 2%
Change in Net Working Capital $768 ($3,620) ($482) ($425) $5,618 $2,113 $3,939 $6,040 $8,673 $11,111 $13,101 $14,727 $16,055 $17,167
Tax Benefit from NOL Carryforwards 0 0 0 0 0 0 0 0 0 0 0 0 0 0
Acquisitions Not Yet Reflected on Balance Sheet -- -- -- 0 0 0 0 0 0 0 0 0 0 0
Unlevered Free Cash Flow $1,153 ($3,703) ($1,026) ($5,516) $6,169 $2,058 $4,714 $7,974 $11,999 $15,916 $19,492 $22,915 $26,213 $29,382
NPV at 6/30/14 Valuation Date and 12.0% WACC -- -- ($5,361) $5,827 $1,837 $3,755 $5,671 $7,619 $9,024 $9,864 $10,354 $10,576 $10,584
Perpetuity Growth Rate / Terminal Value at 12.0% WACC Implied Terminal Value / Terminal EBITDA Multiple
3.0% 3.5% 4.0% 4.5% 5.0% 12.3x 13.1x 14.0x 15.0x 16.1x
$358,105 $381,011 $406,780 $435,984 $469,361 $358,105 $381,011 $406,780 $435,984 $469,361
Median DCF Valuation at 6/30/14 Valuation Date WACC Equity Value per Share
NPV of Cash Flows and Terminal Value $200,540 10% $467 $486 $507 $531 $558
Plus: Net Cash 4,083 11% 433 450 469 491 516
Implied Equity Value $204,623 12% 402 417 435 455 478
Implied Fully Diluted Shares Outstanding (MM) 470 13% 373 388 404 422 443
Implied Equity Value per Share $435 14% 347 361 375 392 411
Technology
Internet
October 9, 2014
page 8 of 19 , Jefferies Equity Research, [email protected] US Internet Team
Please see important disclosure information on pages 16 - 19 of this report.
EBAY Model
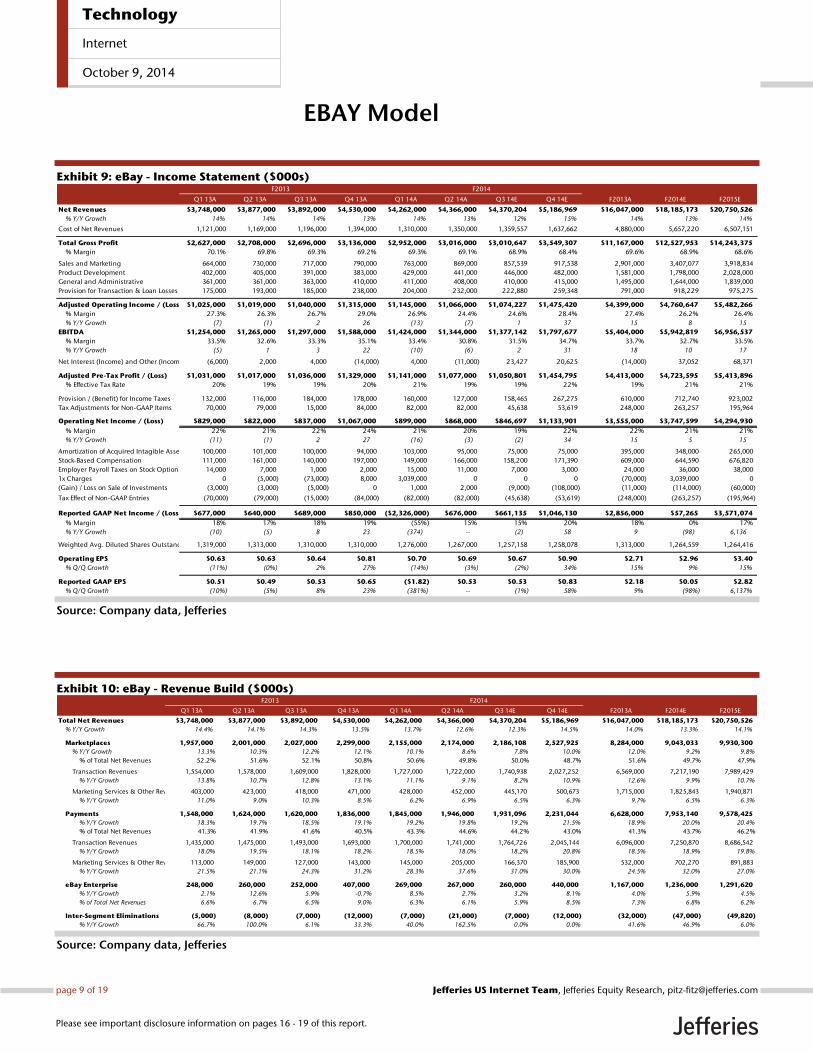
Exhibit 9: eBay - Income Statement ($000s)
Source: Company data, Jefferies
Exhibit 10: eBay - Revenue Build ($000s)
Source: Company data, Jefferies
Q1 13A Q2 13A Q3 13A Q4 13A Q1 14A Q2 14A Q3 14E Q4 14E F2013A F2014E F2015E
Net Revenues $3,748,000 $3,877,000 $3,892,000 $4,530,000 $4,262,000 $4,366,000 $4,370,204 $5,186,969 $16,047,000 $18,185,173 $20,750,526
% Y/Y Growth 14% 14% 14% 13% 14% 13% 12% 15% 14% 13% 14%
Cost of Net Revenues 1,121,000 1,169,000 1,196,000 1,394,000 1,310,000 1,350,000 1,359,557 1,637,662 4,880,000 5,657,220 6,507,151
Total Gross Profit $2,627,000 $2,708,000 $2,696,000 $3,136,000 $2,952,000 $3,016,000 $3,010,647 $3,549,307 $11,167,000 $12,527,953 $14,243,375
% Margin 70.1% 69.8% 69.3% 69.2% 69.3% 69.1% 68.9% 68.4% 69.6% 68.9% 68.6%
Sales and Marketing 664,000 730,000 717,000 790,000 763,000 869,000 857,539 917,538 2,901,000 3,407,077 3,918,834
Product Development 402,000 405,000 391,000 383,000 429,000 441,000 446,000 482,000 1,581,000 1,798,000 2,028,000
General and Administrative 361,000 361,000 363,000 410,000 411,000 408,000 410,000 415,000 1,495,000 1,644,000 1,839,000
Provision for Transaction & Loan Losses 175,000 193,000 185,000 238,000 204,000 232,000 222,880 259,348 791,000 918,229 975,275
Adjusted Operating Income / (Loss) $1,025,000 $1,019,000 $1,040,000 $1,315,000 $1,145,000 $1,066,000 $1,074,227 $1,475,420 $4,399,000 $4,760,647 $5,482,266
% Margin 27.3% 26.3% 26.7% 29.0% 26.9% 24.4% 24.6% 28.4% 27.4% 26.2% 26.4%
% Y/Y Growth (7) (1) 2 26 (13) (7) 1 37 15 8 15
EBITDA $1,254,000 $1,265,000 $1,297,000 $1,588,000 $1,424,000 $1,344,000 $1,377,142 $1,797,677 $5,404,000 $5,942,819 $6,956,537
% Margin 33.5% 32.6% 33.3% 35.1% 33.4% 30.8% 31.5% 34.7% 33.7% 32.7% 33.5%
% Y/Y Growth (5) 1 3 22 (10) (6) 2 31 18 10 17
Net Interest (Income) and Other (Income) (6,000) 2,000 4,000 (14,000) 4,000 (11,000) 23,427 20,625 (14,000) 37,052 68,371
Adjusted Pre-Tax Profit / (Loss) $1,031,000 $1,017,000 $1,036,000 $1,329,000 $1,141,000 $1,077,000 $1,050,801 $1,454,795 $4,413,000 $4,723,595 $5,413,896
% Effective Tax Rate 20% 19% 19% 20% 21% 19% 19% 22% 19% 21% 21%
Provision / (Benefit) for Income Taxes 132,000 116,000 184,000 178,000 160,000 127,000 158,465 267,275 610,000 712,740 923,002
Tax Adjustments for Non-GAAP Items 70,000 79,000 15,000 84,000 82,000 82,000 45,638 53,619 248,000 263,257 195,964
Operating Net Income / (Loss) $829,000 $822,000 $837,000 $1,067,000 $899,000 $868,000 $846,697 $1,133,901 $3,555,000 $3,747,599 $4,294,930
% Margin 22% 21% 22% 24% 21% 20% 19% 22% 22% 21% 21%
% Y/Y Growth (11) (1) 2 27 (16) (3) (2) 34 15 5 15
Amortization of Acquired Intagible Assets 100,000 101,000 100,000 94,000 103,000 95,000 75,000 75,000 395,000 348,000 265,000
Stock-Based Compensation 111,000 161,000 140,000 197,000 149,000 166,000 158,200 171,390 609,000 644,590 676,820
Employer Payroll Taxes on Stock Options Gains 14,000 7,000 1,000 2,000 15,000 11,000 7,000 3,000 24,000 36,000 38,000
1x Charges 0 (5,000) (73,000) 8,000 3,039,000 0 0 0 (70,000) 3,039,000 0
(Gain) / Loss on Sale of Investments (3,000) (3,000) (5,000) 0 1,000 2,000 (9,000) (108,000) (11,000) (114,000) (60,000)
Tax Effect of Non-GAAP Entries (70,000) (79,000) (15,000) (84,000) (82,000) (82,000) (45,638) (53,619) (248,000) (263,257) (195,964)
Reported GAAP Net Income / (Loss) $677,000 $640,000 $689,000 $850,000 ($2,326,000) $676,000 $661,135 $1,046,130 $2,856,000 $57,265 $3,571,074
% Margin 18% 17% 18% 19% (55%) 15% 15% 20% 18% 0% 17%
% Y/Y Growth (10) (5) 8 23 (374) -- (2) 58 9 (98) 6,136
Weighted Avg. Diluted Shares Outstanding 1,319,000 1,313,000 1,310,000 1,310,000 1,276,000 1,267,000 1,257,158 1,258,078 1,313,000 1,264,559 1,264,416
Operating EPS $0.63 $0.63 $0.64 $0.81 $0.70 $0.69 $0.67 $0.90 $2.71 $2.96 $3.40
% Q/Q Growth (11%) (0%) 2% 27% (14%) (3%) (2%) 34% 15% 9% 15%
Reported GAAP EPS $0.51 $0.49 $0.53 $0.65 ($1.82) $0.53 $0.53 $0.83 $2.18 $0.05 $2.82
% Q/Q Growth (10%) (5%) 8% 23% (381%) -- (1%) 58% 9% (98%) 6,137%
F2013 F2014
Q1 13A Q2 13A Q3 13A Q4 13A Q1 14A Q2 14A Q3 14E Q4 14E F2013A F2014E F2015E
Total Net Revenues $3,748,000 $3,877,000 $3,892,000 $4,530,000 $4,262,000 $4,366,000 $4,370,204 $5,186,969 $16,047,000 $18,185,173 $20,750,526
% Y/Y Growth 14.4% 14.1% 14.3% 13.5% 13.7% 12.6% 12.3% 14.5% 14.0% 13.3% 14.1%
Marketplaces 1,957,000 2,001,000 2,027,000 2,299,000 2,155,000 2,174,000 2,186,108 2,527,925 8,284,000 9,043,033 9,930,300
% Y/Y Growth 13.3% 10.3% 12.2% 12.1% 10.1% 8.6% 7.8% 10.0% 12.0% 9.2% 9.8%
% of Total Net Revenues 52.2% 51.6% 52.1% 50.8% 50.6% 49.8% 50.0% 48.7% 51.6% 49.7% 47.9%
Transaction Revenues 1,554,000 1,578,000 1,609,000 1,828,000 1,727,000 1,722,000 1,740,938 2,027,252 6,569,000 7,217,190 7,989,429
% Y/Y Growth 13.8% 10.7% 12.8% 13.1% 11.1% 9.1% 8.2% 10.9% 12.6% 9.9% 10.7%
Marketing Services & Other Revenues 403,000 423,000 418,000 471,000 428,000 452,000 445,170 500,673 1,715,000 1,825,843 1,940,871
% Y/Y Growth 11.0% 9.0% 10.3% 8.5% 6.2% 6.9% 6.5% 6.3% 9.7% 6.5% 6.3%
Payments 1,548,000 1,624,000 1,620,000 1,836,000 1,845,000 1,946,000 1,931,096 2,231,044 6,628,000 7,953,140 9,578,425
% Y/Y Growth 18.3% 19.7% 18.5% 19.1% 19.2% 19.8% 19.2% 21.5% 18.9% 20.0% 20.4%
% of Total Net Revenues 41.3% 41.9% 41.6% 40.5% 43.3% 44.6% 44.2% 43.0% 41.3% 43.7% 46.2%
Transaction Revenues 1,435,000 1,475,000 1,493,000 1,693,000 1,700,000 1,741,000 1,764,726 2,045,144 6,096,000 7,250,870 8,686,542
% Y/Y Growth 18.0% 19.5% 18.1% 18.2% 18.5% 18.0% 18.2% 20.8% 18.5% 18.9% 19.8%
Marketing Services & Other Revenues 113,000 149,000 127,000 143,000 145,000 205,000 166,370 185,900 532,000 702,270 891,883
% Y/Y Growth 21.5% 21.1% 24.3% 31.2% 28.3% 37.6% 31.0% 30.0% 24.5% 32.0% 27.0%
eBay Enterprise 248,000 260,000 252,000 407,000 269,000 267,000 260,000 440,000 1,167,000 1,236,000 1,291,620
% Y/Y Growth 2.1% 12.6% 5.9% -0.7% 8.5% 2.7% 3.2% 8.1% 4.0% 5.9% 4.5%
% of Total Net Revenues 6.6% 6.7% 6.5% 9.0% 6.3% 6.1% 5.9% 8.5% 7.3% 6.8% 6.2%
Inter-Segment Eliminations (5,000) (8,000) (7,000) (12,000) (7,000) (21,000) (7,000) (12,000) (32,000) (47,000) (49,820)
% Y/Y Growth 66.7% 100.0% 6.1% 33.3% 40.0% 162.5% 0.0% 0.0% 41.6% 46.9% 6.0%
F2013 F2014
Technology
Internet
October 9, 2014
page 9 of 19 , Jefferies Equity Research, [email protected] US Internet Team
Please see important disclosure information on pages 16 - 19 of this report.
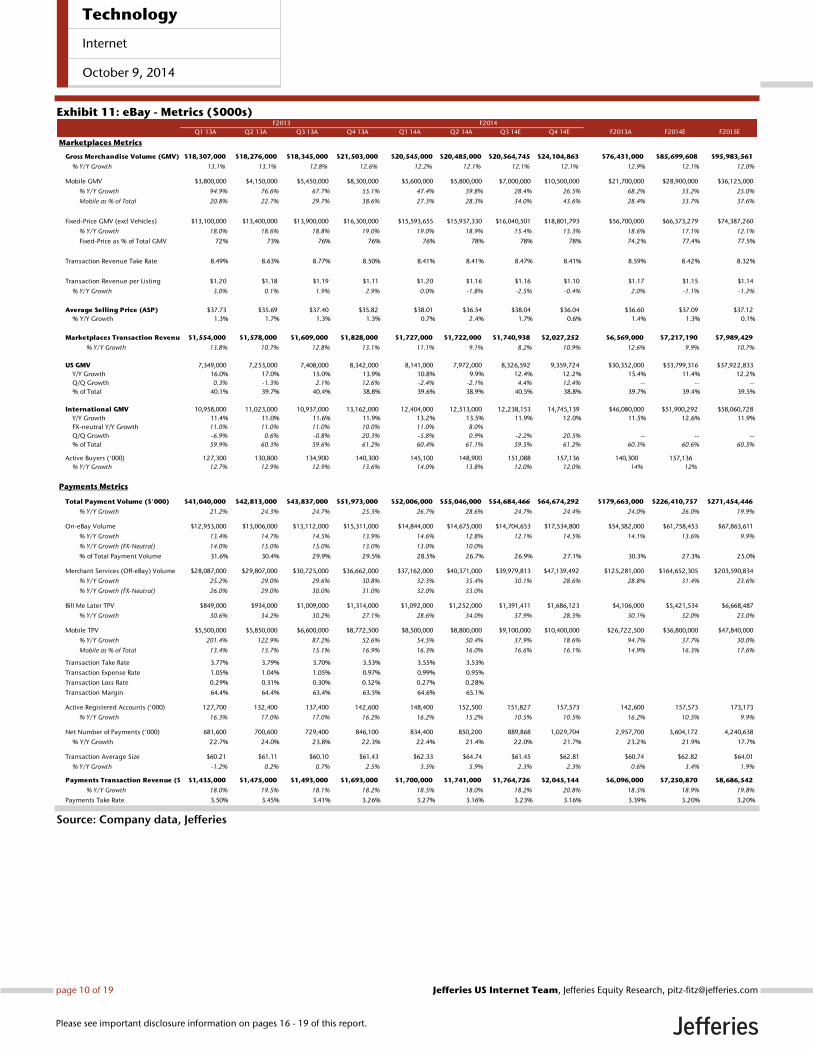
Exhibit 11: eBay - Metrics ($000s)
Source: Company data, Jefferies
F2013 F2014
Q1 13A Q2 13A Q3 13A Q4 13A Q1 14A Q2 14A Q3 14E Q4 14E F2013A F2014E F2015E
Marketplaces Metrics
Gross Merchandise Volume (GMV) $18,307,000 $18,276,000 $18,345,000 $21,503,000 $20,545,000 $20,485,000 $20,564,745 $24,104,863 $76,431,000 $85,699,608 $95,983,561
% Y/Y Growth 13.1% 13.1% 12.8% 12.6% 12.2% 12.1% 12.1% 12.1% 12.9% 12.1% 12.0%
Mobile GMV $3,800,000 $4,150,000 $5,450,000 $8,300,000 $5,600,000 $5,800,000 $7,000,000 $10,500,000 $21,700,000 $28,900,000 $36,125,000
% Y/Y Growth 94.9% 76.6% 67.7% 55.1% 47.4% 39.8% 28.4% 26.5% 68.2% 33.2% 25.0%
Mobile as % of Total 20.8% 22.7% 29.7% 38.6% 27.3% 28.3% 34.0% 43.6% 28.4% 33.7% 37.6%
Fixed-Price GMV (excl Vehicles) $13,100,000 $13,400,000 $13,900,000 $16,300,000 $15,593,655 $15,937,330 $16,040,501 $18,801,793 $56,700,000 $66,373,279 $74,387,260
% Y/Y Growth 18.0% 18.6% 18.8% 19.0% 19.0% 18.9% 15.4% 15.3% 18.6% 17.1% 12.1%
Fixed-Price as % of Total GMV 72% 73% 76% 76% 76% 78% 78% 78% 74.2% 77.4% 77.5%
Transaction Revenue Take Rate 8.49% 8.63% 8.77% 8.50% 8.41% 8.41% 8.47% 8.41% 8.59% 8.42% 8.32%
Transaction Revenue per Listing $1.20 $1.18 $1.19 $1.11 $1.20 $1.16 $1.16 $1.10 $1.17 $1.15 $1.14
% Y/Y Growth 3.0% 0.1% 1.9% 2.9% 0.0% -1.8% -2.5% -0.4% 2.0% -1.1% -1.2%
Average Selling Price (ASP) $37.73 $35.69 $37.40 $35.82 $38.01 $36.54 $38.04 $36.04 $36.60 $37.09 $37.12
% Y/Y Growth 1.3% 1.7% 1.3% 1.3% 0.7% 2.4% 1.7% 0.6% 1.4% 1.3% 0.1%
Marketplaces Transaction Revenue ($'000)$1,554,000 $1,578,000 $1,609,000 $1,828,000 $1,727,000 $1,722,000 $1,740,938 $2,027,252 $6,569,000 $7,217,190 $7,989,429
% Y/Y Growth 13.8% 10.7% 12.8% 13.1% 11.1% 9.1% 8.2% 10.9% 12.6% 9.9% 10.7%
US GMV 7,349,000 7,253,000 7,408,000 8,342,000 8,141,000 7,972,000 8,326,592 9,359,724 $30,352,000 $33,799,316 $37,922,833
Y/Y Growth 16.0% 17.0% 15.0% 13.9% 10.8% 9.9% 12.4% 12.2% 15.4% 11.4% 12.2%
Q/Q Growth 0.3% -1.3% 2.1% 12.6% -2.4% -2.1% 4.4% 12.4% -- -- --
% of Total 40.1% 39.7% 40.4% 38.8% 39.6% 38.9% 40.5% 38.8% 39.7% 39.4% 39.5%
International GMV 10,958,000 11,023,000 10,937,000 13,162,000 12,404,000 12,513,000 12,238,153 14,745,139 $46,080,000 $51,900,292 $58,060,728
Y/Y Growth 11.4% 11.0% 11.6% 11.9% 13.2% 13.5% 11.9% 12.0% 11.5% 12.6% 11.9%
FX-neutral Y/Y Growth 11.0% 11.0% 11.0% 10.0% 11.0% 8.0%
Q/Q Growth -6.9% 0.6% -0.8% 20.3% -5.8% 0.9% -2.2% 20.5% -- -- --
% of Total 59.9% 60.3% 59.6% 61.2% 60.4% 61.1% 59.5% 61.2% 60.3% 60.6% 60.5%
Active Buyers ('000) 127,300 130,800 134,900 140,300 145,100 148,900 151,088 157,136 140,300 157,136
% Y/Y Growth 12.7% 12.9% 12.9% 13.6% 14.0% 13.8% 12.0% 12.0% 14% 12%
Payments Metrics
Total Payment Volume ($'000) $41,040,000 $42,813,000 $43,837,000 $51,973,000 $52,006,000 $55,046,000 $54,684,466 $64,674,292 $179,663,000 $226,410,757 $271,454,446
% Y/Y Growth 21.2% 24.3% 24.7% 25.3% 26.7% 28.6% 24.7% 24.4% 24.0% 26.0% 19.9%
On-eBay Volume $12,953,000 $13,006,000 $13,112,000 $15,311,000 $14,844,000 $14,675,000 $14,704,653 $17,534,800 $54,382,000 $61,758,453 $67,863,611
% Y/Y Growth 13.4% 14.7% 14.5% 13.9% 14.6% 12.8% 12.1% 14.5% 14.1% 13.6% 9.9%
% Y/Y Growth (FX-Neutral) 14.0% 15.0% 15.0% 13.0% 13.0% 10.0%
% of Total Payment Volume 31.6% 30.4% 29.9% 29.5% 28.5% 26.7% 26.9% 27.1% 30.3% 27.3% 25.0%
Merchant Services (Off-eBay) Volume $28,087,000 $29,807,000 $30,725,000 $36,662,000 $37,162,000 $40,371,000 $39,979,813 $47,139,492 $125,281,000 $164,652,305 $203,590,834
% Y/Y Growth 25.2% 29.0% 29.6% 30.8% 32.3% 35.4% 30.1% 28.6% 28.8% 31.4% 23.6%
% Y/Y Growth (FX-Neutral) 26.0% 29.0% 30.0% 31.0% 32.0% 33.0%
Bill Me Later TPV $849,000 $934,000 $1,009,000 $1,314,000 $1,092,000 $1,252,000 $1,391,411 $1,686,123 $4,106,000 $5,421,534 $6,668,487
% Y/Y Growth 30.6% 34.2% 30.2% 27.1% 28.6% 34.0% 37.9% 28.3% 30.1% 32.0% 23.0%
Mobile TPV $5,500,000 $5,850,000 $6,600,000 $8,772,500 $8,500,000 $8,800,000 $9,100,000 $10,400,000 $26,722,500 $36,800,000 $47,840,000
% Y/Y Growth 201.4% 122.9% 87.2% 52.6% 54.5% 50.4% 37.9% 18.6% 94.7% 37.7% 30.0%
Mobile as % of Total 13.4% 13.7% 15.1% 16.9% 16.3% 16.0% 16.6% 16.1% 14.9% 16.3% 17.6%
Transaction Take Rate 3.77% 3.79% 3.70% 3.53% 3.55% 3.53%
Transaction Expense Rate 1.05% 1.04% 1.05% 0.97% 0.99% 0.95%
Transaction Loss Rate 0.29% 0.31% 0.30% 0.32% 0.27% 0.28%
Transaction Margin 64.4% 64.4% 63.4% 63.5% 64.6% 65.1%
Active Registered Accounts ('000) 127,700 132,400 137,400 142,600 148,400 152,500 151,827 157,573 142,600 157,573 173,173
% Y/Y Growth 16.3% 17.0% 17.0% 16.2% 16.2% 15.2% 10.5% 10.5% 16.2% 10.5% 9.9%
Net Number of Payments ('000) 681,600 700,600 729,400 846,100 834,400 850,200 889,868 1,029,704 2,957,700 3,604,172 4,240,638
% Y/Y Growth 22.7% 24.0% 23.8% 22.3% 22.4% 21.4% 22.0% 21.7% 23.2% 21.9% 17.7%
Transaction Average Size $60.21 $61.11 $60.10 $61.43 $62.33 $64.74 $61.45 $62.81 $60.74 $62.82 $64.01
% Y/Y Growth -1.2% 0.2% 0.7% 2.5% 3.5% 5.9% 2.3% 2.3% 0.6% 3.4% 1.9%
Payments Transaction Revenue ($'000)$1,435,000 $1,475,000 $1,493,000 $1,693,000 $1,700,000 $1,741,000 $1,764,726 $2,045,144 $6,096,000 $7,250,870 $8,686,542
% Y/Y Growth 18.0% 19.5% 18.1% 18.2% 18.5% 18.0% 18.2% 20.8% 18.5% 18.9% 19.8%
Payments Take Rate 3.50% 3.45% 3.41% 3.26% 3.27% 3.16% 3.23% 3.16% 3.39% 3.20% 3.20%
Technology
Internet
October 9, 2014
page 10 of 19 , Jefferies Equity Research, [email protected] US Internet Team
Please see important disclosure information on pages 16 - 19 of this report.
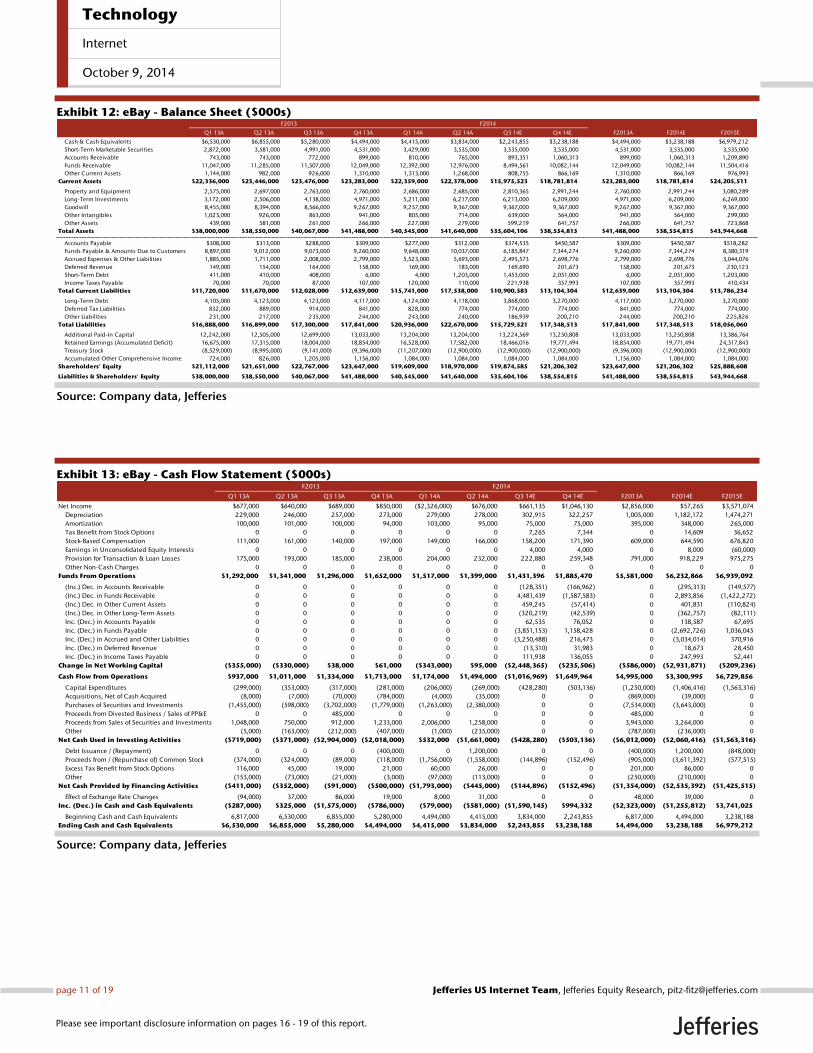
Exhibit 12: eBay - Balance Sheet ($000s)
Source: Company data, Jefferies
Exhibit 13: eBay - Cash Flow Statement ($000s)
Source: Company data, Jefferies
Q1 13A Q2 13A Q3 13A Q4 13A Q1 14A Q2 14A Q3 14E Q4 14E F2013A F2014E F2015E
Cash & Cash Equivalents $6,530,000 $6,855,000 $5,280,000 $4,494,000 $4,415,000 $3,834,000 $2,243,855 $3,238,188 $4,494,000 $3,238,188 $6,979,212
Short-Term Marketable Securities 2,872,000 3,581,000 4,991,000 4,531,000 3,429,000 3,535,000 3,535,000 3,535,000 4,531,000 3,535,000 3,535,000
Accounts Receivable 743,000 743,000 772,000 899,000 810,000 765,000 893,351 1,060,313 899,000 1,060,313 1,209,890
Funds Receivable 11,047,000 11,285,000 11,507,000 12,049,000 12,392,000 12,976,000 8,494,561 10,082,144 12,049,000 10,082,144 11,504,416
Other Current Assets 1,144,000 982,000 926,000 1,310,000 1,313,000 1,268,000 808,755 866,169 1,310,000 866,169 976,993
Current Assets $22,336,000 $23,446,000 $23,476,000 $23,283,000 $22,359,000 $22,378,000 $15,975,523 $18,781,814 $23,283,000 $18,781,814 $24,205,511
Property and Equipment 2,575,000 2,697,000 2,763,000 2,760,000 2,686,000 2,685,000 2,810,365 2,991,244 2,760,000 2,991,244 3,080,289
Long-Term Investments 3,172,000 2,506,000 4,138,000 4,971,000 5,211,000 6,217,000 6,213,000 6,209,000 4,971,000 6,209,000 6,269,000
Goodwill 8,455,000 8,394,000 8,566,000 9,267,000 9,257,000 9,367,000 9,367,000 9,367,000 9,267,000 9,367,000 9,367,000
Other Intangibles 1,023,000 926,000 863,000 941,000 805,000 714,000 639,000 564,000 941,000 564,000 299,000
Other Assets 439,000 581,000 261,000 266,000 227,000 279,000 599,219 641,757 266,000 641,757 723,868
Total Assets $38,000,000 $38,550,000 $40,067,000 $41,488,000 $40,545,000 $41,640,000 $35,604,106 $38,554,815 $41,488,000 $38,554,815 $43,944,668
Accounts Payable $308,000 $313,000 $288,000 $309,000 $277,000 $312,000 $374,535 $450,587 $309,000 $450,587 $518,282
Funds Payable & Amounts Due to Customers 8,897,000 9,012,000 9,073,000 9,260,000 9,648,000 10,037,000 6,185,847 7,344,274 9,260,000 7,344,274 8,380,319
Accrued Expenses & Other Liabilities 1,885,000 1,711,000 2,008,000 2,799,000 5,523,000 5,693,000 2,495,573 2,698,776 2,799,000 2,698,776 3,044,076
Deferred Revenue 149,000 154,000 164,000 158,000 169,000 183,000 169,690 201,673 158,000 201,673 230,123
Short-Term Debt 411,000 410,000 408,000 6,000 4,000 1,203,000 1,453,000 2,051,000 6,000 2,051,000 1,203,000
Income Taxes Payable 70,000 70,000 87,000 107,000 120,000 110,000 221,938 357,993 107,000 357,993 410,434
Total Current Liabilities $11,720,000 $11,670,000 $12,028,000 $12,639,000 $15,741,000 $17,538,000 $10,900,583 $13,104,304 $12,639,000 $13,104,304 $13,786,234
Long-Term Debt 4,105,000 4,123,000 4,123,000 4,117,000 4,124,000 4,118,000 3,868,000 3,270,000 4,117,000 3,270,000 3,270,000
Deferred Tax Liabilities 832,000 889,000 914,000 841,000 828,000 774,000 774,000 774,000 841,000 774,000 774,000
Other Liabilities 231,000 217,000 235,000 244,000 243,000 240,000 186,939 200,210 244,000 200,210 225,826
Total Liabilities $16,888,000 $16,899,000 $17,300,000 $17,841,000 $20,936,000 $22,670,000 $15,729,521 $17,348,513 $17,841,000 $17,348,513 $18,056,060
Additional Paid-In Capital 12,242,000 12,505,000 12,699,000 13,033,000 13,204,000 13,204,000 13,224,569 13,250,808 13,033,000 13,250,808 13,386,764
Retained Earnings (Accumulated Deficit) 16,675,000 17,315,000 18,004,000 18,854,000 16,528,000 17,582,000 18,466,016 19,771,494 18,854,000 19,771,494 24,317,843
Treasury Stock (8,529,000) (8,995,000) (9,141,000) (9,396,000) (11,207,000) (12,900,000) (12,900,000) (12,900,000) (9,396,000) (12,900,000) (12,900,000)
Accumulated Other Comprehensive Income 724,000 826,000 1,205,000 1,156,000 1,084,000 1,084,000 1,084,000 1,084,000 1,156,000 1,084,000 1,084,000
Shareholders' Equity $21,112,000 $21,651,000 $22,767,000 $23,647,000 $19,609,000 $18,970,000 $19,874,585 $21,206,302 $23,647,000 $21,206,302 $25,888,608
Liabilities & Shareholders' Equity $38,000,000 $38,550,000 $40,067,000 $41,488,000 $40,545,000 $41,640,000 $35,604,106 $38,554,815 $41,488,000 $38,554,815 $43,944,668
F2013 F2014
Q1 13A Q2 13A Q3 13A Q4 13A Q1 14A Q2 14A Q3 14E Q4 14E F2013A F2014E F2015E
Net Income $677,000 $640,000 $689,000 $850,000 ($2,326,000) $676,000 $661,135 $1,046,130 $2,856,000 $57,265 $3,571,074
Depreciation 229,000 246,000 257,000 273,000 279,000 278,000 302,915 322,257 1,005,000 1,182,172 1,474,271
Amortization 100,000 101,000 100,000 94,000 103,000 95,000 75,000 75,000 395,000 348,000 265,000
Tax Benefit from Stock Options 0 0 0 0 0 0 7,265 7,344 0 14,609 36,652
Stock-Based Compensation 111,000 161,000 140,000 197,000 149,000 166,000 158,200 171,390 609,000 644,590 676,820
Earnings in Unconsolidated Equity Interests 0 0 0 0 0 0 4,000 4,000 0 8,000 (60,000)
Provision for Transaction & Loan Losses 175,000 193,000 185,000 238,000 204,000 232,000 222,880 259,348 791,000 918,229 975,275
Other Non-Cash Charges 0 0 0 0 0 0 0 0 0 0 0
Funds From Operations $1,292,000 $1,341,000 $1,296,000 $1,652,000 $1,517,000 $1,399,000 $1,431,396 $1,885,470 $5,581,000 $6,232,866 $6,939,092
(Inc.) Dec. in Accounts Receivable 0 0 0 0 0 0 (128,351) (166,962) 0 (295,313) (149,577)
(Inc.) Dec. in Funds Receivable 0 0 0 0 0 0 4,481,439 (1,587,583) 0 2,893,856 (1,422,272)
(Inc.) Dec. in Other Current Assets 0 0 0 0 0 0 459,245 (57,414) 0 401,831 (110,824)
(Inc.) Dec. in Other Long-Term Assets 0 0 0 0 0 0 (320,219) (42,539) 0 (362,757) (82,111)
Inc. (Dec.) in Accounts Payable 0 0 0 0 0 0 62,535 76,052 0 138,587 67,695
Inc. (Dec.) in Funds Payable 0 0 0 0 0 0 (3,851,153) 1,158,428 0 (2,692,726) 1,036,045
Inc. (Dec.) in Accrued and Other Liabilities 0 0 0 0 0 0 (3,250,488) 216,473 0 (3,034,014) 370,916
Inc. (Dec.) in Deferred Revenue 0 0 0 0 0 0 (13,310) 31,983 0 18,673 28,450
Inc. (Dec.) in Income Taxes Payable 0 0 0 0 0 0 111,938 136,055 0 247,993 52,441
Change in Net Working Capital ($355,000) ($330,000) $38,000 $61,000 ($343,000) $95,000 ($2,448,365) ($235,506) ($586,000) ($2,931,871) ($209,236)
Cash Flow from Operations $937,000 $1,011,000 $1,334,000 $1,713,000 $1,174,000 $1,494,000 ($1,016,969) $1,649,964 $4,995,000 $3,300,995 $6,729,856
Capital Expenditures (299,000) (353,000) (317,000) (281,000) (206,000) (269,000) (428,280) (503,136) (1,250,000) (1,406,416) (1,563,316)
Acquisitions, Net of Cash Acquired (8,000) (7,000) (70,000) (784,000) (4,000) (35,000) 0 0 (869,000) (39,000) 0
Purchases of Securities and Investments (1,455,000) (598,000) (3,702,000) (1,779,000) (1,263,000) (2,380,000) 0 0 (7,534,000) (3,643,000) 0
Proceeds from Divested Business / Sales of PP&E 0 0 485,000 0 0 0 0 0 485,000 0 0
Proceeds from Sales of Securities and Investments 1,048,000 750,000 912,000 1,233,000 2,006,000 1,258,000 0 0 3,943,000 3,264,000 0
Other (5,000) (163,000) (212,000) (407,000) (1,000) (235,000) 0 0 (787,000) (236,000) 0
Net Cash Used in Investing Activities ($719,000) ($371,000) ($2,904,000) ($2,018,000) $532,000 ($1,661,000) ($428,280) ($503,136) ($6,012,000) ($2,060,416) ($1,563,316)
Debt Issuance / (Repayment) 0 0 0 (400,000) 0 1,200,000 0 0 (400,000) 1,200,000 (848,000)
Proceeds from / (Repurchase of) Common Stock (374,000) (324,000) (89,000) (118,000) (1,756,000) (1,558,000) (144,896) (152,496) (905,000) (3,611,392) (577,515)
Excess Tax Benefit from Stock Options 116,000 45,000 19,000 21,000 60,000 26,000 0 0 201,000 86,000 0
Other (153,000) (73,000) (21,000) (3,000) (97,000) (113,000) 0 0 (250,000) (210,000) 0
Net Cash Provided by Financing Activities ($411,000) ($352,000) ($91,000) ($500,000) ($1,793,000) ($445,000) ($144,896) ($152,496) ($1,354,000) ($2,535,392) ($1,425,515)
Effect of Exchange Rate Changes (94,000) 37,000 86,000 19,000 8,000 31,000 0 0 48,000 39,000 0
Inc. (Dec.) in Cash and Cash Equivalents ($287,000) $325,000 ($1,575,000) ($786,000) ($79,000) ($581,000) ($1,590,145) $994,332 ($2,323,000) ($1,255,812) $3,741,025
Beginning Cash and Cash Equivalents 6,817,000 6,530,000 6,855,000 5,280,000 4,494,000 4,415,000 3,834,000 2,243,855 6,817,000 4,494,000 3,238,188
Ending Cash and Cash Equivalents $6,530,000 $6,855,000 $5,280,000 $4,494,000 $4,415,000 $3,834,000 $2,243,855 $3,238,188 $4,494,000 $3,238,188 $6,979,212
F2013 F2014
Technology
Internet
October 9, 2014
page 11 of 19 , Jefferies Equity Research, [email protected] US Internet Team
Please see important disclosure information on pages 16 - 19 of this report.
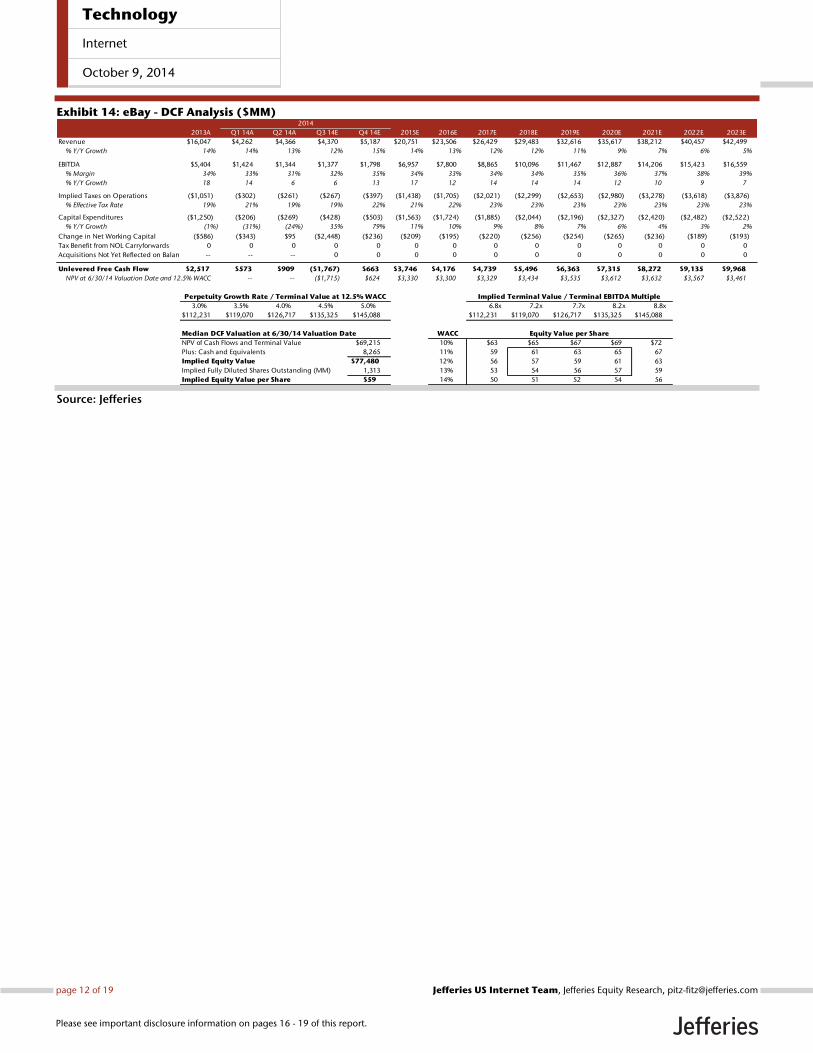
Exhibit 14: eBay - DCF Analysis ($MM)
Source: Jefferies
2014
2013A Q1 14A Q2 14A Q3 14E Q4 14E 2015E 2016E 2017E 2018E 2019E 2020E 2021E 2022E 2023E
Revenue $16,047 $4,262 $4,366 $4,370 $5,187 $20,751 $23,506 $26,429 $29,483 $32,616 $35,617 $38,212 $40,457 $42,499
% Y/Y Growth 14% 14% 13% 12% 15% 14% 13% 12% 12% 11% 9% 7% 6% 5%
EBITDA $5,404 $1,424 $1,344 $1,377 $1,798 $6,957 $7,800 $8,865 $10,096 $11,467 $12,887 $14,206 $15,423 $16,559
% Margin 34% 33% 31% 32% 35% 34% 33% 34% 34% 35% 36% 37% 38% 39%
% Y/Y Growth 18 14 6 6 13 17 12 14 14 14 12 10 9 7
Implied Taxes on Operations ($1,051) ($302) ($261) ($267) ($397) ($1,438) ($1,705) ($2,021) ($2,299) ($2,653) ($2,980) ($3,278) ($3,618) ($3,876)
% Effective Tax Rate 19% 21% 19% 19% 22% 21% 22% 23% 23% 23% 23% 23% 23% 23%
Capital Expenditures ($1,250) ($206) ($269) ($428) ($503) ($1,563) ($1,724) ($1,885) ($2,044) ($2,196) ($2,327) ($2,420) ($2,482) ($2,522)
% Y/Y Growth (1%) (31%) (24%) 35% 79% 11% 10% 9% 8% 7% 6% 4% 3% 2%
Change in Net Working Capital ($586) ($343) $95 ($2,448) ($236) ($209) ($195) ($220) ($256) ($254) ($265) ($236) ($189) ($193)
Tax Benefit from NOL Carryforwards 0 0 0 0 0 0 0 0 0 0 0 0 0 0
Acquisitions Not Yet Reflected on Balance Sheet-- -- -- 0 0 0 0 0 0 0 0 0 0 0
Unlevered Free Cash Flow $2,517 $573 $909 ($1,767) $663 $3,746 $4,176 $4,739 $5,496 $6,363 $7,315 $8,272 $9,135 $9,968
NPV at 6/30/14 Valuation Date and 12.5% WACC -- -- ($1,715) $624 $3,330 $3,300 $3,329 $3,434 $3,535 $3,612 $3,632 $3,567 $3,461
Perpetuity Growth Rate / Terminal Value at 12.5% WACC Implied Terminal Value / Terminal EBITDA Multiple
3.0% 3.5% 4.0% 4.5% 5.0% 6.8x 7.2x 7.7x 8.2x 8.8x
$112,231 $119,070 $126,717 $135,325 $145,088 $112,231 $119,070 $126,717 $135,325 $145,088
Median DCF Valuation at 6/30/14 Valuation Date WACC Equity Value per Share
NPV of Cash Flows and Terminal Value $69,215 10% $63 $65 $67 $69 $72
Plus: Cash and Equivalents 8,265 11% 59 61 63 65 67
Implied Equity Value $77,480 12% 56 57 59 61 63
Implied Fully Diluted Shares Outstanding (MM) 1,313 13% 53 54 56 57 59
Implied Equity Value per Share $59 14% 50 51 52 54 56
Technology
Internet
October 9, 2014
page 12 of 19 , Jefferies Equity Research, [email protected] US Internet Team
Please see important disclosure information on pages 16 - 19 of this report.
GOOG Model
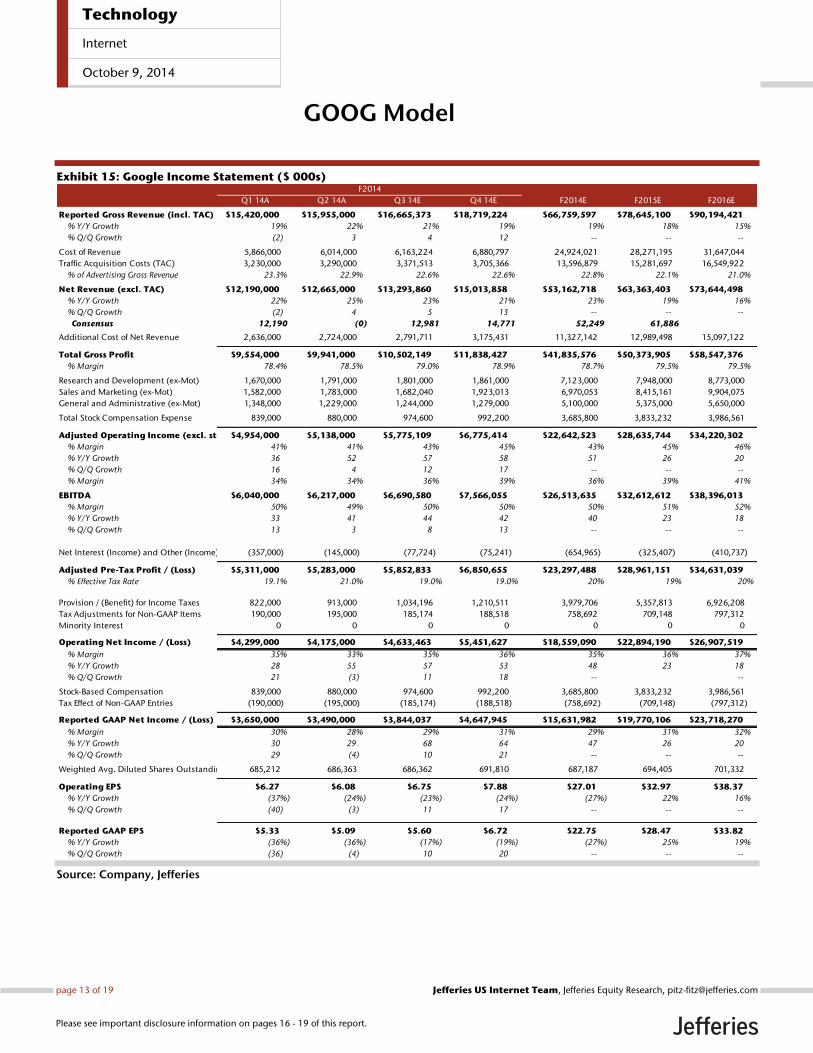
Exhibit 15: Google Income Statement ($ 000s)
Source: Company, Jefferies
Q1 14A Q2 14A Q3 14E Q4 14E F2014E F2015E F2016E
Reported Gross Revenue (incl. TAC) $15,420,000 $15,955,000 $16,665,373 $18,719,224 $66,759,597 $78,645,100 $90,194,421
% Y/Y Growth 19% 22% 21% 19% 19% 18% 15%
% Q/Q Growth (2) 3 4 12 -- -- --
Cost of Revenue 5,866,000 6,014,000 6,163,224 6,880,797 24,924,021 28,271,195 31,647,044
Traffic Acquisition Costs (TAC) 3,230,000 3,290,000 3,371,513 3,705,366 13,596,879 15,281,697 16,549,922
% of Advertising Gross Revenue 23.3% 22.9% 22.6% 22.6% 22.8% 22.1% 21.0%
Net Revenue (excl. TAC) $12,190,000 $12,665,000 $13,293,860 $15,013,858 $53,162,718 $63,363,403 $73,644,498
% Y/Y Growth 22% 25% 23% 21% 23% 19% 16%
% Q/Q Growth (2) 4 5 13 -- -- --
Consensus 12,190 (0) 12,981 14,771 52,249 61,886
Additional Cost of Net Revenue 2,636,000 2,724,000 2,791,711 3,175,431 11,327,142 12,989,498 15,097,122
Total Gross Profit $9,554,000 $9,941,000 $10,502,149 $11,838,427 $41,835,576 $50,373,905 $58,547,376
% Margin 78.4% 78.5% 79.0% 78.9% 78.7% 79.5% 79.5%
Research and Development (ex-Mot) 1,670,000 1,791,000 1,801,000 1,861,000 7,123,000 7,948,000 8,773,000
Sales and Marketing (ex-Mot) 1,582,000 1,783,000 1,682,040 1,923,013 6,970,053 8,415,161 9,904,075
General and Administrative (ex-Mot) 1,348,000 1,229,000 1,244,000 1,279,000 5,100,000 5,375,000 5,650,000
Total Stock Compensation Expense 839,000 880,000 974,600 992,200 3,685,800 3,833,232 3,986,561
Adjusted Operating Income (excl. stock comp.)$4,954,000 $5,138,000 $5,775,109 $6,775,414 $22,642,523 $28,635,744 $34,220,302
% Margin 41% 41% 43% 45% 43% 45% 46%
% Y/Y Growth 36 52 57 58 51 26 20
% Q/Q Growth 16 4 12 17 -- -- --
% Margin 34% 34% 36% 39% 36% 39% 41%
EBITDA $6,040,000 $6,217,000 $6,690,580 $7,566,055 $26,513,635 $32,612,612 $38,396,013
% Margin 50% 49% 50% 50% 50% 51% 52%
% Y/Y Growth 33 41 44 42 40 23 18
% Q/Q Growth 13 3 8 13 -- -- --
Net Interest (Income) and Other (Income) (357,000) (145,000) (77,724) (75,241) (654,965) (325,407) (410,737)
Adjusted Pre-Tax Profit / (Loss) $5,311,000 $5,283,000 $5,852,833 $6,850,655 $23,297,488 $28,961,151 $34,631,039
% Effective Tax Rate 19.1% 21.0% 19.0% 19.0% 20% 19% 20%
Provision / (Benefit) for Income Taxes 822,000 913,000 1,034,196 1,210,511 3,979,706 5,357,813 6,926,208
Tax Adjustments for Non-GAAP Items 190,000 195,000 185,174 188,518 758,692 709,148 797,312
Minority Interest 0 0 0 0 0 0 0
Operating Net Income / (Loss) $4,299,000 $4,175,000 $4,633,463 $5,451,627 $18,559,090 $22,894,190 $26,907,519
% Margin 35% 33% 35% 36% 35% 36% 37%
% Y/Y Growth 28 55 57 53 48 23 18
% Q/Q Growth 21 (3) 11 18 -- --
Stock-Based Compensation 839,000 880,000 974,600 992,200 3,685,800 3,833,232 3,986,561
Tax Effect of Non-GAAP Entries (190,000) (195,000) (185,174) (188,518) (758,692) (709,148) (797,312)
Reported GAAP Net Income / (Loss) $3,650,000 $3,490,000 $3,844,037 $4,647,945 $15,631,982 $19,770,106 $23,718,270
% Margin 30% 28% 29% 31% 29% 31% 32%
% Y/Y Growth 30 29 68 64 47 26 20
% Q/Q Growth 29 (4) 10 21 -- -- --
Weighted Avg. Diluted Shares Outstanding 685,212 686,363 686,362 691,810 687,187 694,405 701,332
Operating EPS $6.27 $6.08 $6.75 $7.88 $27.01 $32.97 $38.37
% Y/Y Growth (37%) (24%) (23%) (24%) (27%) 22% 16%
% Q/Q Growth (40) (3) 11 17 -- -- --
Reported GAAP EPS $5.33 $5.09 $5.60 $6.72 $22.75 $28.47 $33.82
% Y/Y Growth (36%) (36%) (17%) (19%) (27%) 25% 19%
% Q/Q Growth (36) (4) 10 20 -- -- --
F2014
Technology
Internet
October 9, 2014
page 13 of 19 , Jefferies Equity Research, [email protected] US Internet Team
Please see important disclosure information on pages 16 - 19 of this report.
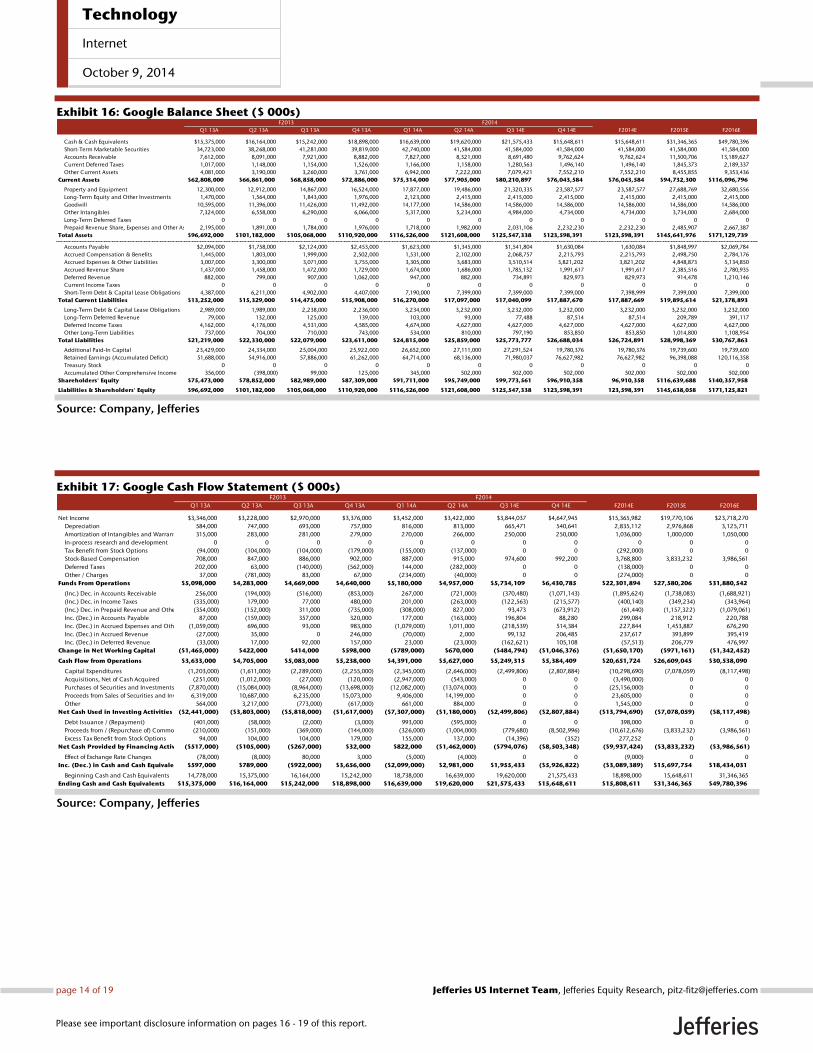
Exhibit 16: Google Balance Sheet ($ 000s)
Source: Company, Jefferies
Exhibit 17: Google Cash Flow Statement ($ 000s)
Source: Company, Jefferies
Q1 13A Q2 13A Q3 13A Q4 13A Q1 14A Q2 14A Q3 14E Q4 14E F2014E F2015E F2016E
Cash & Cash Equivalents $15,375,000 $16,164,000 $15,242,000 $18,898,000 $16,639,000 $19,620,000 $21,575,433 $15,648,611 $15,648,611 $31,346,365 $49,780,396
Short-Term Marketable Securities 34,723,000 38,268,000 41,281,000 39,819,000 42,740,000 41,584,000 41,584,000 41,584,000 41,584,000 41,584,000 41,584,000
Accounts Receivable 7,612,000 8,091,000 7,921,000 8,882,000 7,827,000 8,321,000 8,691,480 9,762,624 9,762,624 11,500,706 13,189,627
Current Deferred Taxes 1,017,000 1,148,000 1,154,000 1,526,000 1,166,000 1,158,000 1,280,563 1,496,140 1,496,140 1,845,373 2,189,337
Other Current Assets 4,081,000 3,190,000 3,260,000 3,761,000 6,942,000 7,222,000 7,079,421 7,552,210 7,552,210 8,455,855 9,353,436
Current Assets $62,808,000 $66,861,000 $68,858,000 $72,886,000 $75,314,000 $77,905,000 $80,210,897 $76,043,584 $76,043,584 $94,732,300 $116,096,796
Property and Equipment 12,300,000 12,912,000 14,867,000 16,524,000 17,877,000 19,486,000 21,320,335 23,587,577 23,587,577 27,688,769 32,680,556
Long-Term Equity and Other Investments 1,470,000 1,564,000 1,843,000 1,976,000 2,123,000 2,415,000 2,415,000 2,415,000 2,415,000 2,415,000 2,415,000
Goodwill 10,595,000 11,396,000 11,426,000 11,492,000 14,177,000 14,586,000 14,586,000 14,586,000 14,586,000 14,586,000 14,586,000
Other Intangibles 7,324,000 6,558,000 6,290,000 6,066,000 5,317,000 5,234,000 4,984,000 4,734,000 4,734,000 3,734,000 2,684,000
Long-Term Deferred Taxes 0 0 0 0 0 0 0 0 0 0 0
Prepaid Revenue Share, Expenses and Other Assets 2,195,000 1,891,000 1,784,000 1,976,000 1,718,000 1,982,000 2,031,106 2,232,230 2,232,230 2,485,907 2,667,387
Total Assets $96,692,000 $101,182,000 $105,068,000 $110,920,000 $116,526,000 $121,608,000 $125,547,338 $123,598,391 $123,598,391 $145,641,976 $171,129,739
Accounts Payable $2,094,000 $1,758,000 $2,124,000 $2,453,000 $1,623,000 $1,345,000 $1,541,804 $1,630,084 1,630,084 $1,848,997 $2,069,784
Accrued Compensation & Benefits 1,445,000 1,803,000 1,999,000 2,502,000 1,531,000 2,102,000 2,068,757 2,215,793 2,215,793 2,498,750 2,784,176
Accrued Expenses & Other Liabilities 3,007,000 3,300,000 3,071,000 3,755,000 3,305,000 3,683,000 3,510,514 3,821,202 3,821,202 4,848,873 5,134,850
Accrued Revenue Share 1,437,000 1,458,000 1,472,000 1,729,000 1,674,000 1,686,000 1,785,132 1,991,617 1,991,617 2,385,516 2,780,935
Deferred Revenue 882,000 799,000 907,000 1,062,000 947,000 882,000 734,891 829,973 829,973 914,478 1,210,146
Current Income Taxes 0 0 0 0 0 0 0 0 0 0 0
Short-Term Debt & Capital Lease Obligations 4,387,000 6,211,000 4,902,000 4,407,000 7,190,000 7,399,000 7,399,000 7,399,000 7,398,999 7,399,000 7,399,000
Total Current Liabilities $13,252,000 $15,329,000 $14,475,000 $15,908,000 $16,270,000 $17,097,000 $17,040,099 $17,887,670 $17,887,669 $19,895,614 $21,378,893
Long-Term Debt & Capital Lease Obligations 2,989,000 1,989,000 2,238,000 2,236,000 3,234,000 3,232,000 3,232,000 3,232,000 3,232,000 3,232,000 3,232,000
Long-Term Deferred Revenue 79,000 132,000 125,000 139,000 103,000 93,000 77,488 87,514 87,514 209,789 391,117
Deferred Income Taxes 4,162,000 4,176,000 4,531,000 4,585,000 4,674,000 4,627,000 4,627,000 4,627,000 4,627,000 4,627,000 4,627,000
Other Long-Term Liabilities 737,000 704,000 710,000 743,000 534,000 810,000 797,190 853,850 853,850 1,014,800 1,108,954
Total Liabilities $21,219,000 $22,330,000 $22,079,000 $23,611,000 $24,815,000 $25,859,000 $25,773,777 $26,688,034 $26,724,891 $28,998,369 $30,767,863
Additional Paid-In Capital 23,429,000 24,334,000 25,004,000 25,922,000 26,652,000 27,111,000 27,291,524 19,780,376 19,780,376 19,739,600 19,739,600
Retained Earnings (Accumulated Deficit) 51,688,000 54,916,000 57,886,000 61,262,000 64,714,000 68,136,000 71,980,037 76,627,982 76,627,982 96,398,088 120,116,358
Treasury Stock 0 0 0 0 0 0 0 0 0 0 0
Accumulated Other Comprehensive Income 356,000 (398,000) 99,000 125,000 345,000 502,000 502,000 502,000 502,000 502,000 502,000
Shareholders' Equity $75,473,000 $78,852,000 $82,989,000 $87,309,000 $91,711,000 $95,749,000 $99,773,561 $96,910,358 96,910,358 $116,639,688 $140,357,9580
Liabilities & Shareholders' Equity $96,692,000 $101,182,000 $105,068,000 $110,920,000 $116,526,000 $121,608,000 $125,547,338 $123,598,391 123,598,391 $145,638,058 $171,125,821
F2013 F2014
Q1 13A Q2 13A Q3 13A Q4 13A Q1 14A Q2 14A Q3 14E Q4 14E F2014E F2015E F2016E
Net Income $3,346,000 $3,228,000 $2,970,000 $3,376,000 $3,452,000 $3,422,000 $3,844,037 $4,647,945 $15,365,982 $19,770,106 $23,718,270
Depreciation 584,000 747,000 693,000 757,000 816,000 813,000 665,471 540,641 2,835,112 2,976,868 3,125,711
Amortization of Intangibles and Warrants 315,000 283,000 281,000 279,000 270,000 266,000 250,000 250,000 1,036,000 1,000,000 1,050,000
In-process research and development 0 0 0 0 0 0 0 0 0 0 0
Tax Benefit from Stock Options (94,000) (104,000) (104,000) (179,000) (155,000) (137,000) 0 0 (292,000) 0 0
Stock-Based Compensation 708,000 847,000 886,000 902,000 887,000 915,000 974,600 992,200 3,768,800 3,833,232 3,986,561
Deferred Taxes 202,000 63,000 (140,000) (562,000) 144,000 (282,000) 0 0 (138,000) 0 0
Other / Charges 37,000 (781,000) 83,000 67,000 (234,000) (40,000) 0 0 (274,000) 0 0
Funds From Operations $5,098,000 $4,283,000 $4,669,000 $4,640,000 $5,180,000 $4,957,000 $5,734,109 $6,430,785 $22,301,894 $27,580,206 $31,880,542
(Inc.) Dec. in Accounts Receivable 256,000 (194,000) (516,000) (853,000) 267,000 (721,000) (370,480) (1,071,143) (1,895,624) (1,738,083) (1,688,921)
(Inc.) Dec. in Income Taxes (335,000) 179,000 77,000 480,000 201,000 (263,000) (122,563) (215,577) (400,140) (349,234) (343,964)
(Inc.) Dec. in Prepaid Revenue and Other (354,000) (152,000) 311,000 (735,000) (308,000) 827,000 93,473 (673,912) (61,440) (1,157,322) (1,079,061)
Inc. (Dec.) in Accounts Payable 87,000 (159,000) 357,000 320,000 177,000 (163,000) 196,804 88,280 299,084 218,912 220,788
Inc. (Dec.) in Accrued Expenses and Other Liabilities(1,059,000) 696,000 93,000 983,000 (1,079,000) 1,011,000 (218,539) 514,384 227,844 1,453,887 676,290
Inc. (Dec.) in Accrued Revenue (27,000) 35,000 0 246,000 (70,000) 2,000 99,132 206,485 237,617 393,899 395,419
Inc. (Dec.) in Deferred Revenue (33,000) 17,000 92,000 157,000 23,000 (23,000) (162,621) 105,108 (57,513) 206,779 476,997
Change in Net Working Capital ($1,465,000) $422,000 $414,000 $598,000 ($789,000) $670,000 ($484,794) ($1,046,376) ($1,650,170) ($971,161) ($1,342,452)
Cash Flow from Operations $3,633,000 $4,705,000 $5,083,000 $5,238,000 $4,391,000 $5,627,000 $5,249,315 $5,384,409 $20,651,724 $26,609,045 $30,538,090
Capital Expenditures (1,203,000) (1,611,000) (2,289,000) (2,255,000) (2,345,000) (2,646,000) (2,499,806) (2,807,884) (10,298,690) (7,078,059) (8,117,498)
Acquisitions, Net of Cash Acquired (251,000) (1,012,000) (27,000) (120,000) (2,947,000) (543,000) 0 0 (3,490,000) 0 0
Purchases of Securities and Investments (7,870,000) (15,084,000) (8,964,000) (13,698,000) (12,082,000) (13,074,000) 0 0 (25,156,000) 0 0
Proceeds from Sales of Securities and Investments6,319,000 10,687,000 6,235,000 15,073,000 9,406,000 14,199,000 0 0 23,605,000 0 0
Other 564,000 3,217,000 (773,000) (617,000) 661,000 884,000 0 0 1,545,000 0 0
Net Cash Used in Investing Activities ($2,441,000) ($3,803,000) ($5,818,000) ($1,617,000) ($7,307,000) ($1,180,000) ($2,499,806) ($2,807,884) ($13,794,690) ($7,078,059) ($8,117,498)
Debt Issuance / (Repayment) (401,000) (58,000) (2,000) (3,000) 993,000 (595,000) 0 0 398,000 0 0
Proceeds from / (Repurchase of) Common Stock(210,000) (151,000) (369,000) (144,000) (326,000) (1,004,000) (779,680) (8,502,996) (10,612,676) (3,833,232) (3,986,561)
Excess Tax Benefit from Stock Options 94,000 104,000 104,000 179,000 155,000 137,000 (14,396) (352) 277,252 0 0
Net Cash Provided by Financing Activities($517,000) ($105,000) ($267,000) $32,000 $822,000 ($1,462,000) ($794,076) ($8,503,348) ($9,937,424) ($3,833,232) ($3,986,561)
Effect of Exchange Rate Changes (78,000) (8,000) 80,000 3,000 (5,000) (4,000) 0 0 (9,000) 0 0
Inc. (Dec.) in Cash and Cash Equivalents $597,000 $789,000 ($922,000) $3,656,000 ($2,099,000) $2,981,000 $1,955,433 ($5,926,822) ($3,089,389) $15,697,754 $18,434,031
Beginning Cash and Cash Equivalents 14,778,000 15,375,000 16,164,000 15,242,000 18,738,000 16,639,000 19,620,000 21,575,433 18,898,000 15,648,611 31,346,365
Ending Cash and Cash Equivalents $15,375,000 $16,164,000 $15,242,000 $18,898,000 $16,639,000 $19,620,000 $21,575,433 $15,648,611 $15,808,611 $31,346,365 $49,780,396
F2013 F2014
Technology
Internet
October 9, 2014
page 14 of 19 , Jefferies Equity Research, [email protected] US Internet Team
Please see important disclosure information on pages 16 - 19 of this report.
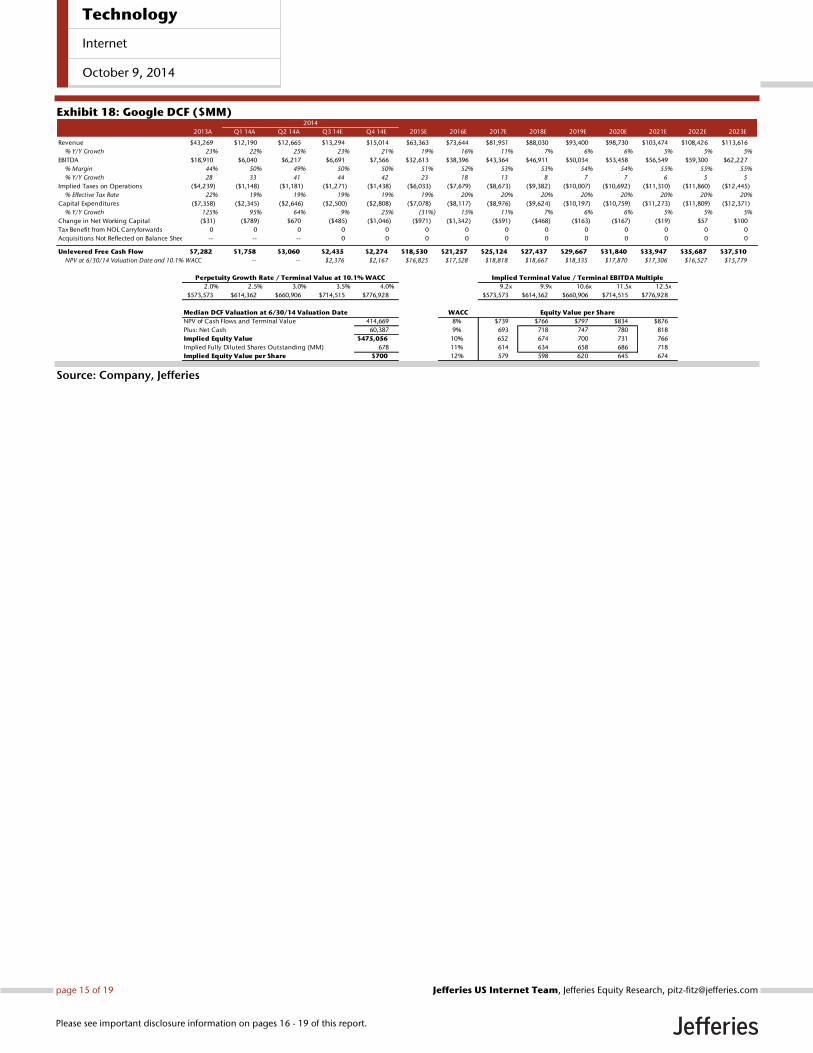
Exhibit 18: Google DCF ($MM)
Source: Company, Jefferies
2014
2013A Q1 14A Q2 14A Q3 14E Q4 14E 2015E 2016E 2017E 2018E 2019E 2020E 2021E 2022E 2023E
Revenue $43,269 $12,190 $12,665 $13,294 $15,014 $63,363 $73,644 $81,951 $88,030 $93,400 $98,730 $103,474 $108,426 $113,616
% Y/Y Growth 23% 22% 25% 23% 21% 19% 16% 11% 7% 6% 6% 5% 5% 5%
EBITDA $18,910 $6,040 $6,217 $6,691 $7,566 $32,613 $38,396 $43,364 $46,911 $50,034 $53,458 $56,549 $59,300 $62,227
% Margin 44% 50% 49% 50% 50% 51% 52% 53% 53% 54% 54% 55% 55% 55%
% Y/Y Growth 28 33 41 44 42 23 18 13 8 7 7 6 5 5
Implied Taxes on Operations ($4,239) ($1,148) ($1,181) ($1,271) ($1,438) ($6,033) ($7,679) ($8,673) ($9,382) ($10,007) ($10,692) ($11,310) ($11,860) ($12,445)
% Effective Tax Rate 22% 19% 19% 19% 19% 19% 20% 20% 20% 20% 20% 20% 20% 20%
Capital Expenditures ($7,358) ($2,345) ($2,646) ($2,500) ($2,808) ($7,078) ($8,117) ($8,976) ($9,624) ($10,197) ($10,759) ($11,273) ($11,809) ($12,371)
% Y/Y Growth 125% 95% 64% 9% 25% (31%) 15% 11% 7% 6% 6% 5% 5% 5%
Change in Net Working Capital ($31) ($789) $670 ($485) ($1,046) ($971) ($1,342) ($591) ($468) ($163) ($167) ($19) $57 $100
Tax Benefit from NOL Carryforwards 0 0 0 0 0 0 0 0 0 0 0 0 0 0
Acquisitions Not Reflected on Balance Sheet / Shares-- -- -- 0 0 0 0 0 0 0 0 0 0 0
Unlevered Free Cash Flow $7,282 $1,758 $3,060 $2,435 $2,274 $18,530 $21,257 $25,124 $27,437 $29,667 $31,840 $33,947 $35,687 $37,510
NPV at 6/30/14 Valuation Date and 10.1% WACC -- -- $2,376 $2,167 $16,825 $17,528 $18,818 $18,667 $18,335 $17,870 $17,306 $16,527 $15,779
Perpetuity Growth Rate / Terminal Value at 10.1% WACC Implied Terminal Value / Terminal EBITDA Multiple
2.0% 2.5% 3.0% 3.5% 4.0% 9.2x 9.9x 10.6x 11.5x 12.5x
$573,573 $614,362 $660,906 $714,515 $776,928 $573,573 $614,362 $660,906 $714,515 $776,928
Median DCF Valuation at 6/30/14 Valuation Date WACC Equity Value per Share
NPV of Cash Flows and Terminal Value 414,669 8% $739 $766 $797 $834 $876
Plus: Net Cash 60,387 9% 693 718 747 780 818
Implied Equity Value $475,056 10% 652 674 700 731 766
Implied Fully Diluted Shares Outstanding (MM) 678 11% 614 634 658 686 718
Implied Equity Value per Share $700 12% 579 598 620 645 674
Technology
Internet
October 9, 2014
page 15 of 19 , Jefferies Equity Research, [email protected] US Internet Team
Please see important disclosure information on pages 16 - 19 of this report.
Analyst Certification:I, Jefferies US Internet Team, certify that all of the views expressed in this research report accurately reflect my personal views about the subjectsecurity(ies) and subject company(ies). I also certify that no part of my compensation was, is, or will be, directly or indirectly, related to the specificrecommendations or views expressed in this research report.I, Brian Pitz, certify that all of the views expressed in this research report accurately reflect my personal views about the subject security(ies) and subjectcompany(ies). I also certify that no part of my compensation was, is, or will be, directly or indirectly, related to the specific recommendations or viewsexpressed in this research report.I, Brian Fitzgerald, certify that all of the views expressed in this research report accurately reflect my personal views about the subject security(ies) andsubject company(ies). I also certify that no part of my compensation was, is, or will be, directly or indirectly, related to the specific recommendationsor views expressed in this research report.I, Stan Velikov, CFA, certify that all of the views expressed in this research report accurately reflect my personal views about the subject security(ies) andsubject company(ies). I also certify that no part of my compensation was, is, or will be, directly or indirectly, related to the specific recommendationsor views expressed in this research report.I, Timothy O'Shea, certify that all of the views expressed in this research report accurately reflect my personal views about the subject security(ies) andsubject company(ies). I also certify that no part of my compensation was, is, or will be, directly or indirectly, related to the specific recommendationsor views expressed in this research report.I, Sachin Khattar, CFA, certify that all of the views expressed in this research report accurately reflect my personal views about the subjectsecurity(ies) and subject company(ies). I also certify that no part of my compensation was, is, or will be, directly or indirectly, related to the specificrecommendations or views expressed in this research report.As is the case with all Jefferies employees, the analyst(s) responsible for the coverage of the financial instruments discussed in this report receivescompensation based in part on the overall performance of the firm, including investment banking income. We seek to update our research asappropriate, but various regulations may prevent us from doing so. Aside from certain industry reports published on a periodic basis, the large majorityof reports are published at irregular intervals as appropriate in the analyst's judgement.
Company Specific DisclosuresFor Important Disclosure information on companies recommended in this report, please visit our website at https://javatar.bluematrix.com/sellside/Disclosures.action or call 212.284.2300.
Meanings of Jefferies RatingsBuy - Describes stocks that we expect to provide a total return (price appreciation plus yield) of 15% or more within a 12-month period.Hold - Describes stocks that we expect to provide a total return (price appreciation plus yield) of plus 15% or minus 10% within a 12-month period.Underperform - Describes stocks that we expect to provide a total negative return (price appreciation plus yield) of 10% or more within a 12-monthperiod.The expected total return (price appreciation plus yield) for Buy rated stocks with an average stock price consistently below $10 is 20% or more withina 12-month period as these companies are typically more volatile than the overall stock market. For Hold rated stocks with an average stock priceconsistently below $10, the expected total return (price appreciation plus yield) is plus or minus 20% within a 12-month period. For Underperformrated stocks with an average stock price consistently below $10, the expected total return (price appreciation plus yield) is minus 20% within a 12-month period.NR - The investment rating and price target have been temporarily suspended. Such suspensions are in compliance with applicable regulations and/or Jefferies policies.CS - Coverage Suspended. Jefferies has suspended coverage of this company.NC - Not covered. Jefferies does not cover this company.Restricted - Describes issuers where, in conjunction with Jefferies engagement in certain transactions, company policy or applicable securitiesregulations prohibit certain types of communications, including investment recommendations.Monitor - Describes stocks whose company fundamentals and financials are being monitored, and for which no financial projections or opinions onthe investment merits of the company are provided.
Valuation MethodologyJefferies' methodology for assigning ratings may include the following: market capitalization, maturity, growth/value, volatility and expected totalreturn over the next 12 months. The price targets are based on several methodologies, which may include, but are not restricted to, analyses of marketrisk, growth rate, revenue stream, discounted cash flow (DCF), EBITDA, EPS, cash flow (CF), free cash flow (FCF), EV/EBITDA, P/E, PE/growth, P/CF,P/FCF, premium (discount)/average group EV/EBITDA, premium (discount)/average group P/E, sum of the parts, net asset value, dividend returns,and return on equity (ROE) over the next 12 months.
Jefferies Franchise PicksJefferies Franchise Picks include stock selections from among the best stock ideas from our equity analysts over a 12 month period. Stock selectionis based on fundamental analysis and may take into account other factors such as analyst conviction, differentiated analysis, a favorable risk/rewardratio and investment themes that Jefferies analysts are recommending. Jefferies Franchise Picks will include only Buy rated stocks and the numbercan vary depending on analyst recommendations for inclusion. Stocks will be added as new opportunities arise and removed when the reason forinclusion changes, the stock has met its desired return, if it is no longer rated Buy and/or if it underperforms the S&P by 15% or more since inclusion.Franchise Picks are not intended to represent a recommended portfolio of stocks and is not sector based, but we may note where we believe a Pickfalls within an investment style such as growth or value.
Technology
Internet
October 9, 2014
page 16 of 19 , Jefferies Equity Research, [email protected] US Internet Team
Please see important disclosure information on pages 16 - 19 of this report.
Risk which may impede the achievement of our Price TargetThis report was prepared for general circulation and does not provide investment recommendations specific to individual investors. As such, thefinancial instruments discussed in this report may not be suitable for all investors and investors must make their own investment decisions basedupon their specific investment objectives and financial situation utilizing their own financial advisors as they deem necessary. Past performance ofthe financial instruments recommended in this report should not be taken as an indication or guarantee of future results. The price, value of, andincome from, any of the financial instruments mentioned in this report can rise as well as fall and may be affected by changes in economic, financialand political factors. If a financial instrument is denominated in a currency other than the investor's home currency, a change in exchange rates mayadversely affect the price of, value of, or income derived from the financial instrument described in this report. In addition, investors in securities suchas ADRs, whose values are affected by the currency of the underlying security, effectively assume currency risk.
Other Companies Mentioned in This Report• Activision Blizzard, Inc. (ATVI: $20.64, BUY)• Amazon.com, Inc (AMZN: $322.70, BUY)• AOL, Inc. (AOL: $44.09, BUY)• Blucora Inc. (BCOR: $15.35, HOLD)• CafePress, Inc. (PRSS: $3.22, HOLD)• Chegg Inc. (CHGG: $6.14, BUY)• Conversant (CNVR: $34.09, HOLD)• Criteo S.A. (CRTO: $33.81, BUY)• Demand Media, Inc. (DMD: $8.42, HOLD)• EarthLink, Inc. (ELNK: $3.43, UNDERPERFORM)• eBay, Inc. (EBAY: $54.51, HOLD)• Electronic Arts Inc. (EA: $35.28, HOLD)• Endurance International Group (EIGI: $16.70, BUY)• Expedia, Inc (EXPE: $85.38, HOLD)• Facebook, Inc. (FB: $77.52, BUY)• Google, Inc. (GOOG: $572.50, BUY)• Groupon (GRPN: $6.48, HOLD)• IAC / InterActiveCorp (IACI: $63.42, HOLD)• JD.com, Inc. (JD: $26.40, BUY)• LinkedIn Corporation (LNKD: $207.07, BUY)• Netflix, Inc. (NFLX: $466.86, UNDERPERFORM)• Orbitz Worldwide, Inc. (OWW: $8.21, HOLD)• RetailMeNot Inc. (SALE: $15.56, BUY)• SFX Entertainment, Inc. (SFXE: $4.34, BUY)• Shutterfly, Inc (SFLY: $48.58, HOLD)• Shutterstock (SSTK: $70.22, BUY)• Take-Two Interactive Software, Inc. (TTWO: $22.44, HOLD)• TechTarget, Inc. (TTGT: $9.65, BUY)• The Priceline Group Inc. (PCLN: $1,126.92, BUY)• TiVo Inc. (TIVO: $12.88, BUY)• Tremor Video, Inc. (TRMR: $2.31, HOLD)• TripAdvisor (TRIP: $88.54, HOLD)• Vistaprint N.V. (VPRT: $55.45, HOLD)• Yahoo!, Inc. (YHOO: $41.08, BUY)• Yelp, Inc. (YELP: $70.15, BUY)• Zynga, Inc. (ZNGA: $2.56, HOLD)
Distribution of RatingsIB Serv./Past 12 Mos.
Rating Count Percent Count Percent
BUY 987 51.95% 260 26.34%HOLD 772 40.63% 136 17.62%UNDERPERFORM 141 7.42% 5 3.55%
Technology
Internet
October 9, 2014
page 17 of 19 , Jefferies Equity Research, [email protected] US Internet Team
Please see important disclosure information on pages 16 - 19 of this report.
Other Important Disclosures
Jefferies Equity Research refers to research reports produced by analysts employed by one of the following Jefferies Group LLC (“Jefferies”) groupcompanies:
United States: Jefferies LLC which is an SEC registered firm and a member of FINRA.
United Kingdom: Jefferies International Limited, which is authorized and regulated by the Financial Conduct Authority; registered in England andWales No. 1978621; registered office: Vintners Place, 68 Upper Thames Street, London EC4V 3BJ; telephone +44 (0)20 7029 8000; facsimile +44 (0)207029 8010.
Hong Kong: Jefferies Hong Kong Limited, which is licensed by the Securities and Futures Commission of Hong Kong with CE number ATS546; locatedat Suite 2201, 22nd Floor, Cheung Kong Center, 2 Queen’s Road Central, Hong Kong.
Singapore: Jefferies Singapore Limited, which is licensed by the Monetary Authority of Singapore; located at 80 Raffles Place #15-20, UOB Plaza 2,Singapore 048624, telephone: +65 6551 3950.
Japan: Jefferies (Japan) Limited, Tokyo Branch, which is a securities company registered by the Financial Services Agency of Japan and is a memberof the Japan Securities Dealers Association; located at Hibiya Marine Bldg, 3F, 1-5-1 Yuraku-cho, Chiyoda-ku, Tokyo 100-0006; telephone +813 52516100; facsimile +813 5251 6101.
India: Jefferies India Private Limited (CIN - U74140MH2007PTC200509), which is licensed by the Securities and Exchange Board of India as a MerchantBanker (INM000011443) and a Stock Broker with Bombay Stock Exchange Limited (INB011491033) and National Stock Exchange of India Limited(INB231491037) in the Capital Market Segment; located at 42/43, 2 North Avenue, Maker Maxity, Bandra-Kurla Complex, Bandra (East) Mumbai 400051, India; Tel +91 22 4356 6000.
This material has been prepared by Jefferies employing appropriate expertise, and in the belief that it is fair and not misleading. The information setforth herein was obtained from sources believed to be reliable, but has not been independently verified by Jefferies. Therefore, except for any obligationunder applicable rules we do not guarantee its accuracy. Additional and supporting information is available upon request. Unless prohibited by theprovisions of Regulation S of the U.S. Securities Act of 1933, this material is distributed in the United States ("US"), by Jefferies LLC, a US-registeredbroker-dealer, which accepts responsibility for its contents in accordance with the provisions of Rule 15a-6, under the US Securities Exchange Act of1934. Transactions by or on behalf of any US person may only be effected through Jefferies LLC. In the United Kingdom and European EconomicArea this report is issued and/or approved for distribution by Jefferies International Limited and is intended for use only by persons who have, or havebeen assessed as having, suitable professional experience and expertise, or by persons to whom it can be otherwise lawfully distributed. JefferiesInternational Limited has adopted a conflicts management policy in connection with the preparation and publication of research, the details of whichare available upon request in writing to the Compliance Officer. Jefferies International Limited may allow its analysts to undertake private consultancywork. Jefferies International Limited’s conflicts management policy sets out the arrangements Jefferies International Limited employs to manage anypotential conflicts of interest that may arise as a result of such consultancy work. For Canadian investors, this material is intended for use only byprofessional or institutional investors. None of the investments or investment services mentioned or described herein is available to other personsor to anyone in Canada who is not a "Designated Institution" as defined by the Securities Act (Ontario). In Singapore, Jefferies Singapore Limited isregulated by the Monetary Authority of Singapore. For investors in the Republic of Singapore, this material is provided by Jefferies Singapore Limitedpursuant to Regulation 32C of the Financial Advisers Regulations. The material contained in this document is intended solely for accredited, expert orinstitutional investors, as defined under the Securities and Futures Act (Cap. 289 of Singapore). If there are any matters arising from, or in connectionwith this material, please contact Jefferies Singapore Limited, located at 80 Raffles Place #15-20, UOB Plaza 2, Singapore 048624, telephone: +656551 3950. In Japan this material is issued and distributed by Jefferies (Japan) Limited to institutional investors only. In Hong Kong, this report isissued and approved by Jefferies Hong Kong Limited and is intended for use only by professional investors as defined in the Hong Kong Securities andFutures Ordinance and its subsidiary legislation. In the Republic of China (Taiwan), this report should not be distributed. The research in relation tothis report is conducted outside the PRC. This report does not constitute an offer to sell or the solicitation of an offer to buy any securities in the PRC.PRC investors shall have the relevant qualifications to invest in such securities and shall be responsible for obtaining all relevant approvals, licenses,verifications and/or registrations from the relevant governmental authorities themselves. In India this report is made available by Jefferies India PrivateLimited. In Australia this information is issued solely by Jefferies International Limited and is directed solely at wholesale clients within the meaning ofthe Corporations Act 2001 of Australia (the "Act") in connection with their consideration of any investment or investment service that is the subject ofthis document. Any offer or issue that is the subject of this document does not require, and this document is not, a disclosure document or productdisclosure statement within the meaning of the Act. Jefferies International Limited is authorised and regulated by the Financial Conduct Authorityunder the laws of the United Kingdom, which differ from Australian laws. Jefferies International Limited has obtained relief under Australian Securitiesand Investments Commission Class Order 03/1099, which conditionally exempts it from holding an Australian financial services licence under theAct in respect of the provision of certain financial services to wholesale clients. Recipients of this document in any other jurisdictions should informthemselves about and observe any applicable legal requirements in relation to the receipt of this document.
This report is not an offer or solicitation of an offer to buy or sell any security or derivative instrument, or to make any investment. Any opinion orestimate constitutes the preparer's best judgment as of the date of preparation, and is subject to change without notice. Jefferies assumes no obligationto maintain or update this report based on subsequent information and events. Jefferies, its associates or affiliates, and its respective officers, directors,and employees may have long or short positions in, or may buy or sell any of the securities, derivative instruments or other investments mentioned ordescribed herein, either as agent or as principal for their own account. Upon request Jefferies may provide specialized research products or servicesto certain customers focusing on the prospects for individual covered stocks as compared to other covered stocks over varying time horizons orunder differing market conditions. While the views expressed in these situations may not always be directionally consistent with the long-term viewsexpressed in the analyst's published research, the analyst has a reasonable basis and any inconsistencies can be reasonably explained. This materialdoes not constitute a personal recommendation or take into account the particular investment objectives, financial situations, or needs of individualclients. Clients should consider whether any advice or recommendation in this report is suitable for their particular circumstances and, if appropriate,seek professional advice, including tax advice. The price and value of the investments referred to herein and the income from them may fluctuate. Pastperformance is not a guide to future performance, future returns are not guaranteed, and a loss of original capital may occur. Fluctuations in exchange
Technology
Internet
October 9, 2014
page 18 of 19 , Jefferies Equity Research, [email protected] US Internet Team
Please see important disclosure information on pages 16 - 19 of this report.
rates could have adverse effects on the value or price of, or income derived from, certain investments. This report has been prepared independently ofany issuer of securities mentioned herein and not in connection with any proposed offering of securities or as agent of any issuer of securities. Noneof Jefferies, any of its affiliates or its research analysts has any authority whatsoever to make any representations or warranty on behalf of the issuer(s).Jefferies policy prohibits research personnel from disclosing a recommendation, investment rating, or investment thesis for review by an issuer priorto the publication of a research report containing such rating, recommendation or investment thesis. Any comments or statements made herein arethose of the author(s) and may differ from the views of Jefferies.
This report may contain information obtained from third parties, including ratings from credit ratings agencies such as Standard & Poor’s. Reproductionand distribution of third party content in any form is prohibited except with the prior written permission of the related third party. Third party contentproviders do not guarantee the accuracy, completeness, timeliness or availability of any information, including ratings, and are not responsible forany errors or omissions (negligent or otherwise), regardless of the cause, or for the results obtained from the use of such content. Third party contentproviders give no express or implied warranties, including, but not limited to, any warranties of merchantability or fitness for a particular purpose oruse. Third party content providers shall not be liable for any direct, indirect, incidental, exemplary, compensatory, punitive, special or consequentialdamages, costs, expenses, legal fees, or losses (including lost income or profits and opportunity costs) in connection with any use of their content,including ratings. Credit ratings are statements of opinions and are not statements of fact or recommendations to purchase, hold or sell securities. Theydo not address the suitability of securities or the suitability of securities for investment purposes, and should not be relied on as investment advice.
Jefferies research reports are disseminated and available primarily electronically, and, in some cases, in printed form. Electronic research issimultaneously available to all clients. This report or any portion hereof may not be reprinted, sold or redistributed without the written consent ofJefferies. Neither Jefferies nor any officer nor employee of Jefferies accepts any liability whatsoever for any direct, indirect or consequential damagesor losses arising from any use of this report or its contents.
For Important Disclosure information, please visit our website at https://javatar.bluematrix.com/sellside/Disclosures.action or call 1.888.JEFFERIES
© 2014 Jefferies Group LLC
Technology
Internet
October 9, 2014
page 19 of 19 , Jefferies Equity Research, [email protected] US Internet Team
Please see important disclosure information on pages 16 - 19 of this report.