Modelare interactiuni si comportament Adapted after : Timothy Lethbridge and Robert Laganiere,
date post
20-Dec-2015Category
view
213download
0
Internet Gambling in Comparative Perspective:
Patterns, Problems, and Interventions
Dr. Robert Wood & Dr. Robert Williams
University of Lethbridge

Current Study Funded by a three-year grant from the Ontario Problem
Gambling Research Centre (final research report now published on OPGRC website).
Preliminary descriptive results presented at AGRI 2008 conference.
The present study seeks to overcome past limitations by generating a sample that is large, and also weighted for representativeness.
Moreover, our study is based on a sample of both Internet and non-Internet gamblers, thereby allowing direct and systematic comparison of the two groups.
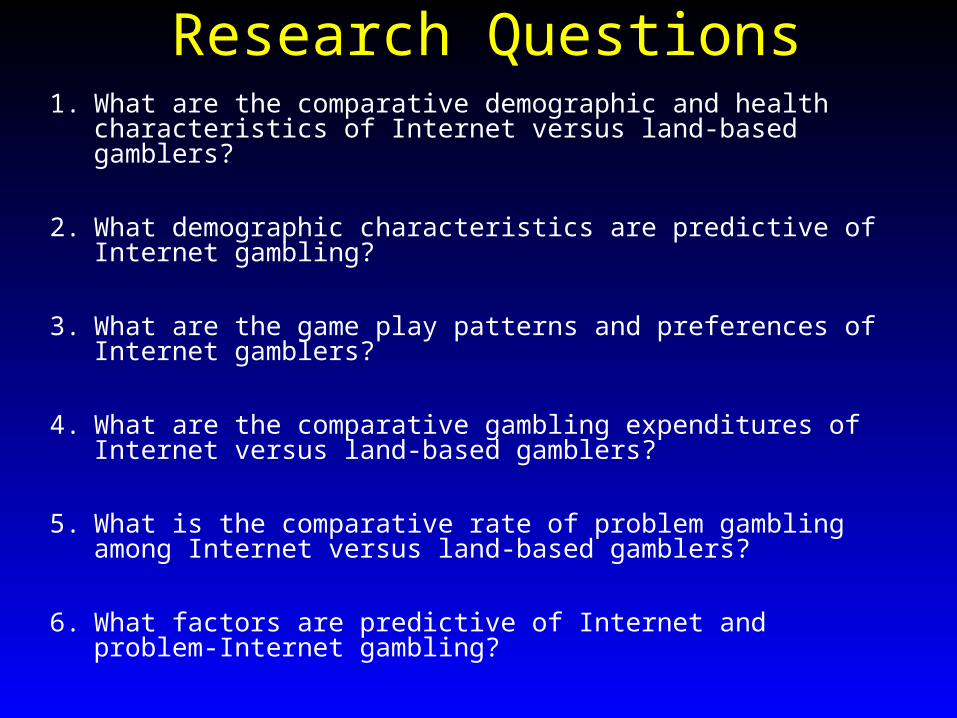
Research Questions1. What are the comparative demographic and health
characteristics of Internet versus land-based gamblers?
2. What demographic characteristics are predictive of Internet gambling?
3. What are the game play patterns and preferences of Internet gamblers?
4. What are the comparative gambling expenditures of Internet versus land-based gamblers?
5. What is the comparative rate of problem gambling among Internet versus land-based gamblers?
6. What factors are predictive of Internet and problem-Internet gambling?
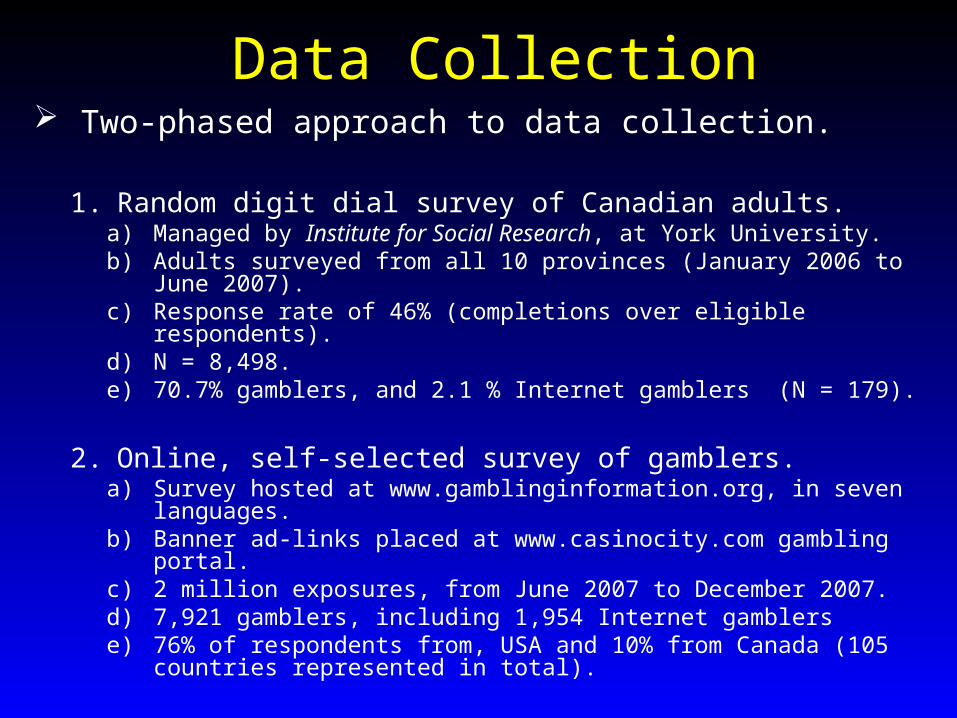
Data Collection Two-phased approach to data collection.
1. Random digit dial survey of Canadian adults.a) Managed by Institute for Social Research, at York University.b) Adults surveyed from all 10 provinces (January 2006 to June 2007). c) Response rate of 46% (completions over eligible respondents). d) N = 8,498.e) 70.7% gamblers, and 2.1 % Internet gamblers (N = 179).
2. Online, self-selected survey of gamblers.a) Survey hosted at www.gamblinginformation.org, in seven languages.b) Banner ad-links placed at www.casinocity.com gambling portal.c) 2 million exposures, from June 2007 to December 2007.d) 7,921 gamblers, including 1,954 Internet gamblerse) 76% of respondents from, USA and 10% from Canada (105 countries
represented in total).

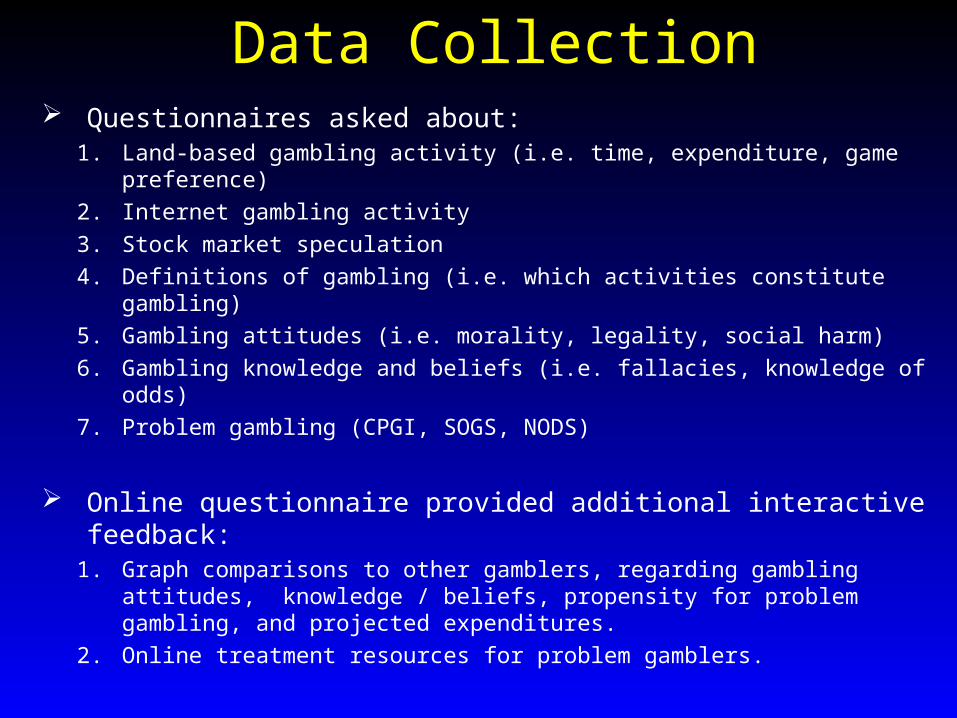
Data Collection Questionnaires asked about:
1. Land-based gambling activity (i.e. time, expenditure, game preference)
2. Internet gambling activity
3. Stock market speculation
4. Definitions of gambling (i.e. which activities constitute gambling)
5. Gambling attitudes (i.e. morality, legality, social harm)
6. Gambling knowledge and beliefs (i.e. fallacies, knowledge of odds)
7. Problem gambling (CPGI, SOGS, NODS)
Online questionnaire provided additional interactive feedback:1. Graph comparisons to other gamblers, regarding gambling attitudes,
knowledge / beliefs, propensity for problem gambling, and projected expenditures.
2. Online treatment resources for problem gamblers.
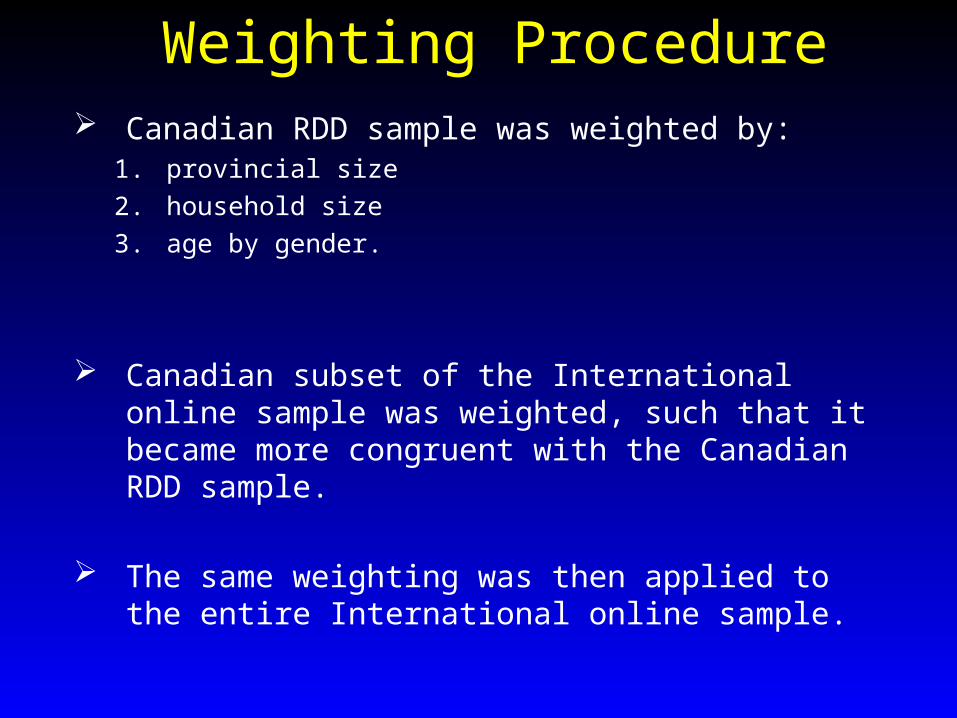
Weighting Procedure Canadian RDD sample was weighted by:
1. provincial size
2. household size
3. age by gender.
Canadian subset of the International online sample was weighted, such that it became more congruent with the Canadian RDD sample.
The same weighting was then applied to the entire International online sample.
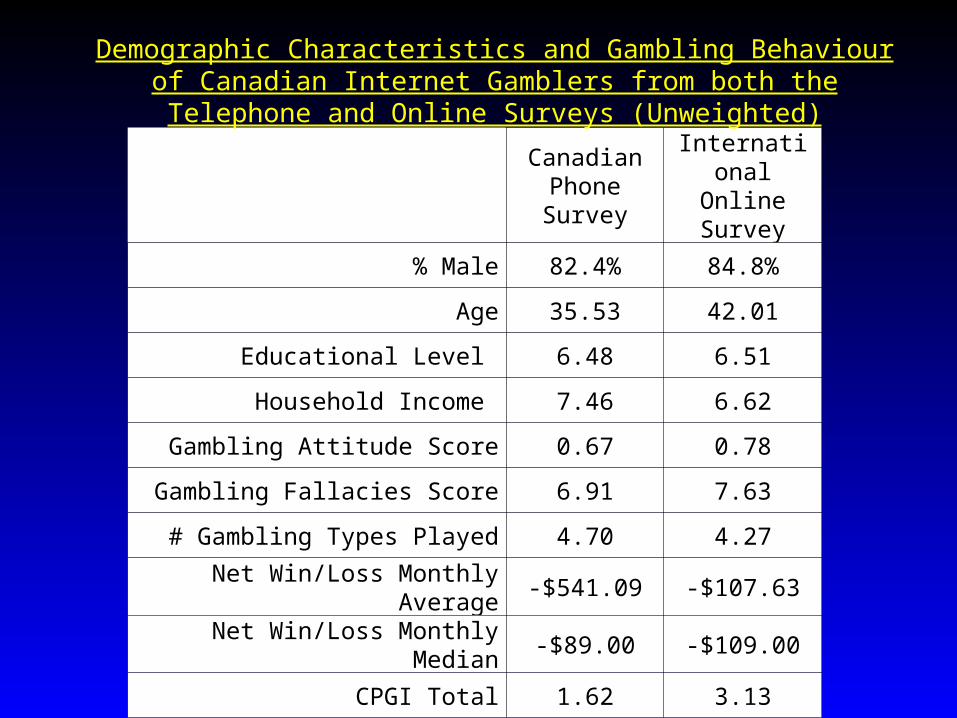
Canadian Phone Survey
International Online Survey
% Male 82.4% 84.8%
Age 35.53 42.01
Educational Level 6.48 6.51
Household Income 7.46 6.62
Gambling Attitude Score 0.67 0.78
Gambling Fallacies Score 6.91 7.63
# Gambling Types Played 4.70 4.27
Net Win/Loss Monthly Average -$541.09 -$107.63
Net Win/Loss Monthly Median -$89.00 -$109.00
CPGI Total 1.62 3.13
Demographic Characteristics and Gambling Behaviour of Canadian Internet Gamblers from both the Telephone and Online Surveys (Unweighted)

Demographic Characteristics and Gambling Behaviour of Canadian Internet Gamblers from both the Telephone and Online Surveys (Weighted)
Canadian Phone Survey
International Online Survey
% Male 82.4% 85.9%
Age 35.53 43.87
Educational Level 6.48 6.50
Household Income 7.46 6.84
Gambling Attitude Score 0.67 0.87
Gambling Fallacies Score 6.91 7.51
# Gambling Types Played 4.70 4.19
Net Win/Loss Monthly Average -$541.09 -$166.55
Net Win/Loss Monthly Median -$89.00 -$90.00
CPGI Total 1.62 1.62
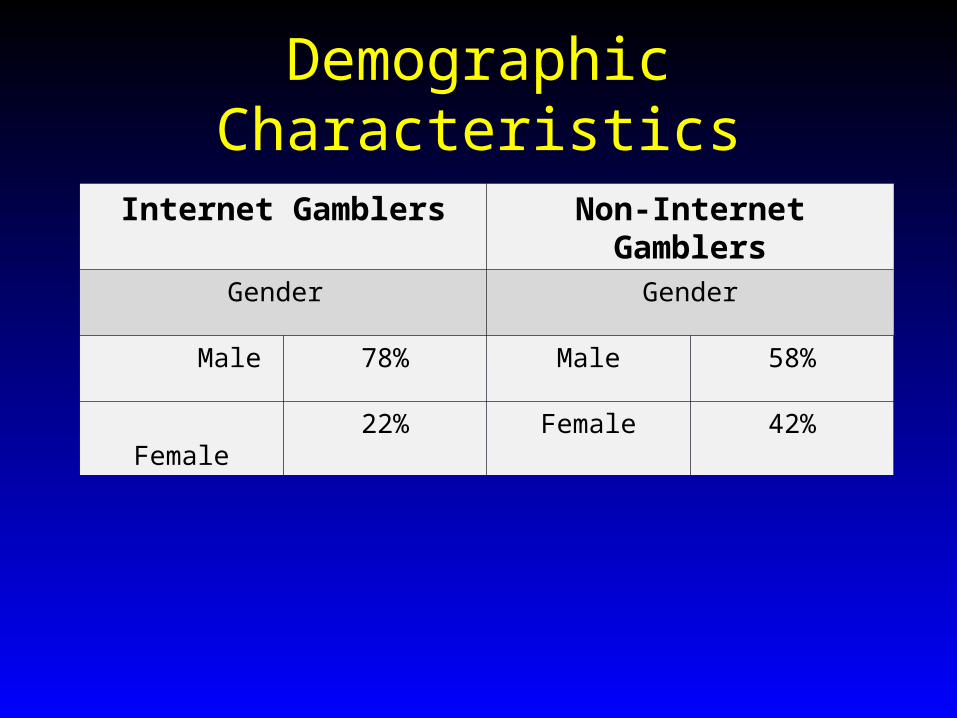
Demographic Characteristics
Internet Gamblers Non-Internet Gamblers
Gender Gender
Male 78% Male 58%
Female 22% Female 42%
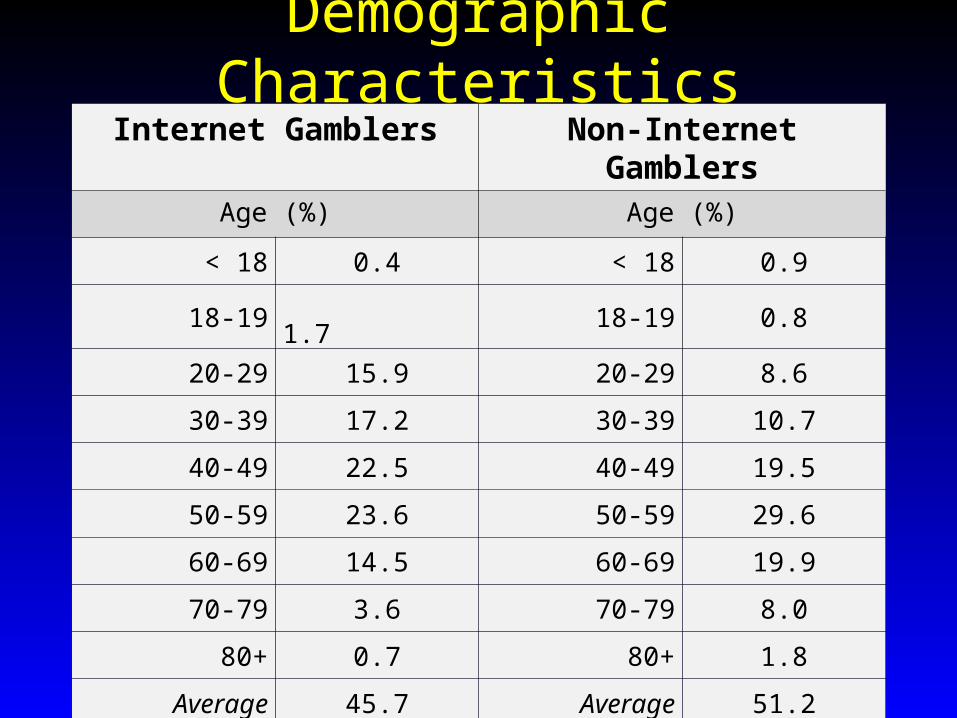
Demographic CharacteristicsInternet Gamblers Non-Internet Gamblers
Age (%) Age (%)
< 18 0.4 < 18 0.9
18-19 1.7 18-19 0.8
20-29 15.9 20-29 8.6
30-39 17.2 30-39 10.7
40-49 22.5 40-49 19.5
50-59 23.6 50-59 29.6
60-69 14.5 60-69 19.9
70-79 3.6 70-79 8.0
80+ 0.7 80+ 1.8
Average 45.7 Average 51.2
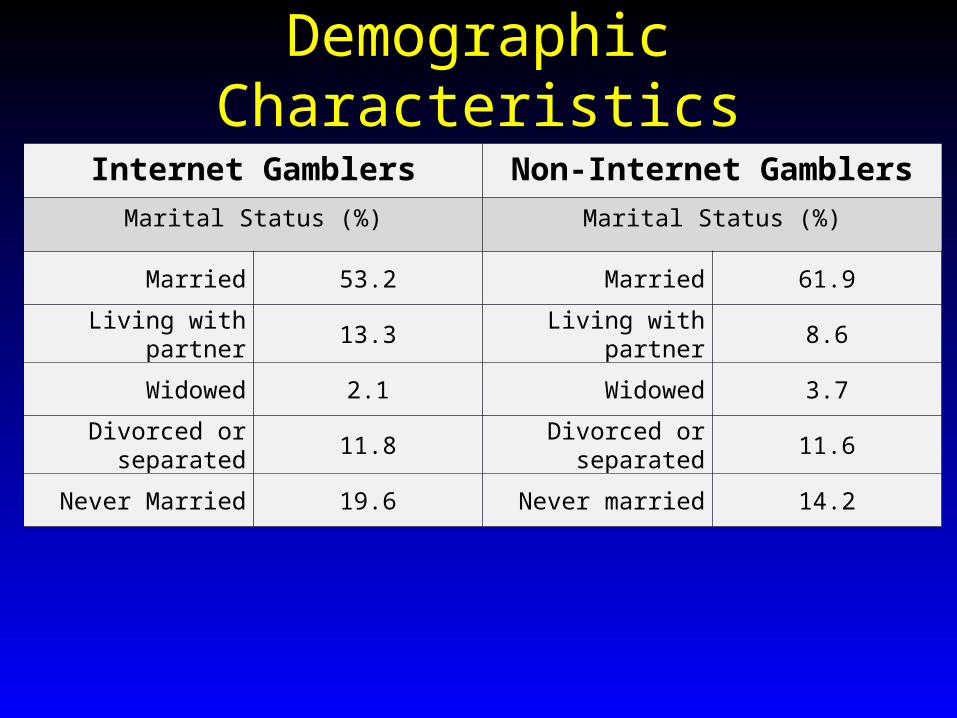
Demographic Characteristics
Internet Gamblers Non-Internet Gamblers
Marital Status (%) Marital Status (%)
Married 53.2 Married 61.9
Living with partner 13.3 Living with partner 8.6
Widowed 2.1 Widowed 3.7
Divorced or separated 11.8 Divorced or separated 11.6
Never Married 19.6 Never married 14.2
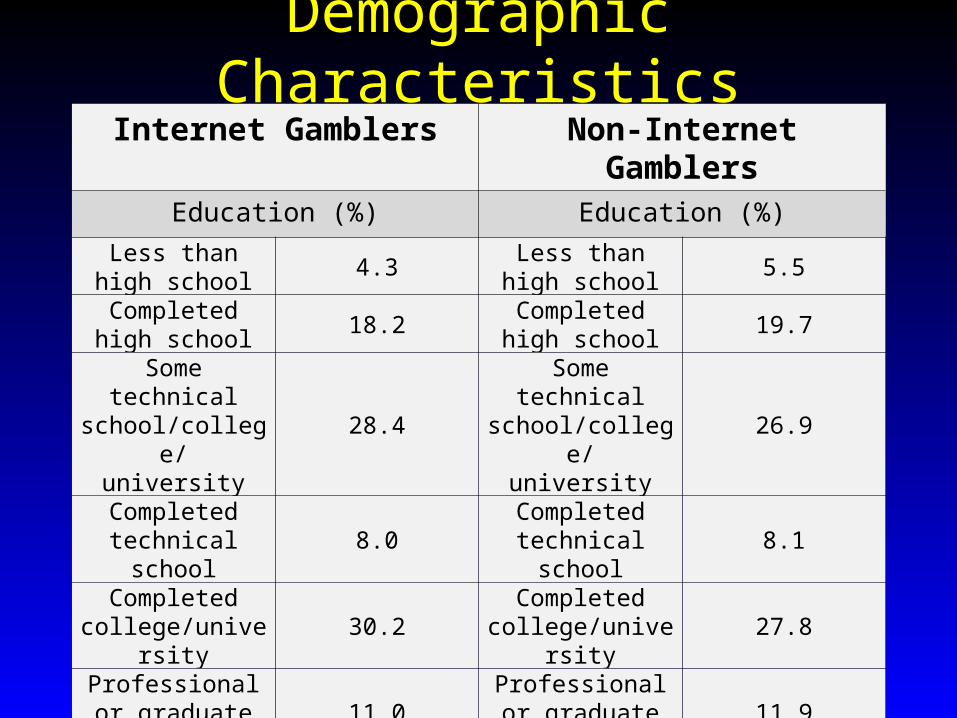
Demographic CharacteristicsInternet Gamblers Non-Internet Gamblers
Education (%) Education (%)
Less than high school
4.3Less than high
school5.5
Completed high school
18.2Completed high
school19.7
Some technical school/college/
university28.4
Some technical school/college/
university26.9
Completed technical school
8.0Completed
technical school8.1
Completed college/university
30.2Completed
college/university27.8
Professional or graduate degree
11.0Professional or graduate degree
11.9
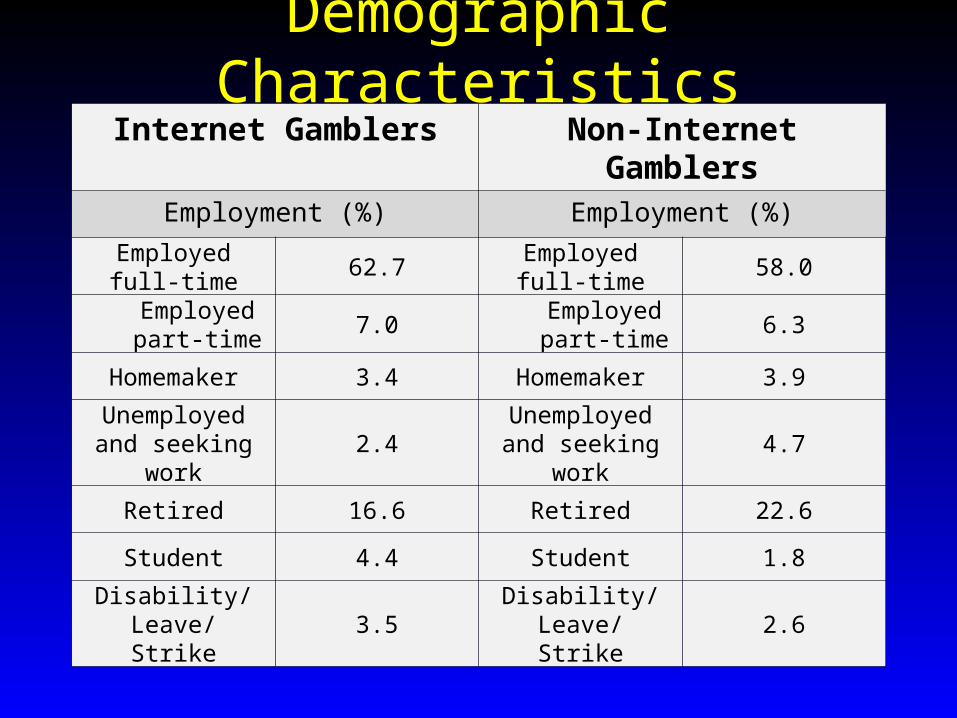
Demographic CharacteristicsInternet Gamblers Non-Internet Gamblers
Employment (%) Employment (%)
Employed full-time 62.7 Employed full-time 58.0
Employed part-time
7.0Employed part-time
6.3
Homemaker 3.4 Homemaker 3.9
Unemployed and seeking work
2.4Unemployed and
seeking work4.7
Retired 16.6 Retired 22.6
Student 4.4 Student 1.8
Disability/Leave/Strike
3.5Disability/Leave/
Strike2.6
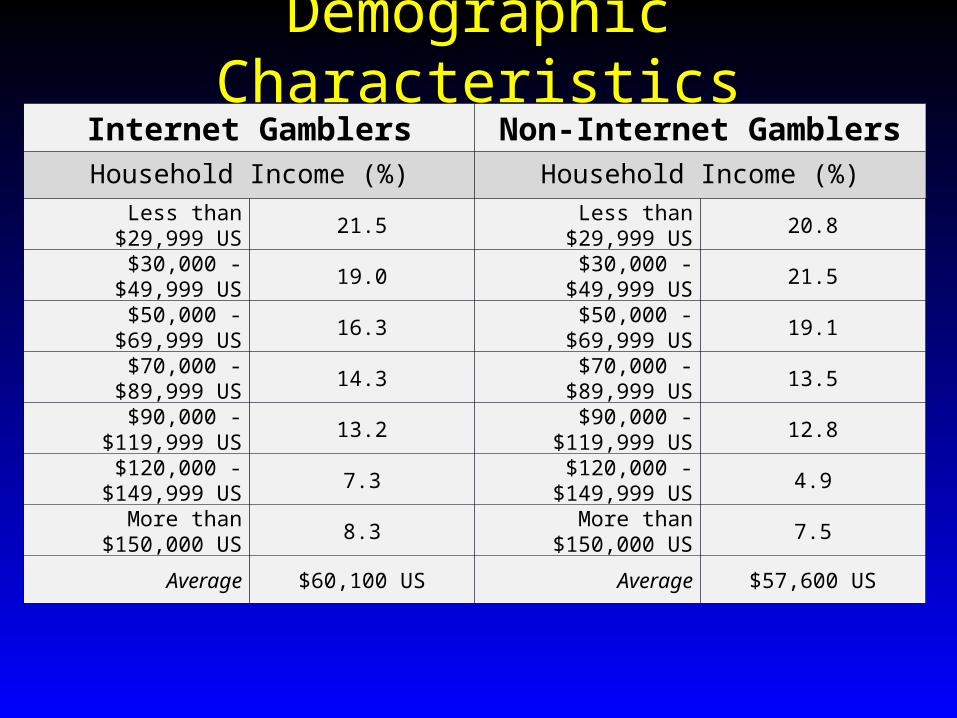
Demographic CharacteristicsInternet Gamblers Non-Internet GamblersHousehold Income (%) Household Income (%)
Less than $29,999 US 21.5 Less than $29,999 US 20.8
$30,000 - $49,999 US 19.0 $30,000 - $49,999 US 21.5
$50,000 - $69,999 US 16.3 $50,000 - $69,999 US 19.1
$70,000 - $89,999 US 14.3 $70,000 - $89,999 US 13.5
$90,000 - $119,999 US 13.2 $90,000 - $119,999 US 12.8
$120,000 - $149,999 US 7.3 $120,000 - $149,999 US 4.9
More than $150,000 US 8.3 More than $150,000 US 7.5
Average $60,100 US Average $57,600 US
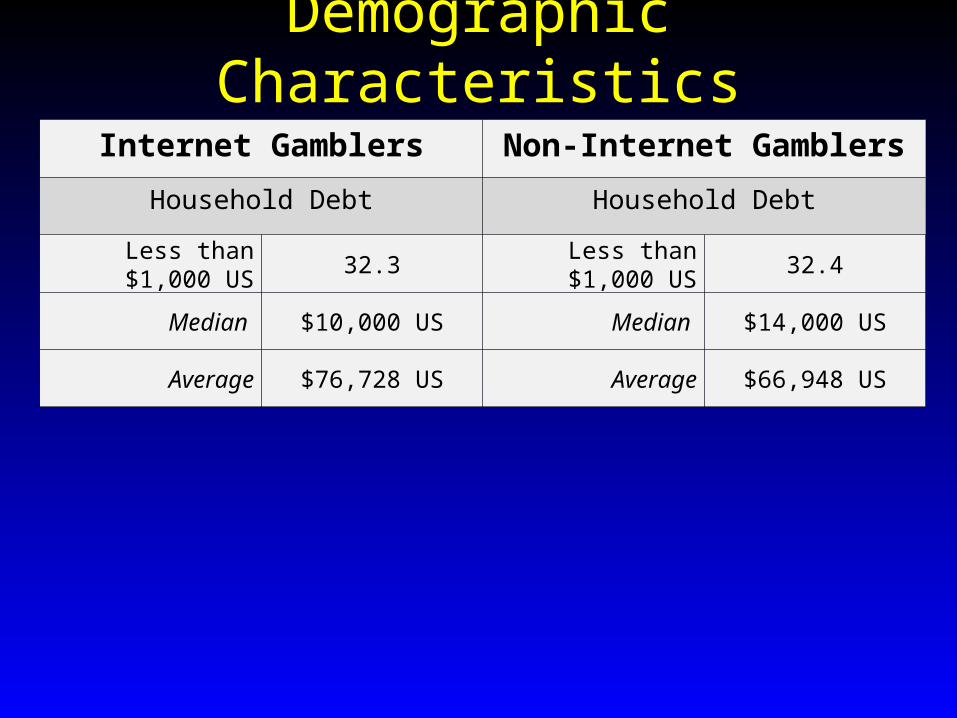
Demographic Characteristics
Internet Gamblers Non-Internet Gamblers
Household Debt Household Debt
Less than $1,000 US 32.3 Less than $1,000 US 32.4
Median $10,000 US Median $14,000 US
Average $76,728 US Average $66,948 US

Demographic CharacteristicsInternet Gamblers Non-Internet Gamblers
Ethnicity (%) Ethnicity (%)
Aboriginal, Inuit, Métis
2.1Aboriginal, Inuit,
Métis1.6
African 2.4 African 2.8
Asian (Eastern) 1.5 Asian (Eastern) 2.4
Asian (Southern) 1.0 Asian (Southern) 1.0
European (Eastern) 17.7 European (Eastern) 20.0
European (Western)
63.1European (Western)
56.4
Latin American 3.0 Latin American 2.6
Other 9.2 Other 13.1
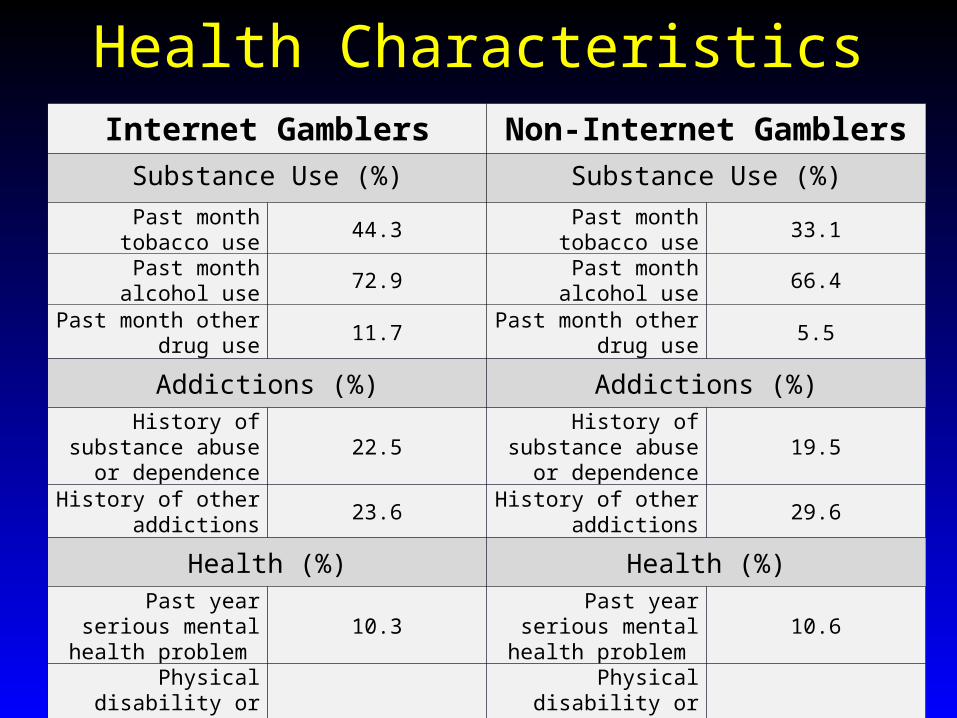
Health CharacteristicsInternet Gamblers Non-Internet Gamblers
Substance Use (%) Substance Use (%)
Past month tobacco use 44.3 Past month tobacco use 33.1
Past month alcohol use 72.9 Past month alcohol use 66.4
Past month other drug use
11.7Past month other drug
use5.5
Addictions (%) Addictions (%)History of substance abuse or dependence
22.5History of substance abuse or dependence
19.5
History of other addictions
23.6History of other
addictions29.6
Health (%) Health (%)Past year serious
mental health problem 10.3
Past year serious mental health problem
10.6
Physical disability or chronic health problem
that limits activity14.9
Physical disability or chronic health problem
that limits activity15.0
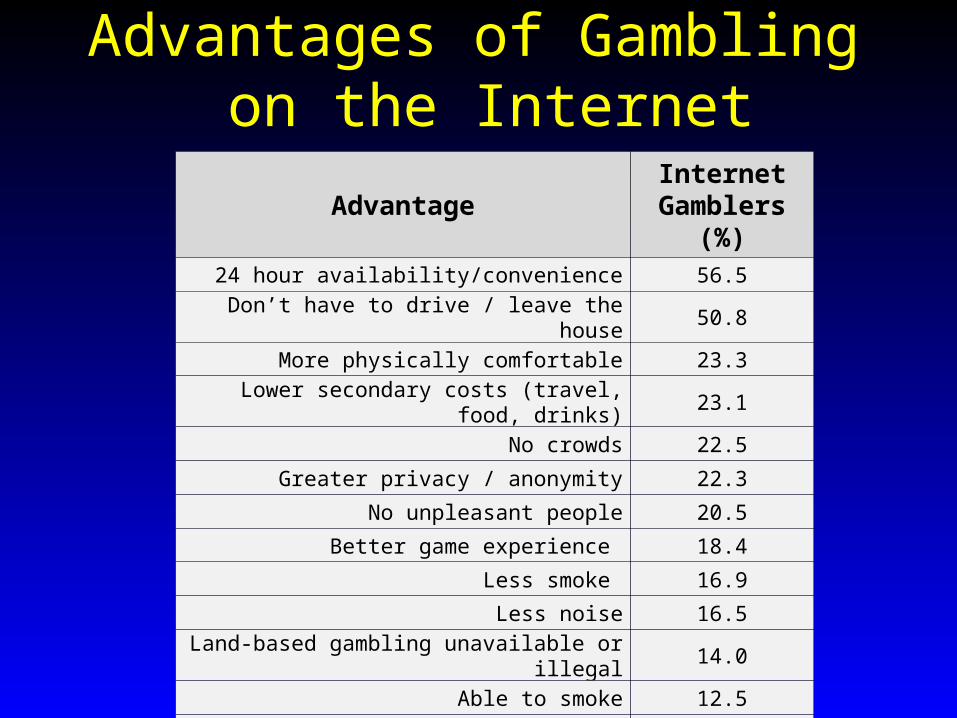
Advantages of Gambling on the Internet
AdvantageInternet
Gamblers (%)
24 hour availability/convenience 56.5
Don’t have to drive / leave the house 50.8
More physically comfortable 23.3
Lower secondary costs (travel, food, drinks) 23.1
No crowds 22.5
Greater privacy / anonymity 22.3
No unpleasant people 20.5
Better game experience 18.4
Less smoke 16.9
Less noise 16.5
Land-based gambling unavailable or illegal 14.0
Able to smoke 12.5
Higher payout rates 7.6
Other 4.3
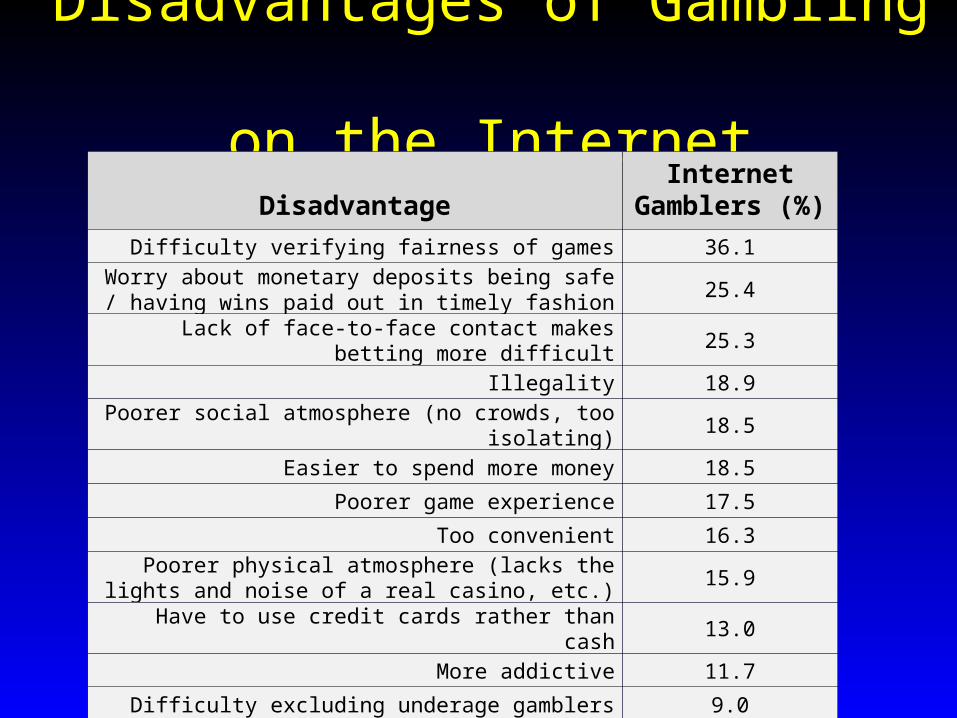
Disadvantages of Gambling on the Internet
DisadvantageInternet
Gamblers (%)
Difficulty verifying fairness of games 36.1
Worry about monetary deposits being safe / having wins paid out in timely fashion
25.4
Lack of face-to-face contact makes betting more difficult 25.3
Illegality 18.9
Poorer social atmosphere (no crowds, too isolating) 18.5
Easier to spend more money 18.5
Poorer game experience 17.5
Too convenient 16.3
Poorer physical atmosphere (lacks the lights and noise of a real casino, etc.)
15.9
Have to use credit cards rather than cash 13.0
More addictive 11.7
Difficulty excluding underage gamblers 9.0
Other 2.8

Past Year Involvement
GameInternet
Gamblers (%)
Non-Internet Gamblers
(%)
Lotteries 69.9 70.8
Instant Win 60.7 57.4
Games of Skill against other Individuals 59.3 28.6
EGMs 53.2 49.5
Casino Table Games 46.9 21.4
Sports Betting 41.6 13.6
Horse & Dog Racing 26.2 9.3
Bingo 15.7 8.4
Average Number of Games Played 4.1 2.6

Weekly Involvement
GameInternet
Gamblers (%)
Non-Internet Gamblers
(%)
Games of Skill against other Individuals 41.8 5.9
Lotteries 24.2 19.9
Sports Betting 16.3 2.7
Instant Win 13.7 10.2
EGMs 10.7 4.8
Horse & Dog Racing 6.3 0.9
Casino Table Games 5.9 1.7
Bingo 3.9 0.6
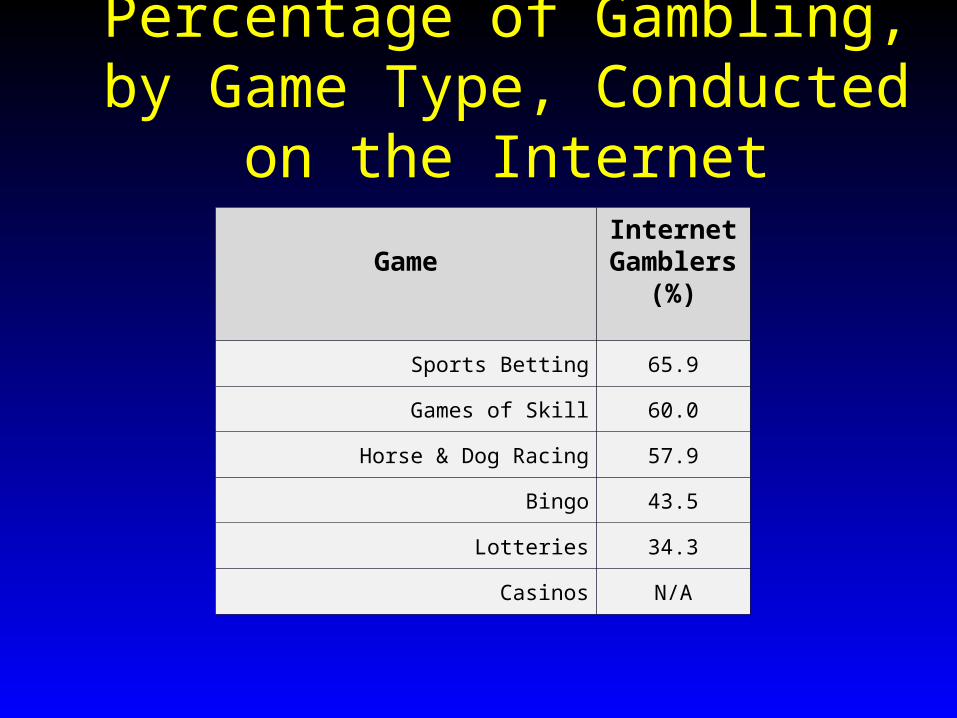
Percentage of Gambling, by Game Type, Conducted on the Internet
GameInternet
Gamblers (%)
Sports Betting 65.9
Games of Skill 60.0
Horse & Dog Racing 57.9
Bingo 43.5
Lotteries 34.3
Casinos N/A

Comparative Net Monthly Gambling Expenditures
GameInternet
GamblersNon-
Internet Gamblers
Casino table games -$113.56 -$120.53
EGMs -$94.37 -$70.55
Sports betting -$39.47 -$14.45
Horse and dog racing -$35.71 -$24.69
Games of skill (includes poker) -$35.21 +$9.13
Bingo -$30.57 -$20.78
Lottery ticket purchases -$28.05 -$13.48
Instant win tickets -$13.22 -$8.17
Total Expenditure Average -$195.14 -$70.93
Total Expenditure Median -$80.00 -$19.26

Rates of Problem Gambling
CPGI CategoryInternet
Gamblers (%)
Non-Internet
Gamblers (%)
Non-problem gambler 39.9 82.1
At-risk gambler 43.4 12.3
Moderate problem gambler 12.8 4.0
Severe problem gambler 3.8 1.7
Average CPGI score 1.80 .52

Types of Gambling Perceived to Contribute Most to Problem
GameInternet Problem
Gamblers (%)
Non-Internet Problem
Gamblers (%)
Slot Machines 23.8 58.5Poker 21.7 3.8
Internet Gambling 11.3 0Blackjack 8.7 5.7
Roulette 7.0 7.5Instant Win Tickets 5.2 3.8Horse/Dog Racing 4.3 0High Risk Stocks 3.5 1.9
Lotteries 2.6 3.8Games of skill against other people 1.7 0
Video Lottery Terminals 0.9 3.8Bingo 0.9 3.8
Baccarat 0.9 2.9Electronic Keno 1.7 1.9
Other 6.1 3.8

Help Seeking for Problem Gambling
Internet Gamblers
(%)
Non-Internet Gamblers
(%)Ever sought help for problems?
Yes 9.4 5.0No 90.6 95.0
Where did you seek help from?Gamblers Anonymous 21.4 75.0
Counseling Service 17.9 0Friends 10.7 25.0
Psychologist 10.7 0Psychiatrist 10.7 0
Family Doctor 7.1 0Family 7.1 0
Pastor/Minister/Priest 7.1 0Telephone help/hot line 7.1 0
If you were to seek help where would you be most comfortable seeking it from?
Face-to-face counseling 70.2 65.4Internet counseling 29.8 34.6

Logistic Regression Characteristics statistically differentiating Internet gamblers
from non-Internet gamblers.o A test of the full model with all 22 predictors against a constant-only
model was statistically significant, χ2 (40) = 3223.6, p < .0001.o Variance accounted for was moderate, with Nagelkerke
R squared = 33.4%.o Overall prediction success was 72.8%, with 71.0% of Non-Internet
Gamblers correctly classified, and 74.5% of Internet Gamblers correctly classified.

Significant Predictors of Internet Gambling
• Greater number of gambling formats.
• Higher CPGI score
• Male gender.
• Living in Hungary, United Kingdom, Italy, Canada, Switzerland, or Costa Rica
• Tobacco use.
• Fewer gambling fallacies.
• Being employed.
• Younger age.
• More positive attitudes toward gambling.
• Higher gambling expenditure.
• Not being Asian.
• Never married (single).
• Alcohol use.
• Illicit drug use.
• Higher household income.
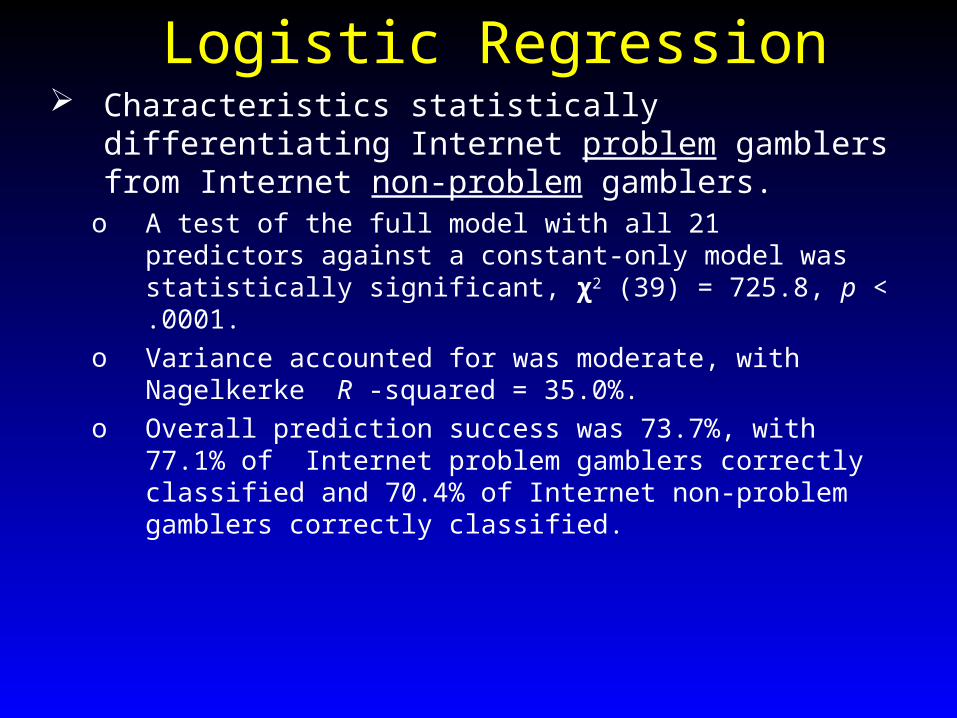
Logistic Regression Characteristics statistically differentiating Internet problem
gamblers from Internet non-problem gamblers.o A test of the full model with all 21 predictors against a constant-only
model was statistically significant, χ2 (39) = 725.8, p < .0001.o Variance accounted for was moderate, with Nagelkerke R -squared =
35.0%.o Overall prediction success was 73.7%, with 77.1% of Internet
problem gamblers correctly classified and 70.4% of Internet non-problem gamblers correctly classified.

Significant Predictors of Internet Problem Gambling
• Gambling on a greater number of gambling formats.
• Higher gambling expenditure.
• Having mental health problems.
• Family history of problem gambling.
• Asian ancestry.
• Single (never married).
• Lower household income.
• More gambling fallacies.
• Negative attitudes toward gambling.
• History of other addictions.
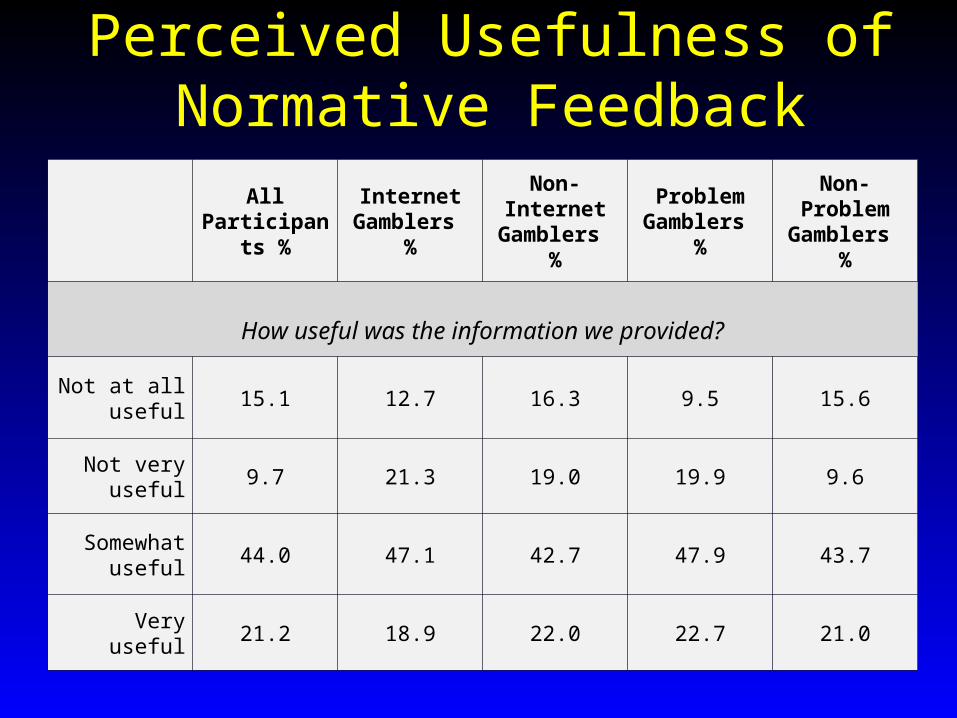
Perceived Usefulness of Normative FeedbackAll
Participants %
Internet Gamblers
%
Non-Internet Gamblers
%
Problem Gamblers
%
Non-Problem Gamblers
%
How useful was the information we provided?
Not at all useful
15.1 12.7 16.3 9.5 15.6
Not very useful
9.7 21.3 19.0 19.9 9.6
Somewhat useful
44.0 47.1 42.7 47.9 43.7
Very useful 21.2 18.9 22.0 22.7 21.0
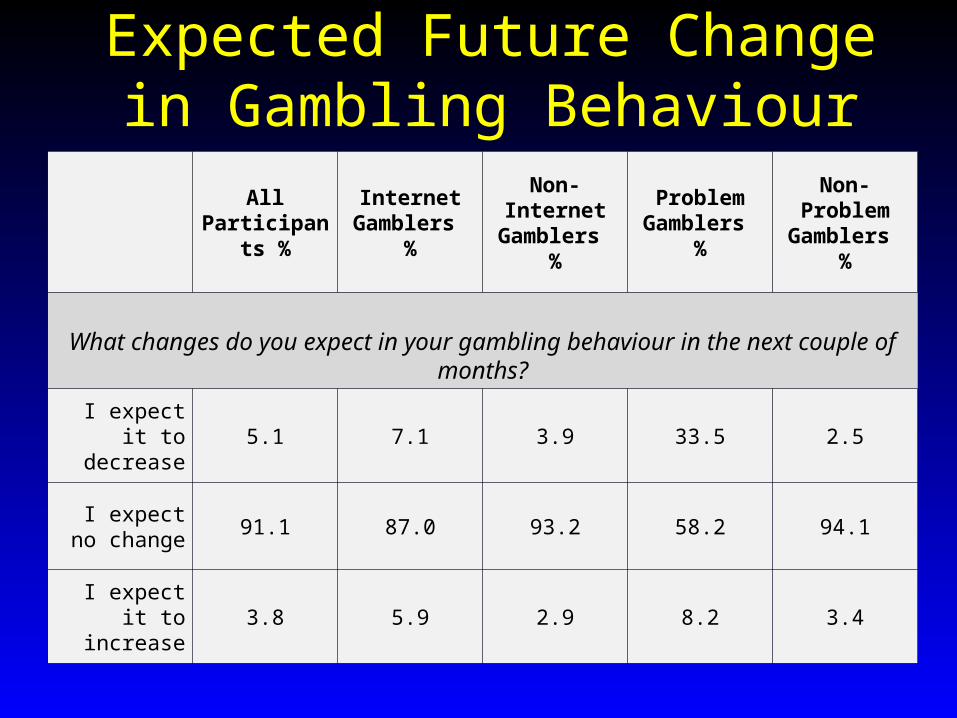
Expected Future Change in Gambling BehaviourAll
Participants %
Internet Gamblers
%
Non-Internet Gamblers
%
Problem Gamblers
%
Non-Problem Gamblers
%
What changes do you expect in your gambling behaviour in the next couple of months?
I expect it to decrease
5.1 7.1 3.9 33.5 2.5
I expect no change
91.1 87.0 93.2 58.2 94.1
I expect it to increase
3.8 5.9 2.9 8.2 3.4
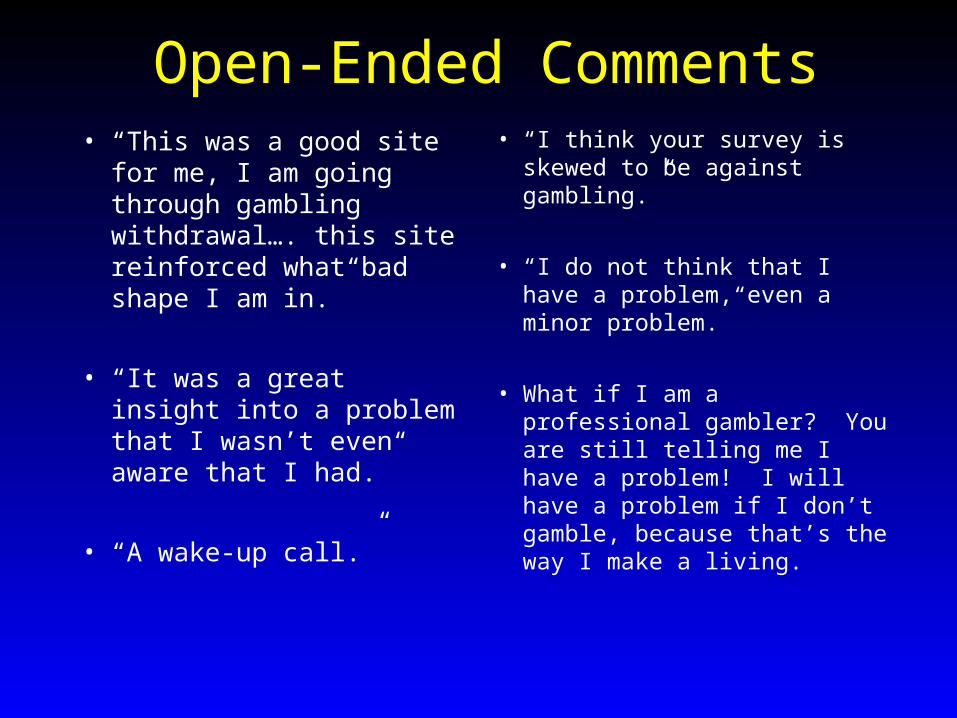
Open-Ended Comments• “This was a good site for
me, I am going through gambling withdrawal…. this site reinforced what bad shape I am in.”
• “It was a great insight into a problem that I wasn’t even aware that I had.”
• “A wake-up call.”
• “I think your survey is skewed to be against gambling.”
• “I do not think that I have a problem, even a minor problem.”
• What if I am a professional gambler? You are still telling me I have a problem! I will have a problem if I don’t gamble, because that’s the way I make a living.
Recent Relevant Publications1. Wood, Robert T. and Robert J. Williams. (2009). Internet Gambling:
Prevalence, Patterns, Problems, and Policy Options. Final research report prepared for the Ontario Problem Gambling Research Centre. http://www.gamblingresearch.org/contentdetail.sz?cid=2973&pageid=1813&r=s
2. Wood, Robert T. and Robert J. Williams. (2007). “Problem Gambling on the Internet: Implications for Internet Gambling Policy in North America.” New Media & Society, 9(3):169-191.
3. Wood, Robert T, Robert J. Williams, Paul K. Lawton. (2007). “Why Do Internet Gamblers Prefer Online Versus Land-Based Venues? Some Preliminary Findings and Implications.” Journal of Gambling Issues, 20: 235-252.
4. Wood, Robert T. & Robert J. Williams (2007). "Internet Gambling: Past, Present, and Future." In Gary Smith, David Hodgins & Robert Williams (eds.), Research and Measurement Issues in Gambling Studies (pp. 491-514). Toronto: Elsevier Publishing.

Researcher Contact Info:
• Dr. Robert Wood
Department of Sociology
Phone: (403) 329-5137
Email: [email protected]
• Dr. Robert Williams
School of Health Sciences
Phone: (403) 382-7128
Email: [email protected]
University of Lethbridge4401 University Drive
Lethbridge, ABT1K 3M4, Canada