HOUSING STRATEGY AND ENERGY EFFICIENCY Kieran Gallagher Deputy City Architect February 2011.
Upload
candice-williamsCategory
view
214download
0
International Technology Transfer in China’s Auto Industry: Implications for
Future Energy Development
Kelly Sims Gallagher, Ph.D.Energy Technology Innovation ProjectBelfer Center for Science and International AffairsJohn F. Kennedy School of GovernmentHarvard University

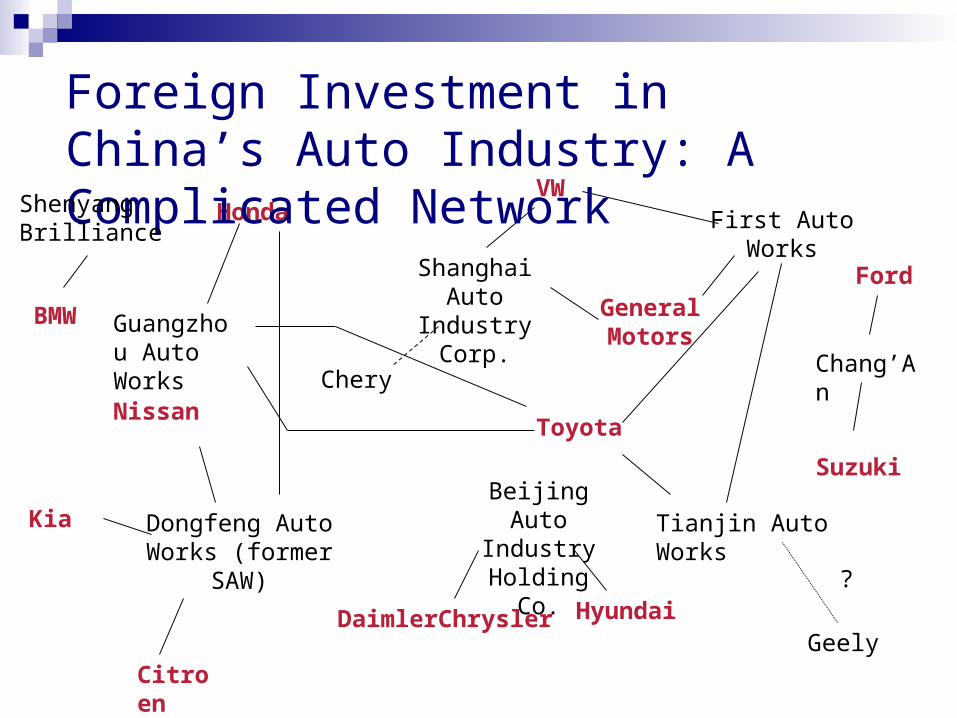
Shanghai Auto Industry
Corp.
First Auto Works
Tianjin Auto Works
Guangzhou Auto Works
Dongfeng Auto Works (former
SAW)
Beijing Auto Industry
Holding Co.
General Motors
VW
Toyota
DaimlerChrysler Hyundai
Nissan
Honda
Geely
CheryChang’An
Ford
Citroen
Suzuki
Foreign Investment in China’s Auto Industry: A Complicated Network
?
Shenyang Brilliance
BMW
Kia

The Sino-U.S. Joint Ventures
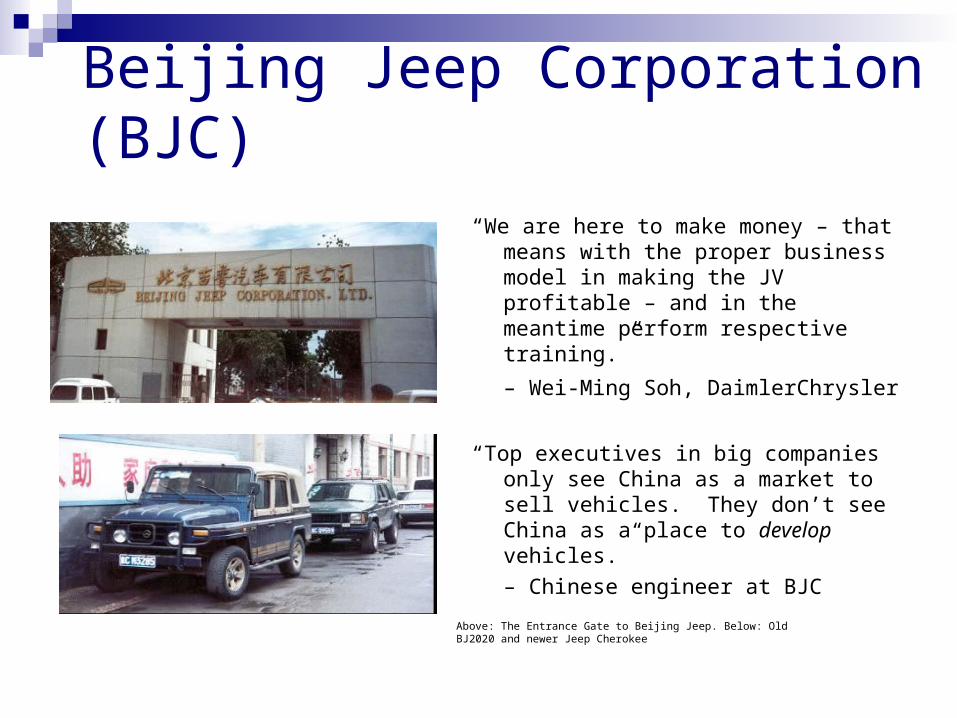
Beijing Jeep Corporation (BJC)
“We are here to make money – that means with the proper business model in making the JV profitable – and in the meantime perform respective training.”
– Wei-Ming Soh, DaimlerChrysler
“Top executives in big companies only see China as a market to sell vehicles. They don’t see China as a place to develop vehicles.”
– Chinese engineer at BJC
Above: The Entrance Gate to Beijing Jeep. Below: Old BJ2020 and newer Jeep Cherokee
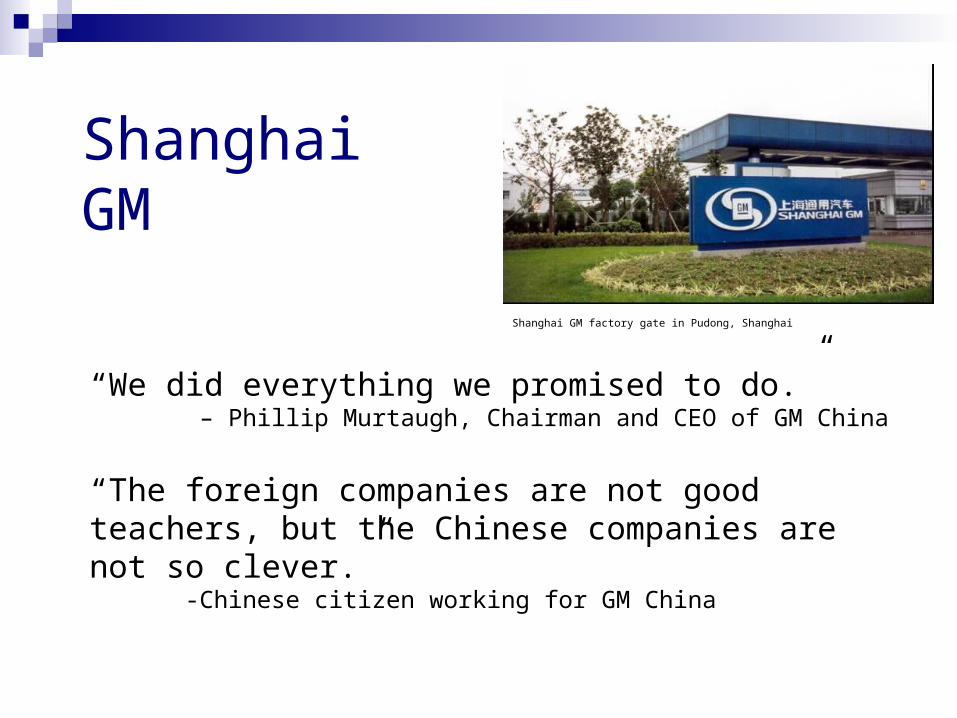
Shanghai GM
“We did everything we promised to do.” – Phillip Murtaugh, Chairman and CEO of GM China
“The foreign companies are not good teachers, but the Chinese companies are not so clever.”
-Chinese citizen working for GM China
Shanghai GM factory gate in Pudong, Shanghai
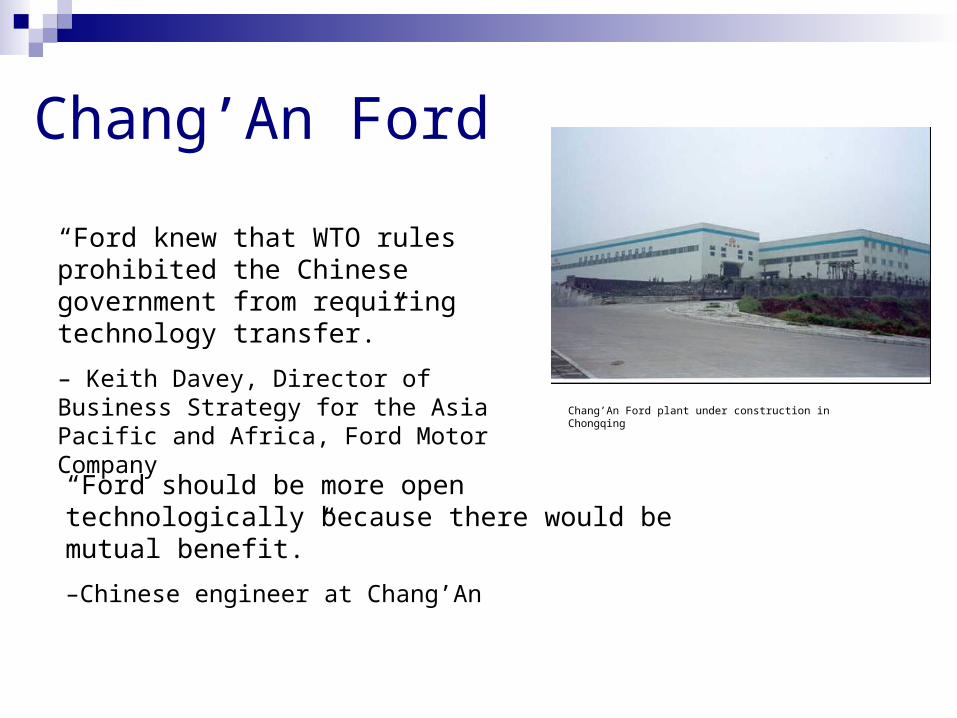
Chang’An Ford
“Ford knew that WTO rules prohibited the Chinese government from requiring technology transfer.”
– Keith Davey, Director of Business Strategy for the Asia Pacific and Africa, Ford Motor Company
“Ford should be more open technologically because there would be mutual benefit.”
–Chinese engineer at Chang’An
Chang’An Ford plant under construction in Chongqing
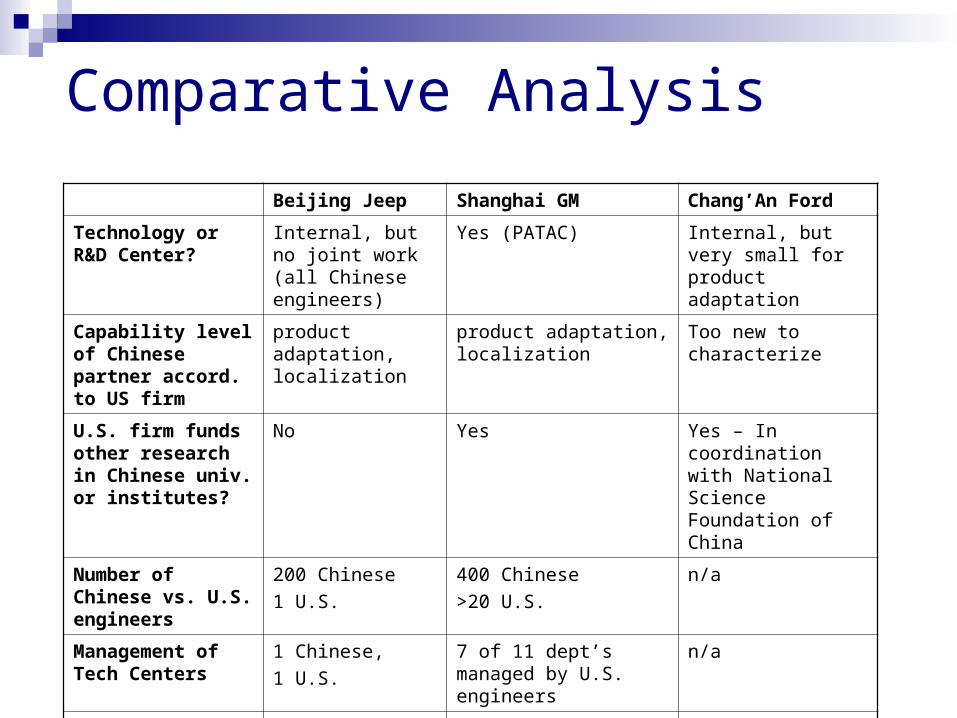
Comparative Analysis
Beijing Jeep Shanghai GM Chang’An Ford
Technology or R&D Center?
Internal, but no joint work (all Chinese engineers)
Yes (PATAC) Internal, but very small for product adaptation
Capability level of Chinese partner accord. to US firm
product adaptation, localization
product adaptation, localization
Too new to characterize
U.S. firm funds other research in Chinese univ. or institutes?
No Yes Yes – In coordination with National Science Foundation of China
Number of Chinese vs. U.S. engineers
200 Chinese
1 U.S.
400 Chinese
>20 U.S.
n/a
Management of Tech Centers
1 Chinese,
1 U.S.
7 of 11 dept’s managed by U.S. engineers
n/a
Funding 30,000 RMB per year ($3,600)
For PATAC, GM put $25 million in cash and SAIC put $22 million (“in kind”)
n/a
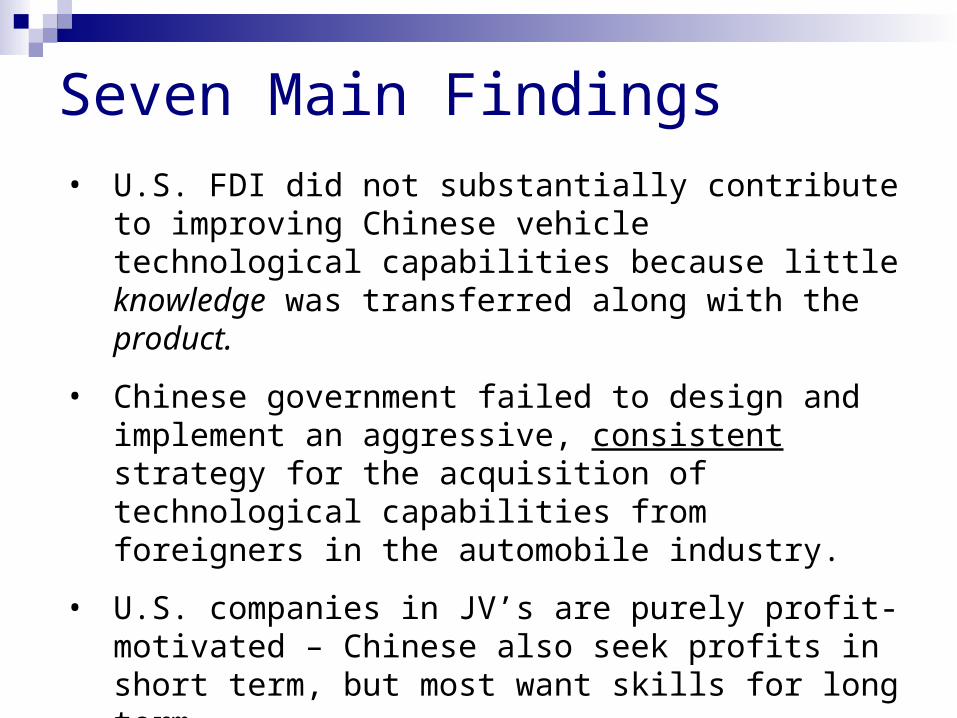
Seven Main Findings• U.S. FDI did not substantially contribute to improving
Chinese vehicle technological capabilities because little knowledge was transferred along with the product.
• Chinese government failed to design and implement an aggressive, consistent strategy for the acquisition of technological capabilities from foreigners in the automobile industry.
• U.S. companies in JV’s are purely profit-motivated – Chinese also seek profits in short term, but most want skills for long term.
Findings (cont.)• Chinese firms have acquired good manufacturing skills
and also acquired some product adaptation capabilities. Parts suppliers appear to have more advanced capabilities due to local content requirements.
• Technologies that were transferred by U.S. firms in the period studied were rarely, if ever, updated once a model was in production, with the emerging exception of SGM. This is now changing due to competitiveness.
• Even though technology transfer was purely product, the FDI has contributed to the growth of the industry, which has benefited the Chinese economy in terms of jobs and spillovers.
• U.S. firms did not transfer pollution-control technology until required to do so by the Chinese government.

Remaining Challenges Fuel quality Rate of deployment of advanced technologies (and rate
of growth of sales of passenger cars) Economic growth pressures, and role of auto industry Lack of incentives for foreign companies to transfer
cleaner technologies other than Chinese policy, which is weak
Lack of Chinese technological capabilities to design and manufacture clean technologies themselves
Still relatively weak fuel efficiency standards
Remaining Opportunities
The next 50-100 million cars in China Alternative transportation and modes of mobility
Limits to Leapfrogging?
Huge opportunity to “leapfrog” due to existing small base and rapid growth. . . but, opportunity is being missed. Why?
The combined short-term motivation of producing and selling cars is the main common incentive for technology transfer today
There are fairly different incentives for technology transfer on either side of the joint ventures
Thank You
We gratefully acknowledge general support from:Energy Foundation, William & Flora Hewlett Foundation, David & Lucile Packard Foundation, Shell Exploration & Production, Winslow Foundation
For in-use vehicle emissions testing project:U.S. EPA, Energy Foundation China Sustainable Energy Program, Ford China, Ford Asia Pacific, and GM China
Research Questions1. What role has U.S foreign direct investment played
in the development of the Chinese auto industry?
2. Have the U.S. auto firms helped to deploy cleaner or more advanced technology in China?
3. What have been the most important barriers to technology transfer from the U.S. to China in the auto sector and why? What have been the best incentives for technology transfer?
4. What special barriers or incentives will exist for cleaner technology transfer for automobiles, if any?

Methodology• Case study approach: 1984-2002• Interviews with dozens of officials in the joint venture
companies and their parent companies in both the U.S. and China
• Visits to offices, factories, and research facilities in Shanghai, Chongqing, Beijing and Tianjin
• Interviews with numerous government officials in U.S. and China; company public materials and some internal documents
• Academic literature and secondary sources (news media, wire services, magazines)
• Quantitative analysis using data from CATARC
Auto Industry in Chinese Economy
1.6 million Chinese were directly employed by this industry as of 2003 (not counting the employees of industries that supply the auto industry (i.e. steel, rubber), which are estimated at approximately 36.4 million workers). Auto industry is 3 percent of total manufacturing employment.
The value added by the Chinese auto industry represented 6.3% of the total value added of manufacturing in China in 2003, a tripling of this percentage from its level in 1990 (CATARC 2004).
History of Chinese Auto Industry
• Little to no manufacturing experience prior to WWII• Tech transfer from Soviets before Sino-Soviet split in 1960• After Cultural Revolution, no technological capabilities in this sector• Decision to “make or buy” – forced to buy because of weak
technological capabilities• Formation of many joint ventures with foreign firms and licensing of
technology from them as well, but without formal industrial policy• 1994 Auto Industry Policy – intention to create national industry• Consolidation of industry, but currently 118 manufacturers; all the
major ones have formed joint ventures with foreign auto companies• Joining WTO in 2001 effectively reversed many previous policies, but
increased competition• 2004 Auto Industry Policy – auto industry as “pillar” industry; create
better technological capabilities and consolidate industry

Chinese Automakers
Currently 116 automakers in China Vast majority of output comes from the firms that
have formed joint ventures with foreign companies (quasi-exceptions are Chery and Geely)
High profitability Skills in manufacturing, parts and components,
and business development Weak design and innovation capabilities,
especially for advanced engines and system integration
Terms of WTO for Chinese Auto Industry
• Import tariffs for complete vehicles are to be reduced from the current 80 to 100 percent to 25 percent by July 1, 2006
• Import tariffs for parts and components are to be reduced from 35 percent to 10 percent by the same date
• Import quotas on vehicles will be decreased 15 percent per year until they are cancelled in 2005
• Import licenses will also be phased out by 2005. • Majority ownership limits on foreign manufacturers for engines will
also be eliminated • Also, provincial governments will be given the authority to approve
foreign direct investment projects up to $150 million by 2005 (used to be $30 million)
• All of the Chinese government’s requirements regarding technology transfer, maintaining a foreign exchange balance, maintaining a trade balance, and meeting localization standards were eliminated upon China’s entry to the WTO in 2001.
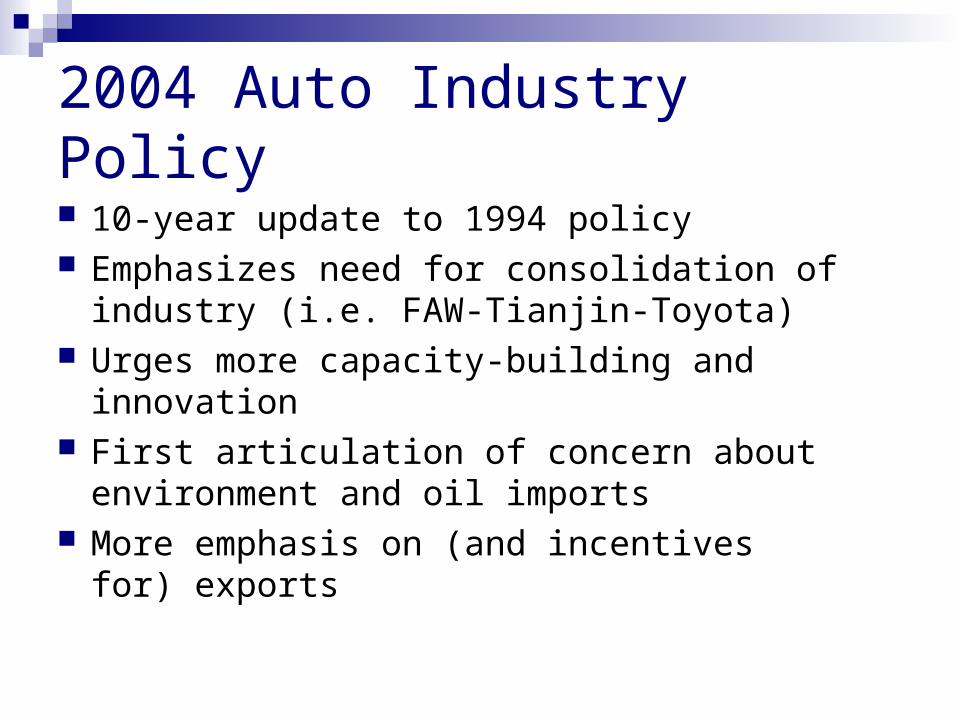
2004 Auto Industry Policy
10-year update to 1994 policy Emphasizes need for consolidation of
industry (i.e. FAW-Tianjin-Toyota) Urges more capacity-building and innovation First articulation of concern about
environment and oil imports More emphasis on (and incentives for)
exports
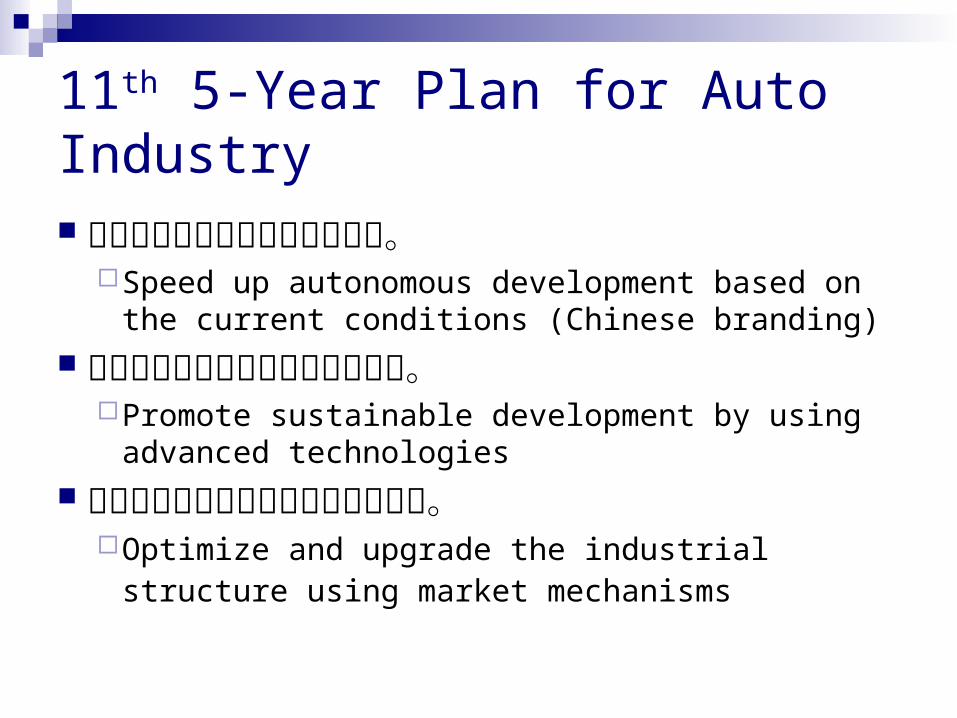
11th 5-Year Plan for Auto Industry
依托现有基础加快产业自主发展。Speed up autonomous development based on the
current conditions (Chinese branding)依靠技术进步推动产业可持续发展。
Promote sustainable development by using advanced technologies
利用市场机制促进产业结构优化升级。Optimize and upgrade the industrial structure using
market mechanisms

Background Data
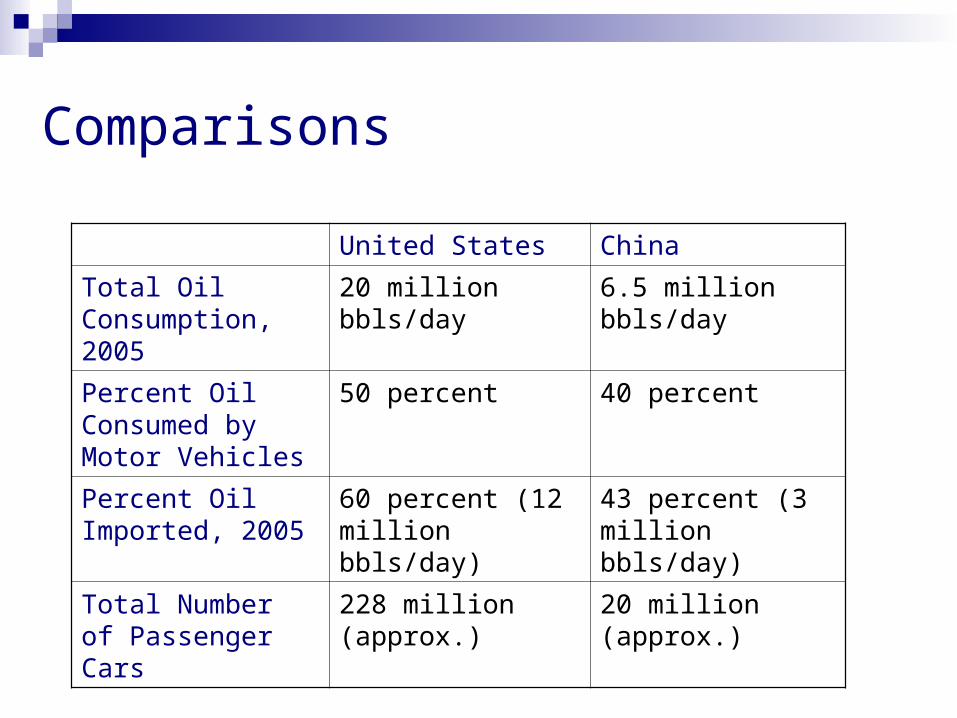
Comparisons
United States China
Total Oil Consumption, 2005
20 million bbls/day 6.5 million bbls/day
Percent Oil Consumed by Motor Vehicles
50 percent 40 percent
Percent Oil Imported, 2005
60 percent (12 million bbls/day)
43 percent (3 million bbls/day)
Total Number of Passenger Cars
228 million (approx.) 20 million (approx.)
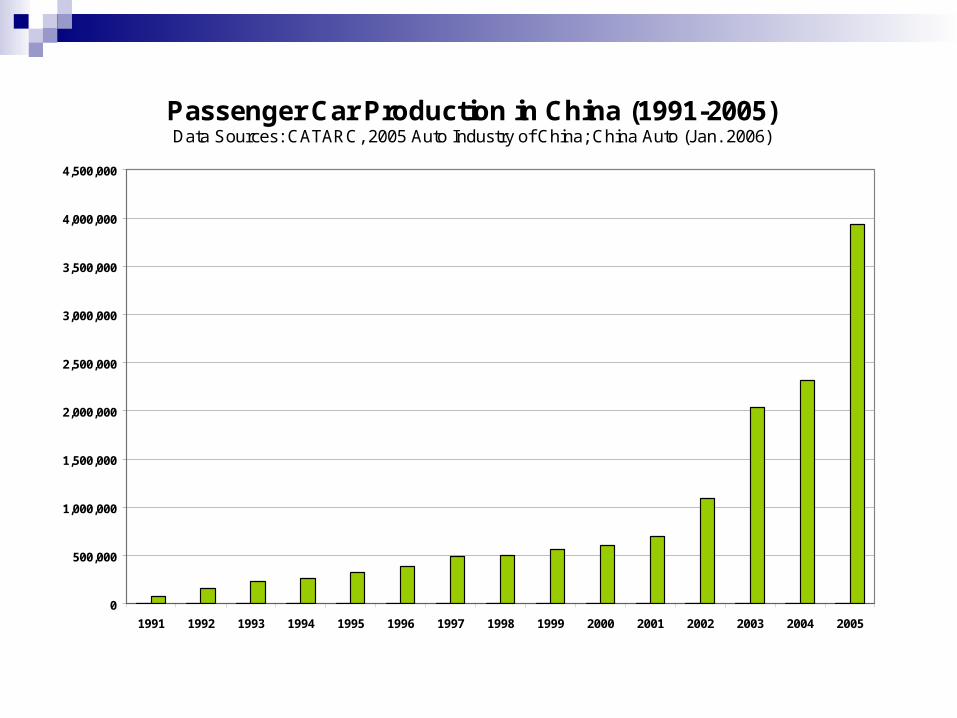
Passenger Car Production in China (1991-2005)Data Sources: CATARC, 2005 Auto Industry of China; China Auto (Jan. 2006)
0
500,000
1,000,000
1,500,000
2,000,000
2,500,000
3,000,000
3,500,000
4,000,000
4,500,000
1991 1992 1993 1994 1995 1996 1997 1998 1999 2000 2001 2002 2003 2004 2005
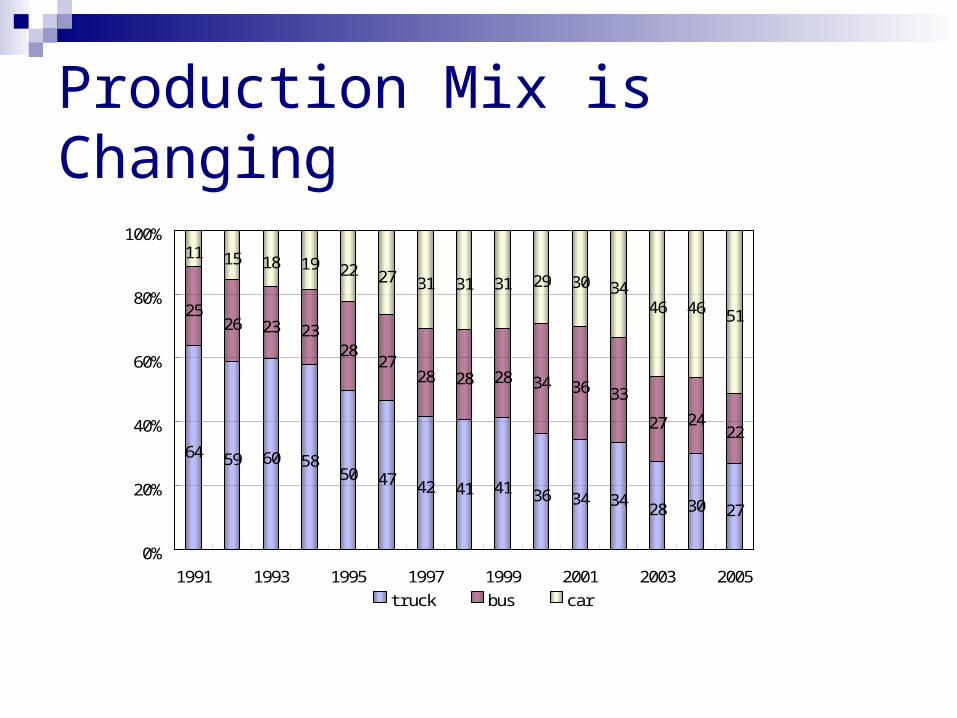
Production Mix is Changing
64 59 60 5850 47 42 41 41 36 34 34 28 30 27
2526 23 23
2827
28 28 28 34 36 33
27 2422
11 15 18 19 22 27 31 31 31 29 30 3446 46 51
0%
20%
40%
60%
80%
100%
1991 1993 1995 1997 1999 2001 2003 2005truck bus car
Source: CATARC, 2006
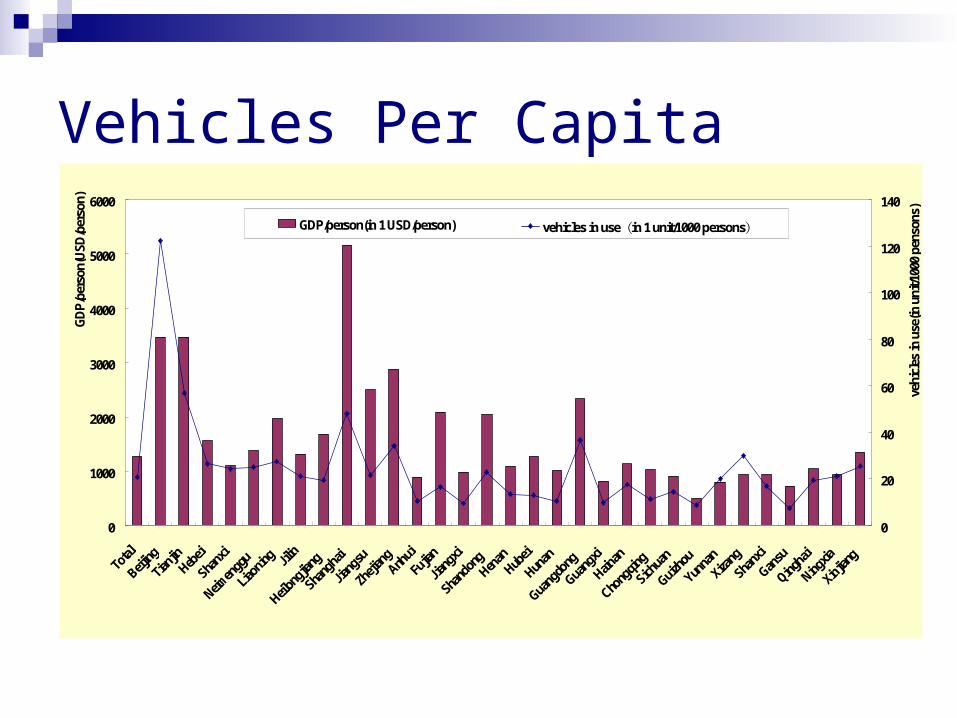
Vehicles Per Capita
0
1000
2000
3000
4000
5000
6000
Total
Beijing
Tianji
nHeb
ei
Shan
xi
Neimen
ggu
Liaon
ing Jilin
Heilon
gjian
g
Shan
ghai
Jiang
su
Zheji
angAnh
ui
Fujia
n
Jiang
xi
Shan
dong
Henan
Hubei
Hunan
Guang
dong
Guang
xi
Hainan
Chong
qing
Sichu
an
Guizho
u
Yunn
an
Xizan
g
Shan
xi
Gansu
Qingha
i
Ningxia
Xinjia
ng
GD
P/p
erso
n(U
SD
/per
son)
0
20
40
60
80
100
120
140
vehi
cles
in u
se(in
uni
t/100
0 pe
nson
s)
GDP/person(in 1 USD/person) vehicles in use(in 1 unit/1000 persons)
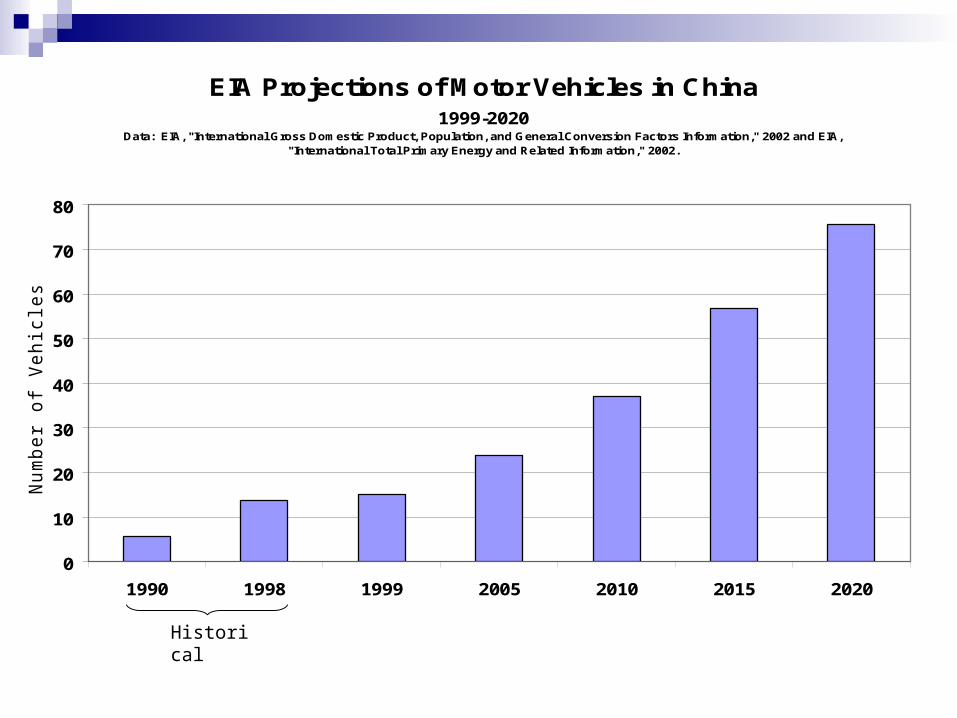
EIA Projections of Motor Vehicles in China 1999-2020
Data: EIA, "International Gross Domestic Product, Population, and General Conversion Factors Information," 2002 and EIA, "International Total Primary Energy and Related Information," 2002.
0
10
20
30
40
50
60
70
80
1990 1998 1999 2005 2010 2015 2020
Nu
mb
er
of
Ve
hic
les (
mill
ion
s)
Historical
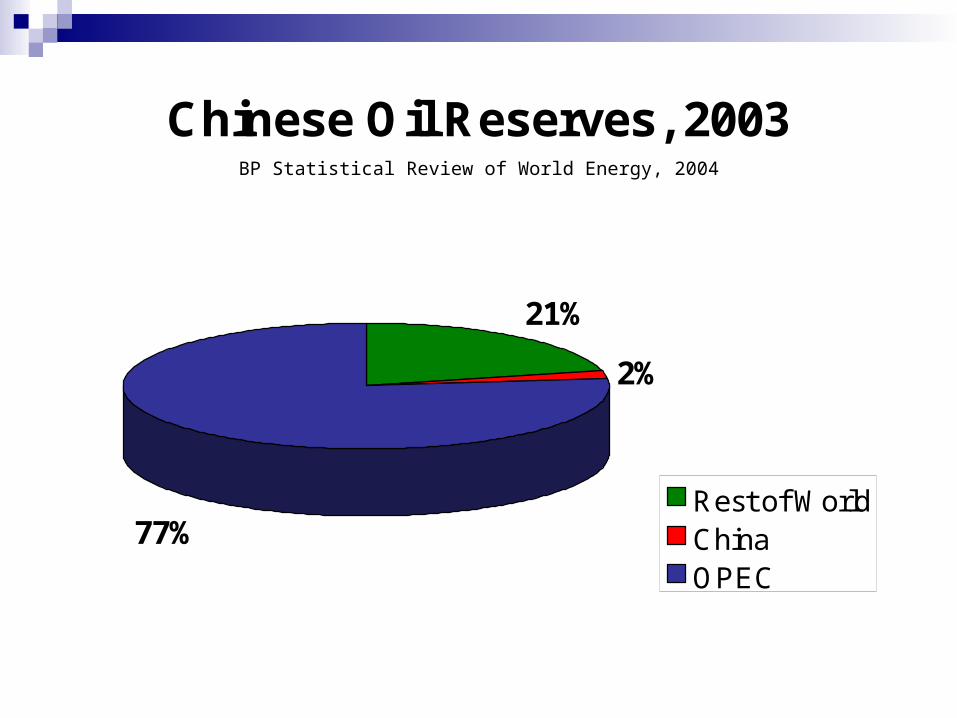
Chinese Oil Reserves, 2003
21%
2%
77%Rest of WorldChinaOPEC
BP Statistical Review of World Energy, 2004

Oil Imports
China became the second-largest consumer of oil in the world in 2004
China now imports about 3.5 million bbl/day China is now the third-largest oil importer after the United States
and Japan. Crude oil import growth has been about 0.5 million bbls/day in
recent years. More than half of China’s oil comes from Middle East According to the Economist Intelligence Unit, imported
petroleum (and related products) cost China US$44.5 billion in 2004, making petroleum-related imports the second-largest category of import behind electrical machinery (EIU DataServices March, 2005)
$15 billion spent over the past five years to acquire more than 100 foreign oil fields and companies (McKinsey Quarterly 2006)

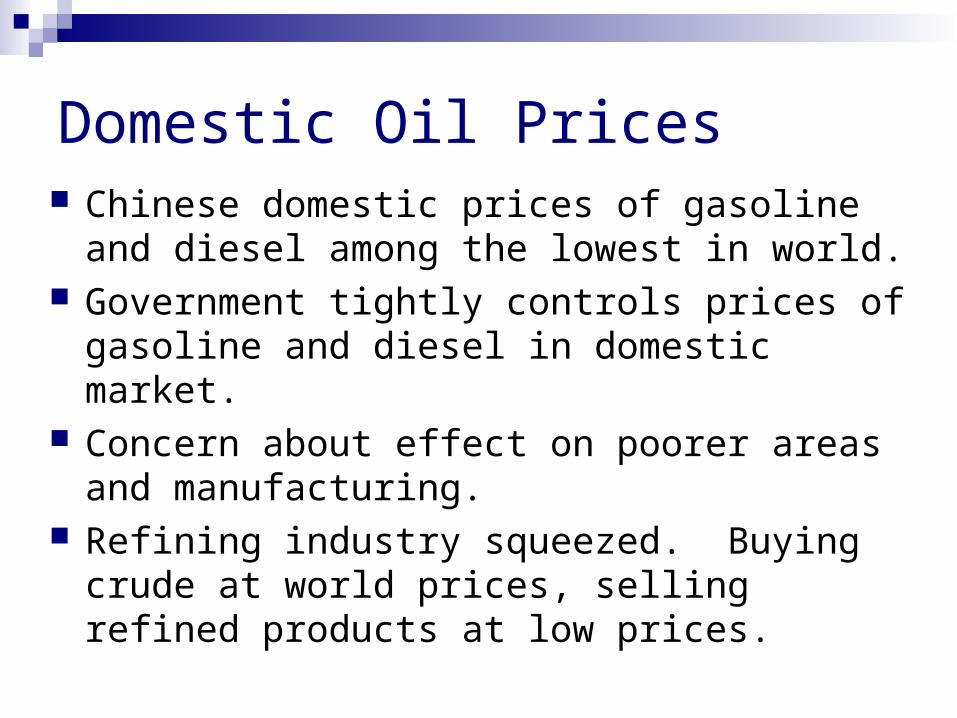
Domestic Oil Prices Chinese domestic prices of gasoline and diesel
among the lowest in world. Government tightly controls prices of gasoline
and diesel in domestic market. Concern about effect on poorer areas and
manufacturing. Refining industry squeezed. Buying crude at
world prices, selling refined products at low prices.
6
8
10
12
14
16
750 1000 1250 1500 1750 2000 2250 2500
Vehicle Test Weight (lbs)
L/1
00
km
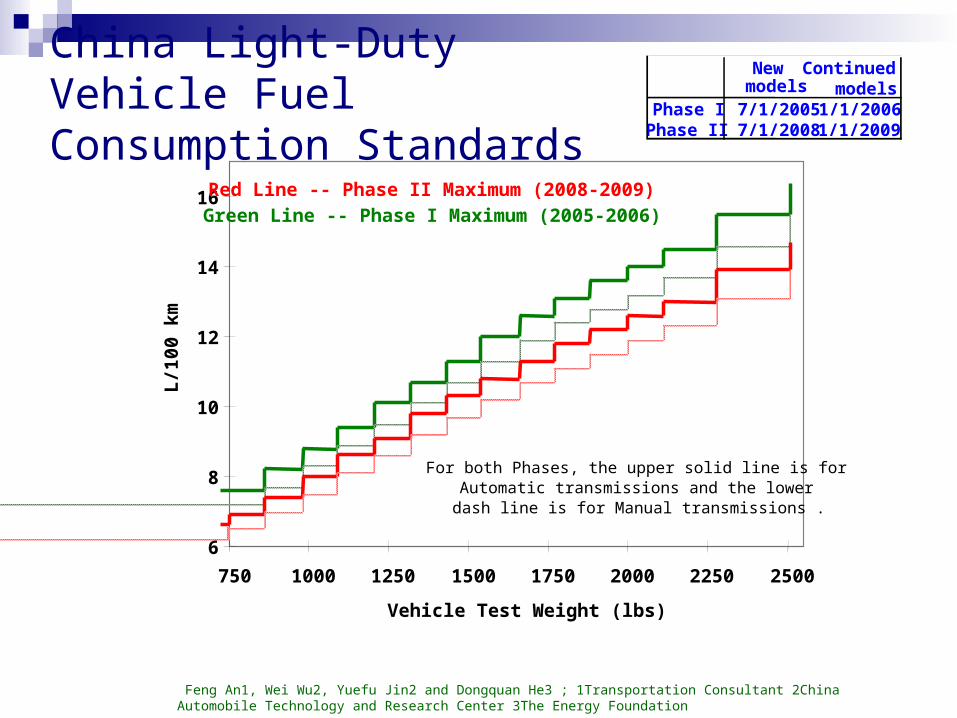
Red Line -- Phase II Maximum (2008-2009)Green Line -- Phase I Maximum (2005-2006)
For both Phases, the upper solid line is for Automatic transmissions and the lower dash line is for Manual transmissions .
New Continued models models
Phase I 7/1/2005 1/1/2006Phase II 7/1/2008 1/1/2009
China Light-Duty Vehicle Fuel Consumption Standards
Feng An1, Wei Wu2, Yuefu Jin2 and Dongquan He3 ; 1Transportation Consultant 2China Automobile Technology and Research Center 3The Energy Foundation
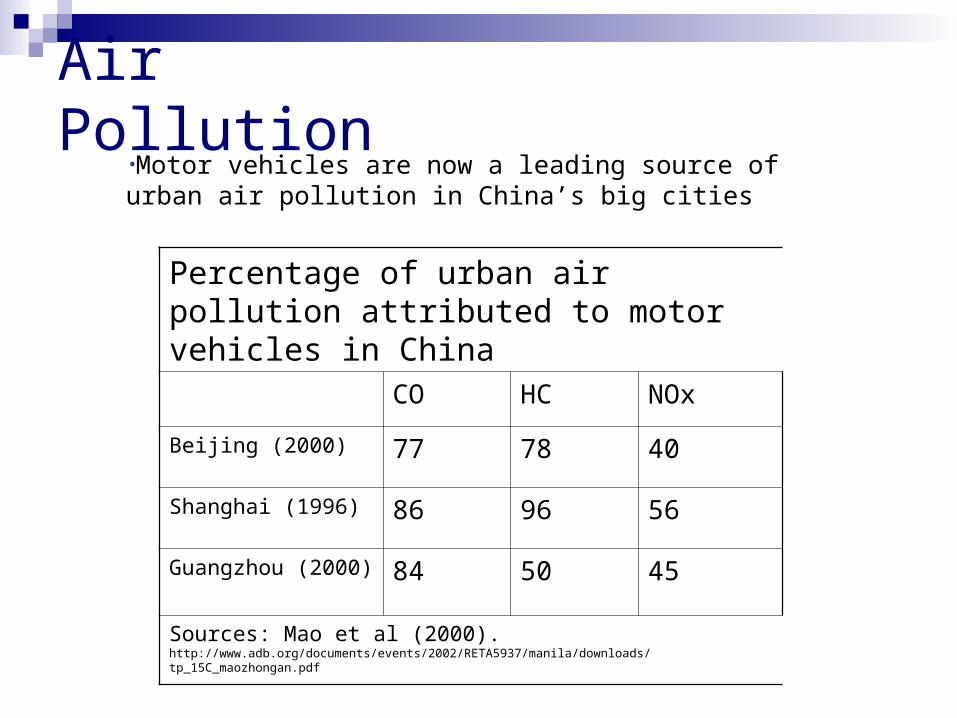
Air Pollution•Motor vehicles are now a leading source of urban air pollution in China’s big cities
Percentage of urban air pollution attributed to motor vehicles in China
CO HC NOx
Beijing (2000) 77 78 40
Shanghai (1996) 86 96 56
Guangzhou (2000) 84 50 45
Sources: Mao et al (2000). http://www.adb.org/documents/events/2002/RETA5937/manila/downloads/tp_15C_maozhongan.pdf

Chinese Government Policies
• First emission standards in 2000• Catalytic converters required in 2000• Leaded fuel banned in 2000• Clean Vehicle Action (alternative fuel vehicle
program) started in 1999 • Ministry of Science & Technology (MOST) high-tech
(863) R&D started program on clean vehicles in 2001 (US$120 million over 5 years)
• New fuel efficiency standards in 2005• Euro III standards to take effect in 2008
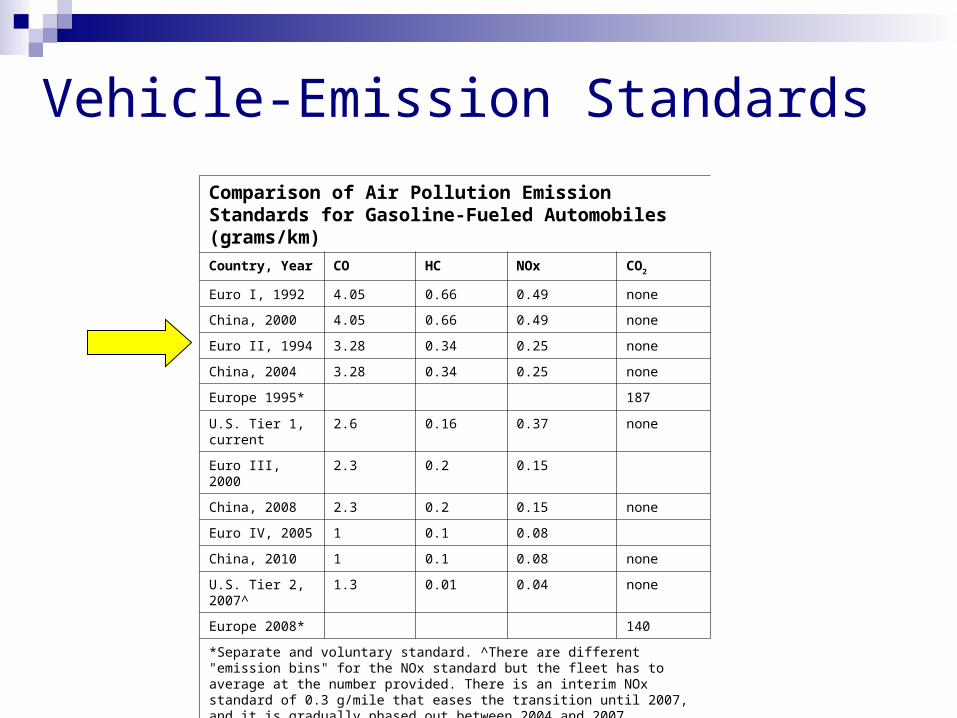
Vehicle-Emission Standards
Comparison of Air Pollution Emission Standards for Gasoline-Fueled Automobiles (grams/km)
Country, Year CO HC NOx CO2
Euro I, 1992 4.05 0.66 0.49 none
China, 2000 4.05 0.66 0.49 none
Euro II, 1994 3.28 0.34 0.25 none
China, 2004 3.28 0.34 0.25 none
Europe 1995* 187
U.S. Tier 1, current
2.6 0.16 0.37 none
Euro III, 2000 2.3 0.2 0.15
China, 2008 2.3 0.2 0.15 none
Euro IV, 2005 1 0.1 0.08
China, 2010 1 0.1 0.08 none
U.S. Tier 2, 2007^
1.3 0.01 0.04 none
Europe 2008* 140
*Separate and voluntary standard. ^There are different "emission bins" for the NOx standard but the fleet has to average at the number provided. There is an interim NOx standard of 0.3 g/mile that eases the transition until 2007, and it is gradually phased out between 2004 and 2007. Data sources: (Beardon 1999; EC 2001; SEPA Official 2002).
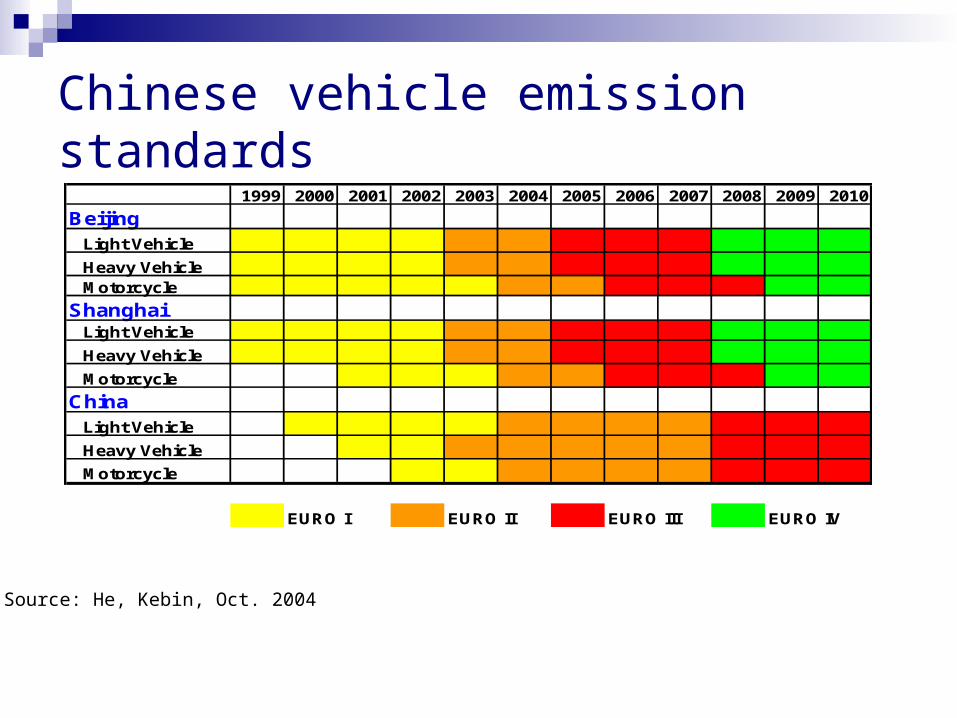
Chinese vehicle emission standards1999 2000 2001 2002 2003 2004 2005 2006 2007 2008 2009 2010
Beijing Light Vehicle
Heavy Vehicle Motorcycle
Shanghai Light Vehicle
Heavy Vehicle
Motorcycle
China Light Vehicle
Heavy Vehicle
Motorcycle
EURO I EURO II EURO III EURO IV
Source: He, Kebin, Oct. 2004
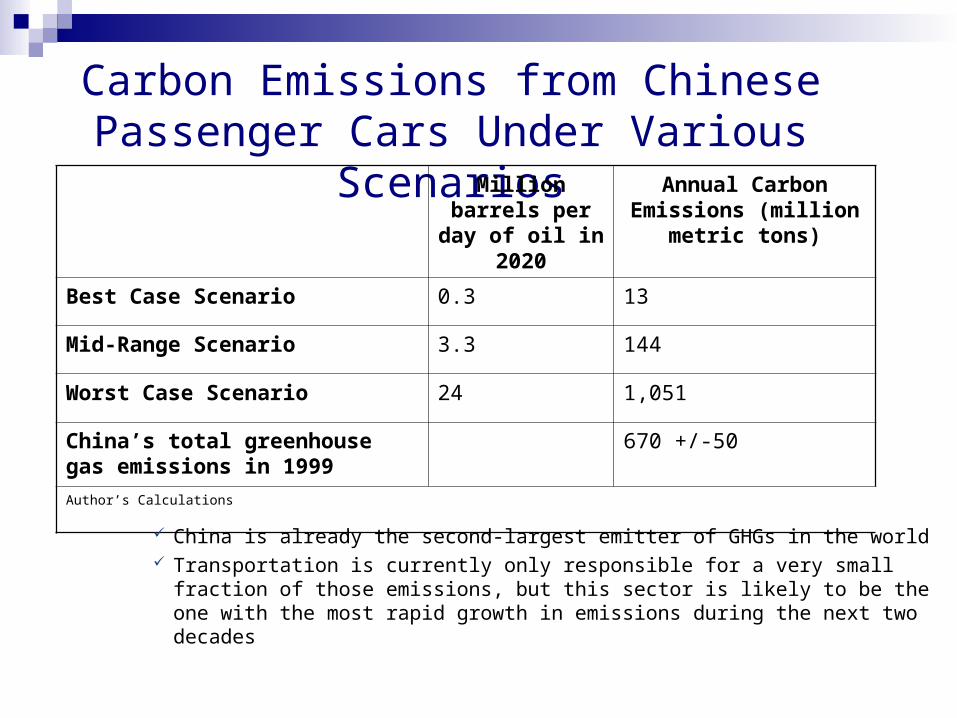
Carbon Emissions from Chinese Passenger Cars Under Various Scenarios
Million barrels per day of oil in
2020
Annual Carbon Emissions (million
metric tons)
Best Case Scenario 0.3 13
Mid-Range Scenario 3.3 144
Worst Case Scenario 24 1,051
China’s total greenhouse gas emissions in 1999
670 +/-50
Author’s Calculations
China is already the second-largest emitter of GHGs in the world Transportation is currently only responsible for a very small fraction of
those emissions, but this sector is likely to be the one with the most rapid growth in emissions during the next two decades
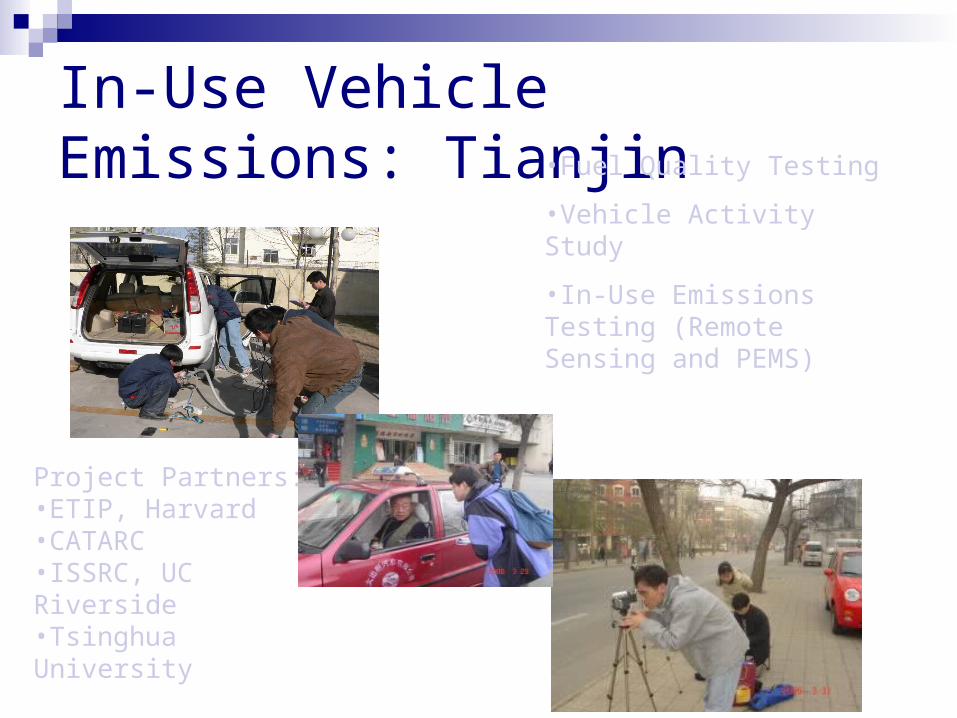
In-Use Vehicle Emissions: Tianjin
Project Partners:•ETIP, Harvard•CATARC•ISSRC, UC Riverside•Tsinghua University
•Fuel Quality Testing
•Vehicle Activity Study
•In-Use Emissions Testing (Remote Sensing and PEMS)
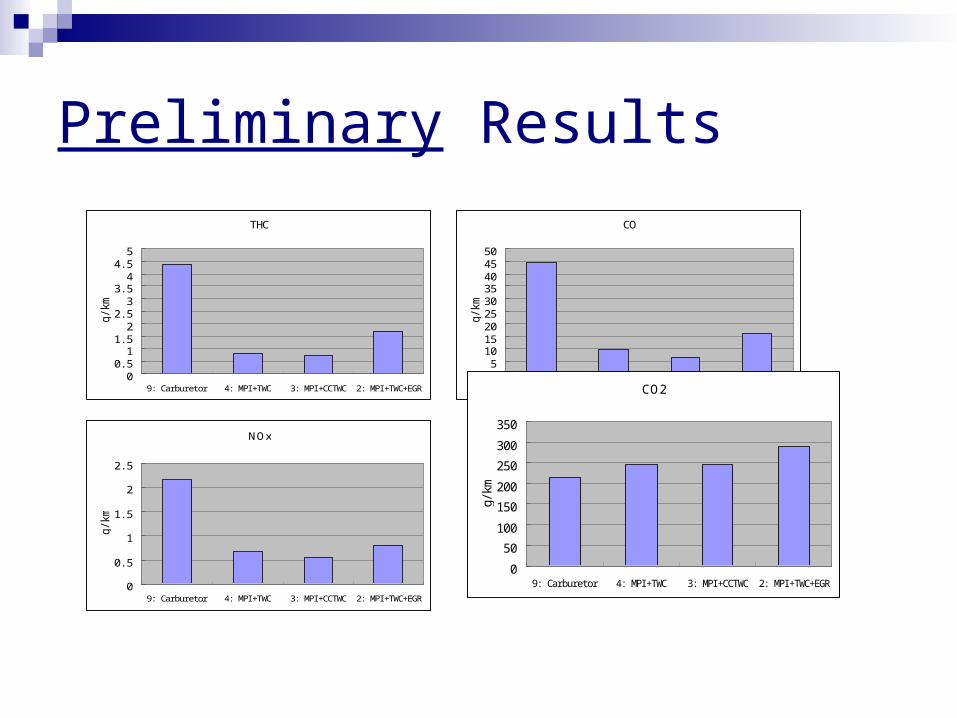
Preliminary Results
THC
00. 5
11. 5
22. 5
33. 5
44. 5
5
9: Carburetor 4: MPI +TWC 3: MPI +CCTWC 2: MPI +TWC+EGR
g/km
CO
05
101520253035404550
9: Carburetor 4: MPI +TWC 3: MPI +CCTWC 2: MPI +TWC+EGR
g/km
NOx
0
0. 5
1
1. 5
2
2. 5
9: Carburetor 4: MPI +TWC 3: MPI +CCTWC 2: MPI +TWC+EGR
g/km
CO2
0
50
100
150
200
250
300
350
9: Carburetor 4: MPI +TWC 3: MPI +CCTWC 2: MPI +TWC+EGR
g/km
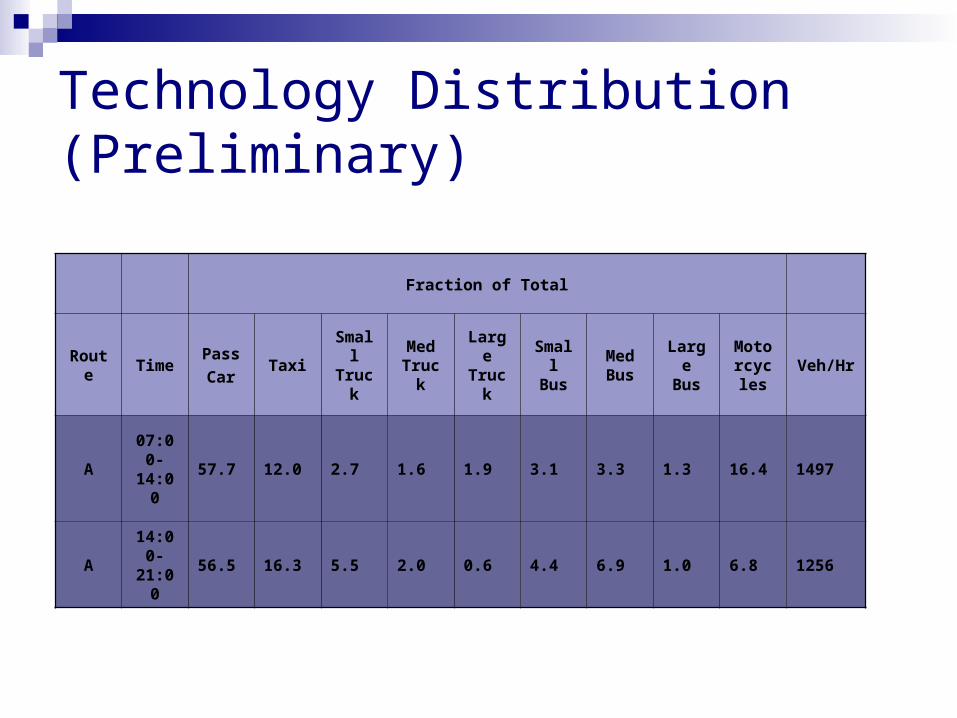
Technology Distribution (Preliminary)
Fraction of Total
Route TimePass
CarTaxi
Small Truck
Med Truck
Large Truck
Small Bus
Med Bus
Large Bus
Motorcycle
sVeh/Hr
A07:00-14:00
57.7 12.0 2.7 1.6 1.9 3.1 3.3 1.3 16.4 1497
A14:00-21:00
56.5 16.3 5.5 2.0 0.6 4.4 6.9 1.0 6.8 1256