International Peer Benchmarking Study on - ICT Law and...
50
International Peer Benchmarking Study on South Africa’s ICT Sector Department of Communication June 2009
Transcript of International Peer Benchmarking Study on - ICT Law and...

International Peer Benchmarking Study on South Africa’s ICT Sector
Department of CommunicationJune 2009

Introduction
The Department of Communication Commissioned the BMIT to analyse
– telecommunications voice, data and broadband services and product prices at
– international, national, retail, business and residential levels in
– South Africa, Brazil, Chile, Korea, India and Malaysia to assess its relative performance in respect of
– Cost , usage, access and quality
This booklet contains the PEER BENCHMARKING RESULTS for the International Peer Benchmarking Study on South Africa’s ICT Sector.

Policy Environment (1)
Major events that significantly transformed the regulatory regime for the
telecommunications sector in South Africa were:
•The corporatisation of Telkom in 1991
•The licensing of two mobile operators in 1993
•The enactment of the Telecommunications Act of 1996
•The sale of a 30% shareholding in Telkom to Thintana17 in 1997
•The subsequent amendment of the Act in 2001 making provision for the
licensing of an SNO and
•The enactment of the Electronic Communications Act and the ICASA
Amendment Act in 2006.

Policy Environment (2)
Other significant events included:
•The issuing of a third mobile licence in 2001
•The merging of the separate broadcasting and telecommunications regulatory
authorities to form ICASA in 2001
•The issuing of a Multimedia Services Licence and Carrier of Carriers License to
Sentech Limited in 2002
•The public listing of Telkom SA in 2003
•The licensing of the Second Network Operator in 2004
•The coming into effect in 2005 of a ministerial determination expanding
commercial opportunities available to several types of market participants,
notably VANS providers permitted to offer voice telephony services
•The declaration of submarine cable landing stations as essential facilities, and
•The decision to expedite the local loop unbundling process for completion by
2011.

Brazil IndiaSouth Africa
Chile Malaysia South Korea
Benchmark countries

Purchasing power parity (PPP)
• Takes into account differences in the relative prices of goods and services
• Measured in current international dollars which are calculated to have same purchasing power as a dollar spent on GNI in the U.S. economy
• “Big Mac” example from The Economist magazine (July 24, 2008):
– Price of Big Mac in USA: US$3.57
– Price of Big Mac in South Africa: US$2.24
– Difference between South Africa and USA: -37%
– Adjusted PPP South Africa exchange rate to US dollar: 7.56 * -1.37 = 4.75

Basic indicators Sou
rce: Wo
rld B
ank (Po
pu
lation
, urb
an p
op
ulatio
n an
d su
rface area). IMF (G
DP
).
The benchmark country with the largest population is India with a population over five times
bigger than the next most populated nation, Brazil. South Africa’s population is in the middle
of the benchmark countries, similar to Korea and larger than Chile and Malaysia. Gross
domestic product (GDP) per capita is in current United States dollars and in purchasing
power parity (PPP)

Taxes
All countries levy a Value Added Tax (VAT) or sales tax on telecommunications services.
The rates are shown below.

Fixed telephone market
• Fixed line access generally dominated by incumbent operator:
– Brazil: Regional domination (Telesp, Brasil Telecom, Oi) with some Wireless Local Loop (WLL) competition
– Chile: CTC with some regional operators– India: BSNL with MTNL in Delhi and Bombay and competition from WLL– Korea: Korea Telecom (90%) of lines, one other nationwide competitor– Malaysia: Telekom Malaysia– South Africa: Telkom; new competitor with Neotel
• Domestic & international long distance markets generally open; indirect domestic long distance competition from mobiles
• Brazil, Chile, India and Korea pretty competitive with a number of facilities-based long distance operators

Fixed telephone penetration
• Growth in fixed lines has been stagnant in most of countries
• Only Malaysia & South Africa with less fixed lines at March 2008 than December 2000
0
10
20
30
40
50
60
20
00
20
01
20
02
20
03
20
04
20
05
20
06
20
07
Ma
r-0
8
Korea
South Africa
Malaysia
BrazilChile
India
Fixed telephone line subscribers per 100 people

Fixed connection charges
$28
$32
$54
$77
$82
$93
$105
$0 $50 $100 $150
Malaysia TM
India BSNL
Telkom Prepaid
Brazil TELESP
Korea KT
Telkom Postpaid
Chile CTC
Connection charges include:
-Subscription charges (Residential & Business)
-Call charges
Findings
•No distinction between residential and business
• Most alternative operators do not charge for connection
• In Brazil, connection varies by region
• Telkom South Africa does not charge connection for “Closer” Plans
Fixed line connection charges, August 2008, PPP

Fixed monthly subscription
• Big range in subscription charges among benchmark countries
• Subscriptions vary by residential or business and whether free or discounted calls / minutes included
$0
$10
$20
$30
$40
$50
$60
$70
$80
Bra
zil T
ELE
SP
Bas
ic*
Chi
le C
TC
Are
a 1
Indi
a B
SN
L B
asic
One
*K
orea
KT
Hig
hest
Kor
ea K
T L
owes
tK
orea
KT
Hig
hest
flat
*K
orea
KT
Low
est f
lat*
Kor
ea H
anar
o ha
nafo
neM
alay
sia
TM
>1,
000
lines
Mal
aysi
a T
M <
1,00
0 lin
esT
elko
m P
ostp
aid
Tel
kom
Pre
paid
Tel
kom
Clo
ser
1*T
elko
m C
lose
r 2*
Tel
kom
Clo
ser
3*
Residence
Business
Monthly fixed line subscription charges, August
2008, PPP
* Includes free minutes or calls or discounted call prices.

Fixed local call
• South Africa has the highest fixed local call charges (i.e., fixed local call to another fixed line)
$0.00 $0.05 $0.10 $0.15
Korea KT
India BSNL
Malaysia TM
Chile CTC
Brazil TELESP
Telkom Postpaid
Telkom Prepaid
Price of a one minute peak rate fixed local call, 2008, PPP

Fixed to mobile call
• South Africa has second highest price
• Along with Brazil, significantly above other countries
$0.00 $0.20 $0.40 $0.60
India BSNL
Korea KT
Malaysia TM
South Africa Telkom
Brazil TELESP
Price of a one minute fixed to mobile call, average peak/off-peak, 2008, PPP
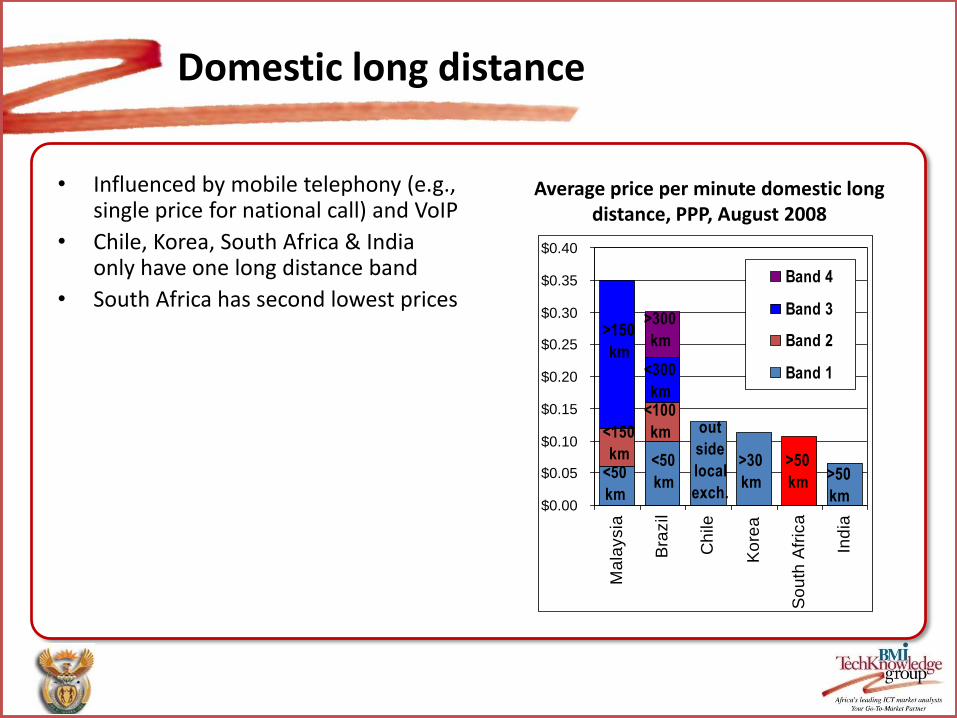
Domestic long distance
• Influenced by mobile telephony (e.g., single price for national call) and VoIP
• Chile, Korea, South Africa & India only have one long distance band
• South Africa has second lowest prices
$0.00
$0.05
$0.10
$0.15
$0.20
$0.25
$0.30
$0.35
$0.40
Ma
laysia
Bra
zil
Ch
ile
Ko
rea
So
uth
Afr
ica
Ind
ia
Band 4
Band 3
Band 2
Band 1
>30
km
>50
km<50
km
<150
km
>150
km
<50
km
<100
km out
side
local
exch.>50
km
<300
km
>300
km
Average price per minute domestic long distance, PPP, August 2008

International long distance
$0.12
$0.17 $0.17
$0.26 $0.27 $0.29
$0.19
$0.23
$0.47$0.50
$0.38 $0.36
$0.0
$0.1
$0.2
$0.3
$0.4
$0.5
$0.6
South
Africa
Chile India Malaysia Brazil Korea
US$ per minute
PPP per minute
• Despite the lowest level of facilities-based international telephone call competition, South Africa has the cheapest tariffs
• This is partly due to extensive tariff rebalancing but is still surprising
• There is not more of a competitive threat from VoIP in South Africa since it is legal in all the other countries also (to various degrees, either full VoIP or PC-phone)
Price reflects calls placed from fixed lines of incumbent operators. Peak and off-peak have been averaged.
So
urc
e: O
pe
rato
r’s p
ub
lish
ed
ta
riffs.
Price of one minute call to USA, August 2008

Public payphone
• Price of calls from payphones important for those without telephone or with mobiles looking for cheaper call prices
$0.06
$0.10
$0.13
$0.25
$0.27
$0.48
$0.00 $0.20 $0.40 $0.60
Malaysia
Korea
India
Brazil
South
Africa
Chile
3 minute call from public payphone, average peak/off-peak, August 2008, PPP

Fixed line Quality of Service (QoS)
• The only fixed QoS indicator available for all countries is the number of faults
• On average, one of out of every two fixed lines have a fault in South Africa each year compared to one in 100 in Korea but almost 9 out of 10 in India
86
54
49
29
17
1
0 50 100
India
Chile
(06)
South
Africa
Malaysia
Brazil
Korea
(03)
Faults per 100
lines per year,
2007

Fixed telephone usage
• Local usage low in South Africa compared to benchmark countries
• Long distance usage relatively high 377
318
206
8221
701 5 12
0
50
100
150
200
250
300
350
400
Brazil Chile South Africa
Local
National long distance
International long distance
Minutes of use per subscriber per month, 2007
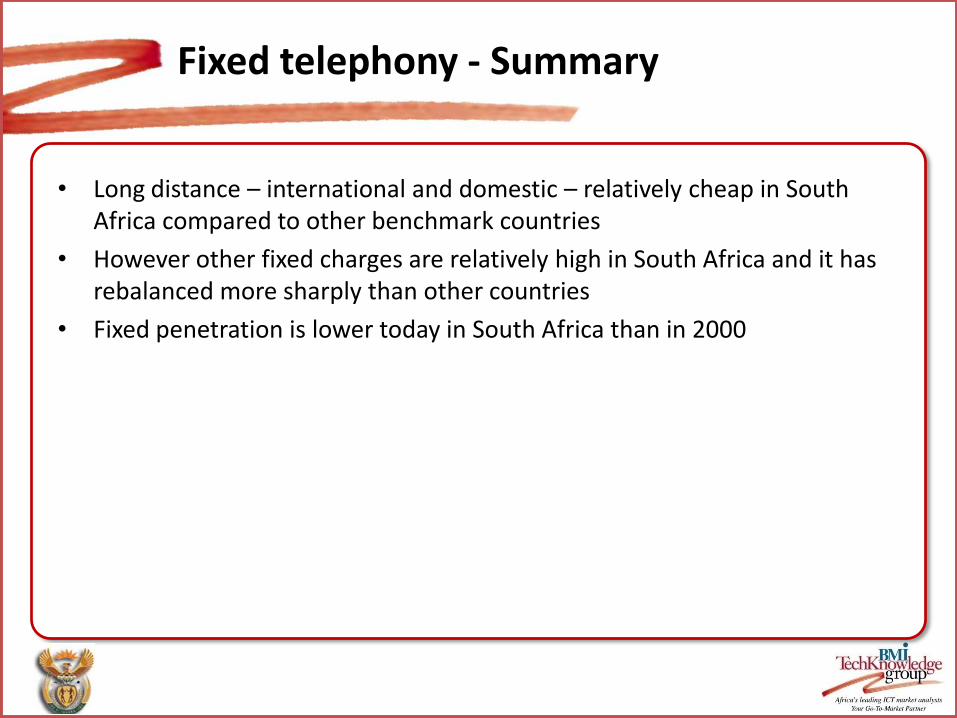
Fixed telephony - Summary
• Long distance – international and domestic – relatively cheap in South Africa compared to other benchmark countries
• However other fixed charges are relatively high in South Africa and it has rebalanced more sharply than other countries
• Fixed penetration is lower today in South Africa than in 2000

Mobile market
1,593
2,265
3,4383,687
3,868
4,318
South
Africa
Korea Chile Malaysia Brazil India
Others
Operator 3
Operator 2
Operator 1
3 3 3 3 8 12
Number of facilities-based
mobile operators
Market share
• South Africa has the most concentrated mobile market
• Most of the benchmark countries, like South Africa, have 3 nationwide operators
• Brazil and India have a larger number of mobile groups although not all operate nationwide
Herfindahl-Hirschman Index
December 2007
The Herfindahl-Hirschman Index (HHI) is a measure of market concentration calculated by squaring
the market share of each firm and then summing the resulting numbers. The closer the HHI is to
zero, the less concentrated the industry.

Mobile penetration
0
10
20
30
40
50
60
70
80
90
100
2000 2001 2002 2003 2004 2005 2006 2007 Mar-08
South Africa
Korea
Brazil
India
Chile
Malaysia

Mobile penetration December 2007
• Although South Africa has the highest mobile penetration among the study countries, this should be treated with caution:– South Africa has the highest
penetration of pre-paid subscribers with lenient recharge “windows” and likely multiple subscriptions
– In terms of household penetration, South Africa has a lower rate than other countries for which data is available
• Therefore, except for India, likely that other benchmark countries are equivalent in terms of mobile penetration
1321
2
87
14 14
53
63
18
3
72 77
73
88
74
0
10
20
30
40
50
60
70
80
90
100
Brazil Chile India KoreaMalaysiaSouth
Africa
Pre-paid penetrationPost-paid penetrationHomes with mobile phone (%)
66
84
20
9086
92

Pre-paid handset prices
• “Nokia 1200 is a very basic phone with the feature set from last century…Nokia 1208 is a little better with the addition of 65K color VGA screen”http://www.unwiredview.com/2007/05/04/nokia-1200-and-nokia-1208-cheap-phones-to-share/
• In Malaysia, model not available (only 3G phones!). In Korea, Nokia 1200/1208 not available.
• South Africa has highest pre-paid phone price even though cheaper model (1200). Furthermore, offers no incentives to purchaser unlike other countries (e.g., installment payments, free calls, free SMS).
$0
$32
$45$48
$56
India Brazil USA Chile South
Africa
Pre-paid phone prices including taxes. Converted to US$ using 2007 annual average exchange rate. India & South Africa refer to 1200; Brazil & Chile refer to 1208.
Nokia 1200/1208 handset prices, US$, August 2008
Can
be
paid
in
install
ments
Incl.
10
on-
net
calls
Incl.
US$
19 of
calls
& 50
SMS Sou
rce:
Op
era
tor
web
sit
es.

Prepaid mobile pricesPeak rate, August 2008, PPP
$0.00
$0.20
$0.40
$0.60
$0.80
$1.00
$1.20
Bra
zil V
ivo
To
da
Ho
ra
Bra
zil o
i
Ch
ile M
ovi
sta
r T
ari
fa F
ull
Ch
ile E
nte
l Pla
n R
aim
un
do
Ind
ia B
ha
rti A
irte
l
Ko
rea
SK
Te
leco
m
Ma
lays
ia C
elc
om
Ma
lays
ia M
axi
s H
otli
nk
So
uth
Afr
ica
Vo
da
go
So
uth
Afr
ica
MT
N P
ay
as
you
Go
Cla
ssic
So
uth
Afr
ica
Ce
llC e
asy
cha
t
sta
nd
ard
On-net
Off-net
Fixed
A selection of rates for illustration purposes.
Does not include all plans in each country.
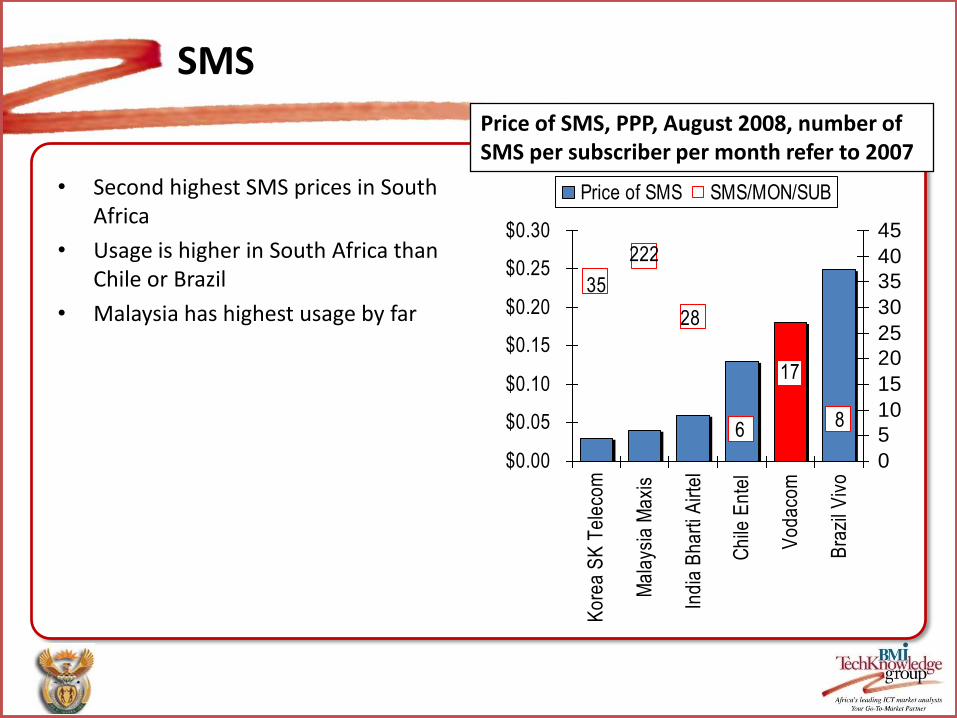
SMS
• Second highest SMS prices in South Africa
• Usage is higher in South Africa than Chile or Brazil
• Malaysia has highest usage by far35
222
28
6
17
8
$0.00
$0.05
$0.10
$0.15
$0.20
$0.25
$0.30
Ko
rea
SK
Te
leco
m
Ma
lays
ia M
axi
s
Ind
ia B
ha
rti A
irte
l
Ch
ile E
nte
l
Vo
da
com
Bra
zil V
ivo
0
5
10
15
20
25
30
35
40
45
Price of SMS SMS/MON/SUB
Price of SMS, PPP, August 2008, number of SMS per subscriber per month refer to 2007

International call from mobile
• While South Africa has cheapest international calls from fixed line, the situation is reversed with mobile
$0.41
$0.43
$0.55
$0.61
$0.64
$0.00 $0.50 $1.00
India
Brazil
Malaysia
Chile
South
Africa
Price of one minute call to USA from mobile phone, August 2008, PPP
Note: None of the sampled operators has a different off-peak rate.

Minutes of Use (MoU)
0
50
100
150
200
250
300
350
400
450
500
$0.00 $0.20 $0.40 $0.60
Revenue per minute (US$)
Mo
U/S
ub
scri
ber/
Mo
nth
India
Korea
Malaysia
South Africa
Chile
Brazil
• Mobile usage declines as revenue per minute (ARPU/MoU) goes up
• South African mobile operators have highest revenue per minute of benchmark countries
• South Africans talk less on their mobiles than any of the other peer countries

Mobile quality of service
• Mobile quality fairly similar across countries except for India
99.95%
99.70%
99.73%
93.57%
90% 92% 94% 96% 98% 100
%
Chile
South
Africa
Malaysia*
India
Mobile call set-up success rate, 2007
Data refer to largest operator. * 2002.

3G mobile subscribers
• All countries except India have launched mobile broadband networks (WCDMA, EVDO or HSDPA)
• Except for Korea, share of 3G subscribers in total mobile users is low
• However, most 3G subscribers are using 3G for fixed-like broadband access (e.g., 400,000 in Brazil)
2% 1% 0%
56%
4% 3%
Brazil Chile India Korea Malaysia South
Africa
3G as percent of
total mobile
subscribers

3G Broadband tariffsHSDPA networks, PPP, August 2008
41
55
63
71
76
79
Korea
Malaysia
MTN
Brazil
Vodacom
Chile
41
55
71
79
85
98
Korea
Malaysia
Brazil
Chile
MTN
Vodacom
41
55
71
79
230
Korea
Malaysia
Brazil
Chile
Vodacom
41
55
71
79
449
Korea
Malaysia
Brazil
Chile
Vodacom
1GB 2 GB
10 GB
Note: India has not launched HSDPA. In Brazil & Chile speed is reduced when reaching 1 & 3 GB volume caps respectively.
5 GB

Mobile communications - Summary
• Mobile penetration has grown impressively in South Africa. It has risen from the fourth ranked country among the benchmark nations in 2000 to first in March 2008.
• South Africa top ranked despite relatively high tariffs
• However usage in South Africa is low
• Mobile broadband tariffs for high volumes (>2GB) expensive in South Africa due to lack of uncapped plans which are available in the other benchmark countries

Internet market
• Only Malaysia has less competitive broadband market than South Africa
• In Brazil, Chile, India and Korea there is intra-modal competition among DSL providers and inter-modal competition with cable modem, wireless and 3G providers

Internet access
0
10
20
30
40
2000 2002 2004 2006
Korea
Malaysia
Chile
Brazil
South Africa
India
0
20
40
60
80
2000 2002 2004 2006
Korea
Malaysia
Chile
Brazil
South Africa
India
4
7
17
20
31
80
0 50 100
India
South
Africa
Brazil
Malaysia
Chile
Korea
Households with Internet access at home, 2007, %Internet subscribers per 100 people
Internet users per 100 people

Distribution of Internet subscribers
• In Chile & Korea, almost all Internet subscribers are now broadband
• In India & Malaysia low dial-up rates discourage broadband adoption
100%
97%
59%
52%
30%
26%
Korea
Chile
Brazil
South
Africa
India
Malaysia
Percentage of Internet subscribers using broadband, 2007

Internet tariffs
• Other countries have variety of plans and different speeds compared to South Africa
• All except South Africa offer unlimited plans
• Benchmark around South Africa speeds & caps
• Includes ISP portion (only relevant for Brazil and South Africa)

DSL PricesMonthly tariff, August 2008, PPP
$0
$10
$20
$30
$40
$50
$60
Ma
laysia
Bra
zil
Ko
rea
Ind
ia
So
uth
Afr
ica
Ch
ile
1GB
2GB
10
hours
per
month
cap
No cap
No cap
No cap
1
GB
cap
2
GB
cap
No cap
10
Mbps
256
kbps
$0
$20
$40
$60
$80
$100
$120
$140
$160
Ko
rea
Ind
ia
Bra
zil
Ch
ile
So
uth
Afr
ica
Ma
laysia
3GB
cap
No
cap
No
capNo
cap
4.5
GB
cap
No
cap
10
Mbps
3 GB
384 kbps 4096 kbps

Broadband speeds
• All of the countries have maximum broadband speeds faster than South Africa
• Korea offers 100 Mbps fiber optic/LAN connections whereas Brazil offers 30 Mbps
• In contrast, the fastest DSL speed in South Africa is 4 Mbps
0 10,000 20,000 30,000
Korea
Brazil
Chile
Malaysia
India
South
Africa
Range of slowest & fastest broadband speeds available, kbps
100 Mbps

Wi-Fi hotspot
• All telephone operators have Wi-Fi plans. Some offer prepaid cards or monthly subscriptions
• Ideal for those who do not have Internet access at home
• Proxy for public access
0.020.03
0.05 0.05
0.07
0.13
$0.00
$0.02
$0.04
$0.06
$0.08
$0.10
$0.12
$0.14
Ma
laysia
Ind
ia
Ko
rea
Ch
ile
Bra
zil
So
uth
Afr
ica
Price per minute Wi-Fi hotspot, US$, August
2008
Internet summary
• South African tariffs consistently high
• Unlike other countries, no uncapped plans in South Africa
• Level of South African access relatively low and slower growth than other countries

WHOLESALE

Fixed termination
• South Africa has highest fixed termination rates
0.0
0.5
1.0
1.5
2.0
2.5
3.0
3.5
4.0
MalaysiaChile India Brazil Korea South
Africa
Fixed termination rates, PPP cents per minute, 2007

Mobile termination
• All countries except Brazil and South Africa regulate mobile termination rates
• Brazil & South Africa have the highest rates
1.97
4.56
5.02
26.49
27.06
28.49
0 10 20 30
India
Malaysia
Korea
Chile
South
Africa
Brazil
Mobile termination rate, PPP cents per minute, 2007

International incoming calls
• International incoming calls to fixed lines and mobile phones align fairly closely with termination rates
• It costs about 8 US cents to call a fixed line in South Africa using Skype
• It costs over 3 times more to call a South African mobile phone from abroad using Skype
$0.02
$0.02
$0.02
$0.03
$0.04
$0.06
$0.07
$0.08
$0.08
$0.24
$0.25
$0.27
$0.11
$0.00 $0.10 $0.20 $0.30
Chile
Malaysia
Korea
Brazil-Sao Paulo
Brazil-Rio de Janeiro
Brazil
Malaysia - Mobile
South Africa
Korea - Mobile
India
Chile - Mobile
Brazil - Mobile
South Africa - Mobile
Termination
rate
International calls to benchmark countries using Skype, US$ per minute including VAT, August 2008
Source: Skype.

Domestic leased lines
• India has the cheapest domestic leased line prices
• South Africa compares favorably compared to Korea and Malaysia
$0
$2,000
$4,000
$6,000
$8,000
$10,000
$12,000
India South
Africa
Korea Malaysia
2 Km
200 km
Price of 2 Mbps domestic leased line, PPP, 2008

International leased lines
• South Africa has the highest price for an international 2 Mbps leased line to the USA
• It is more than twice as much as the next most expensive country
2,654
4,041
5,275
6,939
7,000
15,009
$0 $5,000 $10,000 $15,000 $20,000
Chile
Korea
Malaysia
Brazil
India
South
Africa
Price of 2 Mbps international leased line to USA, half-circuit, PPP, 2008

International bandwidth
• South Africa lags other countries in international Internet bandwidth.
• The relative shortage of bandwidth in South Africa partly explains higher broadband and leased line prices
20 20
42
49
40
3
147
100
4
122
11 7
Bra
zil
Ch
ile
Ind
ia
Ko
rea
Ma
laysia
So
uth
Afr
ica
Gbps
Bits per person
Note: Figures for Brazil and Chile refer to Embratel and Entel only. Figure for South Africa refers to IS, Verizon and Telkom.
International Internet bandwidth, Gbps, 2007

Wholesale summary
• South African fixed and mobile termination rates high
• International leased lines expensive
• Very low international bandwidth compared to benchmark countries

Conclusions
• South Africa more often than not aligns with high cost countries (Brazil & Chile) in tariff comparisons
• South Africa expensive for fixed local access but inexpensive for fixed domestic and international long distance
• South Africa and Malaysia only two countries with less fixed lines today than in 2000
• South Africa has most concentrated mobile market
• South Africa has relatively high mobile penetration
• Mobile tariffs expensive in South Africa
• South Africa has lowest mobile usage

Conclusions (II)
• South Africa has low Internet penetration and market has grown slowly compared to other benchmark countries
• Lack of uncapped broadband plans in South Africa compared to other benchmark countries
• Mobile and DSL broadband expensive at high usage (>3GB)
• Wholesale fixed and mobile termination expensive in South Africa
• South Africa compares favorably for domestic leased lines
• International private leased lines (2Mbps) expensive in South Africa
• Dearth of international bandwidth in South Africa