INTERNATIONAL MIGRATION, REMITTANCES AND POVERTY ... 1 2010_Emerta... · INTERNATIONAL MIGRATION,...
46
1 INTERNATIONAL MIGRATION, REMITTANCES AND POVERTY ALLEVIATION IN ETHIOPIA Emerta Assaminew, Getachew Ahmed, Kassahun Aberra and Tewodros Makonnen Working Paper No 1/ 2010 Ethiopian Economics Association / Ethiopian Economics Policy Research Institute (EEA/EEPRI) April, 2010 Addis Ababa
Transcript of INTERNATIONAL MIGRATION, REMITTANCES AND POVERTY ... 1 2010_Emerta... · INTERNATIONAL MIGRATION,...
1
INTERNATIONAL MIGRATION, REMITTANCES AND
POVERTY ALLEVIATION IN ETHIOPIA
Emerta Assaminew, Getachew Ahmed,
Kassahun Aberra and Tewodros Makonnen
Working Paper No 1/ 2010
Ethiopian Economics Association /
Ethiopian Economics Policy Research Institute
(EEA/EEPRI)
April, 2010
Addis Ababa
1
International Migration, Remittances and
Poverty Alleviation in Ethiopia
Emerta Assaminew, Getachew Ahmed, Kassahun Aberra and Tewodros Makonnen
Ethiopian Economics Association (EEA)
Ethiopian Economic Policy Research Institute (EEPRI)
April 2010

1
Table of Content
1 Introduction -------------------------------------------- 1
2 Migration Patterns: Legal and Policy Issues in
Ethiopia
2.1 Patterns of International Migration and
Remittances
2.2 Ethiopia‘s International Migration Patterns
2.3 International and National Legislations about
Migration
2.4 Remittance Transfer and Channels in Ethiopia
--------------------------------------------
--------------------------------------------
--------------------------------------------
--------------------------------------------
--------------------------------------------
3
3
4
6
8
3 The Macroeconomics Impact of International
Remittances in Ethiopia
3.1 Remittances in Ethiopia: A Snapshot
3.2 A simple Accounting Framework for Remittance
Flows
3.3 A simple Accounting Model of Remittance inflow
in Ethiopia
3.4 The Data
3.5 Empirical Results
3.6 Linking Remittance of Poverty
--------------------------------------------
------------------------------------------
--------------------------------------------
--------------------------------------------
--------------------------------------------
--------------------------------------------
--------------------------------------------
9
9
11
14
15
16
20
4 Livelihood consequence of Migration on the
welfare of Households
4.1 Modeling Strategies and Estimation Methods
4.2 The Nature and Source of Data
4.3 Estimation Results and Discussion
--------------------------------------------
--------------------------------------------
--------------------------------------------
--------------------------------------------
22
23
25
25
5 Conclusions and Policy Implication -------------------------------------------- 31
6 Bibliography -------------------------------------------- 32
7 Annexes -------------------------------------------- 35
1
International Migration, Remittances and
Poverty Alleviation in Ethiopia
Emerta Assaminew, Getachew Ahmed, Kassahun Aberra and Tewodros Makonnen
Abstract
The paper explores the impact of international remittances on the Ethiopian economy and on the
livelihoods and welfare of households. It uses macroeconomic data and data from the Ethiopian
urban household survey. It was found that remittance shocks positively affect macroeconomic
variables; the effect remained to be volatile in the very first periods after the shock. However, the
impacts tend to sustain in the years after the fifth period. Moreover, through the positive (but
inelastic) relationship between growth and poverty, private remittance inflows have an important
implication on poverty in Ethiopia. International remittances significantly reduced the poverty
incidence among the urban households in the country. It was also found that women are more
likely to use remittance more effectively than their male counterparts.
1. Introduction
Migration refers to a change of the usual place of dwelling (Arsole et al, 2003 in Adamnesh,
2008). It could be either voluntary or forced (Kokpari, 2000). Voluntary migrants are those who
change places within or beyond their country of origin at their own discretion rather than for
other uncontrollable factors while forced migration refers to the coerced movement of people
away from their home or place of dwelling. People leave their place of origin permanently or
temporarily to take advantage of opportunities in host countries. These opportunities could be

1
economic, social, political, environmental or a combination of all. The tempting wage gaps
between developed and developing countries, inviting immigration programs in the developed
world, lack of democracy and good governance in the home countries, and poverty and
environmental degradation in the home countries are some of the factors for international
migration (Portes,1996).
Although it is difficult to calculate the number of migrants worldwide with precision, recent
estimations suggest that nearly 200 million people live outside their country of birth. There is
little suggestion that this trend will abate in the future: indeed, projections of demographic and
economic imbalances between the north and south suggest a persistent pressure for migration
(World Bank, 2006). According to the United Nations estimates (UN, 2006), between 1960 and
2005 the number of international migrants in the world more than doubled, passing from an
estimated 75 million in 1960 to almost 191 million in 2005, an increase of 116 million over 45
years.
Migration has diverse socio-economic impact ranging from increasing better opportunities for
the migrant to an improved livelihood of sending households and to contributing economic
growth. According to the World Bank (World Bank, 2006), remittances [from migrant workers]
have reduced the share of poor people in the population by 11 percent in Uganda, 6 percent in
Bangladesh and 5 percent in Ghana. Remittance income is also associated with higher school
attendance in the Philippines, improved health outcomes in Guatemala and increased investment
in microenterprises in Mexico. Migration can also bring benefits to households in developing
countries beyond the effects of remittances: the prospect of better employment opportunities can
improve incentives for education; and knowledge transferred by the diaspora may result in
improved health practices and improved labor productivity. Moreover, remittances have a
positive and significant impact on economic growth, probably through increased domestic
investment. However, the same report has found that the substantial inflow of remittances in a
number of Latin American countries put pressure on exchange rates, damaging external
competitiveness.
Ethiopia is challenged by different migration patterns and dynamics, which have significant
political and socio-economic ramifications for the country. The country has one of the highest
African diaspora populations, which undoubtedly affects the government‘s sustainable
development and poverty reduction programs. According to Dejene (2005), international
migration is increasing starting from the late 1970‘s, which is the result of the political instability
at that time. Nowadays, many Ethiopians, skilled and unskilled, cross border to different
countries legally and illegally looking for better economic opportunities. The main destinations
for Ethiopians are North America, Europe, and the Middle East (Dejene, 2005). One of the
perspectives that have grown to be more popular in the discussion about migration is the
1
increasing remittances being sent to the country. According to figures from the National Bank of
Ethiopia (the Central Bank of the country) private individual transfers have grown tenfold from a
meager USD 177 million in 2000/01 to USD 1.8 billion in 2008/09. This dramatic increase has
arisen for the most part due to the increasing stock of migrants.
However, while migration originating from relatively poor to rich countries is well known, very
little is known about the large number of Ethiopians in such countries and the role of remittances
they send back home to poverty reduction. The remittances the diaspora send to their home
country constitute a large amount of foreign exchange used for poverty alleviation at the
household level. It also adds to the stock of international foreign exchange reserve of the country
leading to macroeconomic impact such as economic growth. The objective of this study is to see
the livelihood consequences of these remittances on the welfare of households and the
macroeconomic impact of inflows of international migrant remittances on poverty reduction.
The rest of this document is organized as follows. A review of migration patterns, legal and
policy issues in Ethiopia will be assessed in the second section. We devoted two separate
sections for our analysis of results. We do this because of the different impact remittances have
at the household level and on the economy at large. As a result, we employed two different data
sets and methodological approaches. While the macroeconomic impact, on the Ethiopian
economy, of international remittance, is discussed in the third section, the fourth section deals
with livelihood consequences of migration and its concomitant inflow of remittances on the
welfare of households. Section five concludes.
1
2. Migration Patterns: Legal and Policy Issues in Ethiopia
2.1. Patterns of International Migration and Remittances
Generally, international migration flows from less developed to industrial countries. Although
the stock of migrants decreased in recent years, the number of migrants continued increasing.
The share of Africa has dropped from 12% in 1970 to 9% in 2000. But this is not because the
number of African migrants decreased, but rather the share of countries such as China, India and
the Philippines outnumber Africa in recent years. International migration is concentrated in few
countries. By the end of 2005, 12% of the world‘s countries hold 75% of migrant stocks (World
Development Report, 2005).
The 2005 World Migration Report indicated that Australia, North America, Europe, Africa and
Latin America host 18.7%, 12.9%, 7.7%, 2% and 1.4% respectively of the world‘s migrant
stock. The three top migrant receiving countries are United States, Russia and Germany
accepting 35 million, 13.3 million and 7.3 million migrants respectively. On the other hand,
China, India and the Philippines are the three most migrant sending countries with 35 million, 20
million and 7 million people. While Mexico, India, the Philippines and Egypt received USD 11
billion, 8.4 billion, 7.4 billion and 2.8 billion respectively from remittance receipts, USA, Saudi
Arabia, and Germany remit USD 28 billion, 15 billion and 8 billion, respectively (World
Migration Report,2005).
Migration has a mixed effect on the sending and receiving countries. For instance, United States
of America is the leading beneficiary of migration as it is populated by immigrants and their
descendants. The young, in this country, go to college or universities as they are not interested in
manual work. Thus, the gap is filled by migration of young people from developing countries. In
addition to being source of foreign exchange, migration might also have potential benefit to
home countries as it may ease population pressure in developing countries, and reduce
unemployment problem of developing countries.
This argument, however, is very controversial as most of the emigrants from developing
countries are qualified and potential entrepreneurs. In this case, migration may exacerbate the
unemployment problem of the host country instead of lessening it. Furthermore, since most of
the migrants are economically active, it may jeopardize the long term development effort of
sending countries by drawing out the economically active segment of the society (Siliji, 2001). In
this regard, migration is a costly experience for sending countries as lots of their most valuable
medical doctors, engineers, accountants etc. left their home countries which invested lots of
resources to educate them. The worst part of the story is that emigrants may not save enough
money which is left of their own expenses and send back home (Siliji, 2001).

1
International remittance inflow is increasing substantially from 2004 onwards. Developing
countries are the beneficiaries of remittance inflow receiving the lion‘s share -75% of the total
global inflow in 2007. Remittance inflow to Sub-Saharan countries rose from USD 8 billion in
2004 to 12 billion in 2007. But it is still very minimal both in absolute magnitude and relative to
the global inflow (See Table 1.1).
2.2. Ethiopia’s International Migration Patterns
Ethiopia is one of the countries with a large number of migrants in North America, Europe and
the Middle East. According to Tefere and Beruk (2009), by the end of 2005, more than 1 million
Ethiopians migrated to the rest of the world. Looking for a better education, employment
opportunities, and political instability are considered major causes for migration. Political
migration was intensified in Ethiopia during 1970-1990 due to political instability at the time.
Although the stock of migrants is decreasing since 1990, migration is still important and a hot
issue in the current day Ethiopia.
The UN 2008 Revised Population Database shows that 546,000 Ethiopian migrants live in
different parts of the world. This estimate is, however, very small vis-à-vis the Ministry of
Foreign Affairs of Ethiopia estimates which sometimes reach as big as 1 million (Tefere and
Beruk 2009). According to the Population and Housing Census conducted in 2007, Ethiopia‘s
population grew by about 2 million people. At the same time, close to 120 thousand Ethiopian
left their country every year.
Table 1.1: Ethiopia‘s migrant stock from 1970-2010 (thousands of people)
Indicator 19
70
19
75
19
80
19
85
19
90
19
95
20
00
20
05
20
10
Estimated number of international migrants at mid-
year 395 392 404 584 1,155 795 662 554 548
Estimated number of refugees at mid-year 21 9 11 180 42 371 228 108 91
Population at mid-year (thousands) 30 34 37 43 48 57 66 75 85
Estimated number of female migrants at mid-year 171 175 184 268 548 376 312 261 258
Estimated number of male migrants at mid-year 223 217 220 315 607 419 351 293 290
International migrants as a percentage of the
population 1.3 1.1 1.1 1.3 2.4 1.4 1 0.7 0.6
Female migrants as percentage of all international
migrants 43.4 44.7 45.5 46 47.4 47.3 47.1 47.1 47.1
Refugees as a percentage of international migrants 5.2 2.2 2.7 30.9 64.2 46.7 34.4 19.6 16.6
Source: The Revised Population Database (2008)
1
Political and economic reasons accounted for the increase of Ethiopian migrants since the 1970s.
But, these are by no means the only reasons. According to Abye (2008), some migrants come
from a well to do family who can afford the travel and living expenses abroad. Those who are
facing hardship at home are not those who migrate because the poor can‘t afford to travel.
Hence, it can be argued that although the initial reason of migration is political instability, the
recent migration trend can be accounted for by the desire to acquire western culture and enjoy
better standard of living. This, however, does not include those who migrate to the Middle East
whose case is mostly economic. According to Adamnesh (2006), survey on Ethiopian returnee
shows a search for education in host country, political instability at home and better standard of
living in host country accounted for 54%, 27% and 10% respectively of the respondents.
A study by Bathseba (2007) shows that Ethiopia lost 74.6% of its skilled manpower during the
period 1980-1991. By end 2002, Ethiopia lost more than one third of medical doctors. However,
during the 1980-1991 period, only 25% of those who had gone for further studies returned.
Moreover, according to Abye (2008), out of the 5000 PhD holders and 5000-6000 MDs the
country has produced during the last 100 years, over 30% live and work abroad. As a result, the
country spends about USD 5.3 million per annum on expatriate professionals to fill its human
resource gap.
People migrate from Ethiopia mainly through family ties, networks, labor brokers, smugglers
and traffickers. Business meetings and conferences are also becoming a major source of
migration these days. Young women are the main victims of traffickers in Ethiopia. According to
Emebet (2006) as sited in Atnafu (2006), 14,000 Ethiopian women were domestic workers in
Beirut and 17,000 in Lebanon. But official data shows only 6,148 women left the country legally
during 1992-2001. This shows that a significant number of Ethiopian women go through illegal
channels. Some women also move to Saudi Arabia and other Arab states through Oumra and
Hajji. On the other hand, the major channel that people migrate to USA is via diversity visa (DV)
lottery.
1
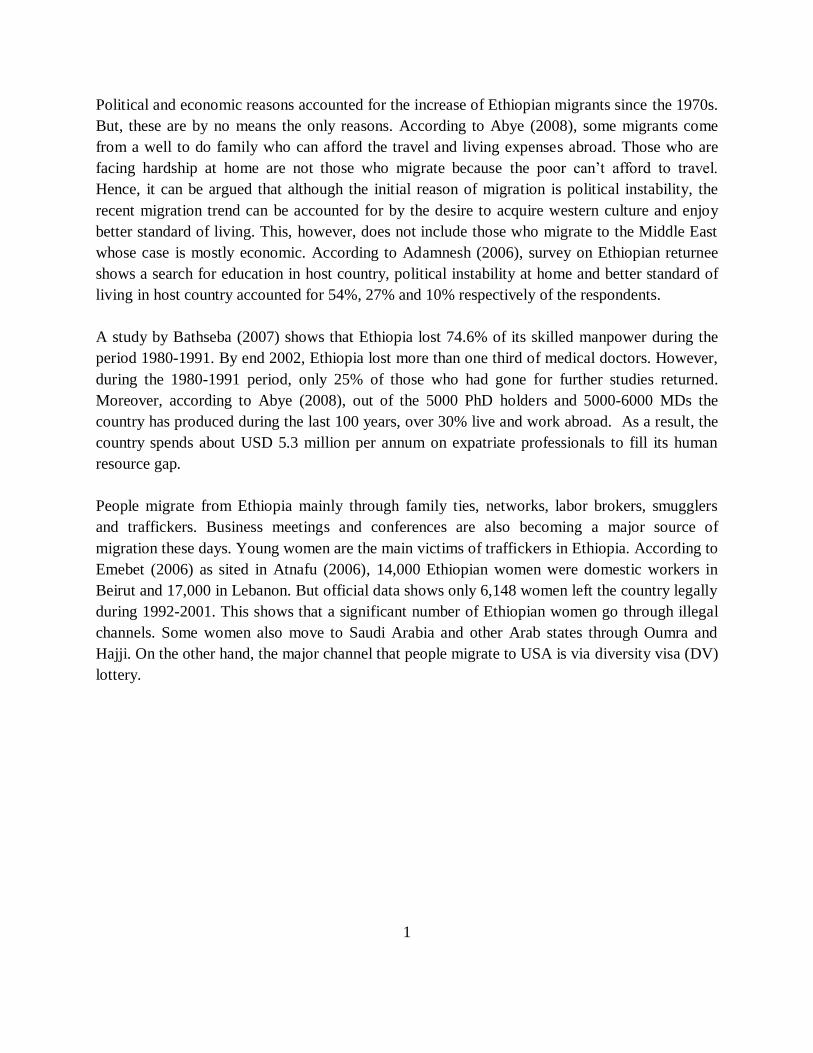
Fig 2.1: Number of Ethiopian Migrants by country of residence, circa 2000
Source: Migration Policy Institute quoted in Adamnesh (2008)
The above graph (see Fig 2.1) shows the top eleven destinations of Ethiopian migrants: United
States, Israel, Saudi Arabia, Canada, Sweden, Germany, Jordan, UK, Netherlands, Italy and
Sudan.
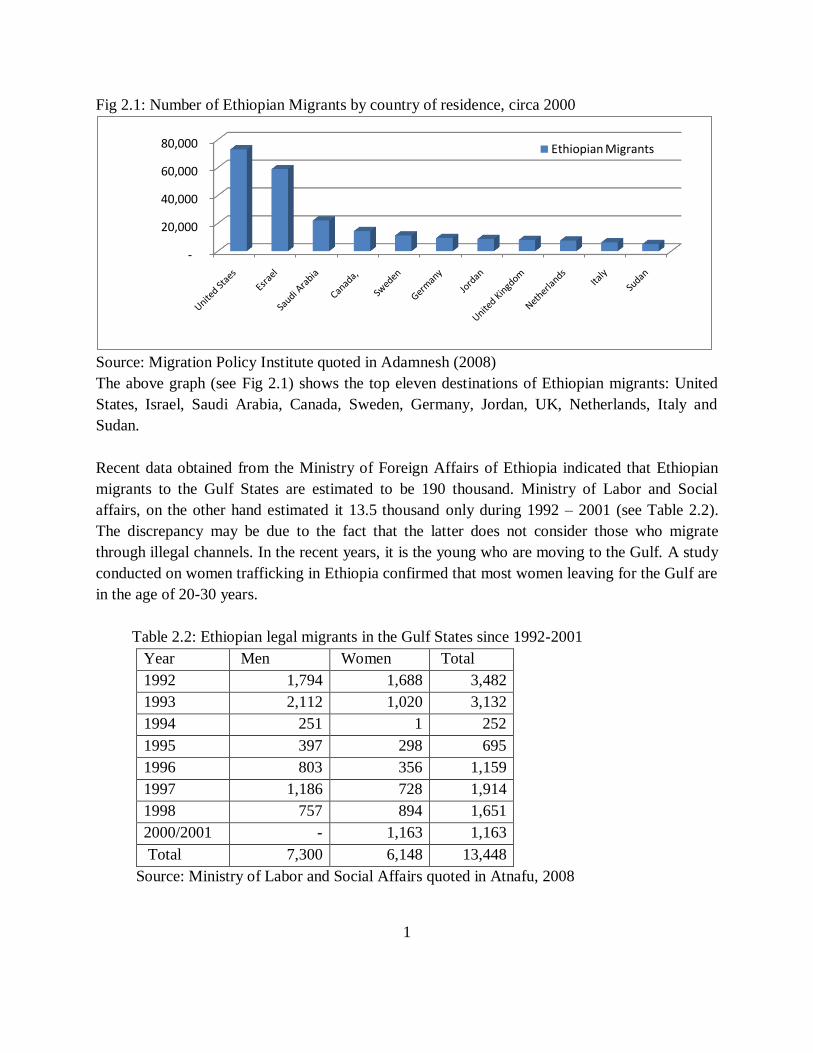
Recent data obtained from the Ministry of Foreign Affairs of Ethiopia indicated that Ethiopian
migrants to the Gulf States are estimated to be 190 thousand. Ministry of Labor and Social
affairs, on the other hand estimated it 13.5 thousand only during 1992 – 2001 (see Table 2.2).
The discrepancy may be due to the fact that the latter does not consider those who migrate
through illegal channels. In the recent years, it is the young who are moving to the Gulf. A study
conducted on women trafficking in Ethiopia confirmed that most women leaving for the Gulf are
in the age of 20-30 years.
Table 2.2: Ethiopian legal migrants in the Gulf States since 1992-2001
Year Men Women Total
1992 1,794 1,688 3,482
1993 2,112 1,020 3,132
1994 251 1 252
1995 397 298 695
1996 803 356 1,159
1997 1,186 728 1,914
1998 757 894 1,651
2000/2001 - 1,163 1,163
Total 7,300 6,148 13,448
Source: Ministry of Labor and Social Affairs quoted in Atnafu, 2008
-
20,000
40,000
60,000
80,000 Ethiopian Migrants
1
2.3. International and National Legislations about Migration
The fact that migration concerns different states and countries makes it a complicated subject
with respect to instilling and enforcing certain principles. Setting up different laws concerning
migration requires the tandem efforts of different countries recognizing the common importance
of treating migrants properly. Migrants and their families are sometimes subject to different
types of unfair treatments in the host countries. This may be in terms of discrimination in work
places, intolerance of their culture and poor living conditions. Different types of migrants face
different difficulties and should be seen distinctly. There are labor migrants, refugees and asylum
seekers. The nature of migration for the three groups is different. Labor migrants go to the host
country looking for employment while refugees migrate because of fear of persecution in their
country of nationality.
To address this problem different efforts have been made worldwide. In July 1951, a convention
relating to the status of refugees was signed in the United Nations. Underlined in this convention
are principles in the treatment of refugees and stateless persons. Provisions are included that bind
both refugees and the country they find themselves in. Article 2 of this convention states that
refugees should abide by the laws of the country in which they seek refuge. Articles 3 to 11 state
general provisions and provisions specific to certain category of refugees. Some of the general
ones include non-discrimination based on race, religion, political opinion; the right to practice
religion; the provision of human rights and other provisions.
In July 2003, the International Convention on the Protection of the Rights of All Migrant
Workers and Members of Their Families came into force. It was ratified by 33 countries by
2005. The main focus of the convention is to raise issues that relate human rights with migration.
This convention is a result of years of discussion that began in 1972. It has a number of
provisions including, non discrimination with respect to rights, and human rights to all migrants
(both regular and irregular migrants), the promotion of sound, equitable and humane conditions
in connection with international migration, and others.
Some countries devise specific policies for migrants to effectively use the advantages of
migration and minimize the disadvantages. One of such policies is the ―Temporary Migration‖
policy adopted in some countries. A paper by Mohammed Amin (2007) talked about ensuring
temporariness of migration by enhancing the cooperation of the origin and the host countries. In
most developing countries migration seems to be skewed towards skilled labor force hurting the
human capital base of sender countries. On the other side, developed countries don‘t want above
a certain level of unskilled people in their countries. Temporariness of migration could alleviate
the impacts of both of the conditions above since the developing countries won‘t lose their
productive human capital if the migration is temporary. At the same time developed countries

1
wouldn‘t mind having more unskilled migrants if it is temporary. However, temporariness could
only be achieved if there is cooperation between the country of origin of the migrants and the
host country.
The policy framework in Ethiopia regarding migration is very weak. There is no distinct
migration policy except the Private Employment Agency Proclamation of the Ministry of Labor
and Social Affairs that deals only with agencies that facilitate employment of Ethiopians abroad.
The motivation of the proclamation itself concerns the protection and safety of Ethiopians sent
and employed abroad. This proclamation stipulates the preconditions necessary to obtain a
license to establish an agency that facilitates employment of Ethiopians abroad. It also requires
the agency to establish an office in Ethiopia and a branch in the country it intends to send the
workers. The Ministry obliges the agency that it has to give proper orientation to the worker
before the contract is signed; facilitate remittance of earnings according to the law of the country
of work; annually report to the Ministry about the condition of the worker; keep appropriate
records of the worker; and upon termination of work contract notify the nearby embassy about
the condition of the worker.
The proclamation also clearly states that the work should fulfill the minimum conditions of work
given in the Ethiopian Law. With regard to penalties, the proclamation states that whosoever
engages in illegally transferring people without a license will face imprisonment of up to 10
years and a fine up to Birr 25,000. In the case where the rights of the Ethiopian have been
violated in the country of work, the punishment could extend to up to 20 years of imprisonment
and a fine of Birr 50,000. Other than this proclamation that deals with employment agencies
there is no specific policy or strategy that officially guides the government regarding migrants.
2.4. Remittance Transfer and Channels in Ethiopia
Ethiopian migrants are engaged in various occupations in different countries. For instance, in
USA, according to the 2000 US Census, 30.6%, 26.6%, 20.5% and 19.3% of Ethiopian migrants
are engaged in sales & office, management & professional, service occupation and production &
transportation respectively. Similarly, as reported in Agnarson (2006), the share of Ethiopian
migrants in Europe in paying works has increased in recent years. On the contrary, most of the
male migrants in the Gulf participated as drivers. Of course, some are employed as factory
workers, mechanics, laborers, farmers, guards and waiters and in very few cases in such
professions as engineers and accountants. Regarding women workers in the Gulf, they are often
recruited to work as housemaids except in few cases where they are hired as waitress.
The major channel that Ethiopian migrants could contribute to the country‘s development and
poverty reduction is through remittance. Remittance is the major source of foreign exchange in
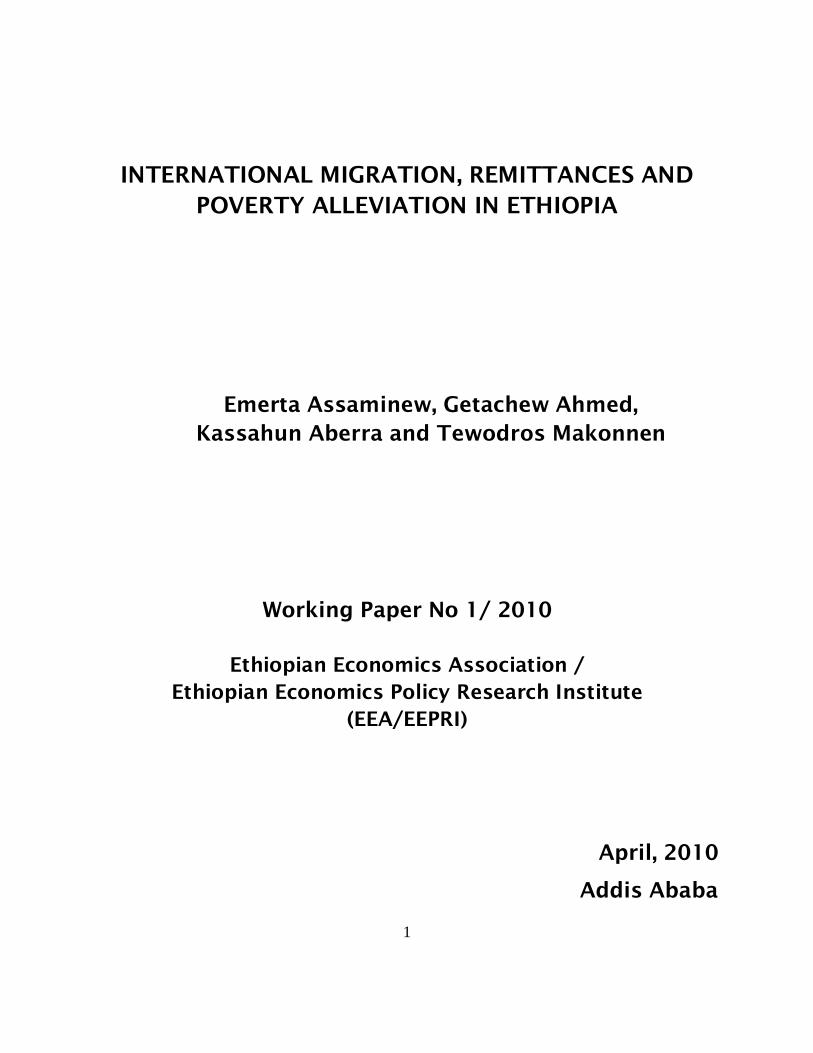
Ethiopia. According to the National bank of Ethiopia, USD 1.8 billion was received from private
1
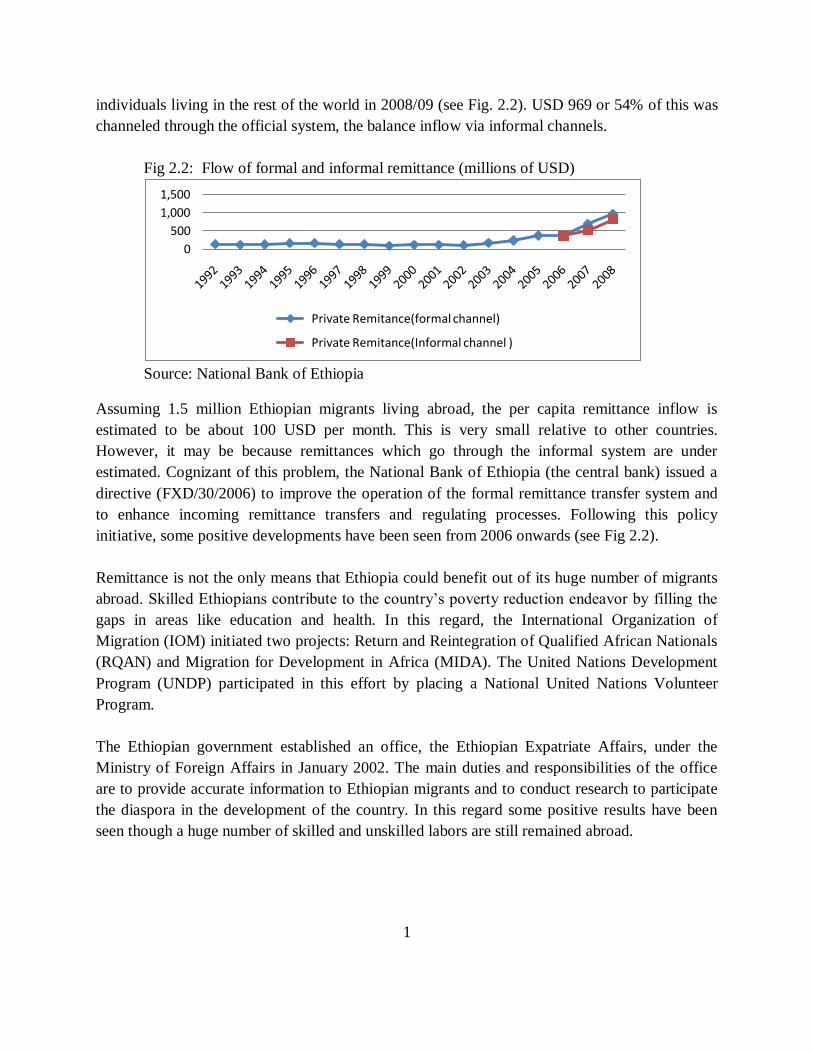
individuals living in the rest of the world in 2008/09 (see Fig. 2.2). USD 969 or 54% of this was
channeled through the official system, the balance inflow via informal channels.
Fig 2.2: Flow of formal and informal remittance (millions of USD)
Source: National Bank of Ethiopia
Assuming 1.5 million Ethiopian migrants living abroad, the per capita remittance inflow is
estimated to be about 100 USD per month. This is very small relative to other countries.
However, it may be because remittances which go through the informal system are under
estimated. Cognizant of this problem, the National Bank of Ethiopia (the central bank) issued a
directive (FXD/30/2006) to improve the operation of the formal remittance transfer system and
to enhance incoming remittance transfers and regulating processes. Following this policy
initiative, some positive developments have been seen from 2006 onwards (see Fig 2.2).
Remittance is not the only means that Ethiopia could benefit out of its huge number of migrants
abroad. Skilled Ethiopians contribute to the country‘s poverty reduction endeavor by filling the
gaps in areas like education and health. In this regard, the International Organization of
Migration (IOM) initiated two projects: Return and Reintegration of Qualified African Nationals
(RQAN) and Migration for Development in Africa (MIDA). The United Nations Development
Program (UNDP) participated in this effort by placing a National United Nations Volunteer
Program.
The Ethiopian government established an office, the Ethiopian Expatriate Affairs, under the
Ministry of Foreign Affairs in January 2002. The main duties and responsibilities of the office
are to provide accurate information to Ethiopian migrants and to conduct research to participate
the diaspora in the development of the country. In this regard some positive results have been
seen though a huge number of skilled and unskilled labors are still remained abroad.
0
500
1,000
1,500
Private Remitance(formal channel)
Private Remitance(Informal channel )

1
3. The Macroeconomic Impact of International Remittances in
Ethiopia
Resource poor developing countries are constrained by lack of foreign exchange to finance the
increasing demand for imports associated with domestic investment requirements. For many of
these countries, remittances constitute the larger part of foreign exchange earnings; sometimes
larger than aid, foreign direct investments and export revenues. The past few decades have
witnessed rapid increase in the international flow of remittances all over the world. Remittances
have recently become the second largest source of foreign exchange both as a percentage of GDP
and in absolute terms globally (see Giuliano and Ruiz-Arranz, 2005). Remittances, therefore,
become a relatively attractive source of foreign exchange earnings for developing countries.
Nevertheless, little attention has been paid to analyze the economic impact of these financial
transfers, especially on economic growth and poverty reduction. There is also very little effort
exerted in some of the developing countries with many migrants to collect as much foreign
currency as possible through remittances as their effort through exports. Likewise, despite the
gradually increasing level of remittance inflows to Ethiopia, little attention was given to
appreciate the impact of remittances on growth and hence poverty reduction. Thus, this particular
section will contribute to two strands of the literature in developing countries: one, on the
literature that links remittances to production and growth, and two, on the literature that
associates remittances and their role on poverty reduction in poor countries.
3.1. Remittances in Ethiopia: A Snapshot
1
Broadly speaking, remittances are thought of as unrequited transfers, sent by migrant workers
back to their relatives in their country of origin. Based on the IMF‘s balance of payments
manual, there are three components generally mentioned as constituting remittances, namely
compensation of employees (part of the income component of the current account), worker‘s
remittances (part of current transfers in the current account) and migrants‘ transfer (part of the
capital account). Workers‘ remittances are current private transfers from migrant workers who
are considered resident of the host country to recipients in their country of origin. If the migrants
live in the host country for a year or longer, they are considered residents, regardless of their
immigration status. If the migrants have lived in the host country for less than a year, their entire
income in the host country should be classified as compensation of employees. Migrants‘
transfers include financial items that arise from the migration (change of residence) of
individuals from one economy to another.
Despite the clarity of the guiding definition of remittances by IMF, there have been limitations
on the coverage and availability of long time series data for a developing country like Ethiopia.
As mentioned in the previous section, a good sum of the remittances is still being channeled
through unofficial mechanisms including through black market, the exchange rate premium
being one of the causes. Existing data shows that the official individual international transfers in
Ethiopia reached US$ 1,784 million in 2008 increasing year-on-year by 33.3 percent on average
from US$ 41.3 million in 1990. Remittance grew by higher rate than the economic growth over
the same period (which is 4.6 percent).
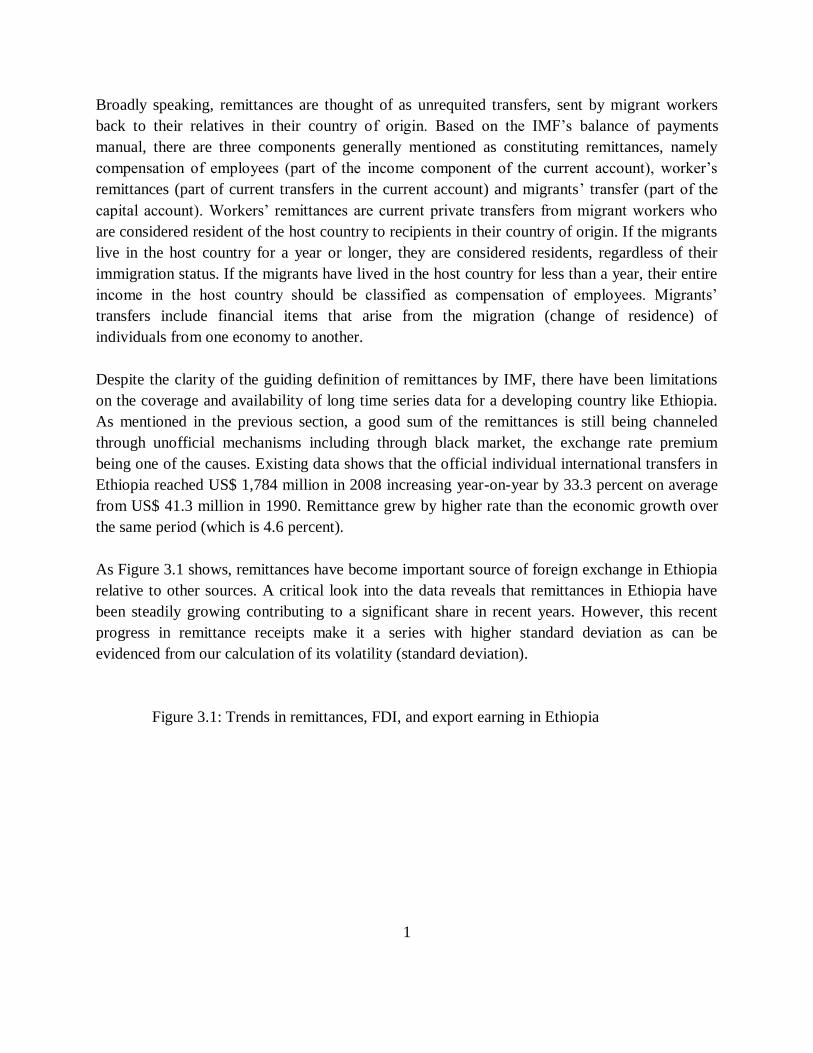
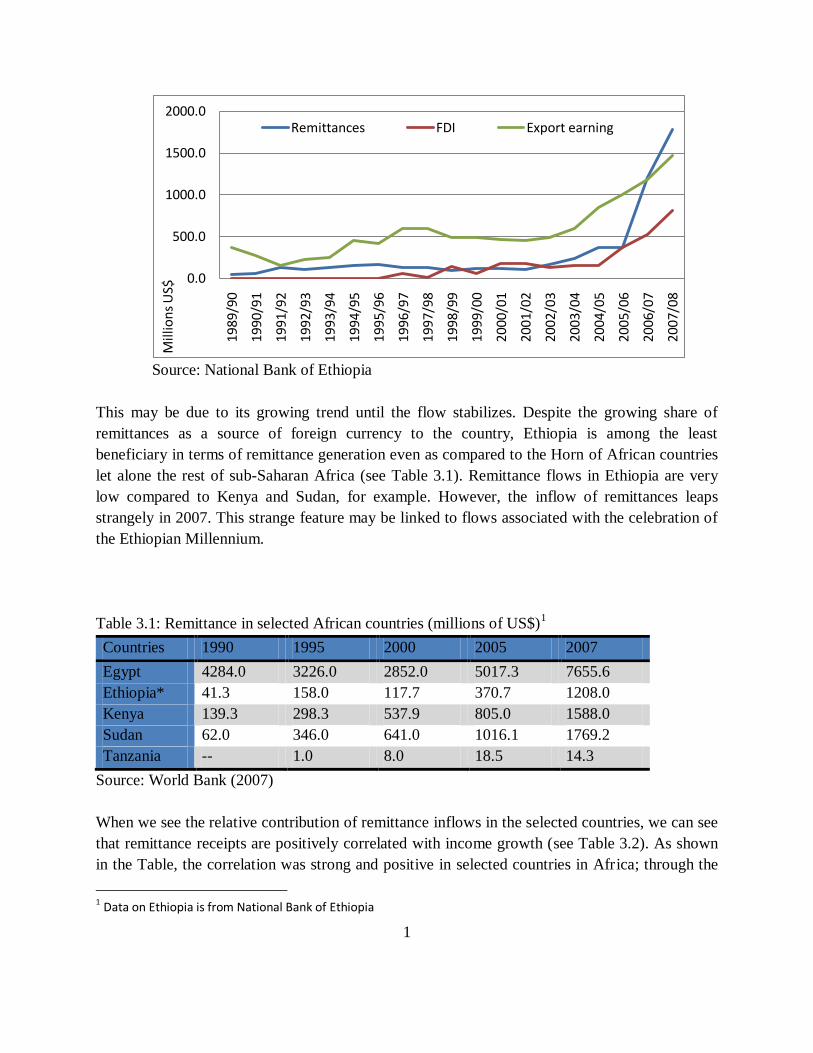
As Figure 3.1 shows, remittances have become important source of foreign exchange in Ethiopia
relative to other sources. A critical look into the data reveals that remittances in Ethiopia have
been steadily growing contributing to a significant share in recent years. However, this recent
progress in remittance receipts make it a series with higher standard deviation as can be
evidenced from our calculation of its volatility (standard deviation).
Figure 3.1: Trends in remittances, FDI, and export earning in Ethiopia
1
Source: National Bank of Ethiopia
This may be due to its growing trend until the flow stabilizes. Despite the growing share of
remittances as a source of foreign currency to the country, Ethiopia is among the least
beneficiary in terms of remittance generation even as compared to the Horn of African countries
let alone the rest of sub-Saharan Africa (see Table 3.1). Remittance flows in Ethiopia are very
low compared to Kenya and Sudan, for example. However, the inflow of remittances leaps
strangely in 2007. This strange feature may be linked to flows associated with the celebration of
the Ethiopian Millennium.
Table 3.1: Remittance in selected African countries (millions of US$)1
Countries 1990 1995 2000 2005 2007
Egypt 4284.0 3226.0 2852.0 5017.3 7655.6
Ethiopia* 41.3 158.0 117.7 370.7 1208.0
Kenya 139.3 298.3 537.9 805.0 1588.0
Sudan 62.0 346.0 641.0 1016.1 1769.2
Tanzania -- 1.0 8.0 18.5 14.3
Source: World Bank (2007)
When we see the relative contribution of remittance inflows in the selected countries, we can see
that remittance receipts are positively correlated with income growth (see Table 3.2). As shown
in the Table, the correlation was strong and positive in selected countries in Africa; through the
1 Data on Ethiopia is from National Bank of Ethiopia
0.0
500.0
1000.0
1500.0
2000.0
1989
/90
1990
/91
19
91
/92
19
92
/93
19
93
/94
19
94
/95
19
95
/96
19
96
/97
19
97
/98
19
98
/99
19
99
/00
20
00
/01
20
01
/02
20
02
/03
20
03
/04
20
04
/05
20
05
/06
20
06
/07
20
07
/08
Mill
ion
s U
S$
Remittances FDI Export earning

1
causality issue is not discussed here. In some countries it is possible to expect negative
correlation between the two due to an implied counter cyclicality of remittance flows relative to
the country‘s income.
Table 3.2: The correlation coefficient between remittance flow and economic
growth in selected countries
Countries Correlation Sign
Egypt 0.77 Positive
Ethiopia 0.56 Positive
Kenya 0.79 Positive
Sudan 0.33 Positive
Tanzania 0.63 Positive
Source: World Bank (2007) and own computation
3.2. A Simple Accounting Framework for Remittance Flows
This section attempts to identify possible scenarios for the macroeconomic impact of remittance
flows in a small open economy like Ethiopia. Berg et al. (2006) provided a full-fledged
theoretical model on the macroeconomic impact of aid flows in an economy. However, in this
paper, following the work of Hansen and Headey (2009), we rather adopt an accounting
approach by using balance-of-payments and the national accounts system as an organizing
framework. The main purpose of our effort is to clearly identify the channels by which increases
in remittance inflows can affect macroeconomic aggregates, and hence the macro economy and
poverty. Unlike Berg et al. (2007), we here follow a simple macroeconomic framework to reveal
the possible impact of remittance inflow on macro variables (economy wide aggregates) from
which we will be inferring the impact of private remittance inflows on national poverty.
3.2.1. Remittance Flow from Private Individuals in the Ethiopian Balance of
Payments
Transfers in Ethiopia are classified as official and private. Individual/private transfers are best
termed as remittance. Hence, we can specify the following balance-of-payments identities for the
Ethiopian economy by specifying it in a useful manner for our purpose:
g
ttttttttt ADrLiWMXCA )()(11
…………………………….[1]
)(r
t
l
t
o
tt AALKA ……….………………………………………[2]

1
The current account at a certain time ( tCA ) is defined as the net export of goods and services
(export, X , less import, M ) plus net private transfers (W ), mainly remittances and worker
compensation less net interest payments to foreigners ( rDiL ), with interest payments on
market loans ( iL ) separated from interest payments on concessional aid loans ( rD ). The final
term in the current accounts definition [1] is that of aid grants ( gA ). In equation [2], the capital
account ( KA) is specified simply as the net change in non-aid foreign debt ( oL ), which has both
private and public elements, plus the foreign aid loan given within the year ( iA ), less repayments
of principal on the aid loans (amortizations).
Using the fact that the difference between the current account and the capital account equals the
change in foreign reserves ( R ), we have the following decomposition of the overall balance-of
payments:
0
11 )()( tttttttt
l
t
g
t
r
t LDrLiXMRAAAW..…… [3]
In the above identity, we have remittance (W ) in the left hand side. The identity implies that
from a purely accounting perspective, an increase in the private remittance can influence the
economy in five various ways. Remittances may: (i) increase foreign reserves; (ii) increase net
imports of goods and services; (iii) finance interest payments on foreign debt (both aid and non-
aid debt); (iv) finance a decrease in net aid inflows; and (v) decrease net external debt (or
increase capital flight).
In countries with foreign exchange shortages such as Ethiopia, there must be some kind of
optimal way of ‗distributing‘ the remittance inflow across the balance of payments (BoPs)
components shown above, as remittance increases are often observed under a variety of different
circumstances (e.g. macroeconomic crises at home). The most common use of remittances is to
fund for an increase in net imports. Therefore, we define the rate of absorption of an increase in
remittance as the increase in net imports relative to the increase in remittance. Letting denote
change over time, absorption of remittance in a given period can be specified as:
t
tt
W
XMAbsorbtion
)(
……………………….. [4]
Equation [4] reveals that absorption can be seen as a measure of the direct, real resource transfer
associated with an increase in the remittance inflow. Remittance inflow affects absorption
through its impact on demand for private sector imports via aggregate demand.
1
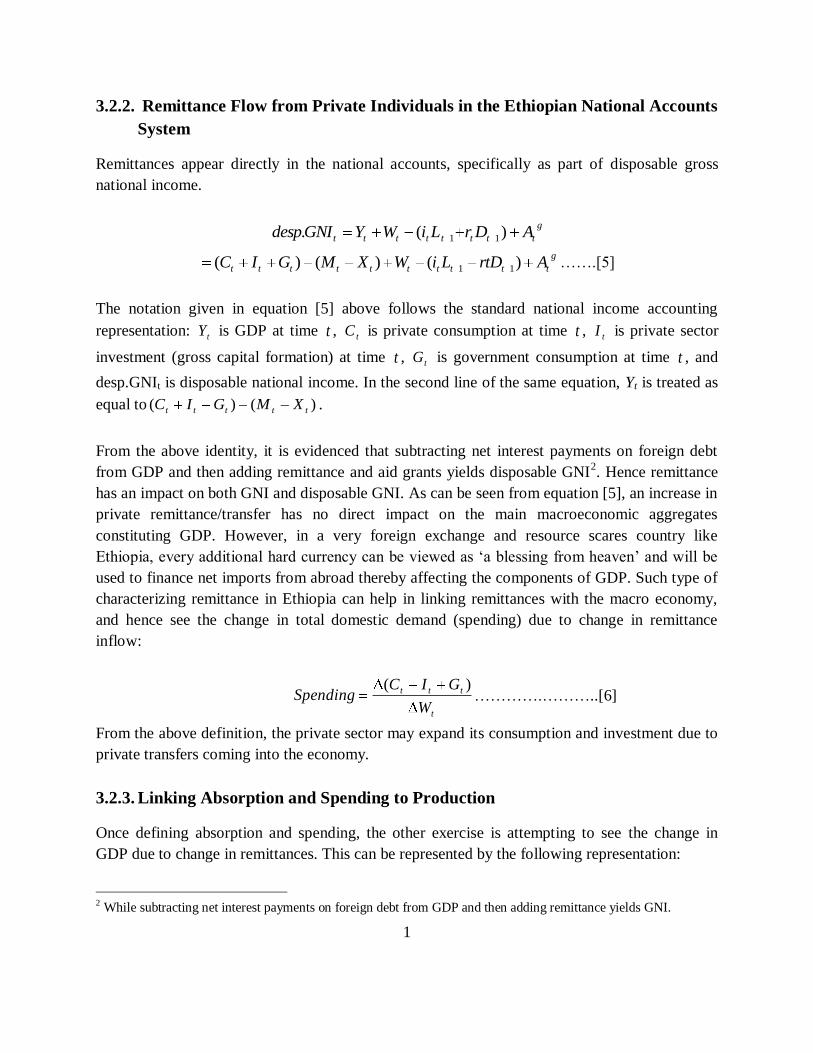
3.2.2. Remittance Flow from Private Individuals in the Ethiopian National Accounts
System
Remittances appear directly in the national accounts, specifically as part of disposable gross
national income.
g
tttttttt ADrLiWYGNIdesp )(. 11
g
tttttttttt ArtDLiWXMGIC )()()( 11 …….[5]
The notation given in equation [5] above follows the standard national income accounting
representation: tY is GDP at time t , tC is private consumption at time t , tI is private sector
investment (gross capital formation) at time t , tG is government consumption at time t , and
desp.GNIt is disposable national income. In the second line of the same equation, Yt is treated as
equal to )()( ttttt XMGIC .
From the above identity, it is evidenced that subtracting net interest payments on foreign debt
from GDP and then adding remittance and aid grants yields disposable GNI2. Hence remittance
has an impact on both GNI and disposable GNI. As can be seen from equation [5], an increase in
private remittance/transfer has no direct impact on the main macroeconomic aggregates
constituting GDP. However, in a very foreign exchange and resource scares country like
Ethiopia, every additional hard currency can be viewed as ‗a blessing from heaven‘ and will be
used to finance net imports from abroad thereby affecting the components of GDP. Such type of
characterizing remittance in Ethiopia can help in linking remittances with the macro economy,
and hence see the change in total domestic demand (spending) due to change in remittance
inflow:
t
ttt
W
GICSpending
)(………….………..[6]
From the above definition, the private sector may expand its consumption and investment due to
private transfers coming into the economy.
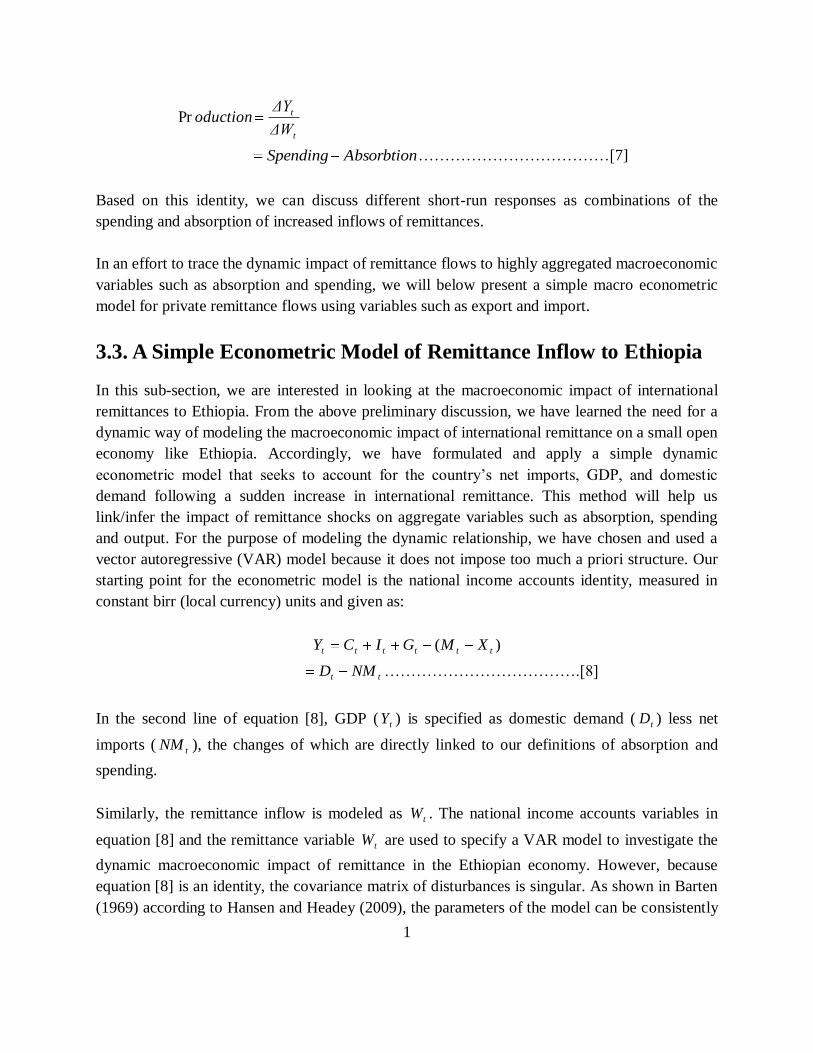
3.2.3. Linking Absorption and Spending to Production
Once defining absorption and spending, the other exercise is attempting to see the change in
GDP due to change in remittances. This can be represented by the following representation:
2 While subtracting net interest payments on foreign debt from GDP and then adding remittance yields GNI.
1
t
t
ΔW
ΔYoductionPr
AbsorbtionSpending ………………………………[7]
Based on this identity, we can discuss different short-run responses as combinations of the
spending and absorption of increased inflows of remittances.
In an effort to trace the dynamic impact of remittance flows to highly aggregated macroeconomic
variables such as absorption and spending, we will below present a simple macro econometric
model for private remittance flows using variables such as export and import.
3.3. A Simple Econometric Model of Remittance Inflow to Ethiopia
In this sub-section, we are interested in looking at the macroeconomic impact of international
remittances to Ethiopia. From the above preliminary discussion, we have learned the need for a
dynamic way of modeling the macroeconomic impact of international remittance on a small open
economy like Ethiopia. Accordingly, we have formulated and apply a simple dynamic
econometric model that seeks to account for the country‘s net imports, GDP, and domestic
demand following a sudden increase in international remittance. This method will help us
link/infer the impact of remittance shocks on aggregate variables such as absorption, spending
and output. For the purpose of modeling the dynamic relationship, we have chosen and used a
vector autoregressive (VAR) model because it does not impose too much a priori structure. Our
starting point for the econometric model is the national income accounts identity, measured in
constant birr (local currency) units and given as:
)( tttttt XMGICY
tt NMD ……………………………….[8]
In the second line of equation [8], GDP ( tY ) is specified as domestic demand ( tD ) less net
imports ( tNM ), the changes of which are directly linked to our definitions of absorption and
spending.
Similarly, the remittance inflow is modeled as tW . The national income accounts variables in
equation [8] and the remittance variable tW are used to specify a VAR model to investigate the
dynamic macroeconomic impact of remittance in the Ethiopian economy. However, because
equation [8] is an identity, the covariance matrix of disturbances is singular. As shown in Barten
(1969) according to Hansen and Headey (2009), the parameters of the model can be consistently
1
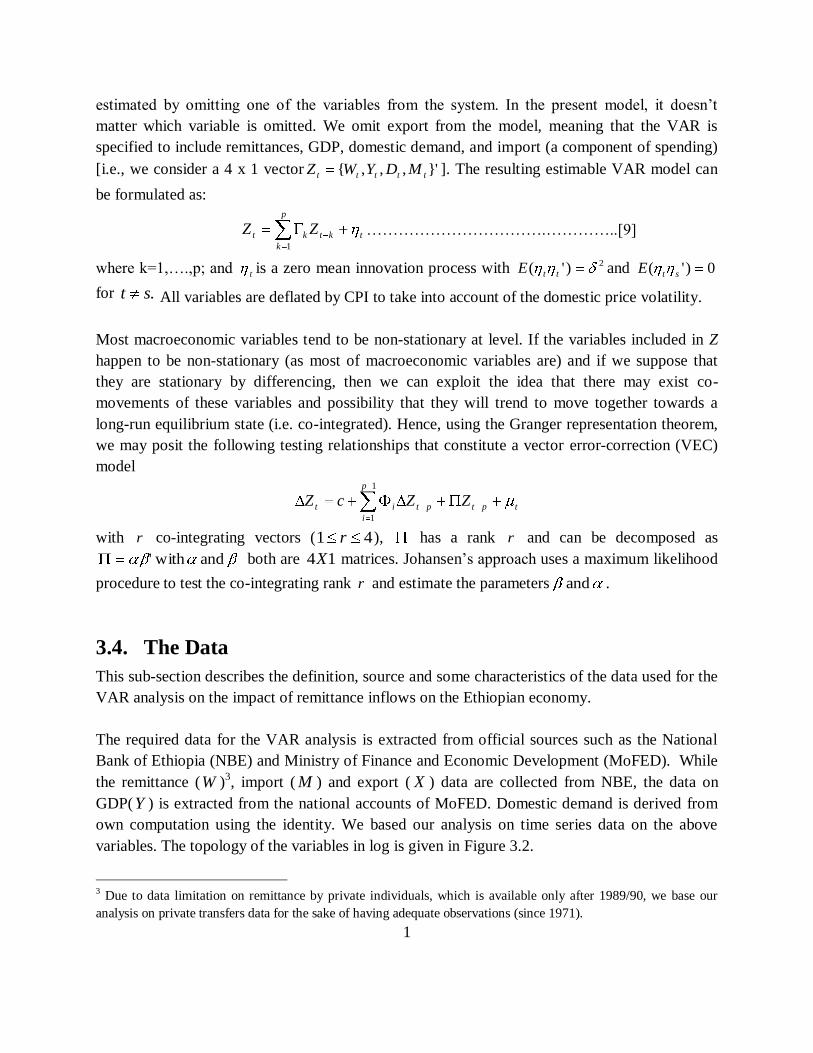
estimated by omitting one of the variables from the system. In the present model, it doesn‘t
matter which variable is omitted. We omit export from the model, meaning that the VAR is
specified to include remittances, GDP, domestic demand, and import (a component of spending)
[i.e., we consider a 4 x 1 vector }',,,{ ttttt MDYWZ ]. The resulting estimable VAR model can
be formulated as:
t
p
k
ktkt ZZ1
…………………………….…………..[9]
where k=1,….,p; and t is a zero mean innovation process with 2)'( ttE and 0)'( stE
for .st All variables are deflated by CPI to take into account of the domestic price volatility.
Most macroeconomic variables tend to be non-stationary at level. If the variables included in Z
happen to be non-stationary (as most of macroeconomic variables are) and if we suppose that
they are stationary by differencing, then we can exploit the idea that there may exist co-
movements of these variables and possibility that they will trend to move together towards a
long-run equilibrium state (i.e. co-integrated). Hence, using the Granger representation theorem,
we may posit the following testing relationships that constitute a vector error-correction (VEC)
model
tpt
p
i
ptit ZZcZ1
1
with r co-integrating vectors ( 41 r ), has a rank r and can be decomposed as
and with ' both are 14X matrices. Johansen‘s approach uses a maximum likelihood
procedure to test the co-integrating rank r and estimate the parameters and .
3.4. The Data
This sub-section describes the definition, source and some characteristics of the data used for the
VAR analysis on the impact of remittance inflows on the Ethiopian economy.
The required data for the VAR analysis is extracted from official sources such as the National
Bank of Ethiopia (NBE) and Ministry of Finance and Economic Development (MoFED). While
the remittance (W )3, import ( M ) and export ( X ) data are collected from NBE, the data on
GDP(Y ) is extracted from the national accounts of MoFED. Domestic demand is derived from
own computation using the identity. We based our analysis on time series data on the above
variables. The topology of the variables in log is given in Figure 3.2.
3 Due to data limitation on remittance by private individuals, which is available only after 1989/90, we base our
analysis on private transfers data for the sake of having adequate observations (since 1971).
1
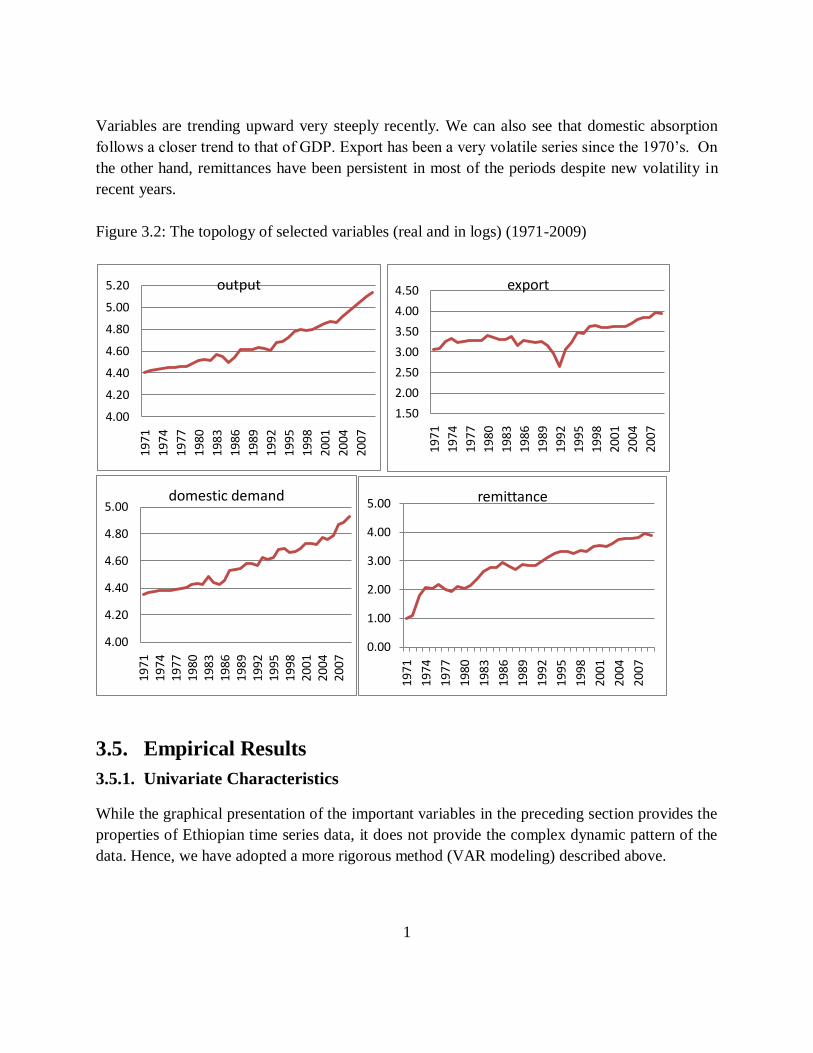
Variables are trending upward very steeply recently. We can also see that domestic absorption
follows a closer trend to that of GDP. Export has been a very volatile series since the 1970‘s. On
the other hand, remittances have been persistent in most of the periods despite new volatility in
recent years.
Figure 3.2: The topology of selected variables (real and in logs) (1971-2009)
3.5. Empirical Results
3.5.1. Univariate Characteristics
While the graphical presentation of the important variables in the preceding section provides the
properties of Ethiopian time series data, it does not provide the complex dynamic pattern of the
data. Hence, we have adopted a more rigorous method (VAR modeling) described above.
4.00
4.20
4.40
4.60
4.80
5.00
5.20
1971
1974
1977
1980
1983
1986
1989
1992
1995
1998
2001
2004
2007
output
1.50
2.00
2.50
3.00
3.50
4.00
4.50
19
71
19
74
19
77
19
80
19
83
19
86
19
89
19
92
19
95
19
98
20
01
20
04
20
07
export
4.00
4.20
4.40
4.60
4.80
5.00
1971
1974
1977
1980
1983
1986
1989
1992
1995
1998
2001
2004
2007
domestic demand
0.00
1.00
2.00
3.00
4.00
5.00
1971
1974
1977
1980
1983
1986
1989
1992
1995
1998
2001
2004
2007
remittance
1
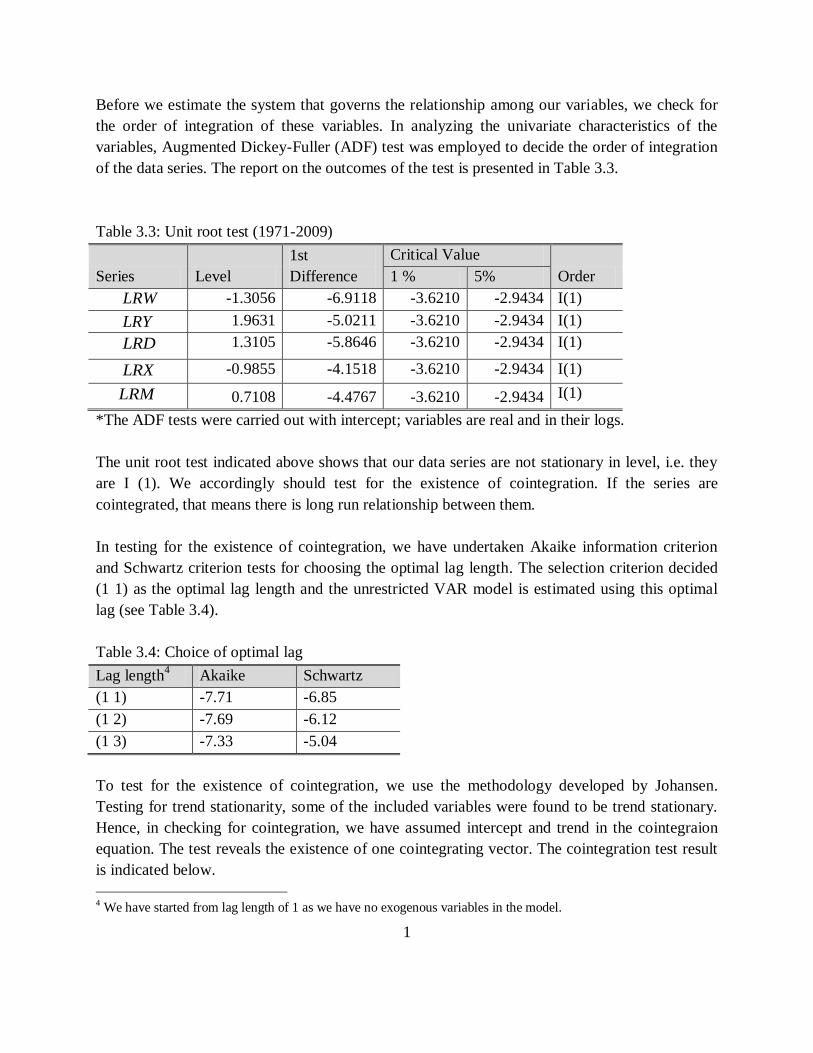
Before we estimate the system that governs the relationship among our variables, we check for
the order of integration of these variables. In analyzing the univariate characteristics of the
variables, Augmented Dickey-Fuller (ADF) test was employed to decide the order of integration
of the data series. The report on the outcomes of the test is presented in Table 3.3.
Table 3.3: Unit root test (1971-2009)
Series Level
1st
Difference
Critical Value
Order 1 % 5%
LRW -1.3056 -6.9118 -3.6210 -2.9434 I(1)
LRY 1.9631 -5.0211 -3.6210 -2.9434 I(1)
LRD 1.3105 -5.8646 -3.6210 -2.9434 I(1)
LRX -0.9855 -4.1518 -3.6210 -2.9434 I(1)
LRM 0.7108 -4.4767 -3.6210 -2.9434 I(1)
*The ADF tests were carried out with intercept; variables are real and in their logs.
The unit root test indicated above shows that our data series are not stationary in level, i.e. they
are I (1). We accordingly should test for the existence of cointegration. If the series are
cointegrated, that means there is long run relationship between them.
In testing for the existence of cointegration, we have undertaken Akaike information criterion
and Schwartz criterion tests for choosing the optimal lag length. The selection criterion decided
(1 1) as the optimal lag length and the unrestricted VAR model is estimated using this optimal
lag (see Table 3.4).
Table 3.4: Choice of optimal lag
Lag length4 Akaike Schwartz
(1 1) -7.71 -6.85
(1 2) -7.69 -6.12
(1 3) -7.33 -5.04
To test for the existence of cointegration, we use the methodology developed by Johansen.
Testing for trend stationarity, some of the included variables were found to be trend stationary.
Hence, in checking for cointegration, we have assumed intercept and trend in the cointegraion
equation. The test reveals the existence of one cointegrating vector. The cointegration test result
is indicated below.
4 We have started from lag length of 1 as we have no exogenous variables in the model.

1
Table 3.5: Unrestricted Cointegration Rank Test (Trace)
Sample (adjusted): 1973 2009
Included observations: 37 after adjustments
Series: LRW LRD LRY LRM
Lags interval (in first differences): 1 to 1
Unrestricted Cointegration Rank Test (Trace)
Hypothesized Trace 0.05
No. of CE(s) Eigen value Statistic Critical Value Prob.**
None * 0.544223 66.96163 63.87610 0.0269
At most 1 0.486670 37.88885 42.91525 0.1454
At most 2 0.225047 13.21593 25.87211 0.7212
At most 3 0.097182 3.782656 12.51798 0.7733
Trace test indicates 1 cointegrating eqn(s) at the 0.05 level
* denotes rejection of the hypothesis at the 0.05 level
**MacKinnon-Haug-Michelis (1999) p-values
Given our assumptions, we have found cointegrating relationship. We have verified the existence
of cointegration among our non-stationary series and can proceed to the VEC specification. An
important application of interest to accomplish using the VEC approach is conducting the short-
run impulse response analysis and variance decomposition to innovations. In the following part
we have analyzed the adjustment of important macroeconomic variables to remittance shocks
using impulse response representation. The long-term relationship among the variables based on
the unrestricted VAR is provided as annex. The variables were estimated in logs.
3.5.2. Impulse Response Function
An impulse response function traces out the effect of a one standard deviation shock to one of
the innovations on current and future values of the endogenous variables. A shock to the ith
variable directly affects the ith
variable, and is also transmitted to all of the endogenous variables
through the dynamic structure of the VEC.
Table 3.6 provides the response of all variables to a one standard deviation shock of remittance
inflows. It shows how variables included in the model are responding to a one standard deviation
(increment) in remittance flows at a certain point, given the dynamic relationship modeled. The
impulse response function based on the VEC analysis reveals that remittance responds highly
during the first year after its own shock. Specifically, the impact persists for the first year before

1
it shows a quick decline during the succeeding two years. After reviving in the fifth period, it
maintains its rate. The shock remained to have a positive impact all over the period considered.
This implies that Ethiopia cannot assume a certain increment in remittance flow as smooth and
permanent shock as it is fluctuating after the shock. On the other hand, domestic demand is not
quickly reacting to a certain standard deviation in the remittance variable. However, through
time, domestic demand reacted positively (but volatile) to the innovation in the remittance
variable to reach its maximum in the third period.
Table 3.6: Effects of Cholesky (d.f. adjusted) one S.D. remittance innovation (real variables)
Period
Log
remittance
Log
domestic
demand Log GDP Log import
1 0.243507 0.007351 0.013000 0.059218
2 0.266721 0.019420 0.028068 0.088395
3 0.243077 0.020769 0.031854 0.100770
4 0.235449 0.018473 0.029357 0.094428
5 0.241757 0.017320 0.027661 0.090016
6 0.246297 0.017621 0.027829 0.090218
7 0.246159 0.018035 0.028362 0.091568
8 0.244881 0.018088 0.028490 0.091941
9 0.244515 0.017991 0.028384 0.091693
10 0.244751 0.017944 0.028315 0.091508
The impulse response of imports (the component of spending) to a one standard-deviation
innovation to remittance shocks mirrors the response of domestic demand. Imports expand in the
second period after the shock and reached its maximum in the third period. The rate consistently
declines up to the fifth period. The impact of a one standard-error shock maintains its level all
through the period considered. Given the level of export, this implies that a surge in remittance
flows increases the importing capacity (spending) of the foreign exchange scarce economy of
Ethiopia. Like domestic demand and imports, GDP is volatile as a result of remittance shock in
the first four years; taking an increasing rate up to the third year and then declining up to the fifth
period. The response of output for any remittance innovation is owing to the impact on domestic
demand and spending as a result of shocks in private remittance.
3.5.3. Variance Decomposition Results
Variance decomposition is another method of depicting the system dynamics. In contrast to
impulse response function which depicts the effects of a shock to one endogenous variable on to
1
the other variables in the VAR, variance decomposition separates the variation in an endogenous
variable into the component shocks to the VAR. It gives information about the relative
importance of the random innovation to the variable in the VAR. More specifically, variance
decomposition shows the proportion of shocks in the remittance innovation attributed to all
endogenous variables included in the model.
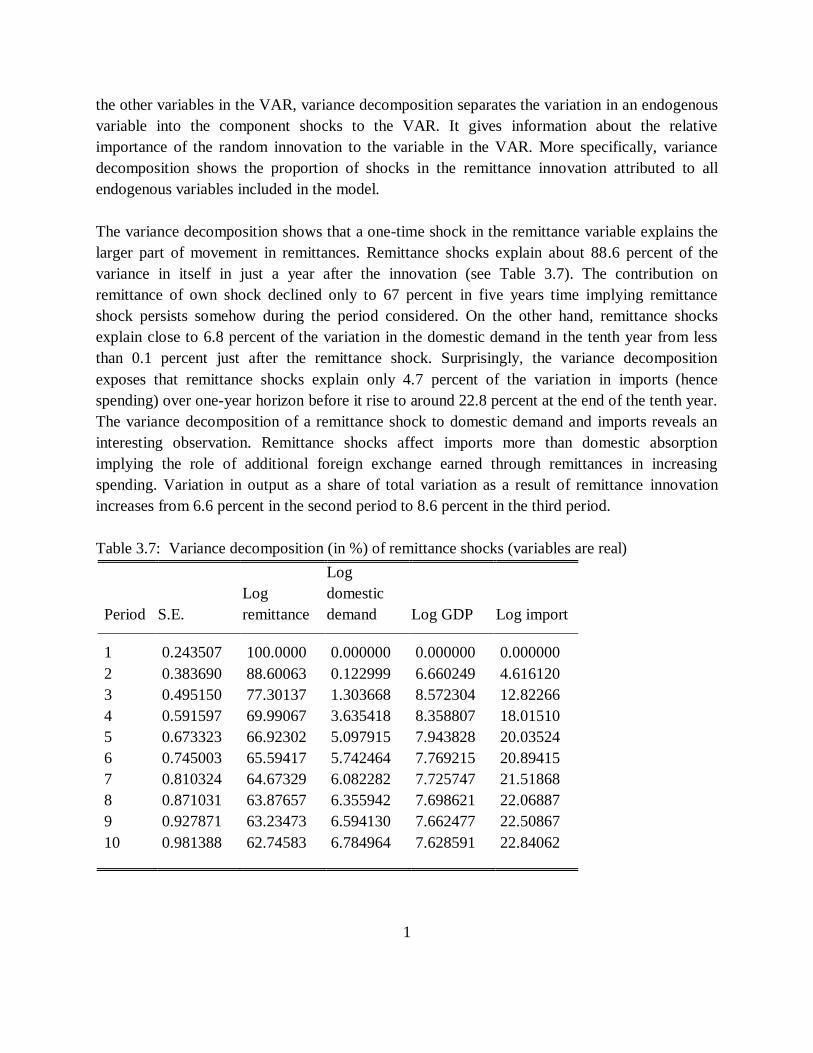
The variance decomposition shows that a one-time shock in the remittance variable explains the
larger part of movement in remittances. Remittance shocks explain about 88.6 percent of the
variance in itself in just a year after the innovation (see Table 3.7). The contribution on
remittance of own shock declined only to 67 percent in five years time implying remittance
shock persists somehow during the period considered. On the other hand, remittance shocks
explain close to 6.8 percent of the variation in the domestic demand in the tenth year from less
than 0.1 percent just after the remittance shock. Surprisingly, the variance decomposition
exposes that remittance shocks explain only 4.7 percent of the variation in imports (hence
spending) over one-year horizon before it rise to around 22.8 percent at the end of the tenth year.
The variance decomposition of a remittance shock to domestic demand and imports reveals an
interesting observation. Remittance shocks affect imports more than domestic absorption
implying the role of additional foreign exchange earned through remittances in increasing
spending. Variation in output as a share of total variation as a result of remittance innovation
increases from 6.6 percent in the second period to 8.6 percent in the third period.
Table 3.7: Variance decomposition (in %) of remittance shocks (variables are real)
Period S.E.
Log
remittance
Log
domestic
demand Log GDP Log import
1 0.243507 100.0000 0.000000 0.000000 0.000000
2 0.383690 88.60063 0.122999 6.660249 4.616120
3 0.495150 77.30137 1.303668 8.572304 12.82266
4 0.591597 69.99067 3.635418 8.358807 18.01510
5 0.673323 66.92302 5.097915 7.943828 20.03524
6 0.745003 65.59417 5.742464 7.769215 20.89415
7 0.810324 64.67329 6.082282 7.725747 21.51868
8 0.871031 63.87657 6.355942 7.698621 22.06887
9 0.927871 63.23473 6.594130 7.662477 22.50867
10 0.981388 62.74583 6.784964 7.628591 22.84062
1
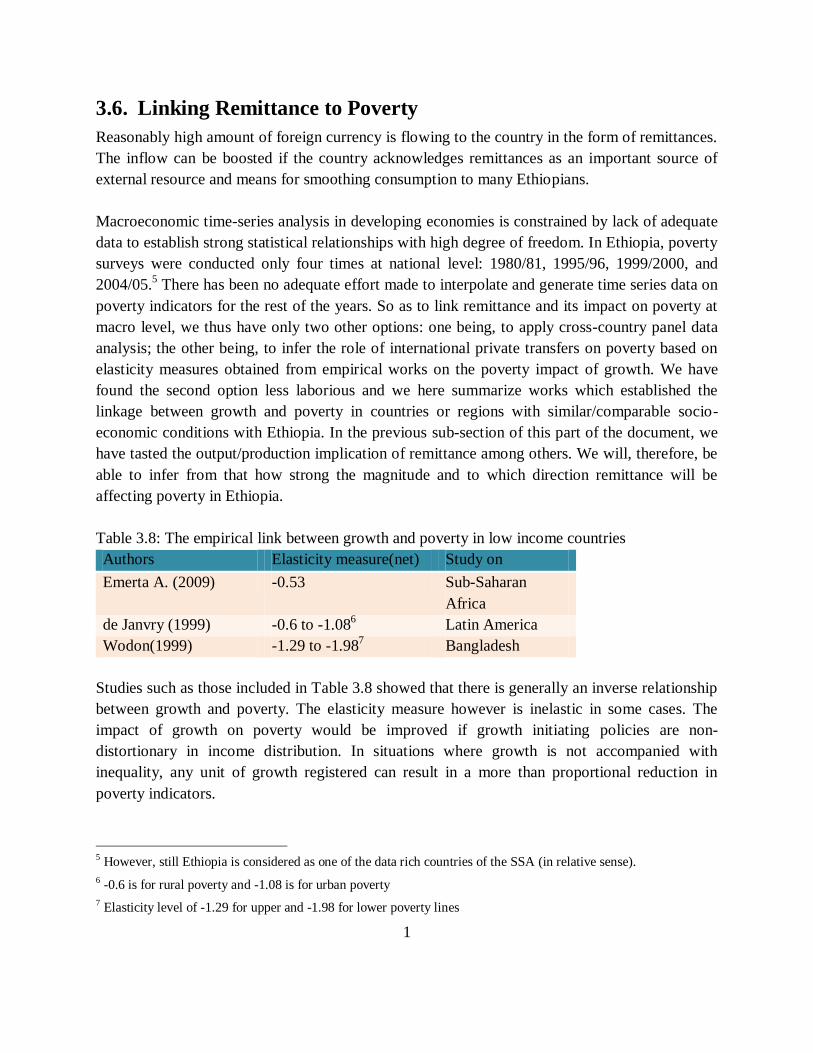
3.6. Linking Remittance to Poverty
Reasonably high amount of foreign currency is flowing to the country in the form of remittances.
The inflow can be boosted if the country acknowledges remittances as an important source of
external resource and means for smoothing consumption to many Ethiopians.
Macroeconomic time-series analysis in developing economies is constrained by lack of adequate
data to establish strong statistical relationships with high degree of freedom. In Ethiopia, poverty
surveys were conducted only four times at national level: 1980/81, 1995/96, 1999/2000, and
2004/05.5 There has been no adequate effort made to interpolate and generate time series data on
poverty indicators for the rest of the years. So as to link remittance and its impact on poverty at
macro level, we thus have only two other options: one being, to apply cross-country panel data
analysis; the other being, to infer the role of international private transfers on poverty based on
elasticity measures obtained from empirical works on the poverty impact of growth. We have
found the second option less laborious and we here summarize works which established the
linkage between growth and poverty in countries or regions with similar/comparable socio-
economic conditions with Ethiopia. In the previous sub-section of this part of the document, we
have tasted the output/production implication of remittance among others. We will, therefore, be
able to infer from that how strong the magnitude and to which direction remittance will be
affecting poverty in Ethiopia.
Table 3.8: The empirical link between growth and poverty in low income countries
Authors Elasticity measure(net) Study on
Emerta A. (2009) -0.53 Sub-Saharan
Africa
de Janvry (1999) -0.6 to -1.086 Latin America
Wodon(1999) -1.29 to -1.987 Bangladesh
Studies such as those included in Table 3.8 showed that there is generally an inverse relationship
between growth and poverty. The elasticity measure however is inelastic in some cases. The
impact of growth on poverty would be improved if growth initiating policies are non-
distortionary in income distribution. In situations where growth is not accompanied with
inequality, any unit of growth registered can result in a more than proportional reduction in
poverty indicators.
5 However, still Ethiopia is considered as one of the data rich countries of the SSA (in relative sense).
6 -0.6 is for rural poverty and -1.08 is for urban poverty
7 Elasticity level of -1.29 for upper and -1.98 for lower poverty lines

1
A more direct study on the impact of international remittances on poverty using a cross country
analysis is the one by Jongwanich (2007). Other things being equal, the author found that an
increase in remittances by 10 per cent leads to a reduction in poverty incidence by 2.8 per cent in
Developing Asia and the Pacific Countries. Using data from African countries, Anyanwu and
Erhijakpor (2009) also found that a 10 percent increase in official international remittances as a
percentage of GDP will lead, on average, to a 2.9 percent decline in the share of people living in
poverty. Indeed, this result provides strong, robust evidence of the poverty-reducing impact of
international remittances to Africa. Assuming a more or less similar transmission mechanism of
international remittances to poverty reduction in Ethiopia, we can affirm a strong poverty
reducing impact of international remittances in Ethiopia. Our assertion was supported by the
micro economic approach employed in the succeeding section of this document. The section also
supplements the analysis made in this sub-section.
1
4. Livelihood Consequences of Migration on the Welfare of
Households
As discussed in the preceding sections, migration has emerged as an important policy issue in
developing countries, with supporters advocating the many opportunities it offers to the
development of both the migrant sending and receiving economies. The transmission channels
through which migration and remittances impact various living standards and human capital
outcomes are numerous. The most obvious is the income channel, namely that remittances
directly contribute to total income of a household.
Remittances lead to increased consumption and investment, implying a positive effect on poverty
reduction and human capital (Sasin and McKenzie, 2007). Previous empirical findings show that
international remittances have an important source of improvement in the welfare of households
in Nepal (e.g. Subedi, 2009) and in Ghana (e.g. Quartey, 2006). Subedi (2009) showed that
remittance income is an important source of household income in Nepal. It accounts for about 11
percent of all households‘ income and more than two-thirds of the remittance recipient
households‘ income. Moreover, Quartey (2006) found that migrant remittances improve
household welfare and the flow of such remittances increase in times of economic shocks in
Ghana, hence they are counter-cyclical. Thus remittances help to minimize economic shocks that
reduce household welfare, particularly for food crop farmers. A study by Gupta et al. (2007)
confirm that a 10 percent rise in the remittances-to-GDP ratio is associated with a fall of a little
more than 1 percent in the percentage of people living on less than USD 1 a day.
As indicated in the previous sections, inflows of international remittances have been increasing
in Ethiopia for the last 15 years. Remittances through the formal banking system have grown for
the last 13 years although those in the form of commodity inflows have shown a downward
trend. Those transferred through the black market is expected to be much bigger.
Remittances directly augment the income of recipient households by providing financial
resources for poor households. They affect poverty and welfare through indirect multiplier
effects. Remittances are associated with increased household investments in education,
entrepreneurship and health—all of which have a high social return in most circumstances. The
objective of this section is to see if remittances from Ethiopian migrants abroad can improve the
welfare status of Ethiopian households.
4.1. Modeling Strategies and Estimation Methods
Two analytical tools are basically used in this section to see the impact of international migrant
remittances on the welfare of Ethiopian households. Both descriptive and regression analysis are
used.
1
4.1.1. Poverty Profile
Whether remittances improve the welfare of households can be achieved by constructing a
poverty profile using consumption as a welfare indicator (see for e.g. Couduel et al., 2002;
Ravallion, 1994; Tassew et al., 2008; Bigsten et al., 2005). This way of analysis allows us to
make poverty comparison and provides us with information on the welfare status of households
having international remittances and those not having these remittances.
The choice of consumption as a welfare indicator is that it gives a better indicator of living
standards. Consumption is believed to vary more smoothly than income both within a given year
and across the life cycle (Duclos and Araar, 2006; Couduel et al., 2002). Moreover, income is
more erratic than consumption and consumption is not equal to consumption expenditures
because the value of consumption equals the sum of expenditures on goods and services
purchased and consumed in a given period plus the value of goods and services consumed but
not purchased such as gifts and those produced by the household itself plus the consumption of
durable goods and services owned (Thorbecke, 2005; Douclos and Araar, 2006).
The poverty line estimated by the government of Ethiopia was taken as given in this study. This
estimate was based on the cost of 2,200 kcal per day per adult food consumption with an
allowance for essential non-food items. The levels of real total per adult household consumption
expenditure was estimated ETB 1075.0 per annum per adult equivalent at 1995/96 national
average constant prices.
A group of poverty indices called the Foster-Greer-Thorbecke (FGT) class are used to construct
poverty profile. Given the variable of interest yi (i.e. consumption) ordered in an ascending order
where z is an exogenously given poverty line below which an individual is classified as poor, we
can have the following ratio,
)1.4.(............................................................1
1
q
i
i
z
yz
nP
, where q is the number of poor people below the poverty line, n is the total number of people in
the population, z is the poverty line and y is consumption level. Alpha ( ) is an ethical
1
parameter which is considered to be greater than or equal to zero. For 0 , it is the head count
ratio, for 1, it is the poverty gap and for 2 , it is the squared poverty gap8.
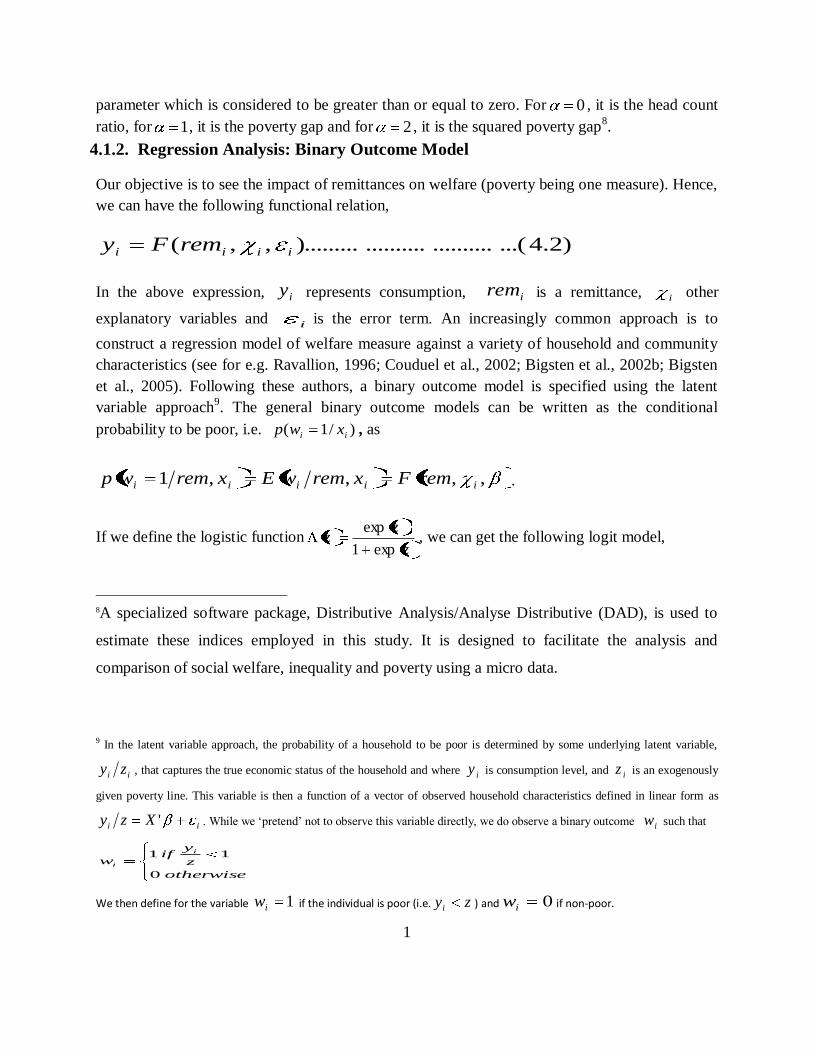
4.1.2. Regression Analysis: Binary Outcome Model
Our objective is to see the impact of remittances on welfare (poverty being one measure). Hence,
we can have the following functional relation,
)2.4...(....................).........,,( iiii remFy
In the above expression, iy represents consumption, irem is a remittance, i other
explanatory variables and i is the error term. An increasingly common approach is to
construct a regression model of welfare measure against a variety of household and community
characteristics (see for e.g. Ravallion, 1996; Couduel et al., 2002; Bigsten et al., 2002b; Bigsten
et al., 2005). Following these authors, a binary outcome model is specified using the latent
variable approach9. The general binary outcome models can be written as the conditional
probability to be poor, i.e. )/1( ii xwp , as
,,,,1 iiiii remFxremwExremwp .
If we define the logistic functionz
zz
exp1
exp, we can get the following logit model,
8A specialized software package, Distributive Analysis/Analyse Distributive (DAD), is used to
estimate these indices employed in this study. It is designed to facilitate the analysis and
comparison of social welfare, inequality and poverty using a micro data.
9 In the latent variable approach, the probability of a household to be poor is determined by some underlying latent variable,
ii zy , that captures the true economic status of the household and where iy is consumption level, and iz is an exogenously
given poverty line. This variable is then a function of a vector of observed household characteristics defined in linear form as
ii Xzy ' . While we ‗pretend‘ not to observe this variable directly, we do observe a binary outcome iw such that
otherwise
z
yif
wi
i
0
11
We then define for the variable 1iw if the individual is poor (i.e. zyi ) and 0iw if non-poor.

1
)3.4....(....................)',(,, iiii remremF
In this model, there is a non-linear relationship between the independent and dependent variables
with well defined probabilities. This property makes it superior to other linear models such as the
linear probability model in poverty analysis. Moreover, the logit model has a relatively simpler
form than the probit model for its first order conditions and asymptotic distributions. A
maximum likelihood estimation (MLE) is applied to estimate the logit model.
4.2. The Nature and Source of Data
The data used in this study came from a household survey undertaken by the department of
economics of Addis Ababa University. The survey was conducted in 2004 in collaboration with
the Center for the Study of African Economies of Oxford University, the Departments of
Economics of Gotemborg University and Michigan State University. The sample size stands at
1500 urban households in seven major towns/cities. The survey collected include data on the
demographic characteristics of households, their educational and health status, ownership of
assets, employment and income, credit availability, consumption, remittance, expenditure and a
host of other household variables. Households are selected by systematic sampling from the
kebeles (the lowest administrative unit in the country).
4.3. Estimation Results and Discussion
4.3.1. Descriptive Analysis
Some of the variables included in the study are described in this sub-section. These include
consumption (dependent variable), remittances (main explanatory variable) and other control
variables such as the age of the household head, literacy, education, household size, employment,
gender and remittances from local sources.
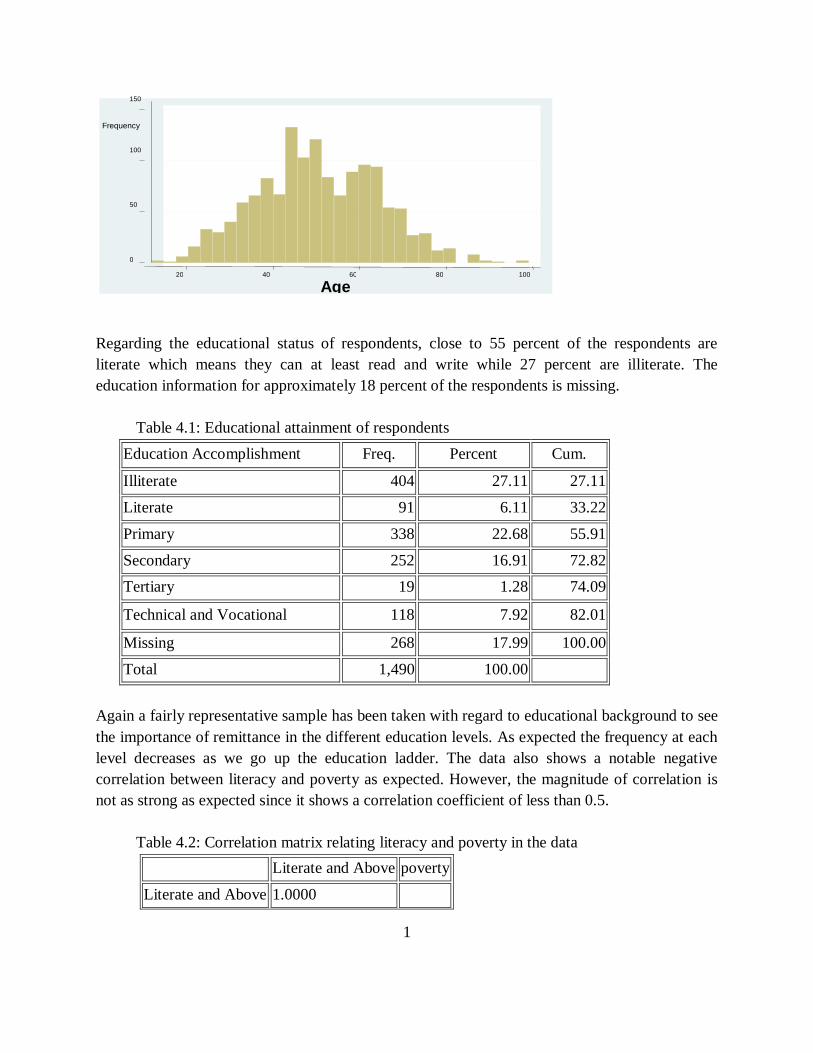
The age distribution of the households covered in the study has a normal distribution.
Approximately 85 percent of the respondents are within the age range of 15-65. The age
distribution of 1490 respondents is presented in the following histogram. The most frequently
appearing age group is 45 to 47 with a frequency of 140 respondents. Since the issue of
remittance involves different age ranges, it is important to have respondents with a normally
distributed age profile.
Figure 4.1: Age distribution of respondents
1
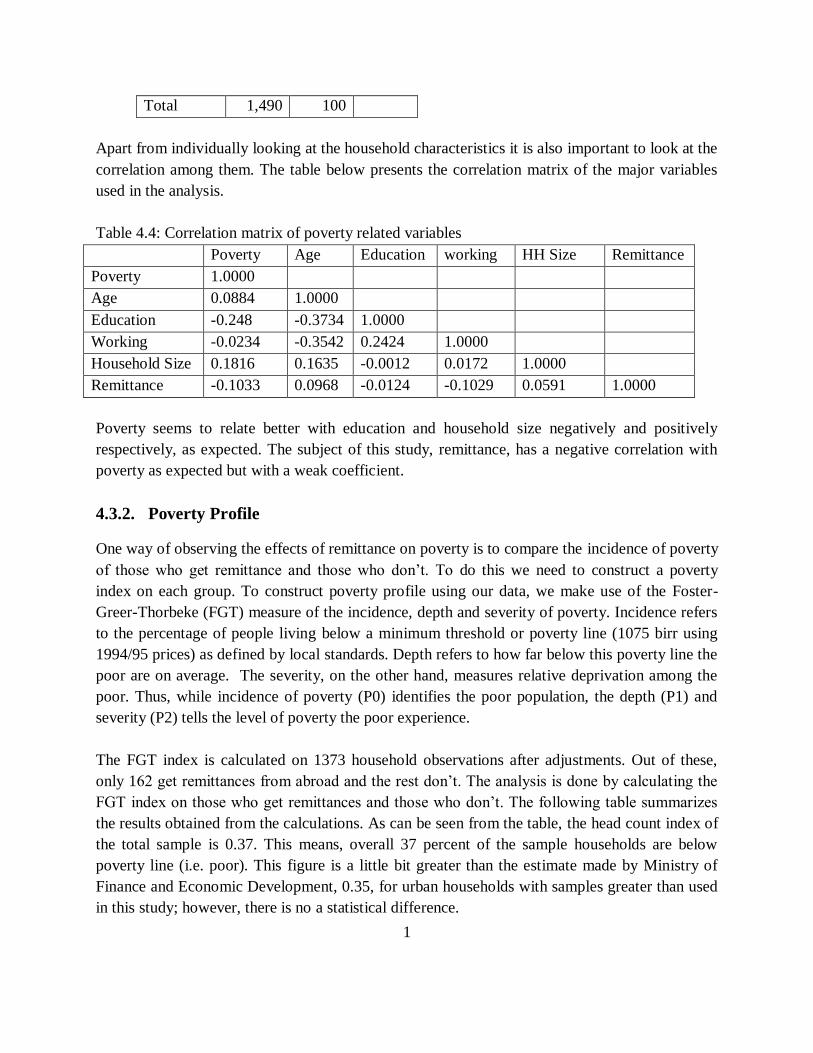
Regarding the educational status of respondents, close to 55 percent of the respondents are
literate which means they can at least read and write while 27 percent are illiterate. The
education information for approximately 18 percent of the respondents is missing.
Table 4.1: Educational attainment of respondents
Education Accomplishment Freq. Percent Cum.
Illiterate 404 27.11 27.11
Literate 91 6.11 33.22
Primary 338 22.68 55.91
Secondary 252 16.91 72.82
Tertiary 19 1.28 74.09
Technical and Vocational 118 7.92 82.01
Missing 268 17.99 100.00
Total 1,490 100.00
Again a fairly representative sample has been taken with regard to educational background to see
the importance of remittance in the different education levels. As expected the frequency at each
level decreases as we go up the education ladder. The data also shows a notable negative
correlation between literacy and poverty as expected. However, the magnitude of correlation is
not as strong as expected since it shows a correlation coefficient of less than 0.5.
Table 4.2: Correlation matrix relating literacy and poverty in the data
Literate and Above poverty
Literate and Above 1.0000
0
50
100
150
Frequency
20 40 60 80 100 Age
1
poverty -0.2204 1.0000
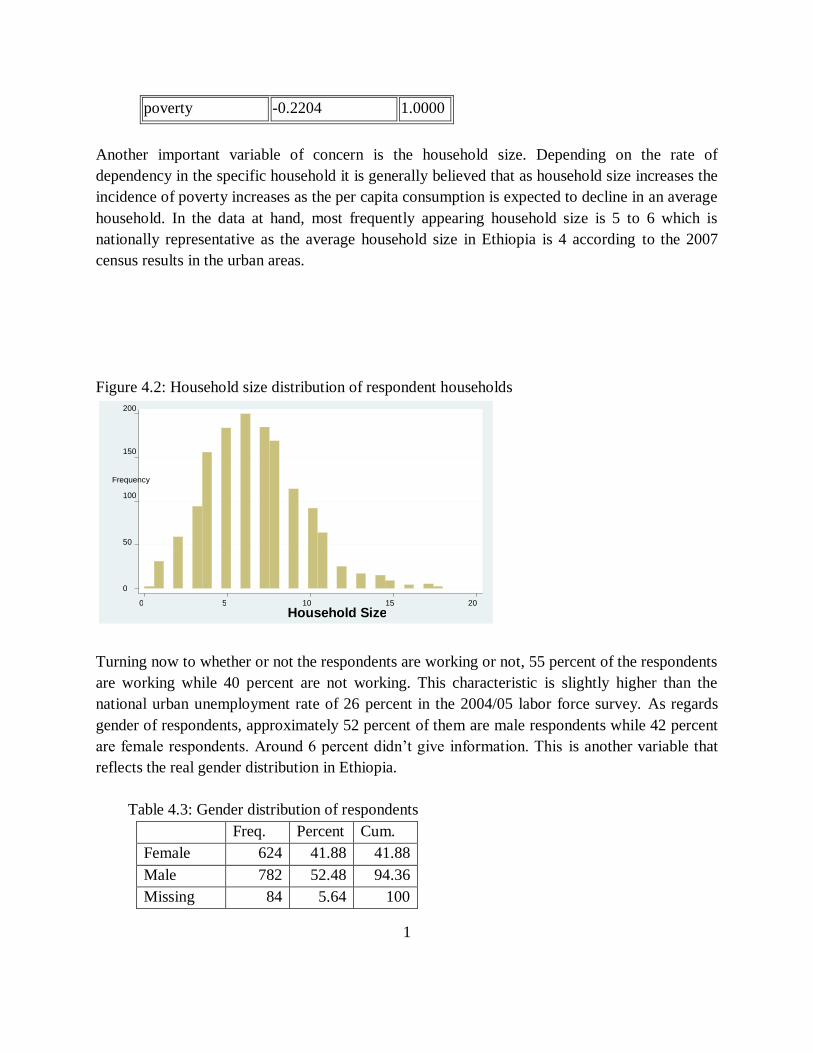
Another important variable of concern is the household size. Depending on the rate of
dependency in the specific household it is generally believed that as household size increases the
incidence of poverty increases as the per capita consumption is expected to decline in an average
household. In the data at hand, most frequently appearing household size is 5 to 6 which is
nationally representative as the average household size in Ethiopia is 4 according to the 2007
census results in the urban areas.
Figure 4.2: Household size distribution of respondent households
Turning now to whether or not the respondents are working or not, 55 percent of the respondents
are working while 40 percent are not working. This characteristic is slightly higher than the
national urban unemployment rate of 26 percent in the 2004/05 labor force survey. As regards
gender of respondents, approximately 52 percent of them are male respondents while 42 percent
are female respondents. Around 6 percent didn‘t give information. This is another variable that
reflects the real gender distribution in Ethiopia.
Table 4.3: Gender distribution of respondents
Freq. Percent Cum.
Female 624 41.88 41.88
Male 782 52.48 94.36
Missing 84 5.64 100
0
50
100
150
200
Frequency
0 5 10 15 20 Household Size
1
Total 1,490 100
Apart from individually looking at the household characteristics it is also important to look at the
correlation among them. The table below presents the correlation matrix of the major variables
used in the analysis.
Table 4.4: Correlation matrix of poverty related variables
Poverty Age Education working HH Size Remittance
Poverty 1.0000
Age 0.0884 1.0000
Education -0.248 -0.3734 1.0000
Working -0.0234 -0.3542 0.2424 1.0000
Household Size 0.1816 0.1635 -0.0012 0.0172 1.0000
Remittance -0.1033 0.0968 -0.0124 -0.1029 0.0591 1.0000
Poverty seems to relate better with education and household size negatively and positively
respectively, as expected. The subject of this study, remittance, has a negative correlation with
poverty as expected but with a weak coefficient.
4.3.2. Poverty Profile
One way of observing the effects of remittance on poverty is to compare the incidence of poverty
of those who get remittance and those who don‘t. To do this we need to construct a poverty
index on each group. To construct poverty profile using our data, we make use of the Foster-
Greer-Thorbeke (FGT) measure of the incidence, depth and severity of poverty. Incidence refers
to the percentage of people living below a minimum threshold or poverty line (1075 birr using
1994/95 prices) as defined by local standards. Depth refers to how far below this poverty line the
poor are on average. The severity, on the other hand, measures relative deprivation among the
poor. Thus, while incidence of poverty (P0) identifies the poor population, the depth (P1) and
severity (P2) tells the level of poverty the poor experience.
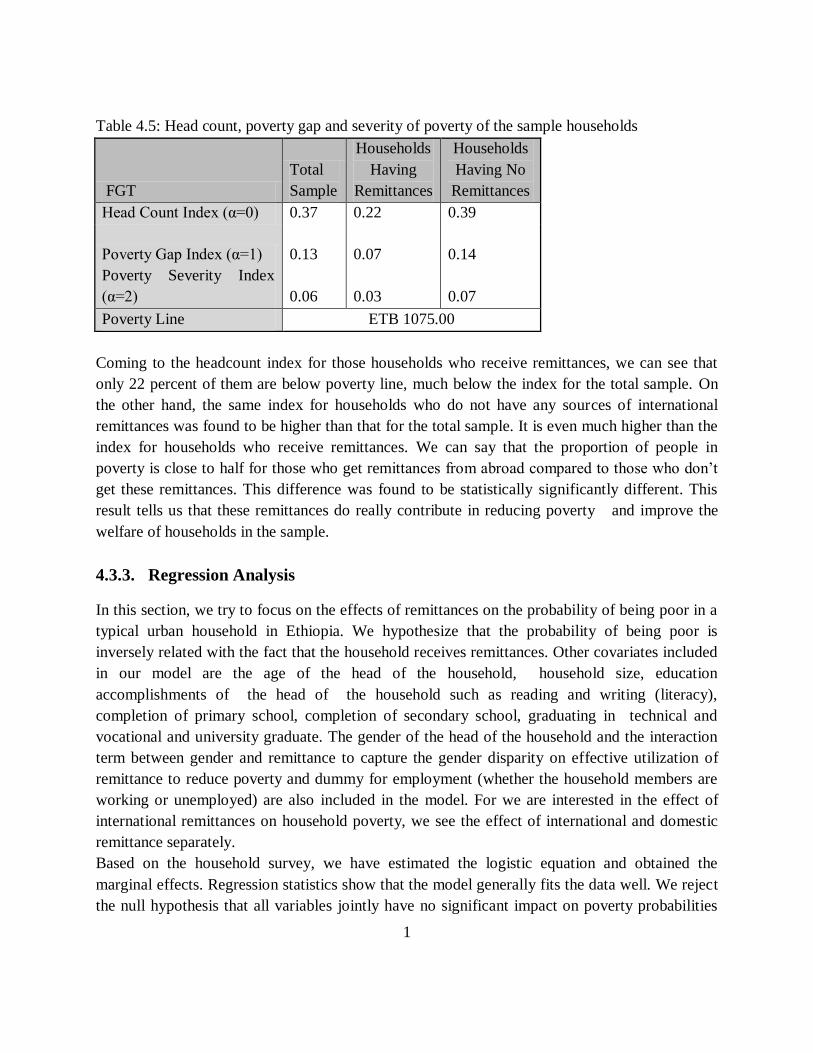
The FGT index is calculated on 1373 household observations after adjustments. Out of these,
only 162 get remittances from abroad and the rest don‘t. The analysis is done by calculating the
FGT index on those who get remittances and those who don‘t. The following table summarizes
the results obtained from the calculations. As can be seen from the table, the head count index of
the total sample is 0.37. This means, overall 37 percent of the sample households are below
poverty line (i.e. poor). This figure is a little bit greater than the estimate made by Ministry of
Finance and Economic Development, 0.35, for urban households with samples greater than used
in this study; however, there is no a statistical difference.
1
Table 4.5: Head count, poverty gap and severity of poverty of the sample households
FGT
Total
Sample
Households
Having
Remittances
Households
Having No
Remittances
Head Count Index (α=0) 0.37 0.22 0.39
Poverty Gap Index (α=1) 0.13 0.07 0.14
Poverty Severity Index
(α=2) 0.06 0.03 0.07
Poverty Line ETB 1075.00
Coming to the headcount index for those households who receive remittances, we can see that
only 22 percent of them are below poverty line, much below the index for the total sample. On
the other hand, the same index for households who do not have any sources of international
remittances was found to be higher than that for the total sample. It is even much higher than the
index for households who receive remittances. We can say that the proportion of people in
poverty is close to half for those who get remittances from abroad compared to those who don‘t
get these remittances. This difference was found to be statistically significantly different. This
result tells us that these remittances do really contribute in reducing poverty and improve the
welfare of households in the sample.
4.3.3. Regression Analysis
In this section, we try to focus on the effects of remittances on the probability of being poor in a
typical urban household in Ethiopia. We hypothesize that the probability of being poor is
inversely related with the fact that the household receives remittances. Other covariates included
in our model are the age of the head of the household, household size, education
accomplishments of the head of the household such as reading and writing (literacy),
completion of primary school, completion of secondary school, graduating in technical and
vocational and university graduate. The gender of the head of the household and the interaction
term between gender and remittance to capture the gender disparity on effective utilization of
remittance to reduce poverty and dummy for employment (whether the household members are
working or unemployed) are also included in the model. For we are interested in the effect of
international remittances on household poverty, we see the effect of international and domestic
remittance separately.
Based on the household survey, we have estimated the logistic equation and obtained the
marginal effects. Regression statistics show that the model generally fits the data well. We reject
the null hypothesis that all variables jointly have no significant impact on poverty probabilities
1
using Wald Test at alpha =0.01%. The specification test shows there is not significant
information to reject the model entailing the model is correctly specified. The marginal effects of
regression result show that all the predictors have the correct signs and almost all are
significantly different from zero at conventional levels of significance.
As can be seen in annex 6, the marginal effect of remittance is negative and significant at 1%
level. It indicates that international remittance has a significant effect on the probability of a
household‘s being non-poor suggesting that the probability of a household being poor decreases
by 25 percent when a household receives remittances. Furthermore, it was also noticed that the
marginal effect of receiving an international remittance is relatively large next to higher
education attainments (secondary and technical & vocational and university) on poverty
incidence in Ethiopian urban households.
The marginal effect of remittances from domestic sources, on the other hand, shows it has no
significant impact on the probability of a household being poor. This is presumably due to the
fact that a significant proportion of the urban dwellers are themselves poor and hence they send a
small amount of remittances to other urban areas. The marginal effects of gender are negative
but statistically insignificant suggesting that differences in gender do not have any effect on the
poverty status of households in the sample. To see whether the association between poverty and
remittance is gender dependent, we used the gender and remittance interaction term (i.e.
remittance & gender). The marginal effect of remittance & gender is significant at 5% suggesting
the gender of recipient of the international remittance has significant impact of poverty incidence
among Ethiopian urban households, all other things being equal. The sign of this variable tells
that if the receiver is male headed the probability of being poor increases by 0.265 compared to
that of female headed households.
The marginal effect of education shows that if the head of the household attend primary,
secondary, vocational and university schools, the probability of being poor dropped significantly
at common levels of significance. The marginal effect of literacy, on the other hand, has the
expected sign but is only significant slightly at 10%. Overall, the probability of a household
being poor decreased with education at all levels. The marginal effect of age of the household
has the expected sign but not significant. The marginal effect of workers, household size is
positive and significant at 1 percent. These effects suggest that the probability that the household
falls into poverty increases with the size of the household and the number of workers in the
household.
1
5. Conclusions and Policy Implication
Migration with its concomitant remittance has diverse socio-economic impacts: increasing better
opportunities for the migrant, improving the livelihood of sending households and contributing
economic growth and has emerged as an important policy issue in developing countries.
Ethiopia, being one of the highest African diaspora populations, is challenged by different
migration patterns and dynamics, which have significant political and socio-economic
ramifications for the country and undoubtedly affects the government‘s sustainable development
and poverty reduction programs. Ethiopia, as in any other resource poor developing countries, is
constrained by foreign exchange availability to finance the increasing demand for imports
associated with domestic investment requirements. Remittances constitute the larger part of
foreign exchange earnings sometimes larger than foreign direct investments and export revenues.
Another transmission channel is through increasing income where an inflow of remittances
impacts various living standards and human capital outcomes.
The objective of this study was to see the macroeconomic impact of inflows of international
migrant remittances and the livelihood consequences of these remittances on the welfare of
households and on poverty reduction. A simple vector error correction model was adopted to
describe the macroeconomic impact of remittance shock on the Ethiopian economy.
Furthermore, a poverty profile and binary outcome model were used to see the consequences of
remittances on the welfare of households.
1
The result, using vector error correction model provides us some surprising results. It helped us
know that while remittance shocks positively affect macroeconomic variables, the effect
remained to be volatile in the very first periods after the shock. However, the impacts tend to
sustain in the years after the fifth period. We also analytically saw that through the positive (but
inelastic) relationship between growth and poverty, private remittance inflows have an important
implication on poverty in Ethiopia.
The microeconomic approach has also revealed similar evidence. It was found that, using
poverty profile and binary outcome models, international remittances significantly reduced the
poverty incidence among the urban households in Ethiopia. We found that women are more
likely to use remittance more effectively than their male counterparts. Thus the policy
implication of these findings is that policy makers in Ethiopia should encourage diaspora citizens
to increase remittance inflow via different incentive packages. The gender difference on the
effectiveness of international remittance also implies Ethiopians in the diaspora sending
remittance to their households should channel more of the remittance via female members of
their households if their objective is to reduce poverty in their households. Further, the banking
system in Ethiopia needs to minimize the transaction costs to channel the remittance via the legal
channel to reduce urban poverty.
6. Bibliography
Abye Tasse (2008). Migration and the Ethiopian Diaspora, Addis Ababa University Addis
Ababa
Adamnesh Atnafu (2008). Facets of International out Migration and Return: The case of
Ethiopia, Addis Ababa University, Addis Ababa
Adamnesh Atnafu (2006). Aspects of Ethiopian Return Migration, Institute of Regional and
Local Development Studies, Addis Ababa University, Addis Ababa
Agnarson L. (2006). The Integration of Ethiopian emigrants in Sweden, Stockholm University,
Sweden
Alain de Janvry and Elisabeth Sadoulet (1999). Growth, Poverty, and Inequality in Latin
America: A Causal Analysis, 1970 – 94, University of California at Berkeley, February 4, 1999
Amin, Mohammed and Aaditya Mattoo (2007). Migration from Zambia: Ensuring
Temporariness through Cooperation, World Bank Working Paper Series 4145, 2007,
Washington DC
Anyanwu, J and Erhijakpor, A.(2009). Do International Remittances Affect Poverty in Africa?
www.afdb.org/.../30754258-EN-3.1.4-ANYANWU-DO-INTERNATIONAL-REMITTANCES-
AFFECT-POVERTY-IN-AFRICA
Barten, A. P. (1969). Maximum likelihood estimation of a complete system of demand
equations, European Economic Review, 1, Katholieke Universiteit te Leuven, Belgium

1
Batheseba H. (2007). Enabling Diaspora Engagement in Africa, Ottawa, Canada
Berg, A., Hussain,M., Aiyar, S., Roache, S., Mirzoev, T., and Mahone, A. (2006). The
Macroeconomics of Managing Increased Aid Inflows: Experiences of Low-Income Countries
and Policy Implications, Draft for WIDER Conference on Aid, IMF
Bigsten, A. Abebe Shimeles and Bereket Kebede (2005). Poverty Income Distribution and
Labor Markets in Ethiopia. NORDISKA AFRICAINSTITUTET
Bigsten A., Bereket Kebede, Abebe Shimeles and Mekonnen Tadesse (2002b). Poverty and
Welfare in Ethiopia: Profile and Determinants. Proceedings of the Fifth Annual Conference on
the Ethiopian Economy. Edited by Bereket Kebede and Mekonnen Tadesse. December 1996.
Addis Ababa.
Coudouel, A., Hentschel, Jesko S. and Wodon, Quentin T. (2002). Poverty Analysis. World
Bank, PovertyNet
Dejene Aredo, (2005). Migrant Remittances, Shocks and Poverty in Urban Ethiopia: An
Analysis of Micro Level Panel Data. Addis Ababa University
Duclos Jean-Yves and Araar A. (2006). Poverty and Equity: Measurement, Policy and
Estimation with DAD, International Development Research Center
Emerta A.(2009) The Empirics of Growth, Poverty and Inequality in Sub-Saharan Africa, Ethiopian
Economic Policy Research Institute, Working Paper No. 1/2009.
Federal Democratic Republic of Ethiopia Ministry of Finance and Economic Development
(MoFED), various publications
Federal Ministry of Labor and Social Affairs (1998). Private Employment Agency
Proclamation, Proclamation No 104/1998, Negarit Gazetta, 1998
Giuliano, P., and Ruiz-Arranz, M. (2005). Remittances, Financial Development, and Growth,
Research Department, IMF Working Paper, WP/05/234
Gupta, S., C. Pattillo, and S. Wagh (2007). Impact of Remittances on Poverty and Financial
Development in Sub-Saharan Africa, IMF Working Paper, WP/07/38. Hausman, J. A. (1978),
Specification Tests in Econometrics, Econometrica, 46, 1251–1271
Hansen, H., and Headey, D.(2009). The Short-Run Macroeconomic Impact of Foreign Aid to
Small States: An Agnostic Time Series Analysis, Development Strategy and Governance
Division, IFPRI Discussion Paper 00863
International Labor Organization (2006). Multilateral Framework on Labor Migration Non-
binding principles and guidelines for a rights-based approach to labor migration, International
Labor Office, Geneva, 2006
International Migration Organization (2005). World Migration Report 2005: Costs and
Benefits of International Migration, 2005.
International Organization on Migration (2008). World Migration Report 2008: Managing
Labor Mobility in the Evolving Global Economy, Geneva, 2008.

1
IOM (2008). Migration and Development: Ethiopia retrieved from
http://www.iom.int/jahia/pid/378
Jongwanich, J. (2007). Workers‘ Remittances, Economic Growth and Poverty in Developing
Asia and the Pacific Countries, UNESCAP Working Paper, WP/07/01
Kokpari, J (2000). Globalization and Migration in Africa, African Sociological Review 4(2),
pp 72-92
Mahesh Kumar Subedi (2009). The Impact of Labor Migration and Remittances on Household
Income and Welfare in Nepal. Pacific Conference for Development Economics Saturday, March,
2009. San Francisco State University
Marcin Sasin And David Mckenzie (2007). Migration, Poverty and Human Capital Migration
Operational Vehicle, Operational Note 1, The World Bank, January, 2007
National Bank of Ethiopia (NBE). Various publications
Peter Quartey (2006). The Impact of Migrant Remittances on Household Welfare in Ghana.
AERC Research Paper 158 African Economic Research Consortium, Nairobi August 2006
Portes, A (1996). The New Second Generation, New York
Ravallion,M. (1994). How robust is poverty profile. World Bank Economic Review, V.5
Ravallion, M. (1996). Issues in Measuring and Modeling Poverty. The World Bank, Policy
Research Department. Poverty and Human Resource Division
Siliji A. (2001). Globalization and Migration, unpublished draft work
Tassew Woldehanna, Hoddinot, J. and Darcon, S. (2008). Poverty and Inequality in Ethiopia:
1995/96-2004/05. May, 2008. Addis Ababa University, International Food Policy Institute and
University of Oxford
Teferi Mequaninte and Bruk Asmelash (2009). Remittance Inflows and Country Experience:
The Practice and the Potential for Inprovement. Proceedings of the Sixth International
Conference on the Ethiopian Economy, Volume I, Ethiopian Economics Association.
Thorbecke, E. (2005). Multi-dimensional Poverty: Conceptual and Measurement Issues Cornell
University, UNDP International Poverty Centre, Brasilia
Tassew Woldehanna, Hoddinot, J. and Darcon, S. (2008). Poverty and Inequality in Ethiopia:
1995/96-2004/05. May, 2008. Addis Ababa University, International Food Policy Institute and
University of Oxford
United Nations (2006). Trends in Total Migrant Total Migrant Stock: the 2005 Revision. CD-
ROM Documentation, Department of Economic and Social Affairs Population Division
Wodon, Q.(1999). Growth, Poverty, and Inequality: A Regional Panel for Bangladesh, The
World Bank
World Bank (2006). The international Migration Agenda and the World Bank: Managing Risks
and Enhancing Benefits, The World Bank, September, 2004
World Bank (2005). World Development Report: A Better Investment Climate for Every One,
The World Bank, 2005
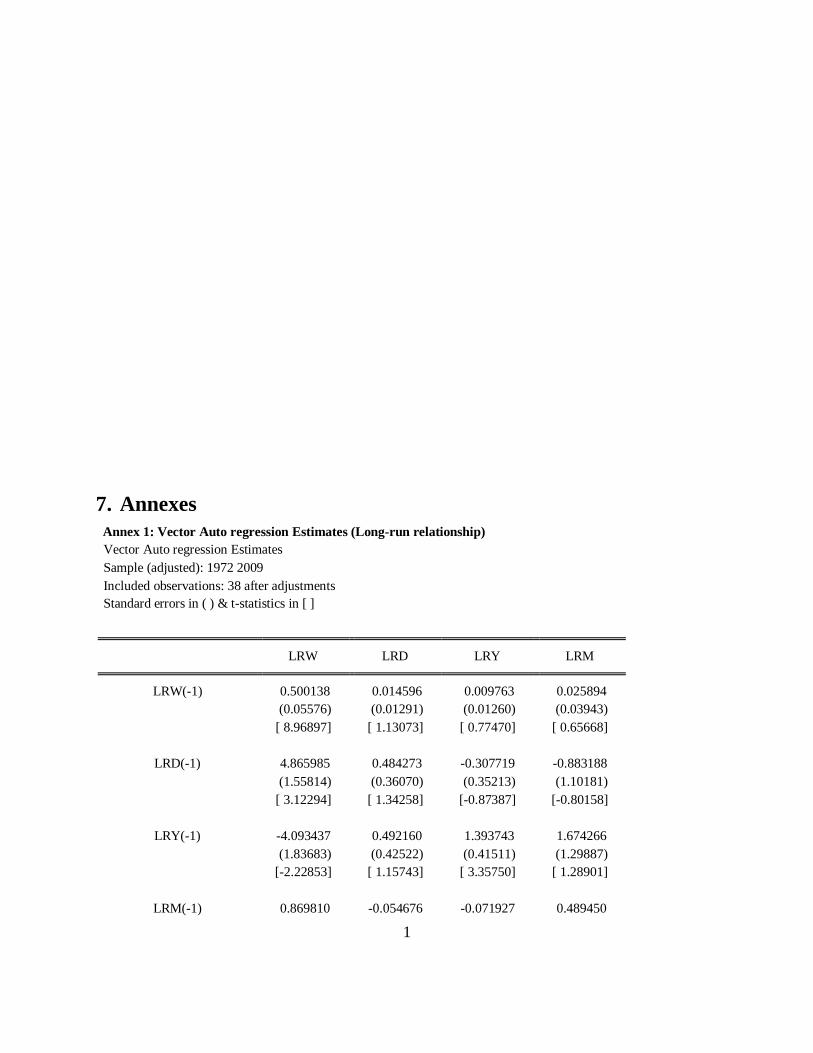
1
7. Annexes
Annex 1: Vector Auto regression Estimates (Long-run relationship)
Vector Auto regression Estimates
Sample (adjusted): 1972 2009
Included observations: 38 after adjustments
Standard errors in ( ) & t-statistics in [ ]
LRW LRD LRY LRM
LRW(-1) 0.500138 0.014596 0.009763 0.025894
(0.05576) (0.01291) (0.01260) (0.03943)
[ 8.96897] [ 1.13073] [ 0.77470] [ 0.65668]
LRD(-1) 4.865985 0.484273 -0.307719 -0.883188
(1.55814) (0.36070) (0.35213) (1.10181)
[ 3.12294] [ 1.34258] [-0.87387] [-0.80158]
LRY(-1) -4.093437 0.492160 1.393743 1.674266
(1.83683) (0.42522) (0.41511) (1.29887)
[-2.22853] [ 1.15743] [ 3.35750] [ 1.28901]
LRM(-1) 0.869810 -0.054676 -0.071927 0.489450

1
(0.39363) (0.09112) (0.08896) (0.27835)
[ 2.20972] [-0.60002] [-0.80855] [ 1.75842]
C -11.27437 0.551268 -0.387843 -4.346732
(3.29613) (0.76304) (0.74491) (2.33078)
[-3.42049] [ 0.72246] [-0.52066] [-1.86492]
R-squared 0.974022 0.974097 0.984213 0.960790
Adj. R-squared 0.970873 0.970958 0.982300 0.956037
Sum sq. resids 2.521710 0.135138 0.128792 1.260928
S.E. equation 0.276433 0.063993 0.062472 0.195474
F-statistic 309.3286 310.2496 514.3423 202.1547
Log likelihood -2.379331 53.22213 54.13602 10.78936
Akaike AIC 0.388386 -2.538007 -2.586106 -0.304703
Schwarz SC 0.603858 -2.322535 -2.370635 -0.089231
Mean dependent 6.678315 10.54086 10.77488 8.745371
S.D. dependent 1.619740 0.375505 0.469568 0.932277
Determinant resid covariance (dof adj.) 3.23E-09
Determinant resid covariance 1.84E-09
Log likelihood 166.4996
Akaike information criterion -7.710503
Schwarz criterion -6.848616
Annex 2: Impulse Response Function
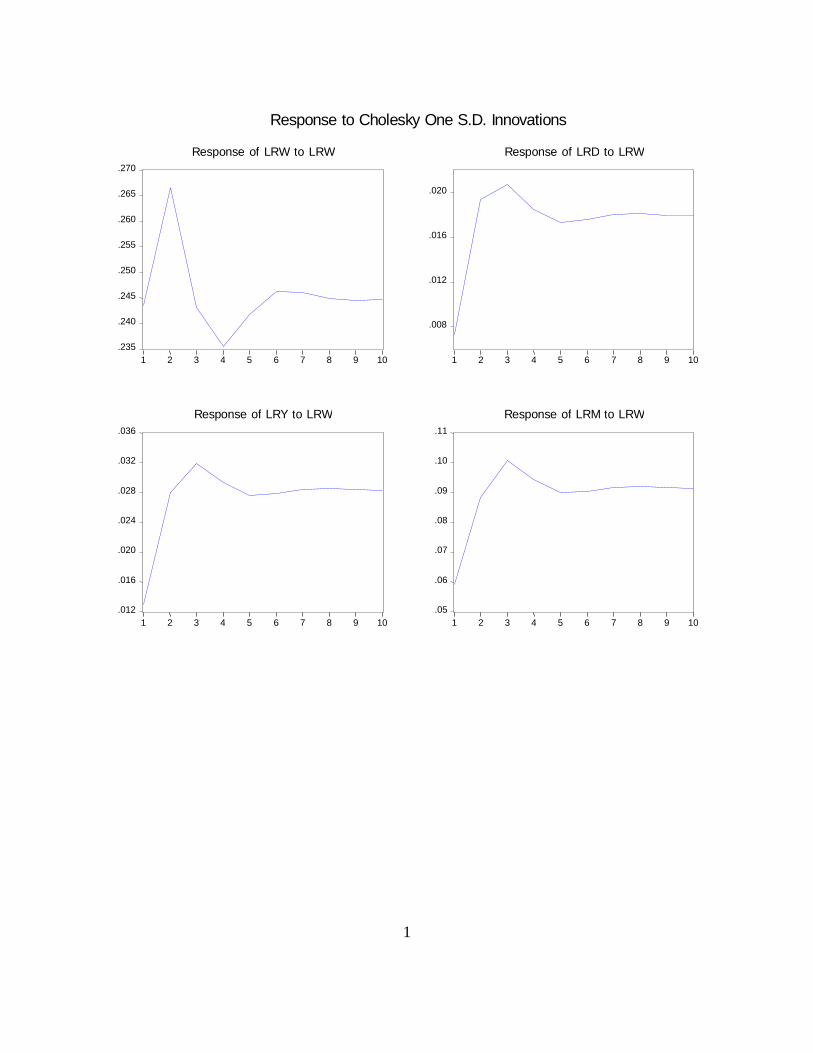
1
.235
.240
.245
.250
.255
.260
.265
.270
1 2 3 4 5 6 7 8 9 10
R e s p o n s e o f L R W t o L R W
.008
.012
.016
.020
1 2 3 4 5 6 7 8 9 10
R e s p o n s e o f L R D t o L R W
.012
.016
.020
.024
.028
.032
.036
1 2 3 4 5 6 7 8 9 10
R e s p o n s e o f L R Y t o L R W
.05
.06
.07
.08
.09
.10
.11
1 2 3 4 5 6 7 8 9 10
R e s p o n s e o f L R M t o L R W
R e s p o n s e t o C h o l e s k y O n e S . D . I n n o v a t i o n s

1
Annex 3: Variance Decomposition
0
20
40
60
80
100
1 2 3 4 5 6 7 8 9 10
P e r c e n t L R W v a r i a n c e d u e t o L R W
0
20
40
60
80
100
1 2 3 4 5 6 7 8 9 10
P e r c e n t L R W v a r i a n c e d u e t o L R D
0
20
40
60
80
100
1 2 3 4 5 6 7 8 9 10
P e r c e n t L R W v a r i a n c e d u e t o L R Y
0
20
40
60
80
100
1 2 3 4 5 6 7 8 9 10
P e r c e n t L R W v a r i a n c e d u e t o L R M
V a r i a n c e D e c o m p o s i t i o n
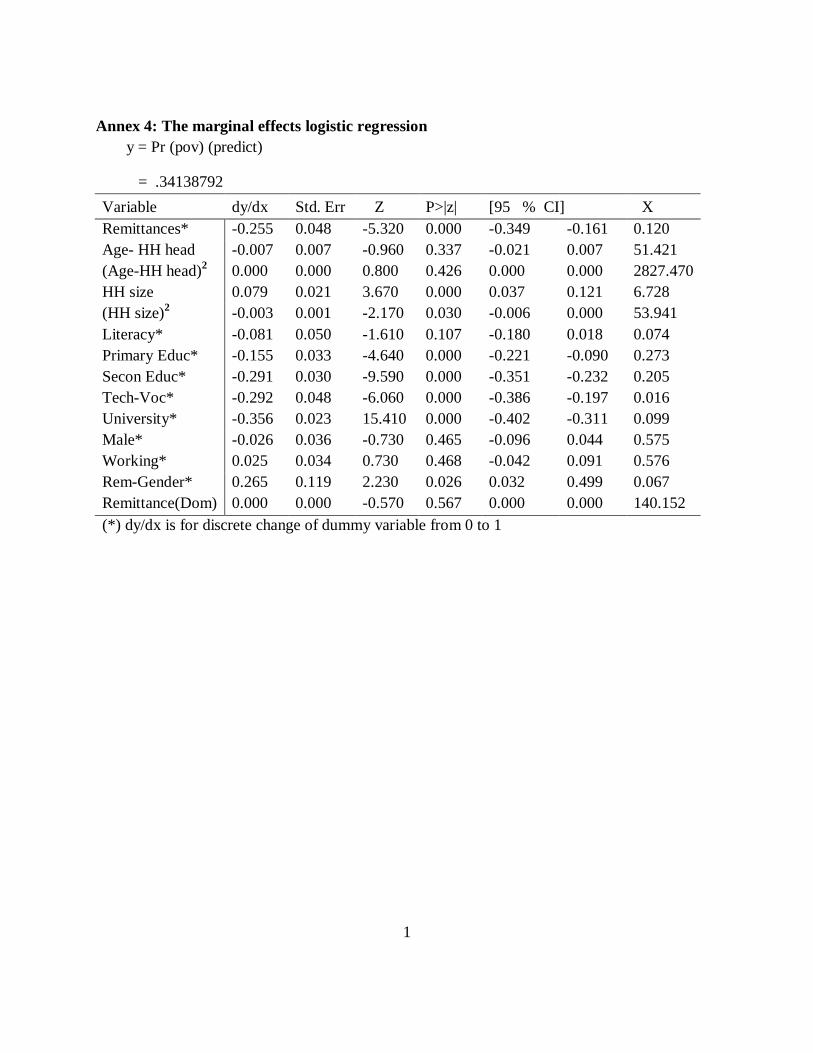
1
Annex 4: The marginal effects logistic regression
y = Pr (pov) (predict)
= .34138792
Variable dy/dx Std. Err Z P>|z| [95 % CI] X
Remittances* -0.255 0.048 -5.320 0.000 -0.349 -0.161 0.120
Age- HH head -0.007 0.007 -0.960 0.337 -0.021 0.007 51.421
(Age-HH head)2 0.000 0.000 0.800 0.426 0.000 0.000 2827.470
HH size 0.079 0.021 3.670 0.000 0.037 0.121 6.728
(HH size)2 -0.003 0.001 -2.170 0.030 -0.006 0.000 53.941
Literacy* -0.081 0.050 -1.610 0.107 -0.180 0.018 0.074
Primary Educ* -0.155 0.033 -4.640 0.000 -0.221 -0.090 0.273
Secon Educ* -0.291 0.030 -9.590 0.000 -0.351 -0.232 0.205
Tech-Voc* -0.292 0.048 -6.060 0.000 -0.386 -0.197 0.016
University* -0.356 0.023 15.410 0.000 -0.402 -0.311 0.099
Male* -0.026 0.036 -0.730 0.465 -0.096 0.044 0.575
Working* 0.025 0.034 0.730 0.468 -0.042 0.091 0.576
Rem-Gender* 0.265 0.119 2.230 0.026 0.032 0.499 0.067
Remittance(Dom) 0.000 0.000 -0.570 0.567 0.000 0.000 140.152
(*) dy/dx is for discrete change of dummy variable from 0 to 1