INTERNATIONAL MEDICAL OUTCOMES How Does … · INTERNATIONAL MEDICAL OUTCOMES How Does the UK...
42
INTERNATIONAL MEDICAL OUTCOMES How Does the UK compare? BENEDICT IRVINE AND DAVID G. GREEN February 2003 A research study carried out by Civitas and sponsored by Reform 1
Transcript of INTERNATIONAL MEDICAL OUTCOMES How Does … · INTERNATIONAL MEDICAL OUTCOMES How Does the UK...

INTERNATIONAL MEDICAL OUTCOMES How Does the UK compare?
BENEDICT IRVINE AND DAVID G. GREEN
February 2003
A research study carried out by Civitas and sponsored by Reform
1

INTERNATIONAL MEDICAL OUTCOMES How Does the UK compare?
BENEDICT IRVINE AND DAVID G. GREEN CONTENTS Summary 1. Introduction 2. Scope of the study 3. Health system characteristics 4. Healthcare outcomes in 9 Countries
General Outcome Measures
Cancer Stroke IHD 5. Impact of systems and expenditure on outcomes Expenditure
Frequency of use of accepted technologies Cancer
IHD Stroke
6. Conclusions Glossary Notes
2
SUMMARY Health systems subject to central political management tend to limit the availability of resources, especially the number of doctors, in the belief that medical demand is ‘supplier induced’ and has little bearing on medical outcomes. However, more recent research shows that there is an optimal spending level that varies over time, typically increasing with per capita income. Higher total expenditure on health than in the UK and a higher number of doctors per head than in the UK, both lead to improved medical outcomes. Consequently, a well-organised health care system will allow the availability of resources to vary over time to meet both professionally-defined medical needs as well as consumer-defined medical demands.
• Total expenditure on healthcare per capita is correlated with health status.1 Increased expenditure leads to improved health outcomes.2 A cluster of consistently higher indicators is found among those countries spending $1700 PPP per capita, or more. Beyond that threshold, one does not find a clear positive correlation between performance and increased expenditure.3 As the Wanless report accepted, the UK does not spend enough on health care. It is unlikely to do so while the government has such tight control over the purse strings.4
• The availability of medical resources has a beneficial impact on medical outcomes.
The number of doctors per head affects medical outcomes. Infant and maternal mortality are significantly reduced when the number of physicians increases.5 Avoidable mortality, when medical intervention is capable of having an impact, also improves with the number of doctors.6
• More frequent use of accepted medical technologies improves outcomes. For
example, the use of specialist units in the treatment of stroke patients is strongly correlated with improved outcomes. Specialist units are under-used in the UK.7 The rate of CABG and PTCA vary significantly between countries. The UK lags behind, chiefly for financial reasons.8
• Total expenditure and patient satisfaction are correlated up to a point (c$1750 PPP),
where diminishing returns set in.9 Spending in the UK has not reached this threshold yet.
3

1. INTRODUCTION The latest publication of the OECD’s health data has again shown the poor quality of British healthcare compared to other countries.10 The statistics show that victims of heart disease, stroke or breast cancer in Britain die early and unnecessarily compared with most other western countries. Worse still, it seems that access to care is being limited according to age. Regular contributor to the British Medical Journal, Roger Dobson reports on an international study that found the proportion of health spending on those aged 65+ in England and Wales is not keeping track with that in other countries.11 Dr Alastair Gray and Meena Seshamani from the Health Economics Research Centre at Oxford University found:
‘In contrast to the findings of previous studies, this analysis of health expenditure data has found that in England and Wales the high cost older groups did not have larger increases in their medical costs than the middle age groups. In fact…the oldest old had decreases in their real per capita costs, while other age groups experienced real cost increases.’12
The same researchers noted that data from the OECD show that in developed countries per capita spending for those aged over 65 has increased at the same rate or faster than among those aged under 65. The UK bucks this trend. Do these findings suggest that the NHS suffers from a systemic flaw that can only be overcome by radical change? Have other systems proved better able to avoid rationing by keeping the resources available for treatment in balance with medical demand? 2. SCOPE OF THE STUDY We have carried out a comparative study of nine countries: Canada, Denmark, France, Germany, Hungary, the Netherlands, Switzerland, the UK, and the US.13 Our chosen countries represent a cross section of the funding arrangements found in advanced Western democracies (see Table 1). In brief, these include varieties of the three main forms of public financing (social insurance, local taxation and general taxation) and private insurance. No system is reliant on a sole source of finance. Rather, all systems rely on a mixture of public and private finance. Table 2 gives a further breakdown of the sources of finance.14 The balance between each of the many different forms of public and private funding sources varies and is constantly changing.15 Making a connection between a funding system and medical outcomes is fraught with difficulty. The chief problem is that no country has a single system of finance, whereas outcome data are presented for the whole country. We cannot, therefore, be entirely sure whether favourable outcomes are due to the public or private elements of any arrangements. Moreover, competition may be driving performance rather than the funding mechanism and two national systems based on the same funding model may differ in the degree of competition permitted. Some association between financial incentives and outcomes is widely accepted. For example, economist Pierre Moise of the OECD health policy research team suggests that we might expect physicians and hospitals working in fee-for-service environments to have higher volumes of services per physician.16 And we might expect that funding systems that have given rise to extensive withholding of treatment would be associated with poor medical outcomes, compared with countries that do not routinely withhold treatment from patients capable of benefiting clinically. A number of US and Europe-based studies point to such a positive relationship between ‘health care input and health outcomes’.17
4

At the same time, over-treatment may be more likely under some regimes, with the result that harmful interventions may occur more frequently. As Zeynep Or, consultant with the OECD health policy research team, posits: ‘It is also likely that there may be diminishing returns to scale above some level of expenditure’.18 Table 1 Five types of healthcare financing schemes in Western Democracies Private model Public models Competitive insurance plans
Competitive insurance plans (a)
Employer-based insurance plans
Public sector devolved
Public sector: centralised.
USA 37 Netherlands (B)
17 France
1
Denmark 34
UK -
18
Singapore 6 Switzerland 20 Netherlands (C)
17 Canada 30 Spain 7
Germany 25 Hungary 66 Italy 2 Portugal 12 Belgium 21 Austria 9 Sweden Ireland 19
Greece 14 Norway 11 Luxembourg 16 Finland 31
Australia 32
Based on Table 11.1, Rice, N and Smith P., ‘Strategic resource allocation and funding decisions’ in Mossialos, E, Dixon et al, (2002). The numbers refer to the WHO 2000 overall ranking of each country’s health system performance. (a) Note German, Dutch and Belgian health insurance is employer based, while that in Switzerland is not. (B) ZFW - Dutch second ‘compartment’ (C) AWBZ - Dutch first ‘compartment’
5

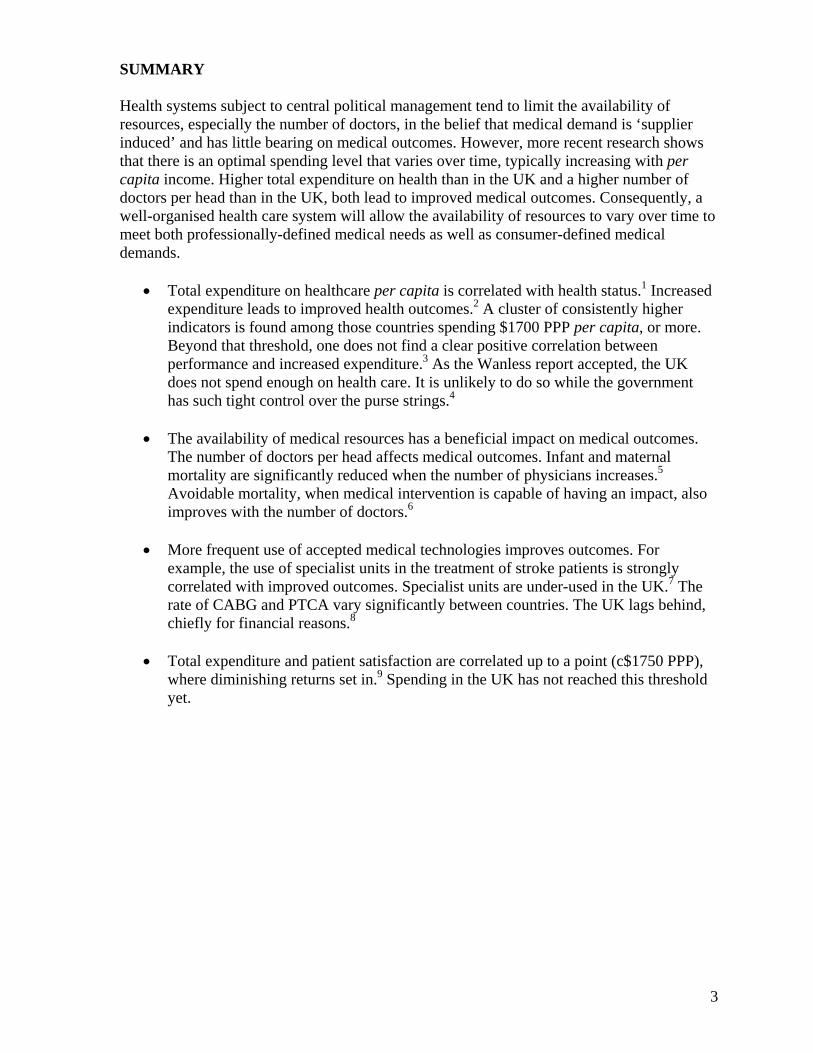
3. Health Care System Characteristics The sources of health care finance in reference countries are shown in Table 2. Private spending in each of the countries studied is indicated in Table 3 and Chart 1, while total national healthcare expenditure characteristics are presented in Table 4. To compare inputs in our reference countries we use Purchasing Power Parities (PPPs) in order to reflect the amount spent, but also health care prices in each country.19 PPPs equalise the cost of a given ‘basket’ of goods and services in different countries.20 Forms of hospital ownership, methods of payment and the number of physicians per capita, are shown in Table 5. Equity in access, the existence of GP gatekeeping as well as specific national concerns – including waiting lists, high expenditure, informal payments, managed care restrictions and uninsured individuals – are presented in Table 6. Table 7 indicates the number of physicians, specialists, GPs, nurses, hospital beds, and the availability of CT and MRI scanners in each of our reference countries. Rankings of those healthcare resources are shown in Table 8. Table 2 Plurality and balance in health care finance
Country Main source of finance
Public exp %TEH
Tax % TEH
Social Insurance %
Private exp %TEH
Voluntary Health Insurance
User Charges %TEH
Other % TEH
Canada (2000)
Tax 71.1 71 - 28.9 11.2% 16.6 2.1 other private £
Denmark (1999)
Tax local
82.2 80.7 - 17.8 1.5 16.2 -
France (a) (1999)
SI 78.1 4.3 72.8 21.9 12.2 9.7
1.1
Germany (1998)
SI 75.8 11.0 69.4 24.2 7.1 12..8 4.3
Hungary (b) (1998)
SI
83.2 13.3 69.9 16.8 - 16.8% Informal payments
Netherlands (1998)
SI 68.5 4.0 64.5 31.5 17.7 8.0 5.9
Switzerland 1997 (1998)
SI (c) 59.1 (73.2)
24.9 (14.8)
34.2 (58.3)
38.7 (26.8)
11.2 (profit + not profit)
26.4 2.1
UK (1999) Tax 83.3 78.8 9.8 (nat ins)
16.7 3.4 11.2 2.0
USA (1999) Tax subsidised PI
44.5% 30% 14.6 55.5 33 15.7 6.1
Data – Authors’ research. Mossialos, 1999, European Observatory HiTs, OECD 2001. OECD 2002. Data should be interpreted with caution owing to the multiplicity of sources for this table. Accompanying notes: (a) Drees 2001 (b) Gaal’s figures, from Hungarian Health Ministry. Informal payments are included in the User charges column. (c) SI includes all compulsory social insurance (accident, etc). Tax is dedicated to hospital finance and premium subsidies. (Figures in parenthesis are from the OECD.)
6

Table 3 Private Expenditure Trends, as % of Total Expenditure on Health (1960-99)
Countries 1960 1970 1980 1990 1991 1992 1993 1994 1995 1996 1997 1998 1999 Trend1980-99
Canada PS 57.4 30.1 24.4 25.4 25.4 25.8 27.2 27.9 28.8 29.6 30.1 29.9 29.4 + OPPs - - - 14.4 14.2 14.2 14.9 15.4 15.9 16.5 17.1 16.6 - +PI - - - 8.1 8.4 8.9 9.5 9.7 10.2 10.6 10.9 11.2 - +Denmark - - 12.2 17.3 16.5 16.8 17.3 17.8 17.5 17.6 17.7 18.1 17.8 + (b)OPPs - - 11.4 16.0 15.3 15.6 16.3 16.7 16.3 16.2 16.3 16.6 16.2 + (b)PI - - 0.8 1.3 1.2 1.2 1.0 1.1 1.2 1.4 1.4 1.5 1.6 + France 42.2 25.3 21.2. 23.4 24.1 23.6 23.6 24.1 24.0 24.0 23.9 23.9 23.8 + (b)OPPs - - - - - 11.7 11.5 11.2 11.1 10.6 10.5 10.3 10.1 - PI - - - - - 10.9 11.1 11.9 11.9 12.3 12.4 12.6 12.6 +Germany 33.9 27.2 21.3 23.8 21.9 21.6 22.5 22.5 21.9 21.7 23.4 24.2 - -OPPs - - 10.3 11.1 10.8 10.7 11.4 11.4 10.9 11.0 12.2 12.8 - +PI - - 5.9 7.2 6.5 6.4 6.7 6.8 6.7 6.5 6.9 7.1 +/- (a)Hungary - - - - 10.9 12.0 12.6 12.7 16.0 18.4 18.7 17.6 19.1 ++ OPPs - - - - 10.9 12.0 12.6 12.7 16.0 18.4 18.7 17.6 19.0 +PI - - - - - - - - -- - - 0.0 0.1 +Netherlands - - 30.8 32.3 30.1 26.7 25.8 26.5 28.0 32.7 31.1 31.4 31.5 +/-OPPs - - - - - - - - - 7.7 7.2 8.0 - +/-PI - - - - - - - - - 18.4 17.9 17.5 - -/+Switzerland 49.3 38.2 34.9 31.6 31.4 29.9 28.2 27.9 27.7 25.5 25.9 26.8 - - - OPPs - - - - - - - - - - - - - N/API - - - - - - - - - - - - - N/AUK 14.8 13.0 10.6 15.7 15.9 14.7 14.1 15.1 15.1 16.3 16.3 16.7 16.7 + (b)OPPs 8.6 10.6 11.3 11.1 10.8 11.2 11.0 11.1 10.9 11.1 11.2 -/+PI 1.3 3.3 3.4 3.4 3.4 3.4 3.2 3.3 3.5 3.5 3.4 + (b)US 76.7 63.7 58.5 60.4 58.8 57.6 56.9 55.2 54.4 54.1 54.5 55.2 55.5 - OPPs 24.2 20.2 19.1 18.1 17.1 15.9 15.4 15.2 15.4 15.6 15.7 - -PI 28.4 34.1 33.8 33.5 33.9 33.6 33.2 33.1 33.1 33.5 33.8 + (b)PS: Private spending OPPs: Out of pocket payments PI: Private insurance (a) If increase or decrease is by less than 1 percentage point +/- or -/+ is indicated respectively. If a less than 1 % point change represents a 50% increase or decrease, + or – is used as elsewhere (see Danish PI). (b) Little change since 1990
7
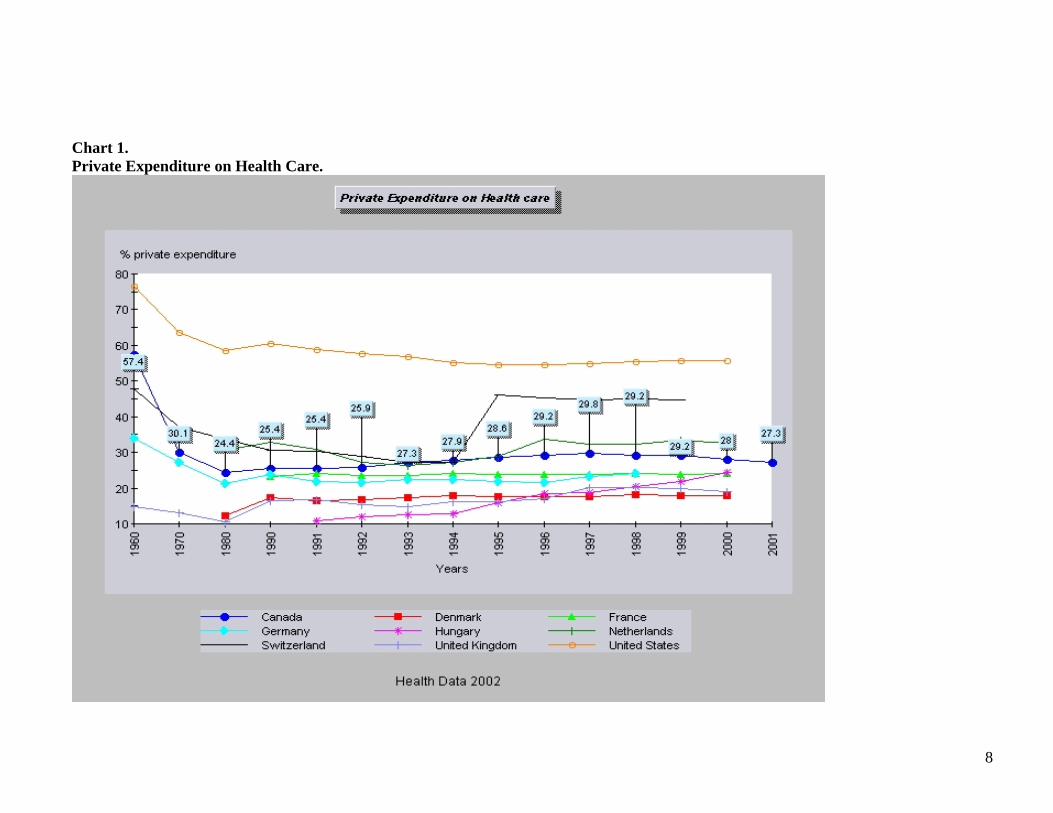
Chart 1. Private Expenditure on Health Care.
8

Table 4 Expenditure characteristics.
Characteristic Canada Denmark France Germany Hungary Nether-lands
Switz-erland
UK USA
US$PPP-econ-wide per capita
2587 (00) 4
2275 5
2125 7
2361 3
717 9
2259 6
2853 2
1569 (99) 8
4358 (99) 1
Main £ source Tax Tax SI SI SI SI SI Tax PI/Tax% public £ / TEH and 1990-8 trends
72.7 -
82.1 +/-
76 +/-
75.8 +/-
75.7 - -
68.6 -/+
73.2 ++
83.3 -
44.5 (99) ++
% GDP (2000) OECD + EU (8.0)
9.3 8.3 9.5 10.6 6.8 8.1 10.7 7.3 13.0
%GDP rank 5 6 4 3 9 7 2 8 1Source: Commissioned reports and OECD Health Data 2002. Unless otherwise indicated (99), figures given are from 2000. Averages are those for all OECD member countries. Table 5 Hospital ownership and healthcare resource allocation characteristics.
Country Characteristic
Canada Denmark France Germany Hungary Nether-lands Switzerland UK USA
Hospital Ownership
Private PublicLocal
Public and private
Public and private
Public Local
Private Pubic (canton)and private
Public Private mostlynon-profit
Public private split (%)
Public – 5% Private -0 Non-p – 95%
Public –99% Private – 1%
Public - 65 Private - 20 Non-p - 15
Public 55% Private – 7% Non-p –38%
Public – 96% Private – 2% Non-p – 2%
Public – 15% Private – 0 Non p – 85%
Public and non-p 67% Private 33%
Public - 94%+ Private 6%
Public – 24% Private – 15% Non-p 61%
Physician payment
Mainly FFS Mixed Capitation+ FFS
FFS + some extra billing
FFS Capitation Capitation.FFS for privately insured
FFS Capitation +expenses
Mixed. Managed care. Some FFS
Money follows patient (accountability)
Yes Weakly -Increasing
Yes Yes. Yes Yes Yes, in Canton Not yet Yes. Managed care
Hospital payment
Global budgets Variation between states.
Prospective global budgets
Prospective global budgets + activity related £
DRGs Dual financing
FFS prospectivebudgets
Varies b/w Cantons Dual financing
Activity related purchaser provider contracts
Mixed
Source: Commissioned authors’ research. European Observatory HIT reports, and Mossialos and Le Grand, 1999. US figures from American Hospital Association
9

Table 6 Other system features.
Country Characteristic
Canada Denmark France Germany Hungary Nether-lands Switz-erland UK USA
Equity in access (a)
Good Good Good Good Good Good Good Good 15% Uninsured(c. 40 million)
GP Gatekeeping
Yes Yes No V. weak Weak Yes No Yes HMO
National Concerns
Waiting lists Significant dissatisfaction. Increased PI queue hopping
Waiting lists. High expenditure
High expenditure
Informal payments
Waiting lists. High expenditure
Waiting lists. PI queue hopping
High expenditure Uninsured Managed care restrictions
Source: Commissioned authors’ research. (a) Source Wagstaff et al (1993). And commissioned author’s reports (2002). Note that equity in access does not imply that patients receive high quality and appropriate care. Table 7 Healthcare resources. Country Characteristic
Canada Denmark France Germany Hungary Nether-lands Switz-erland UK USA
Physicians per 1000 pop Low 2.1
High 3.4 (1999)
Average 3.0
High 3.6
High 3.2
c. Av. 3.2
High 3.5
Low 1.8
Low 2.8
Specialists per 1000 pop 0.9 0.1 1.5 2.4 2.4 0.9 2.1 1.6 1.4GPs per 1000 pop 0.9 0.6 1.5 1.0 0.7 0.5 0.4 0.6 0.8Nurses per 1000 pop 7.6 7.3 6.0 (97) 9.3 4.9 13.0 14 5.3 8.3 Inpatient beds per capita (1000) (a)
3.9 4.5 8.2 9.1 8.2 10.8 17.9 4.1 3.6
Acute beds 1000 pop 3.3 3.3 4.2 6.4 6.4 3.5 4.1 3.3 3.0CT Scanners per million 7.1 10.9 9.6 17.1 5.4 7.2 (92) 18.5 3.6 13.6 MRIs per mill. 2.5 (00) 6.6 (00) 2.5 (97) 6.2 (97) 1.5 (99) 3.9 13.0 3.9 (99) 8.1 Public Investment in med facilities as % TEH + per capita PPPs
3.3 84
2.8 68
2.4 50
2.6 63
- -
- -
2.7 76
2.5 39
0.4 15
Source: Commissioned authors’ research. OECD Health Data 2002. (a) Beds in nursing homes are not included. Source OECD 2002.
10
Table 8 System Resources. Rankings. Characteristic Canada Denmark France Germany Hungary Nether-
lands Switz-erland
UK USA
Physicians per capita
8 1 6 1 4 5 1 9 7
Inpatient hospital beds per capita
8 6 4 3 5 2 1 7 9
Acute beds 7 6 4 1 2 5 3 9 8 MRI Scanners (per million capita)
8 3
7
4
9
5-6
1
5-6
2
CT Scanners per million capita
7 4 5 2 8 6 1 9 4
Consultations Per capita
4 5 2 3 1 7 - 8 6
Expenditure $PPP
4 6 7 3 9 5 2 8 1
Source: Derived from latest available figures on OECD Health Data, 2002. Based on the funding system and certain other health system characteristics such as the number of physicians and expenditure levels (see Tables 4-8), our reference countries can be divided into four groups (see Table 9). Table 9 Income, Expenditure and funding type.
Income and Expenditure
Middle income Low expenditure
High income Moderate expenditure
High income High expenditure
High income Very High expenditure
Countries and their funding mechanisms
Hungary (SI) Denmark (tax) UK (tax)
Canada (tax) France (SI) Germany (SI) Netherlands (SI) Switzerland (SI)
USA (PI/tax)
The solitary member of the first group is Hungary, a middle-income country,21 which along with its former Communist neighbours, has recently embarked on major health system reform – away from the Semashko public monopoly tax model back to the social insurance systems that predate the Communist era.22 Though mostly a publicly financed system, under-the-table informal payment continues and acts as a barrier for the poor. Hungary has low expenditure (under US$1000 PPP), but an above average number of physicians. The World Bank classifies the remaining countries as of high income. Following the example of Jeremy Hurst, Head of the OECD Health Policy Unit, we can divide them into three further groups.23 The UK and Denmark, which have expenditure between US$ 1200 and US$ 2100 per capita, are in the first group of high-earning countries with low expenditure. Along with other OECD countries that fall into this group, they place an above-average (that average being about 75% of total expenditure on health in 1998) reliance on public expenditure with taxation as the main source of funds.24 Hospital ownership is mainly public and hospital doctors and GPs are paid mainly by salary or capitation. Though health status in both countries is high and equity in access is officially according to need, there are significant waiting times for specialist care.25 Health care expenditure relies heavily on politically controlled general taxation in the UK – and there is an unwillingness to pay more tax.
11

The second group of high-earning countries includes Canada, France, Germany, the Netherlands and Switzerland. Expenditure per capita is between US$1500 and US$ 2900. With other OECD countries that would fall into this group (Japan, Austria, Belgium, and Luxembourg) the share of public expenditure is also high (around the 1998 average of about 75 per cent) but, with the exception of Canada (decentralised tax), they are all based on compulsory social health insurance. Among these countries, there are many different ways of organising healthcare funding through independent third-party payers (sickness funds), with various decision-making procedures and methods for the collection of contributions, risk pooling and redistribution between funds. Meanwhile, healthcare provision is made by a mixture of public and private not-for-profit and profit-making organisations. Hospitals are more likely to be private and non-profit in this group and fee-for service payment is more common. Health status is high and equity of access good. With the exception of Canada (2.1 per 1,000), the number of physicians per capita is at or above the OECD average (3.0 per 1,000).26 Waiting times for specialists are shorter.27 However, the Netherlands experiences significant waiting lists, and compared to its neighbour, so does Canada. Rising health expenditure and supplier-induced demand are current concerns in these countries. Some consider the burden of social contributions on employers and employees in France, Germany and the Netherlands, too great. The USA like Hungary is alone. With expenditure of over US$ 4000 per capita, it is the highest spending country in the world. Voluntary employer-related private insurance is the main source of health care finance. This is supplemented by public schemes for children, the elderly and poor. Hospitals are mostly private non-profit. Managed care was introduced to improve cost control in the 1990s.28 System features or characteristics associated with social insurance and tax-based systems are presented in Table 10.
12

Table 10 System features / characteristics associated with social insurance and tax-based systems. System features/ characteristics
Other comments
Social /Insurance systems
Tax-based systems
Supply side constraints Low High Access to radiation therapy Easier Serious delays No of revascularisation procedures performed
Higher than expected Lower than expected
Spending level Higher low Financial transparency Between
contributions and benefits
Higher, degree depends on Low, though higher in some decentralised systems
Number of specialist stroke units (SSUs)
SSUs were adopted earlier and faster in public integrated systems (Scandinavia)
No clear trend No clear trend Low in the UK
Rate of mammography Tends to be higher in public integrated
systems
No clear trend No clear trend UK among lower use group
No of mammography machines
Higher, if few constraints on technology diffusion
Tend to be lower in countries with explicit constraints on technology diffusion
Public health priorities Weak tendency to be treatment orientated. Some conflict of interest
Weak tendency to be prevention orientated
Hospital payment constraints Weaker (except NL) Strong Payment systems Flexible (fee-for-service,
DRGs) Fixed (global budgets)
Source: based on commissioned authors’ research and the findings of the OECD Ageing Related Disease Study Programme.
13

4. Healthcare Outcomes in Nine Countries It is generally accepted that mortality is a poor measure of the performance of a health care system, largely because so much mortality can be explained by non-medical factors beyond the scope of the health system.2930 It is perhaps best to think of the health sector as having a ‘repairing’ role.31 We have attempted to identify those changes in health status strictly attributable to the activities of the health system.32 In some cases death can be avoided or significantly delayed if appropriate medical treatment is given in time. In such instances, mortality can be used as a healthcare system performance indicator. More recent studies have relied, not so much on mortality, but on potential years of life lost (PYLL).33 We collated available measures of medical performance for the two main killers - cancer and diseases of the circulatory system, including coronary heart disease and stroke. For cancer we compared post-diagnosis one-year and five-year survival rates, which offer a good indication of the performance of a health care system. For Denmark, the Netherlands, France, Germany, Switzerland and the UK, cancer survival data come from the EUROCARE II study.34 Cancer survival data for the USA are from the National Cancer Institute’s Surveillance, Epidemiology and End Results program (SEER). IHD incidence and mortality have been monitored by the WHO-MONICA study. We use their published data. The frequency of use of medical interventions of recognised effectiveness can also be employed as an indicator of health care system performance. For example, two types of heart disease operations, coronary artery bypass grafting (CABG) and percutaneous transluminal coronary angioplasty (PTCA), are considered effective treatments in relieving pain, preventing heart attacks and prolonging life.35 PTCA has seen increases in prevalence in recent years but, according to a study by Pierre Moise of the OECD, there is considerable variation between OECD countries.3637 Ten per cent of the world’s population died from strokes in 1999, and WHO 2000 estimated that between three and 11 per cent of the total disease burden (deaths and disability) is attributed to stroke. As part of the OECD’s Ageing-Related Disease (ARD) study programme38, Lynelle Moon has compared incidence, stroke treatments, health outcomes and costs in 17 countries. We include the findings of this OECD study and two others, on breast cancer and ischaemic heart disease (IHD). Tables 11-15 show healthcare outcome rankings for all our countries and survival rates for the major cancers for those countries included in the EUROCARE II study. General Outcome Measures General indicators such as life expectancy and infant mortality are also shown but provide only limited information. However, as Jeremy Hurst of the OECD concludes: ‘The evidence on both health outcomes and waiting times suggests, if only superficially, that countries tend to get what they pay for. Premature mortality declines as physician numbers increase and waiting times for specialist care decline as expenditure per capita rises’.39
14

Table 11 Rankings of outcomes, (cross sectional premature mortality: PYLL before age 70, all causes, 1998), CHD and cancer survival rates. Country Canada Denmark France Germany Hungary Neth. CH UK USA Life expectancy (at birth) Male rank F rank
2 3
7 8
4 1
6 4
9 9
3 5
1 1
4 6
8 7
Life (at 65) expectancy Male rank F rank
3 3
8 8
2 1
5 4
9 9
7 6
1 2
6 7
4 5
Infant Mortality Per 1000, births
5 5 2 1 9 4 3 7 8
PYLL M/ F (all causes)
4 4
5 7
7 3
6 2
9 9
1 8
2 1
3 6
8 8
Information is from OECD Health Data 2002 Rankings of non-medical determinants of healthcare outcomes and patient satisfaction rates are presented in Table 12. For interest, these rankings are added together to give a very rough picture of ‘environmental inputs’. Environmental inputs must be borne in mind when interpreting the outcomes data. Table 12 Non-medical / ‘environmental factors’ rankings. Country Canada Denmark France Germany Hungary Neth. CH UK USA Tobacco consumption M/F (1=lowest)
2 2
5 8-9
6 4
4 3
9 5
7 8-9
8 7
3 6
1 1
Alcohol consumption
1 8 9 5 6 3 7 4 2
Butter consumption
4 5-8 (6.5) 5-8 (6.5)
5-8 (6.5) 1 5-8 (6.5)
9 2 3
Body weight Obesity M/F
6 6
2 2
4 3
5 5
7 7
1 4
2 1
6 8
8 9
GDP per capita(PPPs)
4 3 7 6 9 5 2 8 1
Income inequality
4 1 2 3 - - - 5 6
Patient satisfaction (a)
- 1 (91)
3 (65)
4 (59)
- 2 (70)
5 (57)
-
Total 25 35 39.5 34.5 44 35 36 37 25 rank 1-2 4-5 8 3 9 4-5 6 7 1-2 Sources: OECD Health Data, 2002; Or, 1997, 2000A. (a) As the data (from Mossialos’ 1998 Eurobarometer survey) are incomplete, patient satisfaction and income inequality are not included in averages. A low number typically indicates countries with low levels of inequality and low consumption of products considered to be detrimental to health. Figures in parenthesis represent the sum of percentages of those sampled who are either fairly satisfied or very satisfied. Cancer incidence and outcomes The EUROCARE II study found that for colorectal cancer, survival rates were high in the Netherlands, Switzerland and France, while Eastern European countries, the UK and
15

Denmark had low survival rates.40 Hungary was not part of the EUROCARE II Study. The US compares favourably with the best European countries for cancer survival.41 Table 13 Cancer care survival groups (All cancers) Group one Low survival rates
Group two Group three Group four High survival rates
Hungary
Denmark UK
Germany Netherlands
USA Canada Switzerland France
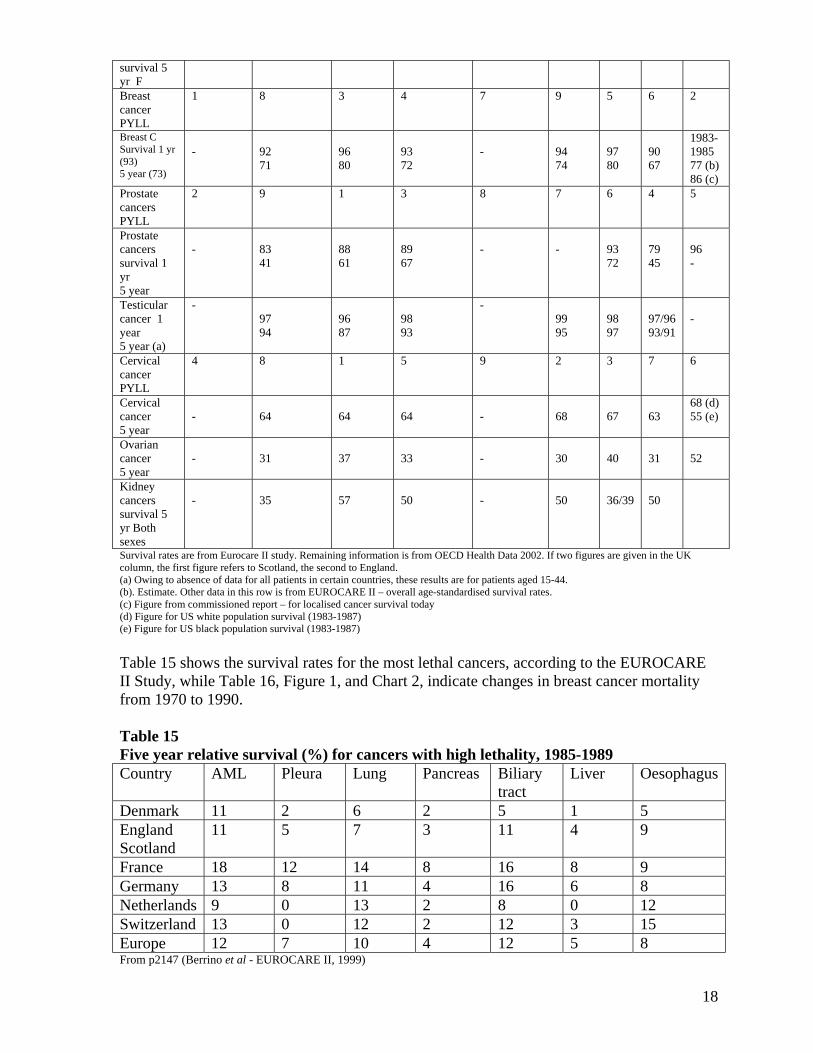
Source: derived from Eurocare II study results. Survival rates from liver cancer are generally poor, but among our reference countries (excepting Hungary for which there are no data) Denmark stands out as the worst with the UK below the European average.42 Lung cancer survival rates vary considerably in Europe. The lowest rates were found in Denmark and the UK, while the highest rates were found in France, The Netherlands and Switzerland. Janssen-Heijnen et al, of the EUROCARE II Study, suggest that the lower survival rates for patients with lung cancer in the UK may be partly explained by poor access to specialised care. The number of consultants is lower than in most other European countries, the percentage of histological verification was considerably lower, 43 and the proportion of patients receiving ‘curative’ treatment was also much lower.44 45 The proportion of patients with small cell lung cancer receiving chemotherapy was highest in France, the Netherlands and Switzerland, and lowest in the UK. The proportion of patients receiving surgery was relatively high in Switzerland, France and the Netherlands, and low in the UK.46 Janssen-Heijnen et al conclude that variation in access to specialised care was the most likely explanation for variations in lung cancer survival. Four groups emerged when breast cancer survival was compared in the EUROCARE II Study. Switzerland and France were in the best performing group, Denmark, the Netherlands and Germany in the second group. Scotland and England (with Slovenia) were below average in a third group, while Slovakia, Poland and Estonia were in the worst performing group. While most countries presented a stable or increasing survival rate with increasing age of patients, England, Scotland, Slovakia, Poland and Estonia showed lower survival for the elderly,47 perhaps suggesting age-based rationing. The EUROCARE II study found five-year survival for gynaecological tumours (cervical and ovarian cancer) generally to be higher in the Netherlands and Switzerland than in other European countries.48 Researchers concluded that differences in survival for cervical cancer are almost certainly related to differences between screening programmes - given that screening can aid diagnosis of asymptomatic malignant disease, and that early diagnosis allows early treatment.49
16

The EUROCARE II Study found that the lowest survival rates for prostate cancer were seen in the Eastern European countries, the UK and Denmark, while the highest survival rates were again found in Switzerland.50 Researchers were cautious in interpreting these results, noting that high rates in Switzerland could be distorted by the high-rates of patients lost to follow-up (11 per cent) and to the emigration of patients. They also consider that very low survival rates in Denmark may be explained ‘by the rather reserved attitude of Danish physicians,’ which affects diagnosis in prostate cancer cases.51 Survival for patients with testicular cancer is good in all our reference countries for which we have data. Dutch members of the EUROCARE Working Group, Damhuis and Kirkels, analysed kidney cancer survival and found large variations between countries.52 France performed very well, Germany, Switzerland and the Netherlands were roughly equal, while Denmark and Scotland rank alongside the worst performing eastern European countries. With a 5-year survival rate of 39 per cent, England was not much better. Results from the USA show the 5-year relative survival for urothelial carcinoma was 66 per cent for men and 57 per cent for women compared with 58 per cent and 59 per cent for renal carcinoma.53 These figures clearly exceed the 48 per cent average 5-year relative survival rate in Europe.54 It is clear that one weakness of Danish healthcare is the treatment of cancer. Vallgarda notes that Danish case fatality rates for lung and breast cancer are 10 per cent higher than in Sweden.55 Table 14 Cancer survival rates and rankings. Country Canada Denmark France Germany Hungary Neth. CH UK USA Cancer PYLL M/F
1 4
7 8
8 1
6 3
9 9
3 7
5 2
2 6
4 5
All Cancer 5-yr survival M F
- -
42 52
42 59
49 59
- -
35 51
51 62
29/42 38/51
1997 m+f 62
Lung Cancer PYLL M/F
2 6
4 8
5 1
7 3
9 9
6 5
3 2
1 4
8 7
Lung Cancer survival Males 1 yr 5 year
- -
24 6
40 12
30 9
- -
39 12
38 10
23 7
M+F 41 15
Lung Cancer survival female 1 yr 5 year
- -
25 6
41 16
33 14
- -
39 11
38 11
22 7
M+F 41 15
Cancer colon PYLL M/F
3 4
7 8
2 1
8 7
9 9
5 6
1 2
6 3
4 5
Colon cancer survival 5 yr M
-
39
52
50
-
59
52
41
M+F 61
Colon cancer
-
43
54
50
-
56
49
41
M+F 61
17
survival 5 yr F Breast cancer PYLL
1 8 3 4 7 9 5 6 2
Breast C Survival 1 yr (93) 5 year (73)
-
92 71
96 80
93 72
-
94 74
97 80
90 67
1983-1985 77 (b) 86 (c)
Prostate cancers PYLL
2 9 1 3 8 7 6 4 5
Prostate cancers survival 1 yr 5 year
-
83 41
88 61
89 67
-
-
93 72
79 45
96 -
Testicular cancer 1 year 5 year (a)
- 97 94
96 87
98 93
- 99 95
98 97
97/96 93/91
-
Cervical cancer PYLL
4 8 1 5 9 2 3 7 6
Cervical cancer 5 year
-
64
64
64
-
68
67
63
68 (d) 55 (e)
Ovarian cancer 5 year
-
31
37
33
-
30
40
31
52
Kidney cancers survival 5 yr Both sexes
-
35
57
50
-
50
36/39
50
Survival rates are from Eurocare II study. Remaining information is from OECD Health Data 2002. If two figures are given in the UK column, the first figure refers to Scotland, the second to England. (a) Owing to absence of data for all patients in certain countries, these results are for patients aged 15-44. (b). Estimate. Other data in this row is from EUROCARE II – overall age-standardised survival rates. (c) Figure from commissioned report – for localised cancer survival today (d) Figure for US white population survival (1983-1987) (e) Figure for US black population survival (1983-1987) Table 15 shows the survival rates for the most lethal cancers, according to the EUROCARE II Study, while Table 16, Figure 1, and Chart 2, indicate changes in breast cancer mortality from 1970 to 1990. Table 15 Five year relative survival (%) for cancers with high lethality, 1985-1989 Country AML Pleura Lung Pancreas Biliary
tract Liver Oesophagus
Denmark 11 2 6 2 5 1 5 England Scotland
11 5 7 3 11 4 9
France 18 12 14 8 16 8 9 Germany 13 8 11 4 16 6 8 Netherlands 9 0 13 2 8 0 12 Switzerland 13 0 12 2 12 3 15 Europe 12 7 10 4 12 5 8 From p2147 (Berrino et al - EUROCARE II, 1999)
18
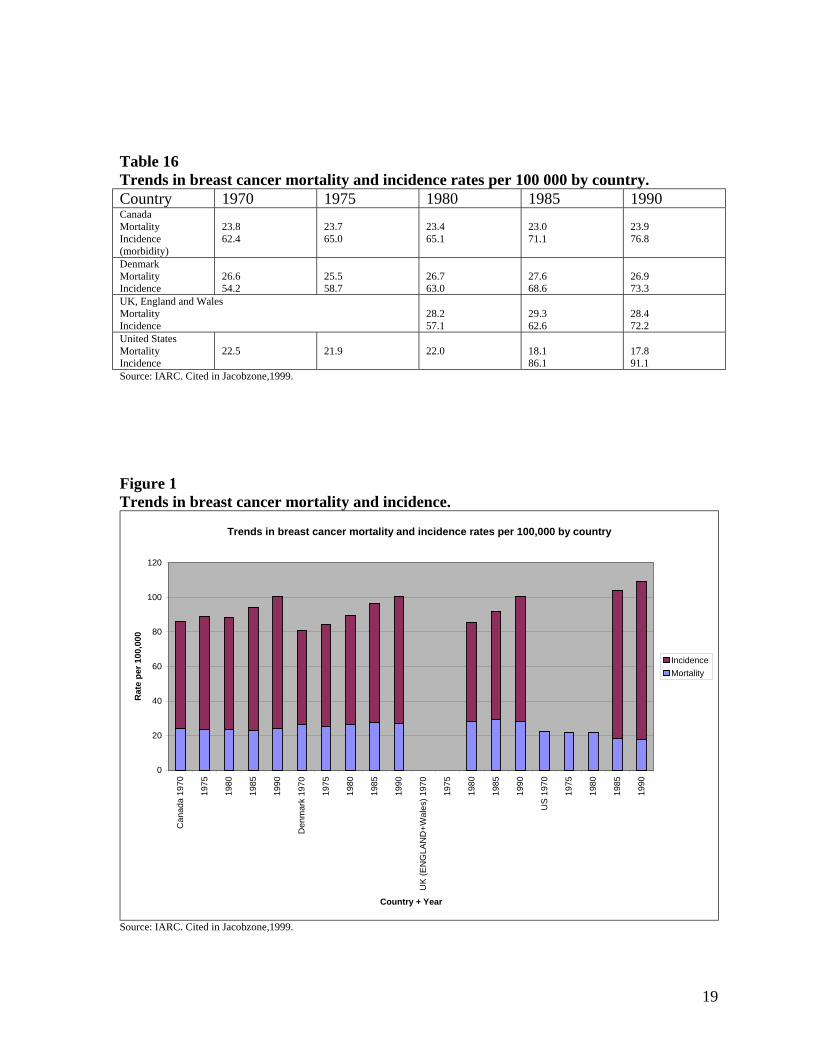
Table 16 Trends in breast cancer mortality and incidence rates per 100 000 by country. Country 1970 1975 1980 1985 1990 Canada Mortality Incidence (morbidity)
23.8 62.4
23.7 65.0
23.4 65.1
23.0 71.1
23.9 76.8
Denmark Mortality Incidence
26.6 54.2
25.5 58.7
26.7 63.0
27.6 68.6
26.9 73.3
UK, England and Wales Mortality Incidence
28.2 57.1
29.3 62.6
28.4 72.2
United States Mortality Incidence
22.5
21.9
22.0
18.1 86.1
17.8 91.1
Source: IARC. Cited in Jacobzone,1999. Figure 1 Trends in breast cancer mortality and incidence.
Trends in breast cancer mortality and incidence rates per 100,000 by country
0
20
40
60
80
100
120
Can
ada
1970
1975
1980
1985
1990
Den
mar
k 19
70
1975
1980
1985
1990
UK
(EN
GLA
ND
+Wal
es) 1
970
1975
1980
1985
1990
US
1970
1975
1980
1985
1990
Country + Year
Rat
e pe
r 100
,000
IncidenceMortality
Source: IARC. Cited in Jacobzone,1999.
19

Chart 2. Trends in Breast Cancer Mortality and Incidence rates
Trends in breast cancer mortality and incidence rates
0
10
20
30
40
50
60
70
80
90
100
1970 1975 1980 1985 1990
Year
Rat
e pe
r 100
,000
Canada Incidence RateDenmark Incidence RateUK (England and Wales) Incidence RateUS Incidence RateCanada Mortality RateDenmark Mortality RateUK (England And Wales) Mortality RateUS Mortality Rate
Source: IARC. Cited in Jacobzone,1999. Stroke incidence and outcomes The OECD ARD team found that Sweden, Norway, Italy and Denmark have the highest incidence rates among the countries studied, while the UK and Australia have the lowest incidence.56 However, mortality rates do not reflect incidence (see Table 18). Table 17 Cerebrovascular disease mortality, ranking and number of neurologists.
Country Italy Canada Denmark
France Germany Hungary Neth. CH UK USA
Cerebrovascular mortality per 100,000 (a) Male Female
- - - -
47.7 (2) 39.2 (2)
66.0 (6) 51.8 (6)
48.5 (3) 34.5 (1)
70.7 (8) 54.4 (7)
178.9 (9) 119.7 (9)
61.6 (5) 51.4 (5)
54.3 (4) 41.3 (4)
66.8 (7) 61.1 (8)
44.7 (1) 40.9 (3)
No of Neurologists 10.4 - 4.6 - - 0.4 4+ - 0.4 - Mortality information is from OECD Health Data 2002. Neurologist figures are from OECD, ARD team (2002). (a). 1997 figures standardised to the European standard population. Aged 40 and over. Table 18 Hospital and case fatality rates for ischaemic stroke patients. Low fatality rates Denmark, Switzerland Medium fatality rates US, Canada High fatality rates UK
Source: derived from OECD, ARD team (2002). p. 19.
20

The OECD ARD team recorded in-hospital mortality and one-year case mortality.57 In-hospital mortality reveals few differences between countries, with the exception of the UK which has significantly higher fatality rates in the first seven days for all age groups. Fatalities in the UK were roughly twice the average. These figures should be interpreted with caution, as the severity of cases admitted was not controlled for, and there are different admission practices between countries. However, case fatality rates include care outside hospital and a similar pattern is seen to that for in-hospital mortality. Rates are lowest in Denmark, and highest by far in the UK, suggesting that the standard of care in the UK is inadequate. The availability of specialists has a significant impact on outcomes and the UK has a significantly smaller number per 100,000 population. The number of neurologists per 100,000 is shown in Table 15. IHD incidence and outcomes Death rates from IHD in the UK have not been falling as fast as in some other countries. For example, the death rate for men aged 35-74 fell by 33 per cent between 1984 and 1994 in the UK, but it fell by 44 per cent in Australia, 40 per cent in Canada and 38 per cent in the Netherlands. For women, the death rate fell by 29 per cent in the UK, but fell by 41 per cent in France and 38 per cent in Canada.58 Moise and the OECD ARD team, studied one-year IHD case fatality rates and found Finland to have the highest rates, while the UK and the US were in a middle group.59 Canada and Australia had the lowest fatality rates. Table 19 divides those of our reference countries that were included in their study, according to Moise’s conclusions. Table 19 One-year IHD case fatality rates
Low fatality rates Canada Medium fatality rates UK, US High fatality rates Hungary
Source: Moise et al. Overall circulatory disease outcomes are ranked in Table 20. Table 20 Rankings of circulatory disease outcomes. Country Canada Denmark France Germany Hungary Neth. CH UK USA Diseases of circulatory system M/F PYLL
3 3
5 4
1 1
6 6
9 9
4 5
2 2
7 7
8 8
PYLL IHD M/F 5 5
4 6
1 1
6 3
9 9
3 4
2 2
8 7
7 8
PYLL AMI M/F
3 2
2 3
1 1
7 4
8 8
6 5
- -
5 7
4 6
Information is from OECD Health Data 2002
21

5. Impact of health systems and expenditures on outcomes The evidence so far is that medical outcomes vary considerably, and that the UK performs badly compared with countries of similar wealth, but is there a link between expenditure and medical outcomes? Total expenditure on health and the number of doctors per head Swiss researchers Dr. Gianfranco Domenighetti and Jacqueline Quaglia studied illnesses from which death can be avoided or significantly delayed if appropriate medical treatment is given in time (pneumonia, cancer of the cervix/uterus, tuberculosis, Hodgkin’s disease, appendicitis, hypertension, liver disease and cirrhosis, and heart disease). They calculated levels of global standardised avoidable mortality in 15 European countries. Illnesses were placed in two groups: one that included all the above diseases except coronary heart disease (CHD) and a second that included CHD. They also produced rankings from 0-10 for infant mortality, maternal mortality, and public satisfaction with the healthcare system. Health expenditure for each country was based on purchasing power parities (PPPs). They found that:
• Infant mortality was significantly worse in countries with low health expenditure and fewer physicians per head;
• Maternal mortality and avoidable mortality owing to medical intervention (with or without the inclusion of CHD) were not correlated with health expenditure or the number of acute beds, but were significantly correlated to the number of doctors per head. As the number of doctors rose, levels of mortality fell.
• Public satisfaction with the healthcare system rose alongside health expenditure up to a ‘rupture’ point ($PPP 1750) after which the correlation was negative.
Domenighetti and Quaglia’s results further indicate that:
• A cluster of consistently higher indicators is found among those countries spending $1700 PPP per capita, or more.
• Beyond that threshold, one does not find a clear positive correlation between performance and increased expenditure.
• The best performing country is Sweden, with expenditure of $1701 per capita. • The worst performing country was the UK – which was ranked 3 (on a scale from 0-
10) for infant mortality, 0 for avoidable mortality excluding CHD and 1 if CHD is included. France ranked 0 for maternal mortality, but 6 for mortality excluding CHD, 9 if CHD is included and 7 for infant mortality.60
Increased expenditure may not lead to more healthcare throughput because increased funds may be inefficiently spent (as in the US, the UK and some say Germany) and healthcare inflation may be ahead of general price inflation - a problem in Switzerland, but also a feature of nearly all OECD countries, according to OECD Health Data 2002. Moreover, costs per unit of treatment are significantly higher in the US. For example, there are large differences between PTCA unit costs in the US and all other countries. 61 Moise suggests that this cost difference may partly explain the greater use of PTCA in the US in the treatment of heart-attack (AMI) patients, especially given the fact that physicians are paid on a fee-for-service basis which is generally thought to encourage greater procedure use.62 This cost per unit data goes some way to explaining why US health expenditure is so high when compared to all other countries. It also explains why a large portion of that increased health
22

expenditure may not serve to improve health outcomes. It has been estimated that 30 percent of all direct U.S. health care outlays - $390 billion – are the result of ‘poor quality care, consisting primarily of overuse, misuse and waste.’63 Much of this is caused by providers performing unnecessary or unnecessarily expensive procedures because they profit from them whilst consumers have little reason to question the costs.64 Other scholars have sought to identify more closely the connection between resources and outcomes. Zeynep Or tested what she called the ‘received wisdom’ among health economists that the marginal productivity of medical care was close to zero in industrial countries. She looked at total medical employment, the number of doctors per head, and the number of hospital beds. She dropped hospital beds and total health employment as input variables from the analysis, as neither had a significant effect on health status. The study focused on a relatively untested measure of volume, the number of physicians per 1,000 population. She found that the availability of doctors was associated with significant achievements in health status measured by reductions in deaths before the age of 70, or potential years of life lost (PYLL). It is regarded as a better measure than mortality, which attaches equal weight to all deaths, whereas the PYLL treats death at a younger age as more serious. More specifically, she found ‘that the impact of health care, as measured by doctors per capita, on premature mortality appeared to be relatively large and significant for both men and for women. She also compared the number of doctors with some non-medical variables and found that the number of doctors per head was second to occupational group (a variable reflecting both income and education). The number of doctors per capita was the most important factor behind the reduction in premature mortality as a result of heart disease.65 For cancer, there was a difference between men and women. For women the number of doctors per capita was one of the major factors behind the reduction in premature mortality, while for men the variable was not significant. Overall, she concluded that ‘a 10 per cent increase in doctors, holding all other factors constant, would result in a reduction in premature mortality of almost four per cent for women and about three percent for men.’66 She points out that the number of doctors in many countries is controlled precisely to restrict activity. In the UK, for instance, there has been very rigid control. Inevitably, such measures have tended to increase premature deaths. Jeremy Hurst of the OECD and Gaetan Lafortune accept that ‘empirical evidence from OECD countries suggests that higher doctor numbers are significantly associated with lower mortality, after controlling for other determinants of health.’67 However they point out that the relationship between number of doctors in a country and total expenditure on health is not simple. For example, the number of physicians is relatively low in some countries with high expenditure such as the USA and Canada. Moreover, the regulations controlling patient access to physician services (for example, whether they have direct access to specialists or not) and methods of remuneration play an important role in determining the eventual cost. There is evidence, that in countries where physicians are paid by salary or capitation, a higher number of doctors is associated with lower total health expenditure, whereas in countries where physicians are paid on a fee-for-service basis, a higher number of doctors is associated with higher health expenditure, after controlling for other factors.68 Nevertheless, the conclusion may be drawn that the number of doctors is strongly correlated with health outcomes.
23
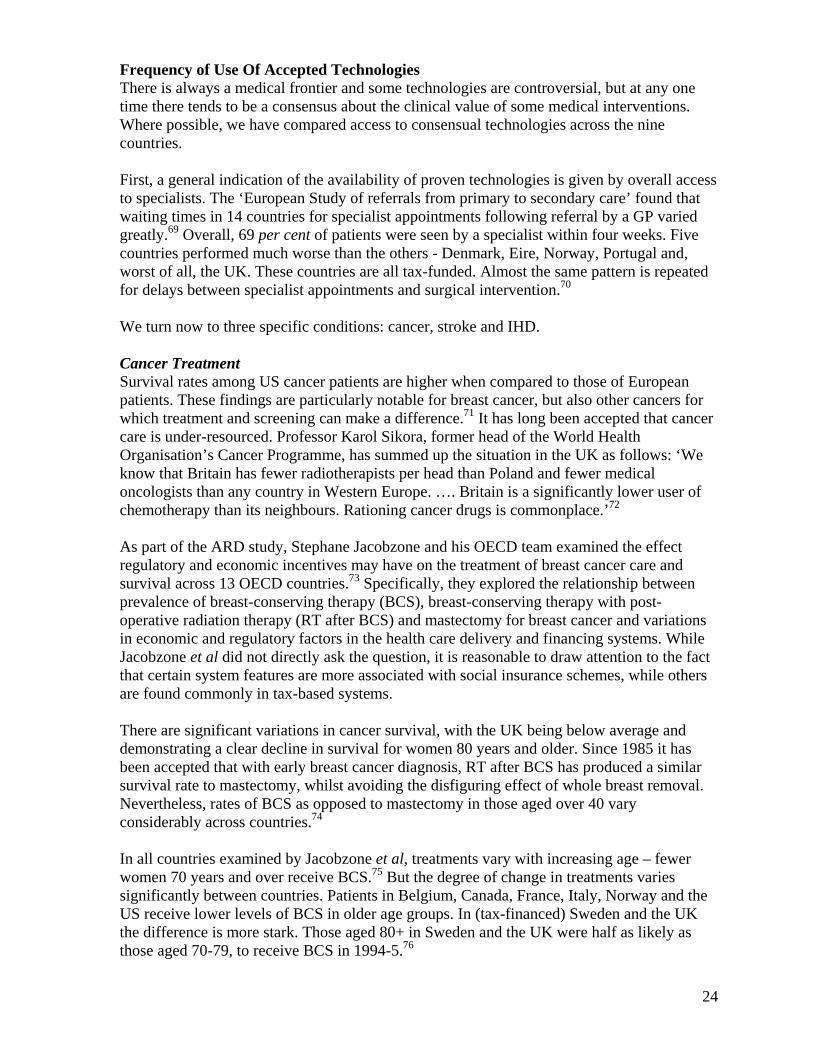
Frequency of Use Of Accepted Technologies There is always a medical frontier and some technologies are controversial, but at any one time there tends to be a consensus about the clinical value of some medical interventions. Where possible, we have compared access to consensual technologies across the nine countries. First, a general indication of the availability of proven technologies is given by overall access to specialists. The ‘European Study of referrals from primary to secondary care’ found that waiting times in 14 countries for specialist appointments following referral by a GP varied greatly.69 Overall, 69 per cent of patients were seen by a specialist within four weeks. Five countries performed much worse than the others - Denmark, Eire, Norway, Portugal and, worst of all, the UK. These countries are all tax-funded. Almost the same pattern is repeated for delays between specialist appointments and surgical intervention.70 We turn now to three specific conditions: cancer, stroke and IHD. Cancer Treatment Survival rates among US cancer patients are higher when compared to those of European patients. These findings are particularly notable for breast cancer, but also other cancers for which treatment and screening can make a difference.71 It has long been accepted that cancer care is under-resourced. Professor Karol Sikora, former head of the World Health Organisation’s Cancer Programme, has summed up the situation in the UK as follows: ‘We know that Britain has fewer radiotherapists per head than Poland and fewer medical oncologists than any country in Western Europe. …. Britain is a significantly lower user of chemotherapy than its neighbours. Rationing cancer drugs is commonplace.’72 As part of the ARD study, Stephane Jacobzone and his OECD team examined the effect regulatory and economic incentives may have on the treatment of breast cancer care and survival across 13 OECD countries.73 Specifically, they explored the relationship between prevalence of breast-conserving therapy (BCS), breast-conserving therapy with post-operative radiation therapy (RT after BCS) and mastectomy for breast cancer and variations in economic and regulatory factors in the health care delivery and financing systems. While Jacobzone et al did not directly ask the question, it is reasonable to draw attention to the fact that certain system features are more associated with social insurance schemes, while others are found commonly in tax-based systems. There are significant variations in cancer survival, with the UK being below average and demonstrating a clear decline in survival for women 80 years and older. Since 1985 it has been accepted that with early breast cancer diagnosis, RT after BCS has produced a similar survival rate to mastectomy, whilst avoiding the disfiguring effect of whole breast removal. Nevertheless, rates of BCS as opposed to mastectomy in those aged over 40 vary considerably across countries.74 In all countries examined by Jacobzone et al, treatments vary with increasing age – fewer women 70 years and over receive BCS.75 But the degree of change in treatments varies significantly between countries. Patients in Belgium, Canada, France, Italy, Norway and the US receive lower levels of BCS in older age groups. In (tax-financed) Sweden and the UK the difference is more stark. Those aged 80+ in Sweden and the UK were half as likely as those aged 70-79, to receive BCS in 1994-5.76
24

Treatment patterns in the UK are singled out for comment; both mastectomy and BCS rates for older women are very low compared to other countries. Jacobzone et al show that mastectomy rates tend to rise with age (at least to age 79). However, the UK shows a rate of 11 per cent of those 80+ receiving mastectomy, with the average around 46 per cent. The UK also has a very low BCS rate for those aged 80+ of only 14 per cent, compared to the average of 32 per cent. The use of RT after BCS again varies widely from 57% of those receiving BCS in Italy, to 90 per cent and 93 per cent in Belgium and France respectively. Variation in RT by age is notable in all countries; there is a sharp decline for those over 70. A drop at ages 70-79 occurs in Canada, Italy, Sweden and the UK. However, in Belgium, France and the US patients in that group receive similar treatment to those in younger groups. All countries experience a significant drop at age 80+, though the reasons for this consistent drop are not established.77 Screening affects survival, and has a direct effect on early detection and the number of diagnosed cases.78 The progression of the disease at diagnosis determines the type of treatment that can be offered, the response to treatment, and survival chances.79 Jacobzone concluded that it was likely that countries with a higher proportion of cancers at an advanced stage might be ‘experiencing lack of access to mammography screening and other diagnostic services – whether it is the supply of machines or human resources that cause delays in diagnosis’.80 It is apparent that countries, such as the USA, with high breast cancer incidence also tend to have higher survival rates. It is likely that screening reveals minor cancers many of which are unlikely to result in death, boosting both incidence and survival rates. There is some evidence that older women (70+) may not be receiving a regular mammogram. In Canada 65-70 per cent of women aged 50-60 report receiving a mammogram in the preceding two years. This percentage falls to 44-49 for those 70 and over. Only 3.2 per cent of those 70+ in the UK are screened.81 Jacobzone et al highlight the UK’s poor record in breast cancer screening, and draw the rather cautious conclusion that ‘given the restrictions in terms of the availability of qualified medical staff, screening and radiation treatment equipment, financial constraints in terms of treatment may have had an impact on outcomes.’ Delays in radiation therapy that could be linked to resource availability and productive efficiency were highlighted in Canada, Norway, Sweden and the UK, (all tax-funded systems).82 Jacobzone’s final conclusion is that better performance is achieved through a mix of population-based breast cancer screening programmes, combined with treatment protocols that follow the most recent clinical guidelines, without being unnecessarily limited by economic constraints.83 Again, the payment mechanism also had an impact on medical outcomes. Moon et al, note that those countries using global budgets (Norway, Sweden, Canada and the UK) generally have BCS rates lower than 50 per cent. Countries with DRG or fee-for-service payment systems had higher rates.84 Flexible payment mechanisms as seen in France, Belgium and the US, allow each patient to be seen as a source of income, giving more incentive to refer.85 Other studies have also found that reimbursement practices themselves affect treatments
25

provided. In the US it has been found that higher reimbursement levels for BCS lead to greater BCS use.86 Ischaemic Heart Disease Treatment Moise et al examined elements of health systems that influence IHD treatment. They found that tax-funded countries (Canada, Denmark, Norway and the UK) were most likely to restrict the number of specialist units (revascularisation facilities), and would also have the lowest number of such facilities. Meanwhile the artificial restriction of such facilities was weakest in social insurance countries (Belgium, Switzerland and Germany).87 Table 21. Level of IHD, Supply constraints and utilisation of revascularisations (our reference countries are in bold type)
Utilisation of revascularisation procedures High Medium Low
High level of IHD AUS, DEU, USA CAN, DNK, FIN, NOR, SWE
HUN, UK
Low level of IHD BEL, CH ESP, GRC, JPN, KO ITA SUPPLY CONSTRAINTS
Utilisation of revascularisation procedures REGULATION OF FACILITIES High Medium Low Strong constraint CAN, DNK, NOR UK Medium constraint AUS FIN, GRC, ITA,
SWE
Low constraint BEL,CH, DEU, USA
ESP, JPN, KOR HUN
HOSP PAYMENT METHODS
High Medium Low
Global budgets CAN, DNK, ESP, GRC, NOR, SWE
UK
Mixed financing AUS, USA FIN HUN, ITA Fee-for-service BEL, CH, DEU JPN, KOR PHYS PAYMENT METHODS
High Medium Low
Salaried DNK, ESP, FIN, JPN, NOR, SWE
HUN, ITA, UK
Mixed remuneration
AUS, DEU CAN, GRC
Fee-for-service BEL, CH, USA KOR Source: adapted from OECD ARD study findings, 2002. The relationship between utilisation and demand was examined by Moise and the OECD ARD team.88 They found the level of IHD to be a reasonably reliable indicator of demand for PTCA and CABG. Table 21 above shows that countries with high rates of IHD like Germany and the US have correspondingly high revascularisation rates. The converse applies for Italy. However, the relationship is more complex, as Belgium and Switzerland, countries with low levels of IHD, have higher revascularisation rates than most countries, including the UK and Hungary, which have much higher levels of IHD. Moise et al conclude that the main
26

contributory factor to high levels of use in social-insurance based Belgium and Switzerland is the lower influence of supply-side constraints.89 In their discussion, and without inferring what would be considered the optimal utilisation rate for a given level of IHD, Moise concludes that there is a weak relationship between level of IHD and utilisation rates for revascularisation procedures. Deviating significantly from the trend line, insurance-based US, Belgium and Germany perform more revascularisations than one would expect, while tax-funded Italy, Spain, the UK and Denmark perform fewer. Given their relatively high levels of IHD, Denmark and the UK perform particularly low numbers of revascularisations. Both CABG and PTCA treatment require special equipment. Moise et al confirm that the number of facilities equipped to perform the procedures is correlated with the utilisation levels of those procedures. The US performs the largest number of CABG procedures and has the highest number of cardiac surgery facilities per 100,000 population.90 This relationship is stronger for PTCA. The variation in the supply of specialist facilities can be explained by the imposition of supply-side constraints. This regulation tends to be greater in countries reliant on general taxation than in social insurance countries.91 Consequently, none of the countries with strong constraints (Canada, Denmark, Norway, the UK), had high utilisation for revascularisation procedures. The converse applies in Belgium, Switzerland, Germany and the US, where limited regulation was associated with high rates of utilisation (see Table 18). Provider payment methods appear to have similar effect to the regulatory regime; countries where fee-for-service is the main payment method for hospitals and physicians, have high levels of revascularisation. In the UK, with global budgets for hospitals and physicians paid by salary, revascularisation rates are among the lowest (Moise et al, 2002). If utilisation rates and levels of IHD are plotted on a chart, it is striking that countries below the trend line all pay physicians on a salary basis – and all are tax-financed countries. Stroke Treatment Stroke patients are usually treated in a hospital setting, but there is considerable variation in hospitalisation rates between countries. The highest rates are seen in Scandinavian countries including Denmark, while the lowest are seen in the UK and the Netherlands.92 A number of studies have shown that treatment in specialist stroke units increases survival and reduces subsequent disability. Although the definition of ‘specialist units’ is not fixed, they are likely to include multidisciplinary dedicated staffing, access to appropriate technology, and both acute and rehabilitation care.93 Stroke units are being created in many advanced countries but at very different rates. In their study Moon et al, found 0.15 stroke units per 100,000 in Hungary, and 0.93 in Denmark. As one might expect, the percentage of stroke patients receiving care in specialist units varied from 15 per cent in Hungary, to 70 per cent in Sweden. The researchers consider why there is a varying prevalence of stroke units, given the strong evidence of their effectiveness. They suggest three reasons. Firstly, that definitions are problematic, and therefore countries may be under-estimating how many they have. Secondly, the use of units is evolving. After a slow start, they are now taking root – especially in Scandinavian countries. Thirdly, they ask whether the requirement for an evidence base prior to establishment of a treatment in the UK
27

has delayed the take-up of specialist stroke units. However, the benefit of such units was first established in the 1970s. In 1999, 45 per cent of UK trusts had stroke units, but only 26 per cent of patients received care in a stroke unit.94 Interestingly, the OECD ARD team, note that the adoption and use of stroke units occurred earlier and faster in countries with more ‘integrated’ hospital delivery models, such as the Scandinavian countries – which tend to have integrated models for all, rather than only public, hospitals.95 CT and MRI scanners play a central role in treatment of stroke, allowing doctors to produce a ‘picture’ of what may be going wrong in the brain (see Table 9). CT scanners are notably less available in Canada (8.2), Hungary (5.4) and the UK (3.6), than in the US, Switzerland and Germany (13.6, 18.5, 17.1 respectively). MRI scanners are most available in countries with high per capita income such as the US and Switzerland. But countries with lower incomes have more MRI scanners (Japan - 23.3, and Sweden – 7.9), while high earning Canada and the UK have a very low number of MRIs per capita (2.5 and 3.9 respectively), only just outnumbering MRI supply in former Communist countries of Central and Eastern Europe.96 6. CONCLUSIONS For some time, medical outcomes in the UK have been poor compared with countries of similar wealth. It is not easy to disentangle the impact of lifestyle choices and environmental influences on death rates from the impact of medical systems as such, but it has been done. A good indicator is the survival rate of cancer victims after the diagnosis has been made. The incidence will be affected by personal decisions about smoking and diet but once diagnosis has taken place, the performance of the medical system can make a large difference. Similarly, the frequency of use of tried and tested technologies reflects the capacity and performance of the system rather than the underlying causes of disease. For instance, the frequency of use of revascularisation in IHD cases, specialist units for stroke patients, and the availability of screening and radiotherapy equipment for breast cancer patients, appears to be unrelated to clinical need. The most recent evidence from the OECD, covering stroke, heart disease and breast cancer, reveals how badly the NHS compares with other OECD countries. Breast cancer: Of the eight countries studied England had the lowest five-year survival rate. For patients aged 80 or more there was a huge gap in the survival rate (53 per cent compared with the next worst country, Canada with 68 per cent.) This suggests that older women in England are being written off because ‘they’ve had a good innings’. The OECD links the UK’s poor performance to rationing – or what it politely calls ‘supply side constraints’. In one of its charts it correlates the five-year survival rate with the availability of the mammography machines used for breast-cancer screening. There are few machines compared with other OECD countries and outcomes are bad. Similarly, it compares five-year survival with the availability of radiotherapy machines, used to treat cancer. The UK has fewer machines than other countries and a worse survival rate. As the report says, the UK ‘clearly stands out’, a conclusion suggesting that inadequate staff and facilities have caused the poor survival rate.97 The OECD also compares death rates within six months of diagnosis. Again the UK has a higher rate of death within six months suggesting that cancers are more advanced when detected. This is likely to be because of the inadequate number of staff and the shortage of equipment for early detection. This means that the NHS fails to do one of the
28

most important things a highly centralised system ought to be capable of: organising a system of universal screening to ensure early detection. Ischaemic Heart Disease: The OECD has tried to assess the impact of supply-side constraints on death from IHD. It found significant variations in the number of cardiac specialists per 100,000 population and that the variations were unrelated to medical need. Britain was among the countries with the greatest rationing. The others were Canada, Denmark, and Norway. It found that countries with social insurance schemes were more likely to have the resources necessary to meet medical need. Belgium, Germany and Switzerland placed only weak limits on the number of specialists.98 One of the main surgical treatments for IHD is cardiac revascularisation, including coronary artery bypass grafts (CABG or ‘cabbages’ in medical slang) and percutaneous transluminal coronary angioplasty (PTCA). These operations were carried out at a high rate in the USA, Germany and Australia and at a low rate in Britain, Hungary and Italy. However, the high rate is expected in the USA, Germany and Australia because they have a high level of disease. Italy has less heart disease but Hungary and Britain have a high amount of IHD, suggesting a significant failure to meet medical need. In the USA 58 per cent were treated, in Australia 39 per cent, in Sweden 27 per cent, in Spain 16 per cent and in the UK only a derisory eight per cent. By comparing the rate of death from IHD with the treatment rate the OECD allows us to assess the impact of rationing. The countries with mainly tax-funded systems, Italy, Spain, Britain and Denmark were ‘well below’ the trendline.99 Stroke: The OECD compares the size of the specialist workforce (neurologists) in each country. Hungary and the UK had by far the lowest number (0.4 per 100,000 population). Denmark had 4.6.100 A good indicator of performance is the number of patients who die within 7 days of diagnosis. The UK stood out for its poor performance. About nine per cent of those aged 4-64 were dead within a week of arriving in hospital. In other countries the figure was around five per cent.101 It also compared death rates after one year in order to reflect the care provided by GPs as well as the hospitals. According to the OECD, the UK falls outside the normal ranges. For example, in the USA 37per cent of stroke victims aged 75 or more were dead within a year, but in the UK it was 57 per cent. The OECD put the eleven countries studied into one of three groups: a low death rate, medium death rate or a high death rate. Only the UK is classified as high.102 One of the main factors influencing the survival rate is the presence of a specialist stroke unit. Information was only available for four countries. In Sweden 70 per cent of stroke patients were cared for in a specialist unit, in Norway 60 per cent, in the UK 26 per cent and in Hungary 15 per cent.103 The NHS clearly scores badly on such measures, but can we say that it is because of the way it is financed and organised? Have some other systems proved better able over time to bring the expectations of individuals into balance with the capacity of providers to treat patients? The evidence is that funding health care from general taxes has proved to be an ineffective way of bringing the expectations of patients into balance with the treatment capacity of the system. The Wanless report put the accumulated under-investment at £267 billion.104 A higher expenditure is found in all the ‘pluralist’ healthcare systems in our study (that is those funding systems which are not ‘national’ or totally financed through taxation). Social insurance provides a separate, transparent system for the flow of funds from the contributors to the third party payer and on to the providers of services.105 The major difference between general taxation and social-insurance funding is that an individual’s
29

contributions can be clearly identified (usually on pay slips). This visibility may increase willingness to pay and enable the insured to arrive at an imperfect but reasoned conclusion about the value for money they are getting. Professors Elias Mossialos and Julian Le Grand of LSE Health, who compared priority setting decision making in the EU, note the important difference between insurance and tax-based systems.106 Germany and the Netherlands involve several stakeholders, which can veto decisions because they are not beholden to the government.107 This, alongside typically greater choice of provider, may go some way to explaining why satisfaction rates are generally higher in social insurance countries – only Denmark and Finland buck this trend and they are notable for the role of local rather than exclusively national taxation.108 Independence from government is important because it allows the separation of healthcare finance from other government spending, thus permitting spending levels to rise according to demand. Social insurance systems have tended to lead to higher spending than tax-based systems.109 In the UK, however, the Treasury is the third party payer and has interests of its own which do not coincide with those of healthcare consumers. Instead the Treasury takes into account wider economic and essentially political considerations.110 While it is well established in the academic literature that an individual’s genetic makeup, lifestyle choices, and environmental factors have most influence over health status, there is evidence that public insurance-based systems, which by their nature allow greater expenditure, tend to produce better outcomes than tax-based systems. They also tend to reward better performance by doctors. So although we cannot draw firm conclusions about the optimal design of a health care system, it is evident that medical outcomes in the UK are comparatively poor and that its sub-standard care is the result of over-centralisation. The case for an insurance-based system of some type deserves a more serious hearing than the British Government has so far given it.
30

Glossary/ Acronym Buster
AMI Acute myocardial infarction CABG Coronary artery bypass grafting - a type of heart disease operation. CHD Coronary Heart Disease (or Ischaemic Heart Disease IHD) chronic
disease where there is hardening (atherosclerosis) of arteries on the surface of the heart and is the leading cause of heart attacks
Community rating: The opposite of risk rating, community rating means that all members of an insurance pool pay the same premium regardless of individual risk. Thus, risk is pooled across the whole community. In Switzerland, everyone insured with a given insurer in a given geographical area, pays the same amount – a ‘flat-rate’.
Co-payment: See user charges. Core package: The phrase core package is used to denote a bundle of medical benefits
that are usually deemed medically necessary and that would be guaranteed by the government.
Gatekeeping: A system whereby access to specialist and or hospital care is controlled by GPs or ‘family’ doctors. Such a system has two main aims: cost control and guidance to appropriate care providers.
Group rating: Common in the US, group rating is related to community rating and means risk is pooled across, for example, the whole staff of a company or membership of a trade union.
Income related premiums: Common in social insurance systems, and usually referring to earned
income, premiums are expressed as a percentage of income rather than as a fixed monetary amount. For example in Germany premiums average c. 13.5, paid 50/50 by employer and employee. See ‘proportional’.
Asymmetry of Information: The situation when parties to a transaction (for example, doctor and
patient), have different amounts of relevant information.
Infant mortality The number of deaths of children under one year of age expressed per 1,000 live births.
IHD Ischaemic Heart Disease (or coronary heart disease – CHD) chronic disease where there is hardening (atherosclerosis) of arteries on the surface of the heart and is the leading cause of heart attacks
MOOZ The Dutch Health Insurance Funds Act (1986). This scheme compensates the ZFW scheme, which insures a disproportionately high number of the elderly.
Open enrolment Under open enrolment, the insured are able to leave one insurer and to join another. Certain time restrictions usually apply.
Obligation to contract: Insurers must accept all applicants. Payroll taxes: The term used to describe mandatory social insurance contributions that
apply to employer and employee. PTCA Percutaneous transluminal coronary angioplasty - a type of heart disease
operation whereby a catheter is inserted into the arterial system and a balloon inflated to clear the obstructed area.
31

Premature mortality: Measure by PYLL under age 70. For example, a death at 5 years of age is counted as 65 years of PYLL. The indicator is expressed per 100 000 females and males. The main causes of PM are cancers, circulatory diseases and external causes.
Progressive: In a progressive system, the rich pay a larger fraction of their income than the poor. Opposite of regressive.
Proportional: System such as that in France where premiums are expressed as a proportion of income and are not subject to a contribution ceiling.
PYLL: Potential Years of Life Lost (PYLL) is a summary measure of premature mortality which provides an explicit way of weighting deaths occurring at younger ages, which are, a priori, preventable. The calculation for PYLL involve adding up deaths occurring at each age and multiplying this with the number of remaining years to live until a selected age limit. The limit of 70 years has been chosen for the calculations in OECD Health Data. In order to assure cross- country and trend comparison, the PYLL are standardised, for each country and each year. The PYLL per 100 000 population are calculated by the OECD Secretariat based on age-specific death statistics provided by the World Health Organisation. The total OECD population in 1980 is taken as the reference population for age standardisation.
Regressive: Term used in relation to funding mechanisms to describe a system that
weighs more heavily on the poor than the rich. That is, the poor pay proportionately more of their income on health care than do the rich. (See ‘proportional’, ‘progressive’, and ‘user charges’).
Risk Adjustment Mechanism: In a competitive and regulated insurance market, RAMs are used to
prevent insurers engaging in cream-skimming/risk selection. Age, sex, and geographical location are generally used in the adjustment formula. There is a continuing debate about how to improve the performance of the RAM formula. Previous medical expenditure or death are often suggested.
Risk rating: The calculation of insurance premiums according to the risk profile of an individual – taking into account, age, gender, medical conditions and so forth.
Social insurance: First introduced by Bismarck in the 1880s, social insurance is a social security system model under which insurance funds may be independent from government. Professor Charles Normand of LSHTM and Reinhard Busse of the European Observatory on Health Care Systems, note that social health insurance has two crucial characteristics. Firstly, the insured pay regular, usually wage-based (i.e not related to risk) contributions. Secondly, independent quasi-public bodies act as the main managers of the system and as third party payer. Beyond those two characteristics, several other features are commonly found in social health insurance systems.111
TEH: Total Expenditure on Health Third party payer: A public or private body that receives taxes or social insurance
contributions and transfers them to healthcare providers. The patient is the first party payer while providers are the second party payers.
32

User charges Otherwise known as cost sharing or out-of-pocket payments. These payments are highly regressive, and are usually designed to regulate the behaviour of patients. Rubin and Mendelson, distinguish between direct cost-sharing and indirect cost-sharing). Direct cost-sharing includes co-payment (a flat fee or charge per services), co-insurance (a percentage of the total charge), deductible (a payment covering the first X currency units before insurance coverage applies) and balance billing (an additional fee the provider levies in addition to the payment received from the third party payer). Indirect cost-sharing refers to policies that can result in out-of-pocket payment by patients even though charges are not directly imposed. Rubin and Mendelson include excluded treatments, generic substitution and positive/negative lists in this category.112
VHI Voluntary Health Insurance. Private health insurance terminology is not standardised. This can cause much confusion when discussing the various forms of VHI. Mossialos and Thomson use the following definitions. Substitutive VHI substitutes for cover that would otherwise be available from the state (e.g. Germany, Belgium and the Netherlands). Complementary VHI provides cover for services excluded or not fully covered by the state, including cover for co-payments imposed by the statutory health system (e.g. France). Supplementary VHI cover provides faster access and increased consumer choice.113 Though convenient distinctions, there are often grey areas and overlaps between forms of VHI. For this reason, we use only two terms: substitutive VHI, and supplementary VHI.
WTZ Wet op de Toegang tot Ziektekostenverzekeringen. Dutch scheme to ensure that those excluded from ZFW insurance are able to purchase a similar level of substitutive cover.
ZFW Ziekenfondswet. The social insurance element of the so-called second compartment of the Dutch health insurance system. It applies to acute medical care and is mandatory for those earning below an income threshold.
33

Bibliography / References Arnett, G-M., ‘A Profile of the U.S. health sector’, Lecture given to the UK Health Policy Reform Group, London, autumn 2001. Arrow, K., ‘Uncertainty and the welfare economics of medical care’, The American Economic Review, Vol 53, No. 5, 1963. Bailey, C., ‘Health care in the Netherlands,’ Unpublished report commissioned by Civitas, 2002. Berrino, F., Capocaccia, R., Esteve, J., Gatta, G., Hakulinen, T., Micheli, A., Sant, M., and Verdecchia, A., (eds) Survival of Cancer patients in Europe: the EUROCARE-2 Study, IARC Scientific Publications, No. 151, World Health Organisation, International Agency for Research on Cancer, European Commission, Lyon, 1999. Bodenheimer, T. and Grumbach, K., ‘Financing universal health insurance: taxes, premiums and the lessons of social insurance’, Journal of Health Politics, Policy and Law, Vol. 17, No. 3, 1992, pp. 439-462. Busse, R., Health Care Systems in Transition, Germany, European Observatory on Health Care Systems, 2000. Caminada K. and Goudswaard K., International Trends in Income Inequality and Social Policy, Paper presented to International Social Security Association’s Year 2000 International Research Conference on Social Security, Helsinki, 25-27 September 2000. Coebergh, J.W.W., Sant, M., Berrino, F., and Verdecchia, A., and the EUROCARE Working Group., ‘Survival of Adult Cancer Patients in Europe diagnosed from 1978-1989: The EUROCARE II Study’, European Journal of Cancer, Vol, 14, No. 14, 1998. Damhuis, R.A.M., Kirkels, W.J. and the EUROCARE Working Group, ‘Improvement in survival of patients with cancer of the kidney in Europe’, European Journal of Cancer, Vol. 14, No. 14, 1998, pp. 2233-2235. Dobson, R., ‘Proportion of spending on care for older people falls’, British Medical Journal, 2002, pp. 325-355. Domenighetti, G., Quaglia, J., ‘Comparaisons internationales’, in Kocher, G., and Oggier W., Système de santé Suisse 2001/2002, Concordat des assureurs-maladie, 2001. Faivre, J., Forman, D., Obradovic, M., Sant, M., and the EUROCARE Working Group, ‘Survival of patients with primary liver cancer, pancreatic cancer and biliary tract cancer in Europe’, European Journal of Cancer, Vol. 14, No. 14, 1998, pp. 2184-2190. Freeman, R., ‘The Politics of health in Europe’, European Policy Research Unit Series, Manchester: Manchester University Press, 2000. Gaal, P., ‘The Hungarian health care system’, unpublished report commissioned by Civitas, 2002.
34
Gatta, G., Faivre, J., Capocaccia, R., Ponz de Leon, M., and the EUROCARE Working Group, ‘Survival of colorectal cancer patients in Europe during the period 1978-1989’, European Journal of Cancer, Vol. 14, No. 14, 1998, pp. 2177-2183. Green, D. and Irvine, B., Health Care in France and Germany, London: Civitas, 2001. ‘Health Insurance in the Netherlands’, International Publication Series Health, Welfare, and Sport, nr 1E, The Hague, Ministry of Health, 2000. HPCG, Options for Funding, London: Health Policy Consensus Group, 2002. Hurst, J., ‘Challenges for health systems in Member Countries of the Organisation for Economic Co-operation and Development’, Bulletin of the World Health Organisation, Vol. 78, No. 6, 2000. Hurst, J. and Lafortune, G., Health At a Glance, OECD Health Policy Unit, Paris: OECD, 2001. Irvine, B., ‘The Swiss healthcare system’, unpublished draft report commissioned by Civitas, 2002. Irvine, B., Swiss Health Care: Lessons for the UK, London: Civitas, 2001 Jakubowski, E., Health Care Systems in the EU: A Comparative Study, SACO 101/rev. EN, Luxembourg: European Parliament, Directorate General for Research, May 1998. Jacobs, R. and Goddard, M., Social Health Insurance Systems in European Countries, York, University of York Centre for Health Economics, 2000. Jacobzone, S., Jee-Hughes, M,, and Moise, P., Medical and Epidemiological Background, Technical Report, OECD Ageing Related Disease Study, Paris: OECD, 1999. Jacobzone, S., The Interplay of Health Policy, Incentives and Regulations in the Treatment of Ageing-related Diseases, Technical Report, OECD Ageing Related Disease Study, Paris: OECD, 1999. Jacobzone, S. and ARD team, ‘Summary of Results from Breast Cancer Disease Study’, What is Best and at What Cost? OECD Study on Cross-National Differences of Ageing Related Diseases, OECD Working Party on Social Policy, Ageing-Related Diseases, Concluding Workshop, Paris, 20-21 June 2002. Janssen-Heijnen, M.L.G., Gatta, G, Forman, D., Capocaccia, R., Coebergh, J.W.W., and the EUROCARE Working Group, ‘Variation in survival of patients with lung cancer in Europe’, European Journal of Cancer, Vol. 14, No. 14, pp. 2191-2196, 1998. Jee, M. and Or. Z., Health Outcomes in OECD Countries: A Framework of Health Indicators for Outcome-Orientated Policy Making, Labour market and social policy – Occasional Papers, No. 36, Paris: OECD, 1998.
35

Kalisch, D., Aman, T., Buchele, L., Social and Health policies in OECD countries: a survey of current programmes and recent developments, Labour market and social policy – Occasional papers, No. 33, Paris: OECD, 1998. Kaplan, G. A., ‘Inequality in income and mortality in the United States: analysis of mortality and potential pathways,’ British Medical Journal, Vol. 312, 20 April 1996, pp. 999-1003. Kennedy, B.P., Kawachi I., and Prothrow-Stith D., ‘Income distribution and mortality: cross sectional ecological study of the Robin Hood index in the United States’, British Medical Journal, Vol. 312, 20 April 1996, pp. 1004-1007. Kocher, G., and Oggier W., Système de santé Suisse 2001/2002, Concordat des assureurs-maladie, 2001. Koen, V., Public Expenditure Reform: The Health Care Sector in the United Kingdom, Economics Department Working Papers, No. 256, Paris: OECD, 2000. Marree, J. and Groenewegen, P., Back to Bismarck: Eastern European Health Care Systems in Transition, Avebury,1997. Minder, A., Schoenholzer, H., and Amiet, M., Health Care Systems in Transition, Switzerland, European Observatory on Health Care Systems, 2000. Moise, P. and ARD team, ‘Summary of Results from Ischaemic Heart Disease Study’, What is Best and at What Cost? OECD Study on Cross-National Differences of Ageing Related Diseases, OECD Working Party on Social Policy, Ageing-Related Diseases, Concluding Workshop, Paris, 20-21 June 2002. Mossialos, E., Dixon A., Figueras, J., and Kutzin, J. (eds.), Funding Health Care: Options for Europe, European Observatory on Health Care Systems, Buckingham: Open University Press, 2002. Mossialos, E. and Le Grand, J., Health Care and Cost Containment in the European Union, Aldershot, Ashgate Press, 1999. Mossialos, E., Citizens and Health Systems: Main Results from Eurobarometer 49 Survey, Brussels: European commission, Directorate-General for Employment, Industrial Relations and Social Affairs, 1998. Mossialos, E. and Thomson, S., Voluntary Health Insurance in the European Union, European Observatory on Health Care Systems and LSE Health, 2002. Normand, C. and Busse, R., ‘Social health insurance financing’, in Mossialos, E., Dixon A., Fugueras, J., and Kutzin, J. (eds.), Funding Health Care: Options for Europe, European Observatory on Health Care Systems, Buckingham: Open University Press, 2002. OECD, The Reform of Health Care Systems: A Review of Seventeen OECD Health Care Systems, Paris, 1994.
36

OECD, OECD Health at a Glance – How Canada Compares, Policy brief, OECD Observer, Paris, October 2001. OECD, Health Data: A Comparative Analysis of 33 Countries, Paris: OECD and CREDES, 2002. OECD, ARD Team, ‘Summary of Stroke Disease Study’ (Draft), What is Best and at What Cost? OECD Study on Cross-National Differences of Ageing Related Diseases, DEELSA/ELSWP1/ARD(2002)4. OECD Working Party on Social Policy, Ageing-Related Diseases, Concluding Workshop, Paris, 20-21 June 2002. Okma, K.G.H., ‘Health Care, Health Policies and Health Care Reforms in the Netherlands’, International Publication Series Health, Welfare, and Sport, No. 7, 2001. Or, Z., ‘Out-performing or Under-performing: An analysis of health outcomes in France and other OECD countries’, Health and System Science, Vol. 1,1997, pp. 321-344. Or, Z., Exploring the Effects of Health Care on Mortality Across OECD Countries. Labour market and social policy – Occasional Papers, No. 46, Paris: OECD, 2000. Or, Z., ‘Determinants of health outcomes in industrialised countries: a pooled cross-country, time-series analysis’, OECD Economic Studies, Vol. 2000/1, No. 30, 2000A. Paton, C., The Impact of Market Forces on Health Systems, Dublin: European Health Management Association, 2000. Petersen, S., Rayner, M., and Press, V., Coronary Heart Disease Statistics 2000, London, British Heart Foundation, 2000. Post, P.N., Damhuis, R.A.M., Van der Meyden, A.P.M., and the EUROCARE Working Group, ‘Variation in survival of patients with prostate cancer in Europe since 1978’, European Journal of Cancer, Vol, 14, No. 14, 1998, pp. 2227-31. Preker, A., Jakob, M., and Schenider, M., ‘Health financing reforms in central and eastern Europe and the former Soviet Union’, in Mossialos, E., and Dixon, A. (eds.), Funding Health Care: Options for Europe, Buckingham: Open University Press, 2002. Quinn, M.J., Martinez-Garcia, C., Berrino, F., and the EUROCARE Working Group, ‘Variation in survival from breast cancer in Europe by age and country, 1978-1989’, European Journal of Cancer, Vol, 14, No. 14, pp. 2204-2211, 1998. Rutstien, D.D. et al, ‘Measuring the quality of medical care: A clinical method’, New England Journal of Medicine, Vol. 294, 1976, pp. 582-588. Seshamani, M., and Gray, A., ‘The impact of ageing on expenditures in the National health Service’, Age and Ageing, Vol. 31, No. 4, 2002, pp. 287-94. Sikora, K., ‘Cancer survival in Britain’, British Medical Journal, 1999, pp. 461-462. ‘Surgery needed: A survey of health care’, The Economist, 6-12 July 1991.
37

The Royal College of General Practitioners, The European Study of Referrals from Primary to Secondary Care, Occasional Paper, No. 56, Report to the Concerted Action Committee of Health Services Research for the European Community, London: Royal College of General Practitioners, 1992. The Netherlands in a European Perspective, Social and Cultural Report 2000, The Hague: Social and Cultural Planning Office, 2001. Thomson, S., ‘The Danish health care system’, Unpublished report commissioned by Civitas, 2002. Turner, G-M., ‘The funding and provision of health care in the United States with possible indications for other countries’, Unpublished report commissioned by Civitas, 2002. Vallgarda, S., ‘The Danish health care system: A commentary’, Euro Observer, Vol. 4, No. 2, European Observatory on Health Care Systems, 2002. Wagstaff, A., Van Doorslaer, E., ‘Equity in the delivery of health care: Methods and findings’, in Wagstaff, A., Van Doorslaer, E., and Rutten, F., Equity in the Finance and Delivery of Health Care: An International Perspective, Oxford: Oxford University Press, 1993. Wagstaff, A., Van Doorslear, E. et al, ‘Equity in the finance of health care: some further international comparisons’, Journal of Health Economics, Vol. 18, 1999, pp. 263-290. Wanless, D., Securing our Future Health: Taking a Long-Term View, Final Report, London: Her Majesty’s Treasury, 2002. World Health Organisation, World Health Report 2000, Geneva, World Health Organisation, 2000. World Health Organisation, Highlights on Health in Hungary, Copenhagen, World Health Organisation Regional Office for Europe, December 2000a. World Health Organisation, Highlights on Health in The Netherlands, Draft, Copenhagen, World Health Organisation Regional Office for Europe, July 1997. World Health Organisation, Highlights on Health in Switzerland, Copenhagen, World Health Organisation Regional Office for Europe, 2001. World Health Organisation, Highlights on Health in Denmark, Copenhagen, World Health Organisation Regional Office for Europe, 1998. World Health Organisation, Highlights on Health in France, Draft, World Health Organisation Regional Office for Europe, July1997. World Health Organisation, Highlights on Health in Germany, Copenhagen, World Health Organisation Regional Office for Europe, May 1999.
38

39
World Health Organisation, Highlights on Health in The United Kingdom, Draft, Copenhagen, World Health Organisation Regional Office for Europe, 1997. World Health Organisation, European Health For All Database, Copenhagen, World Health Organisation Regional Office for Europe, 2000. Endnotes.
1 Or 2000A and Domenighetti and Quaglia 2001. Domenighetti and Quaglia note that infant mortality is correlated with health expenditure. Certain other simple correlations between expenditure and other indicators can be observed: The higher expenditure, the higher the number of beds per 1000, and the greater the length of stays. These two factors do not necessarily affect medical outcomes. 2 The link between expenditure and outcomes is much more significant for women than for men. (Or 2000A) considers that this difference in impact on health outcomes may be owing to differences in mortality patterns. Male mortality rates seem less sensitive to medical intervention. ‘In most OECD countries, around 30 per cent of the premature mortality for men is a result of “external causes” such as violence, accidents’, while for women, cancer is the leading cause of death, accounting for between 20 and 30 per cent, with “external cause represent only about 16 per cent. Women also benefit from a number of systematic prevention programmes such as screening for cancer (Or 2000A). 3 In their study of 2001, Domenighetti and Quaglia found the best performing country to be Sweden, which with expenditure of $1701 per capita, and reveals the best group of indicators – at the top of the scale. The worst performing country from health perspective was found to be the UK – which has a group of indicators at the bottom of the scale. 4 Perhaps observing the diminishing returns, and outlying performers (such as Sweden and the US, the latter was not included in their study), Domenighetti and Quaglia find that avoidable mortality, owing to medical intervention (with or without the inclusion of CHD), is not correlated with health expenditure. 5 Grubaugh and Santerre (1994) 6 Domenighetti and Quaglia 2001, and Or 2000. 7 OECD, ARD team, (2002), ‘Summary of Stroke Disease Study’, DEELSA/ELSWP1/ARD(2002)4. 8 Moise and ARD team, (2002). 9 Mossialos, E, (Eurobarometer Survey 1996 and subsequent 1998 study). And Jacobzone, S The interplay of health poilcy, incentives and regulation in the treatment of ageing related diseases. OECD Ageing Related Disease Study, Technical Report, 1999. And Domenighetti and Quaglia 2001. 10 OECD, 2002. 11 Dobson, R. Proportion of spending on care for older people falls, BMJ 2002; 325:355 (17 August). 12 Seshamani, and Gray, Age and Ageing, 2002, 31 (4): 287-94. 13 Comparing systems is notoriously controversial, some thinking it an important source of inspiration, while others consider the exercise a complete waste of time. Marmor T, is famously in the latter camp. It is generally accepted that healthcare arrangements in one country cannot be transplanted into another owing to historical cultural and political differences. 14 OECD researcher Zeynep Or (2000), notes that ‘The split between the public and private financing of health services may influence access to, and use of, medical resources by different social groups’. Or (2000A), found evidence of a positive impact of public funding on overall mortality and morbidity rates. 15 For example, private finance might include private insurance (which itself might be substitutive, supplementary or complementary), and various user charges. Tax may be direct or indirect and may be hypothecated or paid into a general pool. Social insurance may be levied in different ways. See the glossary for further details. 16 Moise et al, 2002 17 Or, 2000A summarises the findings of these studies. 18 Or, 2000A 19 Or, 1997 20 Such comparisons merit a cautionary note, as PPP measurement is subject to limitations (OECD, 2002). 21 See World Bank Classifications (http://www.worldbank.org/data/countryclass/classgroups.htm) 22 For details of this transition, see Marree and Groenewegen, 1997; and Preker, Jakob and Schenider, 2002. 23 Hurst 2000 24 Hurst, 2000; OECD, 2002

40
25 Hurst, 2000 26 OECD members countries included in this average: Australia, Austria, Belgium, Canada, Czech Republic, Denmark, Finland, France, Germany, Greece, Hungary, Iceland, Italy, Japan, Luxembourg, New Zealand, Norway, Poland, Portugal, Spain, Sweden, Switzerland, Turkey, United Kingdom, United States. Korea, Mexico, Ireland, Slovakia are omitted. 27 Hurst, 2000 28 Hurst, 2000 29 Thomson 2002 30 ‘Regional studies in several OECD countries have indicated a direct relationship between income inequality and mortality, even after controlling for major risk factors such as alcohol and tobacco consumption (Or, 2000A – citing Marmot et al., 1984; Helmert and Shea, 1994; Kennedy et al., 1996; Kaplan et al., 1996). The rise in the employment share of white-collar workers (used as a proxy for educational and social status), played the greatest role in the reduction of premature mortality in most countries between 1970 and 1992 – more so than increase in income (Or, 2000A). Per capita income was the second most important factor behind health outcome improvements (Or, 2000A). Consumption of tobacco and alcohol (accidents, cirrhosis of liver and digestive cancers). Obesity (leads to diabetes and circulatory diseases). 30 Rubin, R. and Mendelson, D. (1995) A framework for cost sharing policy analysis, in N. Mattison (ed.) Sharing the Costs of health: A Multi-county Perspective. Basle: Pharmaceutical Partners for Better Health. 31 Domenighetti and Quaglia, 2002. 32 Phrase from Hurst, 2000 33 See Or, 2000 – uses PYLL as an indicator of premature mortality, which allows individual causes of death to be disentangled. Doing so may allow better understanding of the ‘causes of variations in premature mortality and…[may] point towards specific areas of intervention’ (Or, 2000). Potential Years of Life Lost provides an explicit way of weighting deaths occurring at younger ages, which are, a priori, preventable. The number of potential years of life lost reveals how many years people up to the age of 70 might have lived had they not died of a particular cause (OECD, 2002). 34 The EUROCARE II Study was a collaborative project of 45 population-based cancer registries in 17 European countries. Patients of all cancer sites diagnosed between 1978 and 1989 were included in the study. The EUROCARE study attempts to analyse and explain variation in survival rates between countries / registries. Comparisons with data from the SEER programme (the US cancer monitoring registry) found that differences were small, except for tumours amenable to early detection. The EUROCARE III findings are due shortly. 35 Jee and Or, 1998 36 Moise et al, 2002 37 Rates of immunisations, of preventive screening for blood pressure, cholesterol and cancers, the percentage of pregnant women receiving prenatal care in the first trimester, and so forth are other potential indicators (Jee and Or, 1999). 38 ARD/OECD, project is lead by Mr Stephane Jacobzone, other staff include Ms Lynelle Moon, Mr, Pierre Moise at the OECD Secretariat and Melissa Hughes of the Dana Farber Cancer Institute, Harvard University, Boston. 39 Hurst, 2000. 40 Gatta, Faivre, et al, 1998. 41 Janice Hopkins reports that cancer mortality in the US may be underrecorded because deaths within a month of surgery for solid tumours are recorded as deaths related to treatment. Researchers estimated the proportion of deaths not attributed to cancer for 19 common solid tumours. Cancer was not recorded as the cause of death for 42% of 1695 colorectal cancer patients, 34% of 525 lung cancer patients, 54% of 265 bladder cancer patients, 24% of ovarian cancer patients, and 75% of prostate cancer patients (Janice Hopkins BMJ 2002; 325: 182). 42 Faivre et al, 1998. 43 The percentage of cases which have been verified histologically is a positive indicator of the validity of diagnosis. The higher the proportion of histological verification, the more confident one can be that a neoplasm existed and that it was primary rather than metastatic. 44 Janssen-Heijnen et al, 1998. 45 Cancer Outcomes monitoring, 1999 Leeds. 46 Janssen-Heijnen et al, 1998. 47 Quinn, et al, 1998 48 Gatta, Lasota, et al, 1998

41
49 Gatta, et al, (1998) note that in countries characterised by relatively poor survival for cervical cancer at the end of the 1970’s, five-year survival increased at a greater rate than the European average; this was particularly evident in England and Scotland. 50 Post et al, 1998. 51 Post et al, 1998. 52 Damhuis and Kirkels, 1998. 53 Damhuis, et al citing Lynch CF, Cohen MB. Urinary system, Cancer 1995, 75, 316-329. 54 Damhuis and Kirkels, 1998. 55 Vallgarda, 2002 56 Source: OECD, ARD Team, 2002 57 Source: OECD, ARD Team, 2002 58 See Petersen, Rayner, Press, 2000. 59 Moise et al, 2002 60 Domenighetti and Quaglia 2001. 61 Moise et al, 2002. 62 Moise et al, 2002. 63 Reducing The Costs Of Poor-Quality health Care Through Responsible Purchasing Leadership, Midwest Business Group on Health, June 11, 2002. 64 BMJ 2002; 325: 183 David Spurgeon reports on Kaiser Family Foundation research which emphasises soaring drug costs in the US. As heavy users of drugs, these costs fall heavily on beneficiaries of US Medicare, who spent an average of ($813 (£513; Euro 806) of their own money on prescription drugs in 2000 and $928 in 2001 and are spending $1051 in 2002. Similar concerns are voiced in Canada, Switzerland (very high prices) and Germany. 65 Or, 2001 66 Or, 2000, Paper, 46, pages 21-23. 67 Hurst and Lafortune (2001) citing Grubaugh and Santerre, 1994; Or, 2000 – no 46. 68 OECD 1994 – cited by Hurst and Lafortune 69 The Royal College of General Practitioners, The European Study of referrals from primary to secondary care, 1992. 70 Hurst, 2000. 71 Source: Berrino, F., EUROCARE II Study, 1999. 72 Sikora, 1999 73 Stephane Jacobzone et al, 2002. 74 Jacobzone et al, 2002. 75 Jacobzone et al, 2002 76 Jacobzone et al, 2002 77 OECD, ARD team, (2002), 78 Jacobzone, et al 2002. Lack of treatment protocols may also serve to explain variations across countries in survival. 79 Jacobzone et al, 2002. 80 Jacobzone, et al 2002 81 Jacobzone et al, 2002 82 Jacobzone et al, 2002 83 Jacobzone et al, 2002 84 OECD, ARD Team, 2002. 85 OECD, ARD Team, 2002. 86 OECD, ARD Team, 2002, citing Mandelblatt et al 2001. 87 Moise et al 2002. 88 Moise et al 2002 89 Moise et al 2002 90 Moise et al 2002 91 Moise et al 2002 92 OECD, ARD Team, 2002. 93 OECD, ARD Team, 2002. 94 OECD, ARD Team, 2002. 95 OECD, ARD Team, 2002. 96 OECD, 2002 97 Jacobzone, et al (2002), p. 12 98 Moise et al (2002), pp. 4-5

42
99 Moise et al (2002), p. 13, Chart 1. 100 OECD, ARD Team, ‘Summary of Stroke Disease Study, OECD, 2002, p. 4. 101 Ibid. p. 11. Figure 5. 102 Ibid. p. 19. 103 Ibid. p. 9. � Wanless, D., Securing our Future Health: Taking a Long-Term View, Final Report. HM Treasury, 2002. 105 Jacobs, R. and Goddard, M. Social Health Insurance Systems in European Countries. University of York Centre for Health Economics, 2000. 106 Mossialos and Le Grand (1999, pp 87-100) 107 Mossialos, E and Le Grand, J, Health Care and Cost Containment in the European Union. Ashgate Press, 1999. 108 Eurobarometer 49, 1998. 109 OECD. OECD, Health Data, 2002. Paris, 2002 110 Or, Z. Summary of Results from Breast Cancer Disease Study. What is best and at What Cost? OECD Study on Cross-National Differences of Ageing related Diseases. OECD Working Party on Social Policy. Ageing-Related Diseases. Concluding Workshop. Held 20 to 21 June, Paris, 2002. 111 For more details see Normand and Busse (2002) 112 Rubin, R. and Mendelson, D. (1995) A framework for cost sharing policy analysis, in N. Mattison (ed.) Sharing the Costs of health: A Multi-county Perspective. Basle: Pharmaceutical Partners for Better Health. 113 Mossialos and Thomson 2002.